
Oct 19th Weekend Report – Following Clues
This weekends report will cover the SPX, NASDAQ, OIL, XOP, USD, GOLD, SILVER, & The MINERS, but as time moves forward, the focus is going to start to lean toward the Precious Metals. We sold our leverage near the top in August and I sold my Miners in September, expecting what I anticipated as a normal and necessary correction. Now another important factor in this sell off is emerging, and that has to do with the ‘time’ that is passing by..
The main focus in this report will be with the Precious metals. Enjoy your weekend report. 🙂
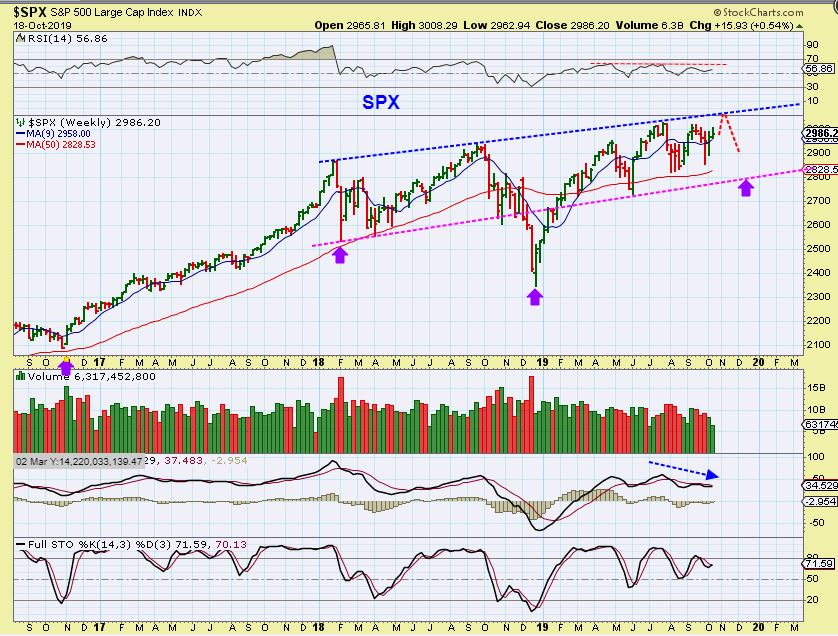
SPX WEEKLY – I was expecting a run to the blue line as resistance, and then maybe this current daily cycle rolls over as shown. That would look like this, but I do want to point out 2 different possible scenarios on the daily chart…
.
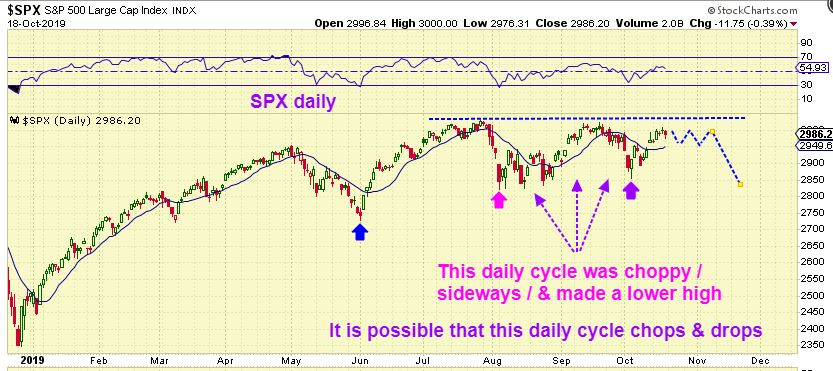
SPX DAILY – Read the chart
– The 1st daily cycle out of the June lows was strong above the 10sma, and tagged that blue line.
– The 2nd daily cycle was very choppy & actually made slightly lower high & dropped. That COULD be concerning, so…
– This is the 3rd daily cycle. There is a chance that it just gets choppy & sideways with an even lower high & drops after the fomc mtg. 2 lower highs would need to be monitored for bearishness, this could lead to a bearish sell off in the 3rd daily cycle…
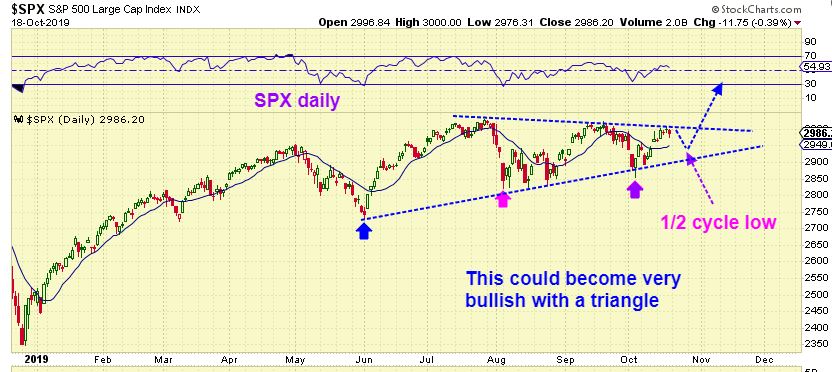
SPX DAILY – Is there a bullish possibility? Yes. Lower lows can form a triangle, and a Fed Cut may stimulate a break out from what would then have us seeing this as a bullish consolidation.
.
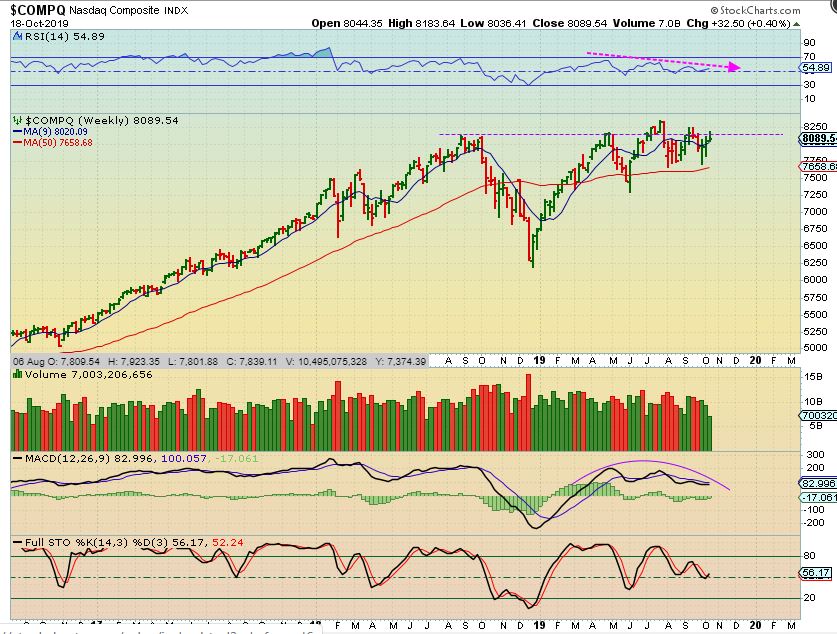
NASDAQ – The Nasdaq is at the highs , but I’m seeing weaker RSI & MACD. This has me thinking that the markets will probably begin the process of dropping into their next ICL after the Fed mtg. STRENGTH between now & then could change that, so companies reporting earnings may be the key.
.
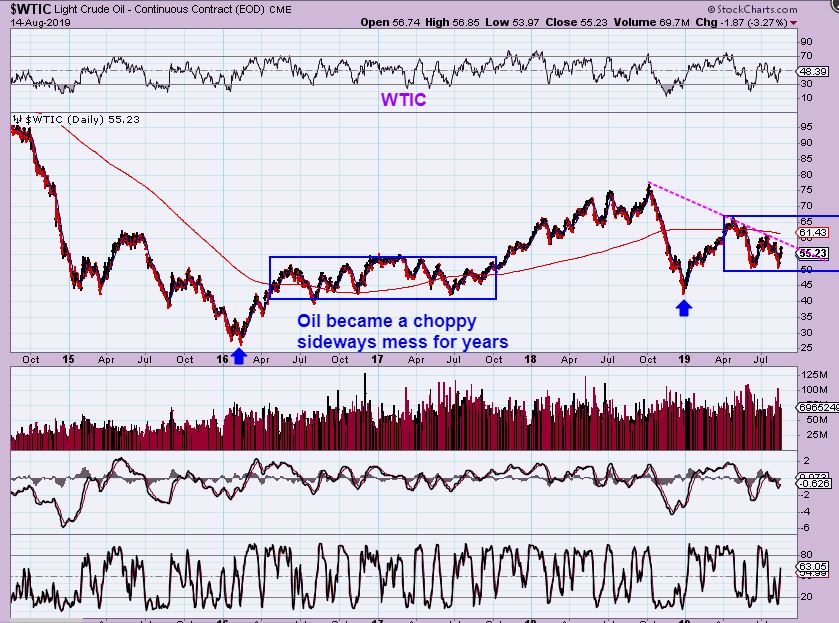
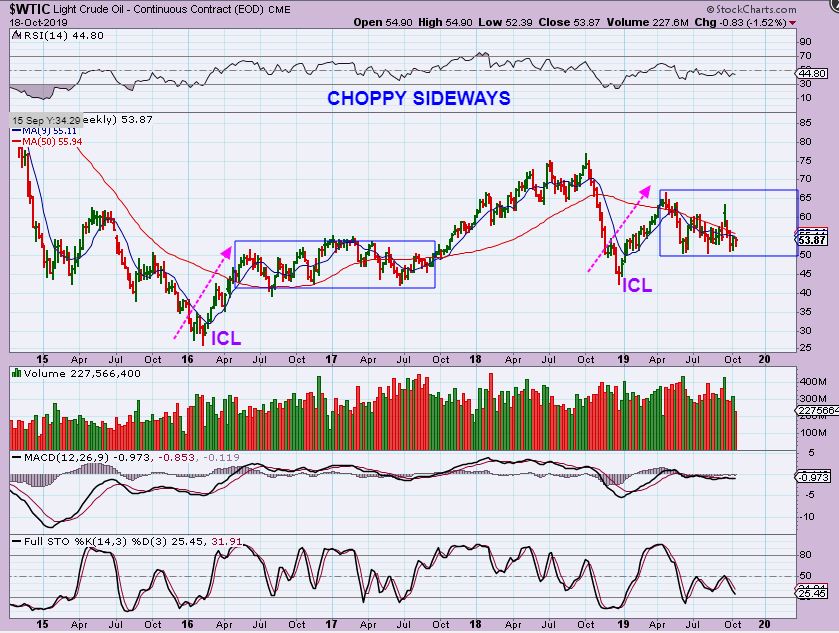
WTIC – Back in August I warned that after a strong run out of the ICL, we may just continue to see a similar sideways chop ( stagnant price) as we saw in 2016-2017 (blue square).
.
WTIC – Oil is following that stagnant course so far, and it has been very difficult & frustrating to trade. I do not have a trade open in this sector currently. That chop lasted for a year and a half in 2017.
.
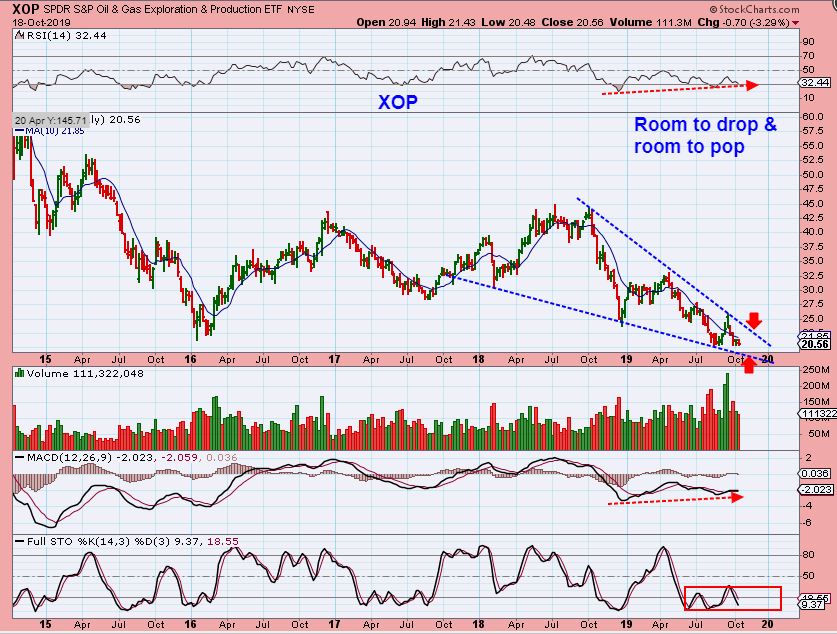
XOP – The XOP is actually not following that sideways chop. Instead Oil & Energy stocks have sold off to deeper lows and are very cheap. I want to watch this descending wedge, because a break higher from here could offer a great buy in this sector. Side note: Some individual Oil/Energy stocks may become leaders and bottom early.
.
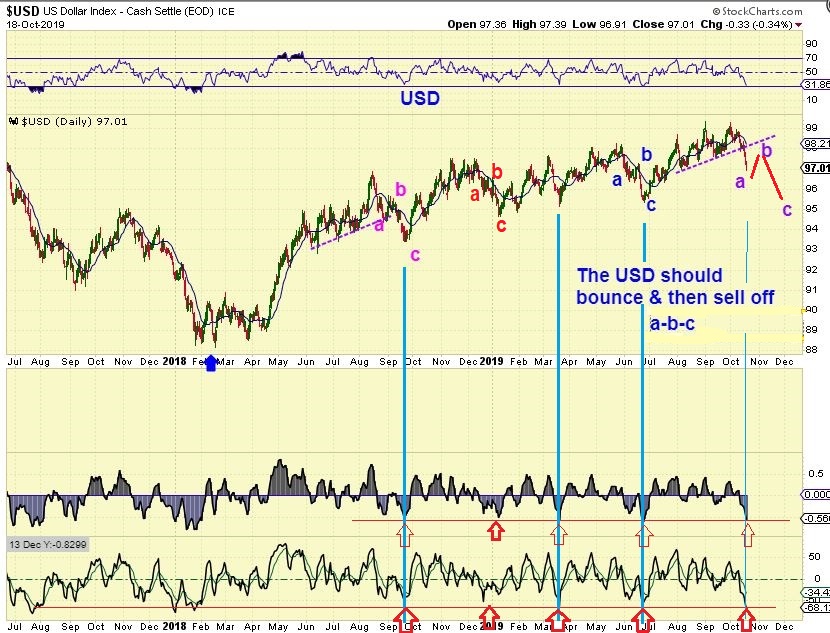
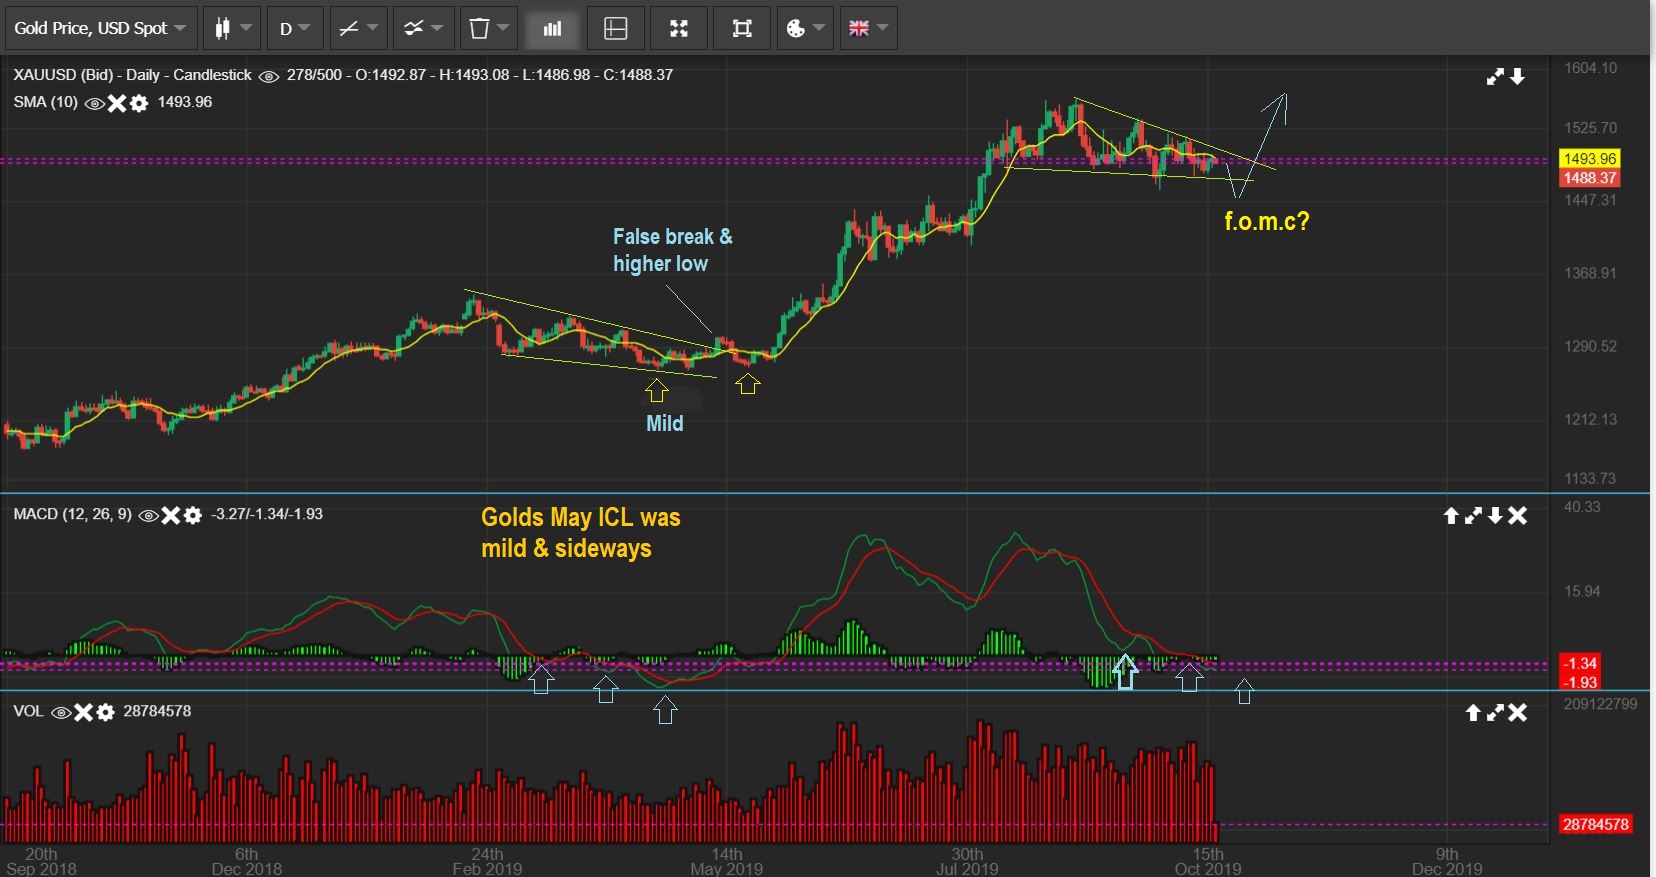
USD – The USD dropped quickly this week, Gold went sideways. It did not break out higher above its trend line.
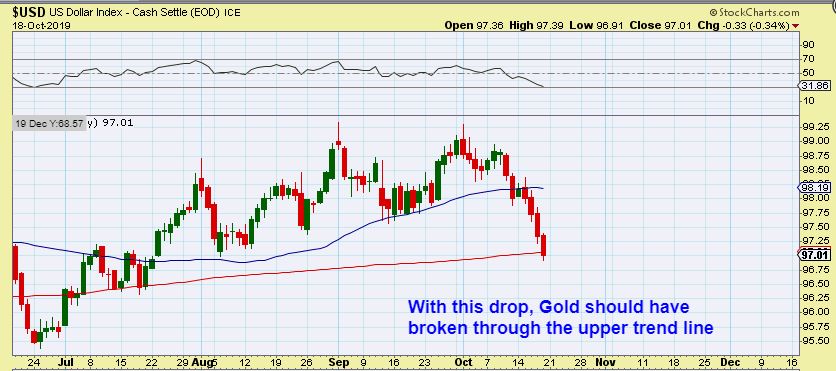
I’m expecting an a-b-c type drop, so when the USD bounces to ‘b’, Gold may finally drop to its dcl.
.
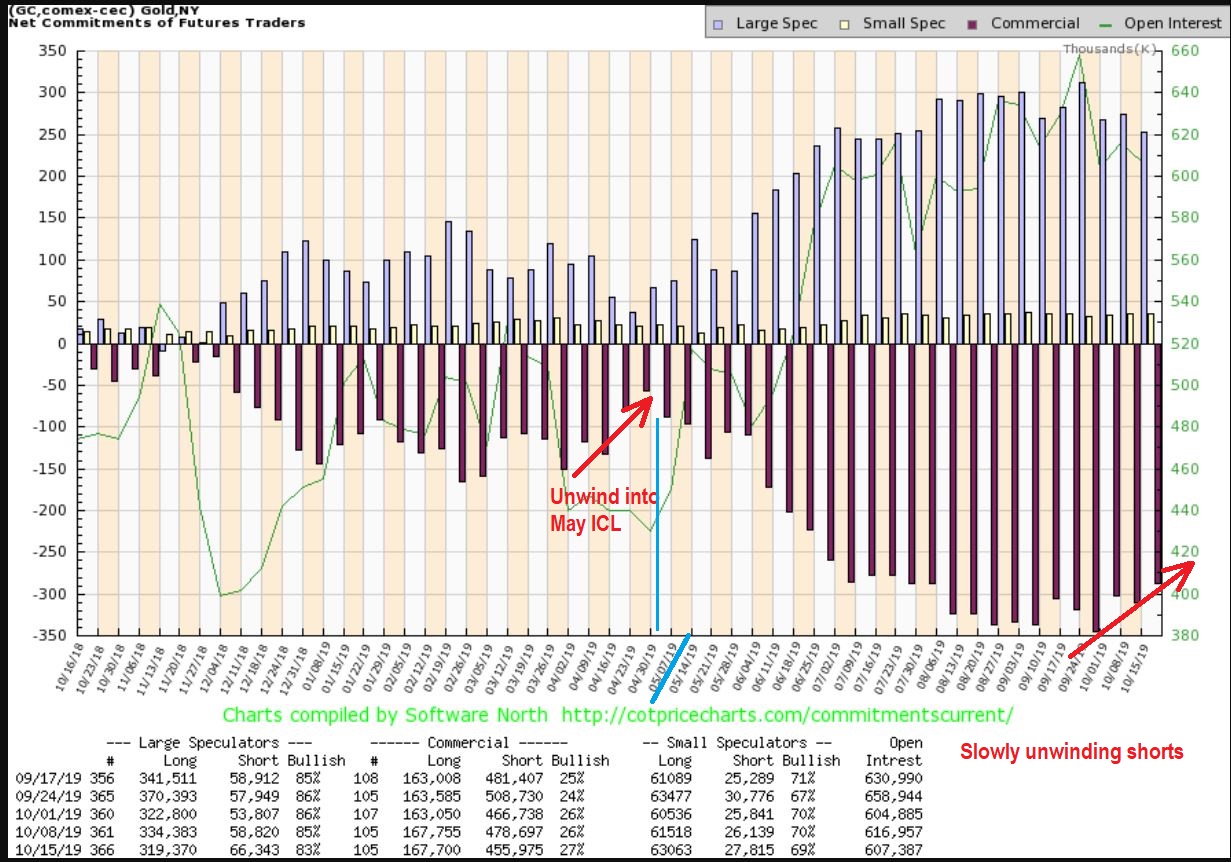
COT – The COT is slowly improving as Smart Money closes some short positions with Golds sell off. I do not expect this to drop deeply during this sell off by Gold, but it should & does show some improvement.
.
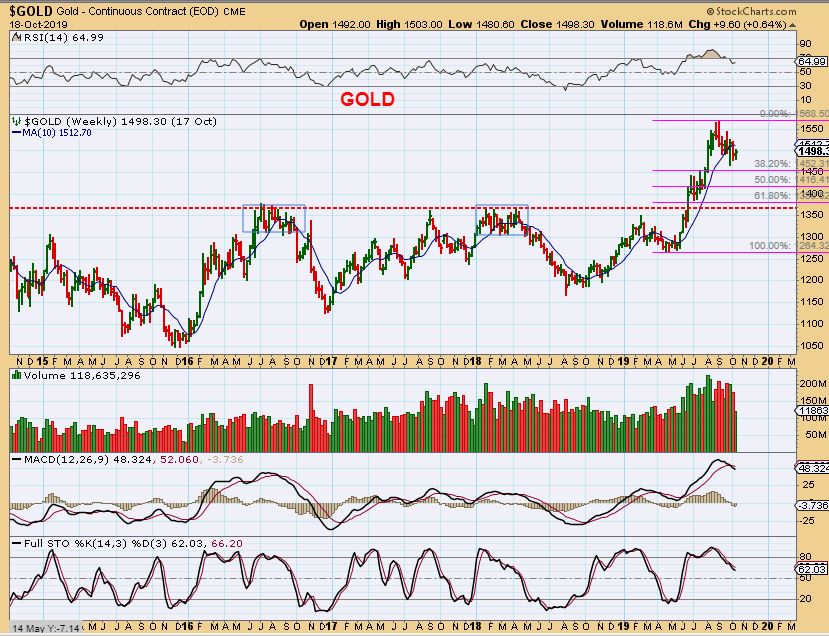
GOLD #1 – Gold has not even dropped 38.2% from the ICL. I am still expecting further downside when the USD bounces, but some Miners may be bottoming first and show strength against the sell off.
.
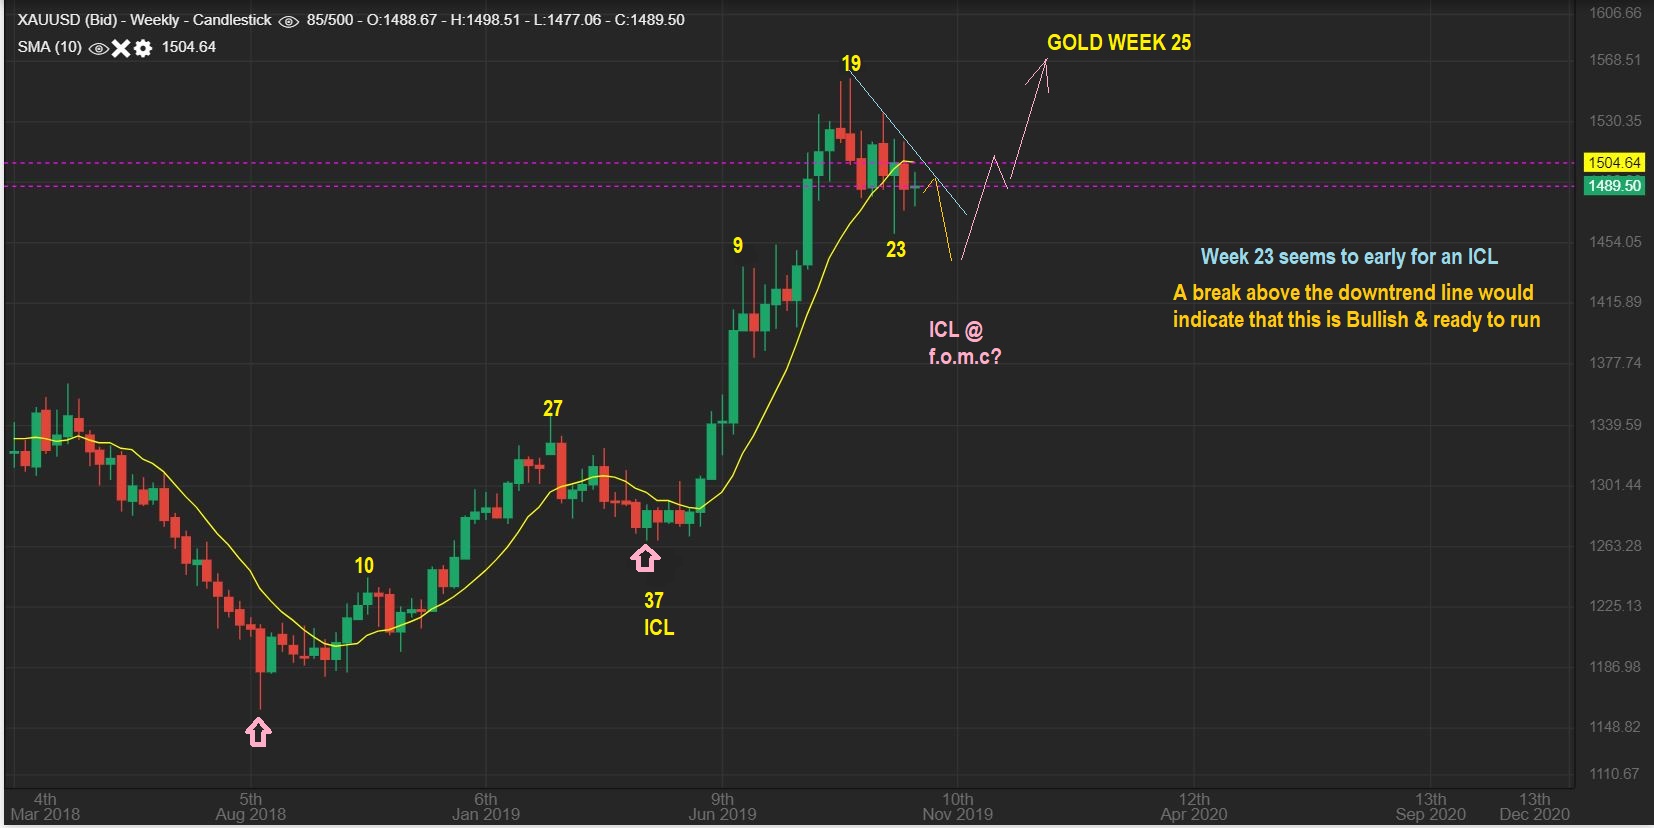
GOLD WEEKLY #2– The last ICL came on week 37 and we are not even close to that now. 6 months is actually an average time period from ICL to ICL, and we are almost 6 months ahead of the MAY 3 ICL ( Nov 3 is 6 months), so we could put an ICL in at any time.
.
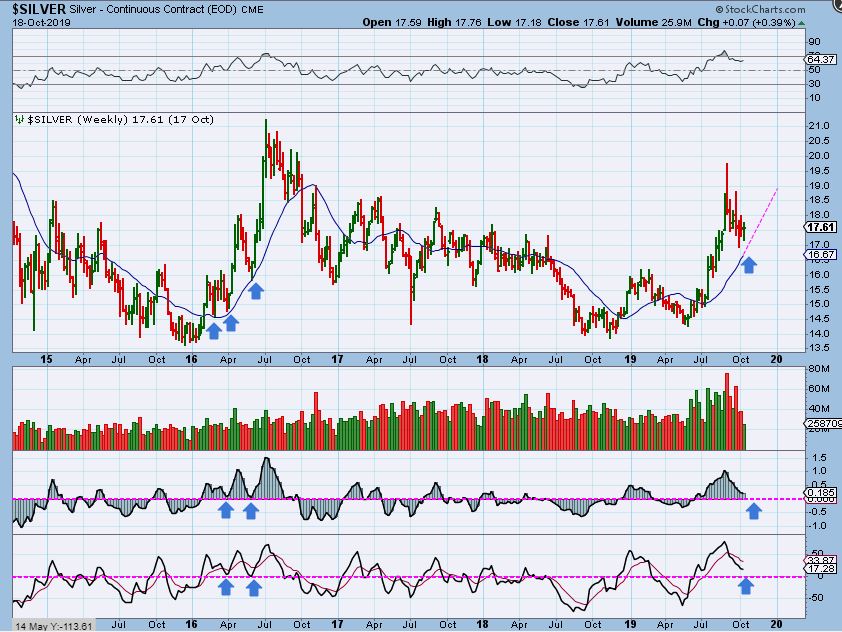
SILVER – Silvers current set up is similar to the May low of 2016. It tagged $17 and we may see a drop there again.
.
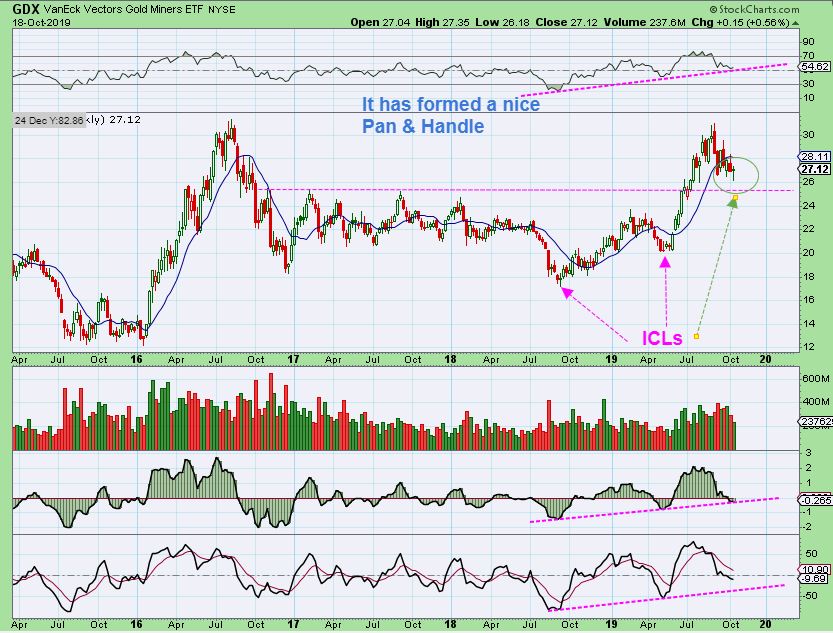
GDX WEEKLY #1 – In Technical Analysis, this is a beautiful Bullish Pan & Handle ( like a cup & handle).
.
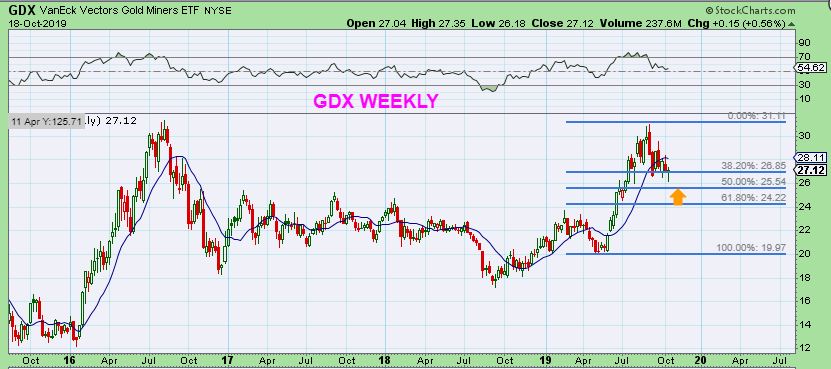
GDX WEEKLY #2 – Last weeks drop turned into a reversal candle and it reversed at the 38% of the entire run from the lows of 2018. Miners made new lows, while Gold made a higher low. So in my opinion, there is a chance that Gold sells down to a new low, while Miners start to hold up a bit more. I have discussed individual Miners that are starting to show signs of strength ( see Fridays report).
.
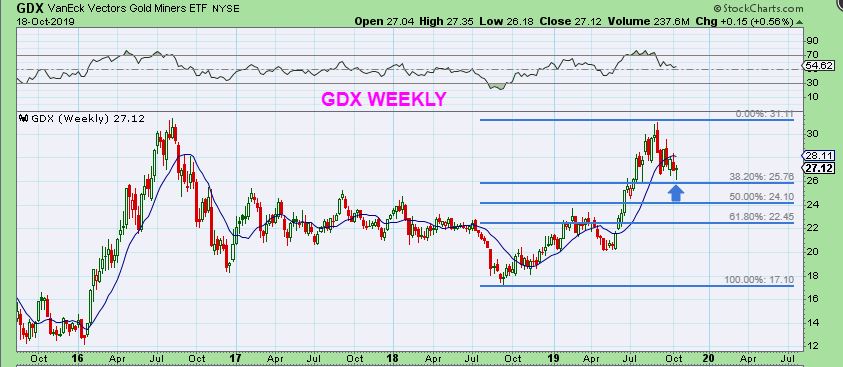
GDX WEEKLY #3 – This is from the May ICL to now. If Gold sells off and Miners join in, the 50 % ( $25.50) is a logical target to watch for a reversal.
GDX WEEKLY #3 – However, did GDX put in a Final Weekly low with this new low and reversal last week, before Gold does next week? Miners do lead in a healthy market & this was about 50% with that wick.
.
This selling, choppiness, and gradual drop in the precious metals is normal and necessary. Look at that GDX chart above. It forms the ‘handle’ that I have actually mentioned Months ago. Riding it real time is always different than looking back at it on a chart, but this kind of chop & selling sets up a great opportunity for the next run higher, and we have expected this pause all along. This sell off ‘handle’ was drawn up in August.
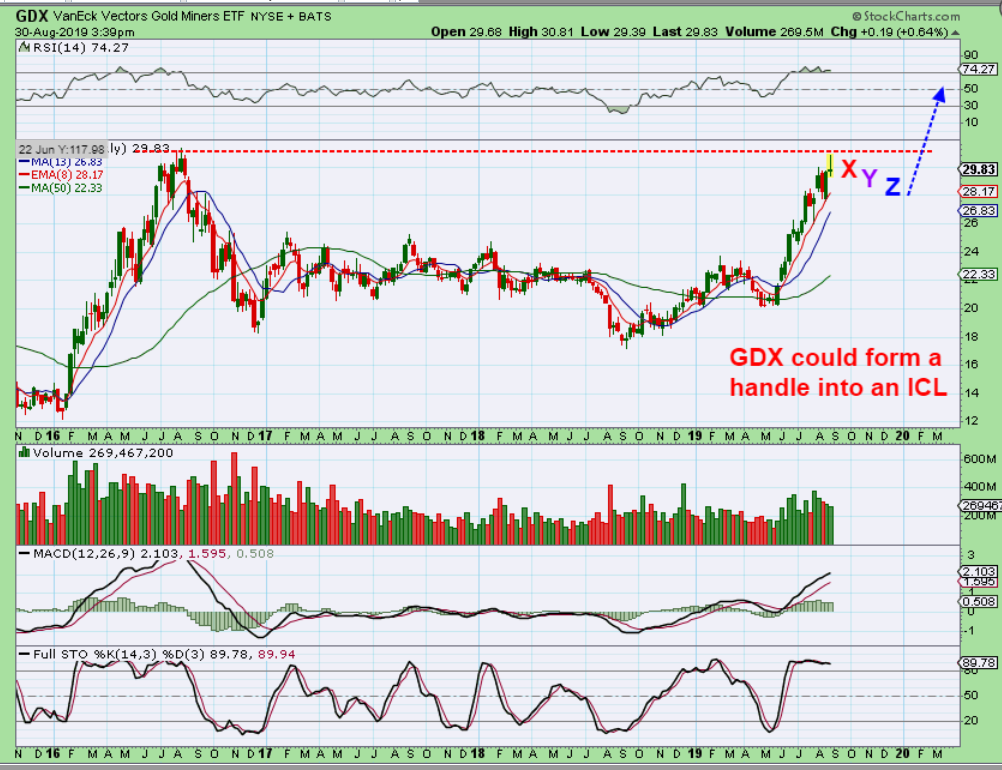
AFTER this selling & choppiness has run its course, we should expect the next great buying opportunity for the next leg higher! We have been expecting that all along too.
.
Way back in JULY I was already discussing how that SMALL PINK BASE in 2016 produced a large run higher from roughly $10 to $30. I said, ‘Imagine the kind of run that will come out of the Big Yellow Base that we are forming?’ Even then I drew it as a pan & handle. The run from that ICL handle could Finally start that multi-month run higher in Miners, where these beaten down stocks double, triple, and more.
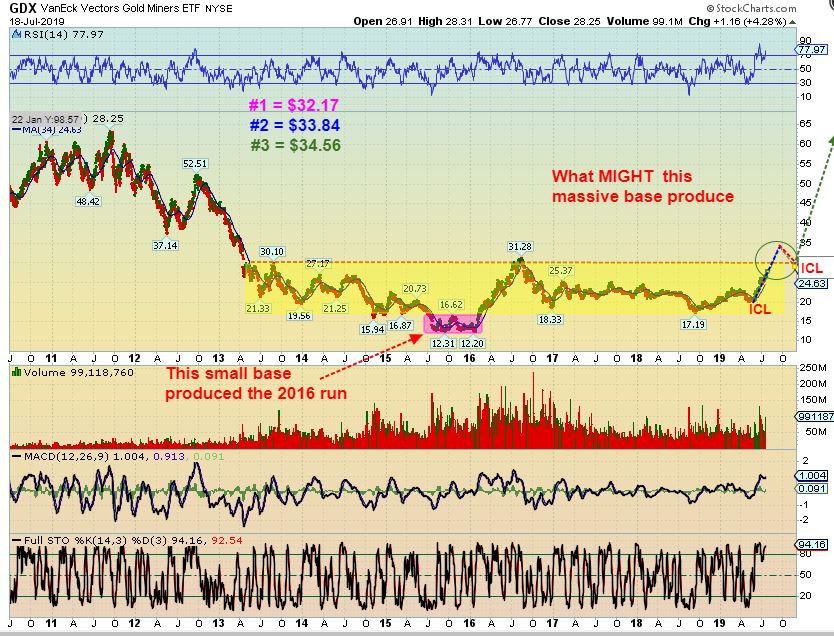
Yes, Many of you have been patiently waiting for the next Big Buy opportunity, and it is close. You have done well preserving Funds that can double & triple down the road when we again buy the sale prices of these Miners. Some Miners mentioned in Fridays report are already showing signs of accumulation. I discussed possibly starting SMALL starter positions that can be added to on a dip or a rip going forward. I have not started, but I’m ready to. I will discuss that further as time goes on. We have the FOMC Mtg A week from the coming Wednesday ( so the lows for Gold may show up between now & the next 7 or 8 trading days). A break of the upper trend line is viewed as Bullish too.
.
I will discuss a little bit more about miners below. Enjoy your weekend, and thanks for being here!
.
~ALEX
.
THINKING OUT LOUD – In addition to several Miners that I mentioned in Fridays report as possibly showing signs of leadership, let me briefly discuss a few NG & HMY thoughts. First, I wrote this about this chart in Fridays report, and it is possible that some Miners could resist this drop.
.
GOLD – This is what I think would be a likely scenario if we are to get another Mild ICL. The low would still be ahead, but it may not drop as deeply as some prior ICLs. It still COULD drop deeper in a flash drop v-bottom type low, but a mild ICL similar to the one in May would not have to. It seems that some Miners are already catching some buying.
.
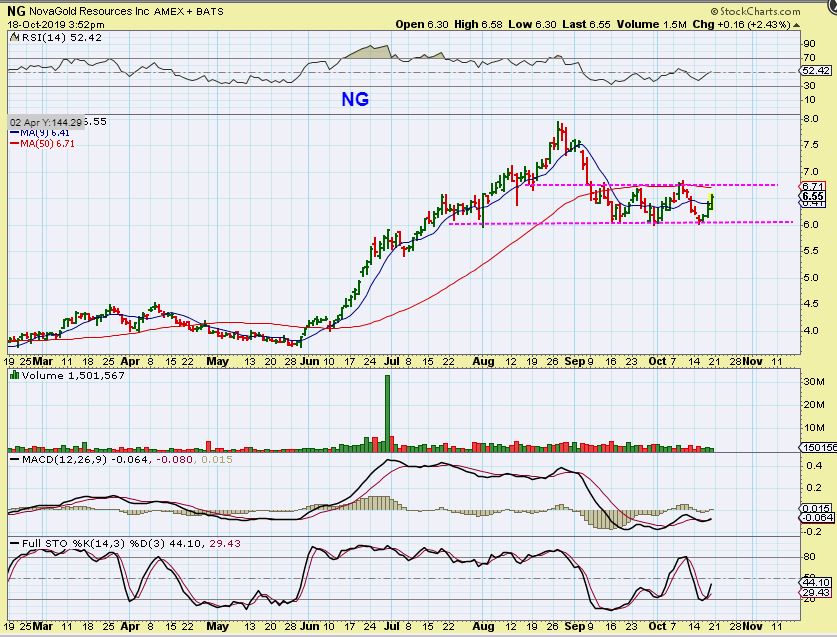
NG – This chart that shows a Miner that initially sold off fast in August to September from $8 to $6. For the past month Nova Gold has been holding up in a sideways pattern. Will it do a shake out, or regain that 50 sma & eventually form a nice Cup? It could do either from this mid point.
In Fridays report, I showed how Some Miners look like they already want to regain the 50 sma. If they do, it needs to be considered bullish, so a ‘small starter position’ could be manageable. Just remember that if HMY continues to be rejected and Gold sells off into an ICL, HMY could drop to the 200sma as a big a-b-c. What is the bullish side?…
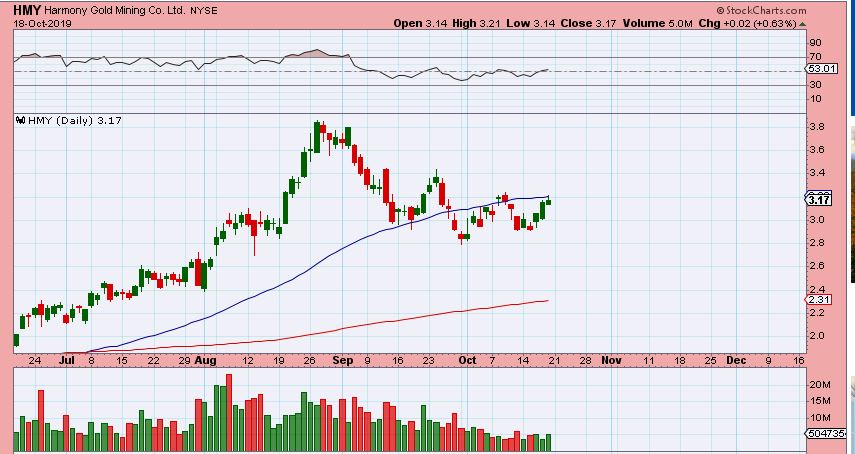
If it breaks higher this week, it would have time to form a cup, and then if Gold sells off int the fed mtg, HMY may only form a handle on the drop. 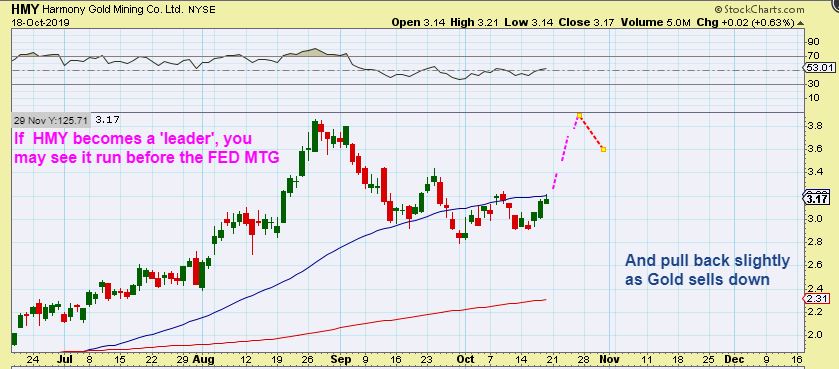
These are just the kinds of possibilities that I am mulling through my mind as these set ups continue to form. I will discuss them further in the daily reports as time goes on, especially if HMY, NG , or others do break higher through the 50sma next week.
It became a bit of a mixed set up with Gold making higher lows and GDX & GDXJ breaking to new lows last week.

