Friday September 13th – Tremors
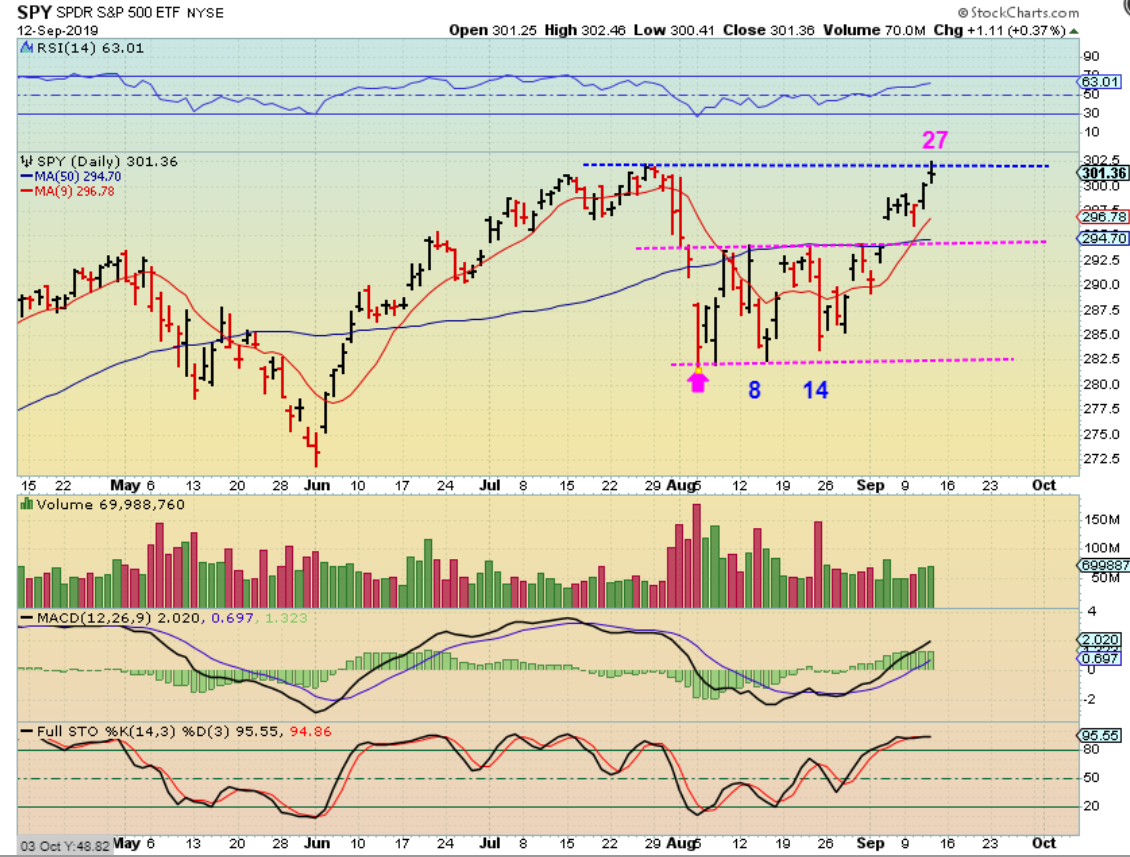
SPX – The SPY made a light volume tag of the prior highs and formed a Doji on day 27, so it Could pull back from here into a dcl. Then go long, because it is R.T. & should run higher at least 1 more time.
.
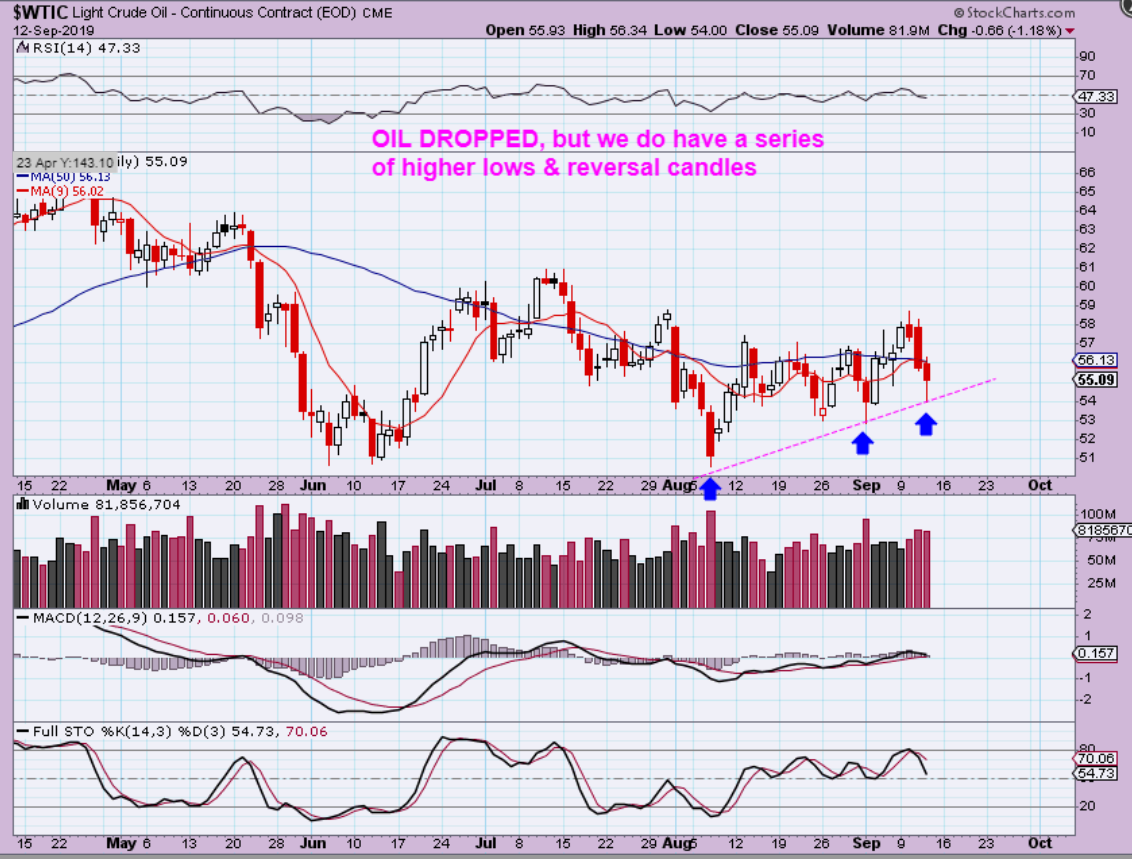
WTIC – So Oil droppedfast Thursday, another 2%, but then bounced off of what could be the uptrend line and closed down 1%. Oil remains choppy, but I still think that the Energy Stocks could be bottoming ahead of a break out that holds.
.
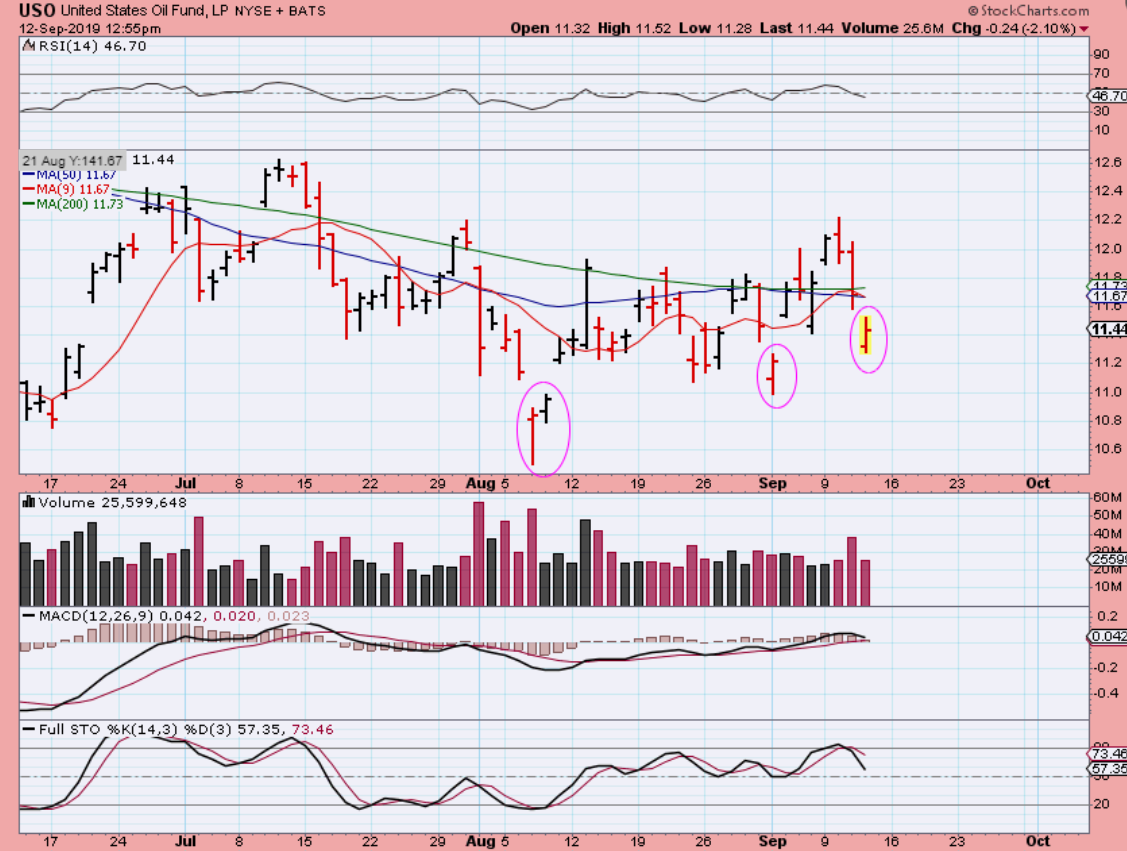
USO – I emailed this midday to show a reader that we have seen Oil sell off overnight in the past, Gap Down at the Open and reverse/ recover. Thursday we also did have some Green Energy stocks during oils sell off, and I will Briefly discuss energy stocks at the end of the report.
.
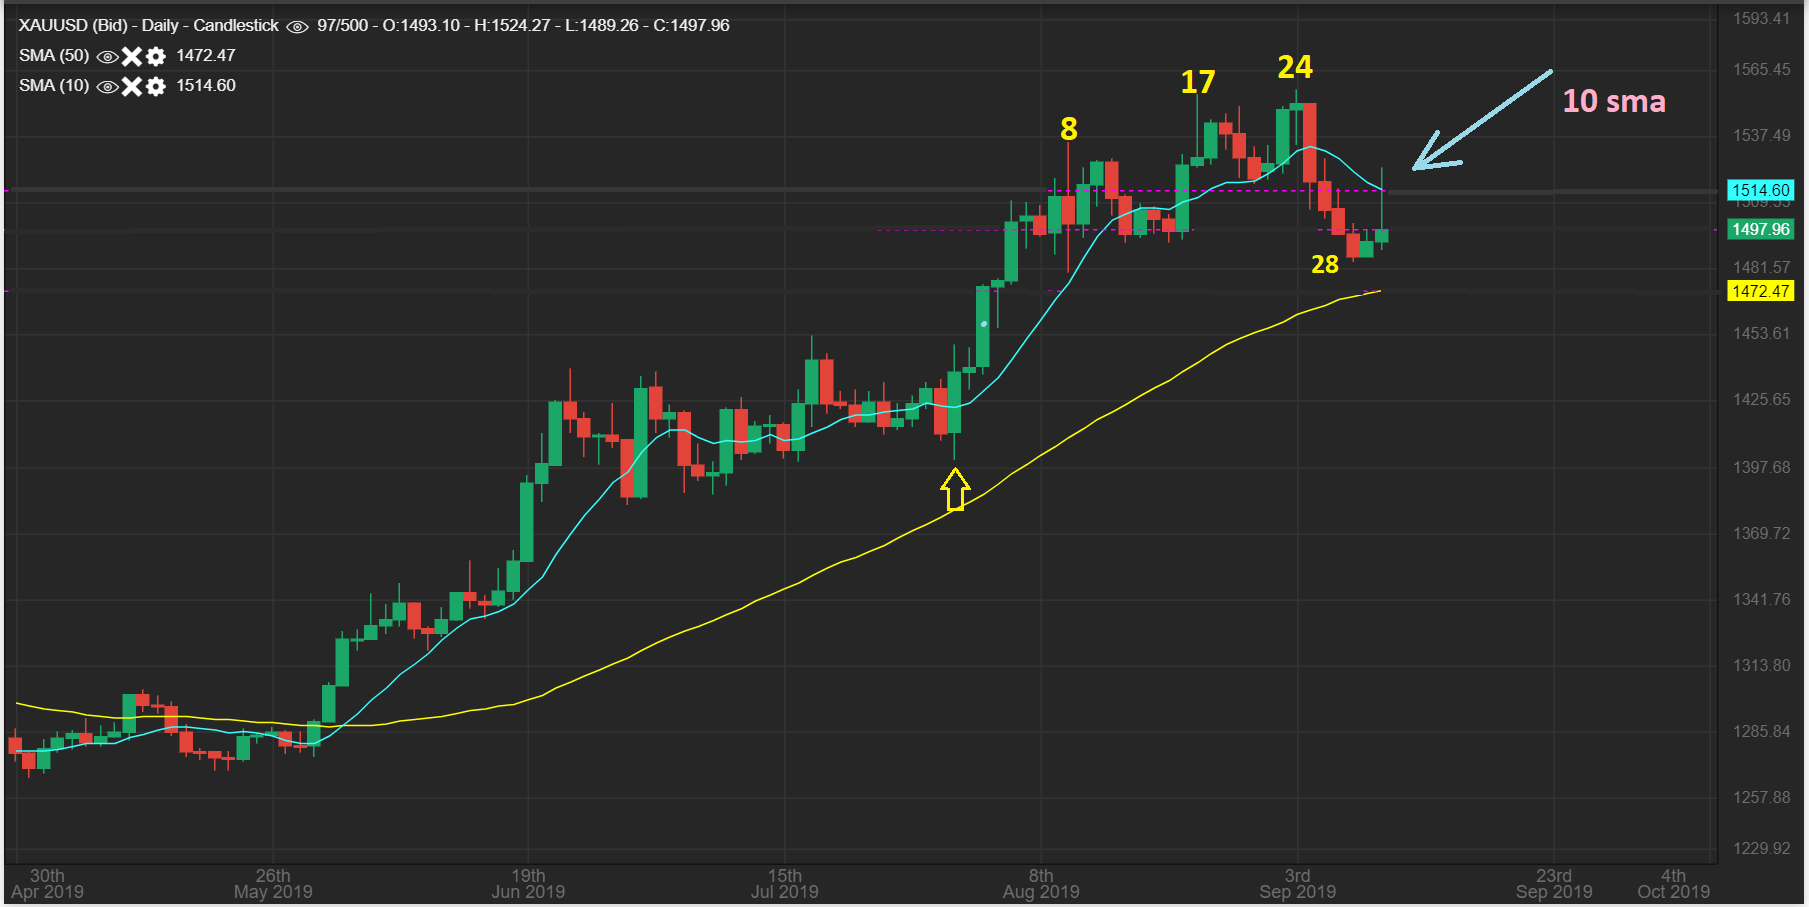
GOLD – Gold broke the 10 sma, a sign that a dcl is being put in place, but it did not close above it. It gave up the gains, and Miners broke to new lows, so this daily cycle looks set to continue.
.
.
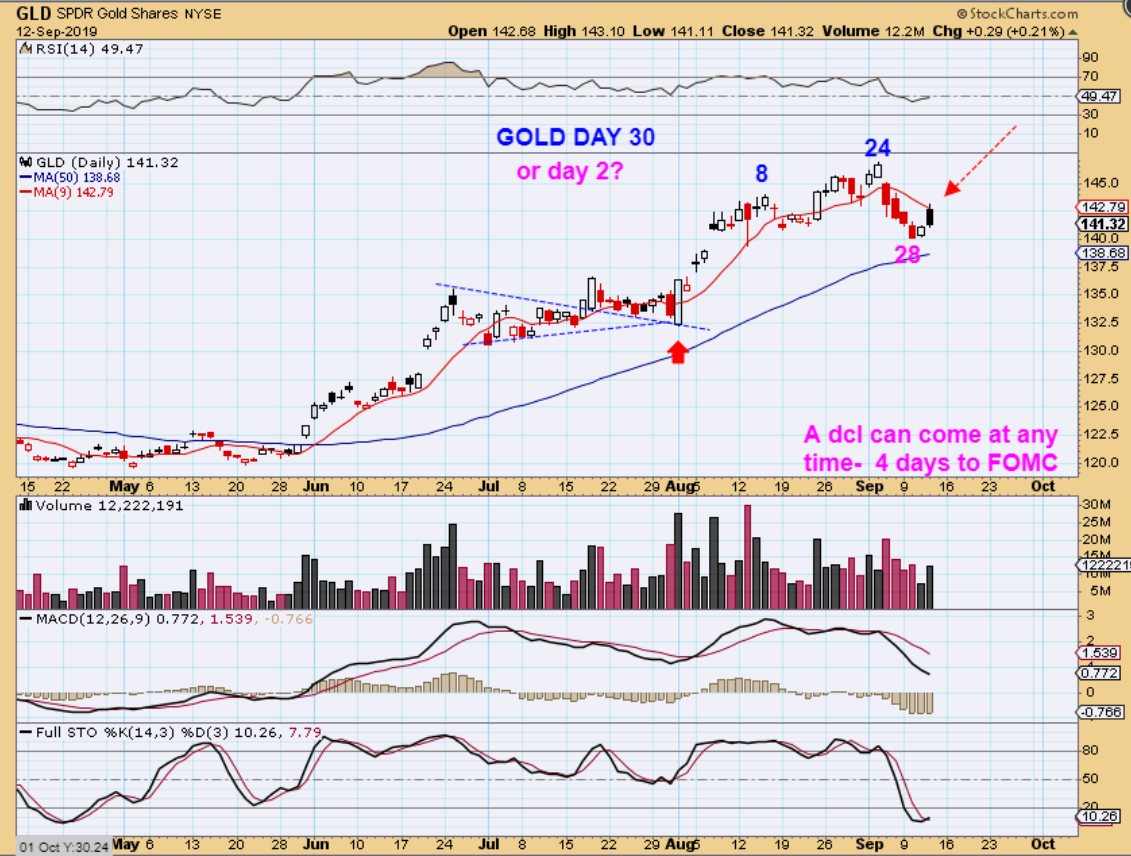
GLD – GOLD may have looked like it bottomed on day 28 as it bounced, but because we watch the 10 sma, GLD never got above it.
.
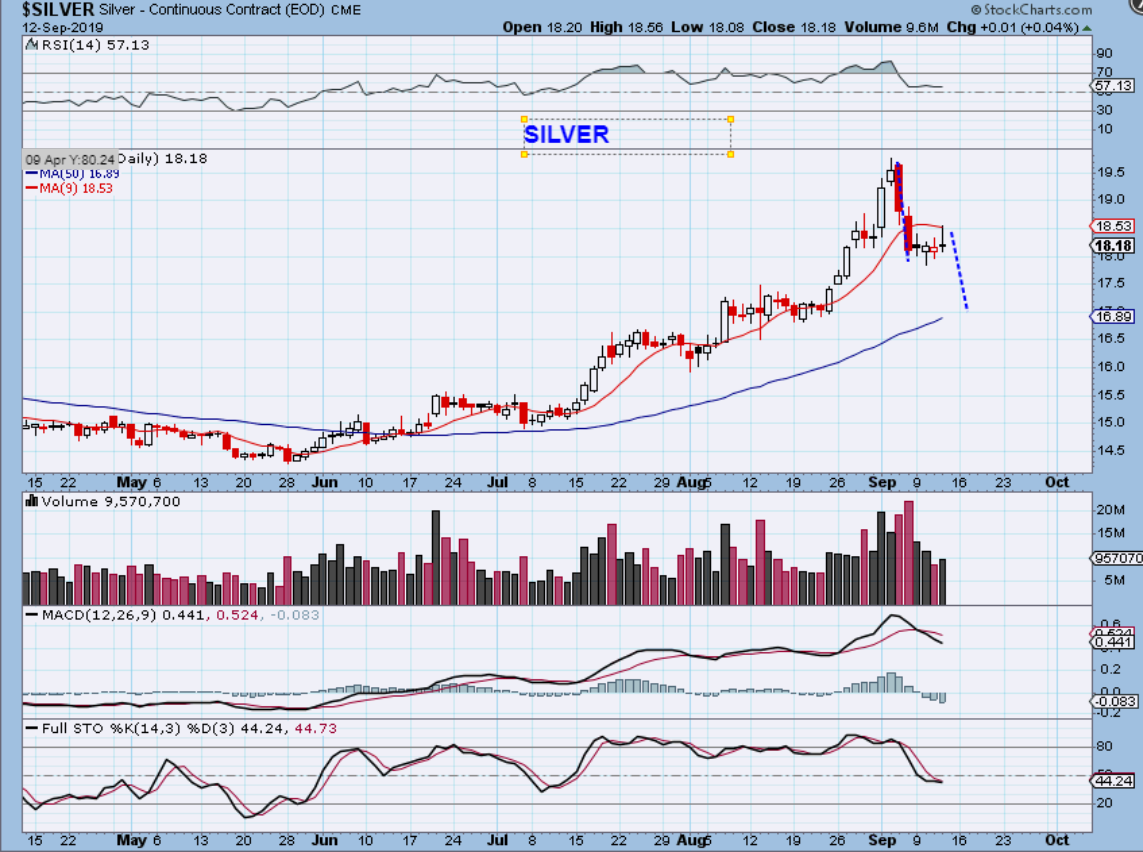
SILVER – Silver tagged that 10sma & dropped too. It CAN BURST right through that 10sma Friday or Monday, but I lean more toward a shake down to flush out Bulls.
.
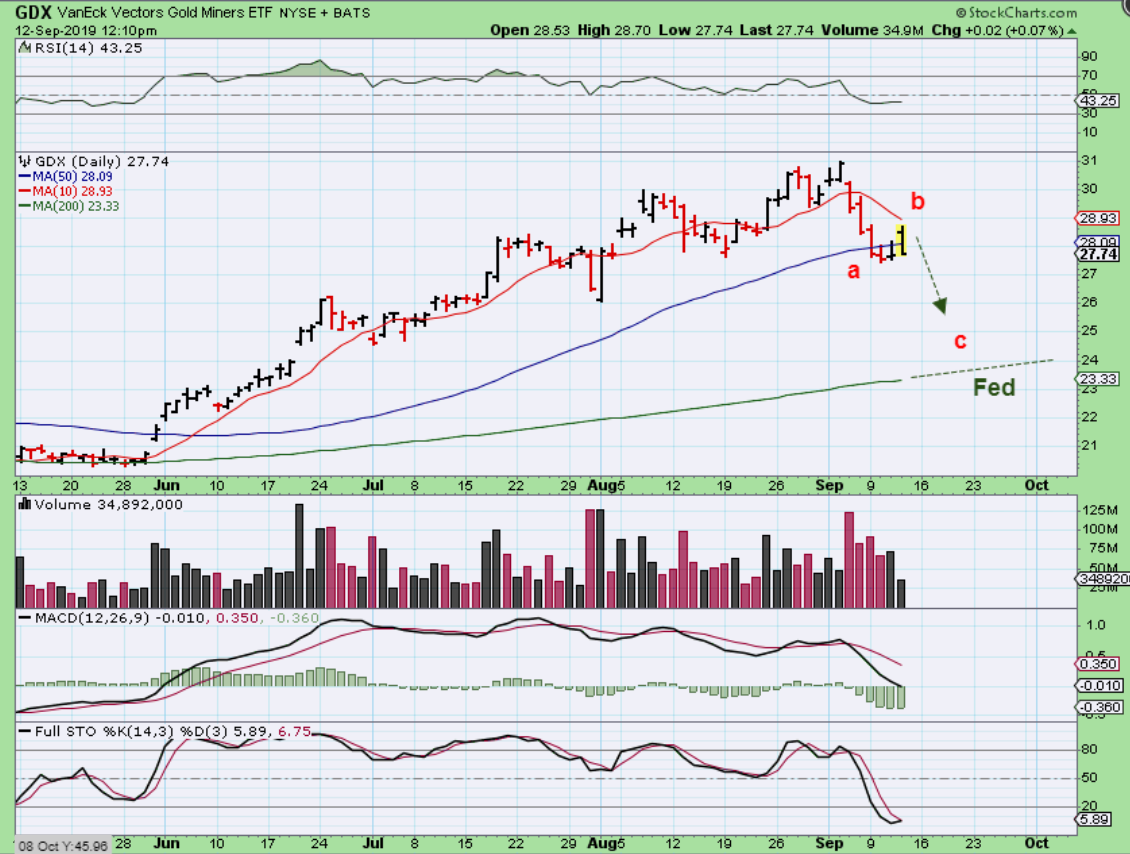
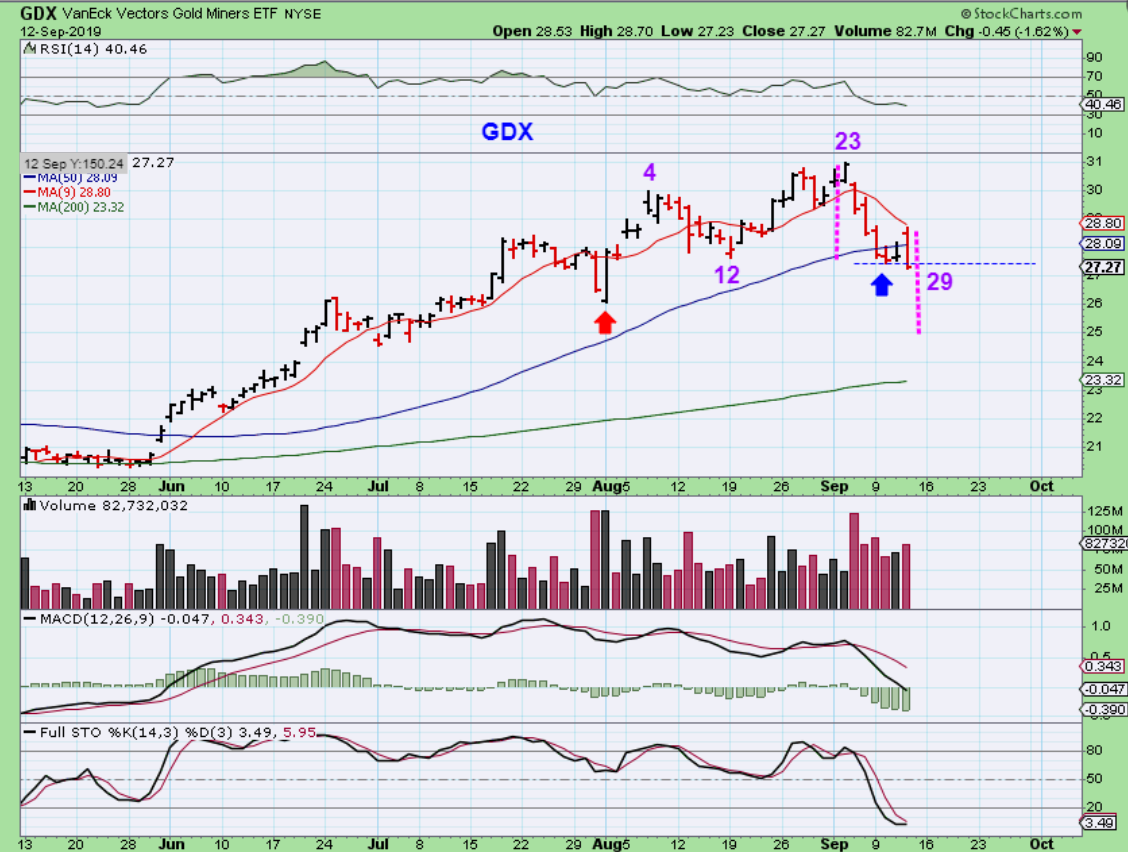
GDX – GDX gapped up toward that 10 sma on what could have been day 2, but it rolled & sold off. I drew this midday, and it then sold off and closed under those ‘a’ lows.
.
GDX – Rejected at the 10sma, we are now at a new low on day 29. This CAN BOTTOM AT ANY TIME. Friday would be day 30. I am showing a measured move possibility on this chart.
.
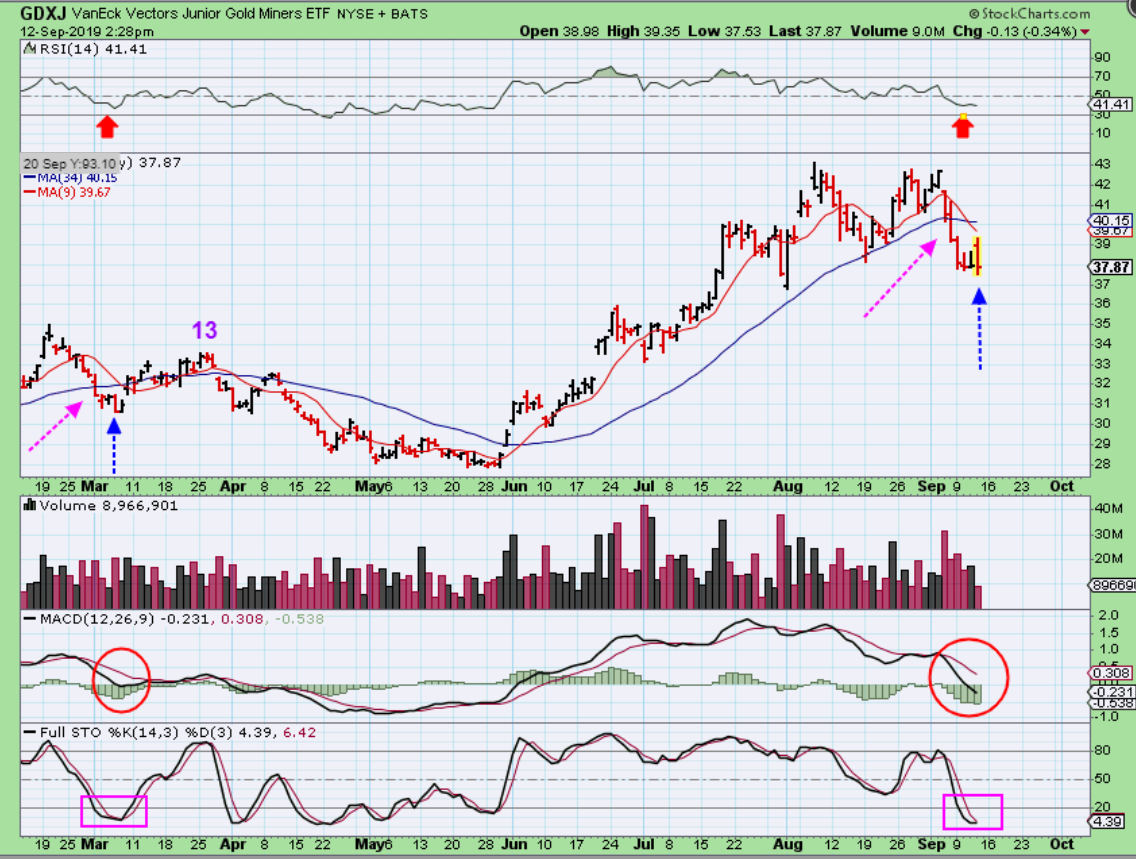
GDXJ – I am showing this for a different reason other than just saying that we made a new low.
1. LOOK AT MARCH. It bottomed below the 50 sma for 4 days JUST LIKE THIS SET UP.
2. It then topped on day 13 & rolled over into the real ICL. That could happen too.
3. THAT IS WHY I am showing this view. I go long the DCL, and decide later if it is an ICL or DCL.
.
Summary : The General Markets put in a doji at the former highs and could stall here. Things got a bit volatile in Energy today, I will discuss that further below. Miners were a bit of a tease, gapping higher and selling off. I watched nice gains in my CDE turn into a nice red number along with a few others 🙂 but I still expect the dcl soon.
Today is Friday , the last trading day of the week, so enjoy your last day of Trading! Then we enter the Fed Week.
.
~ALEX
.
Sidenote: I am traveling this weekend, and the Weekend report may be later than the normal Saturday night release. That said, We are heading into a Fed Week next week with late Cycle Counts, so based on all of this weeks reports, you probably can guess what we’ll be looking for by now, especially with Friday being day 30 for Miners. 🙂 The weekend report may be released on Sunday.
.
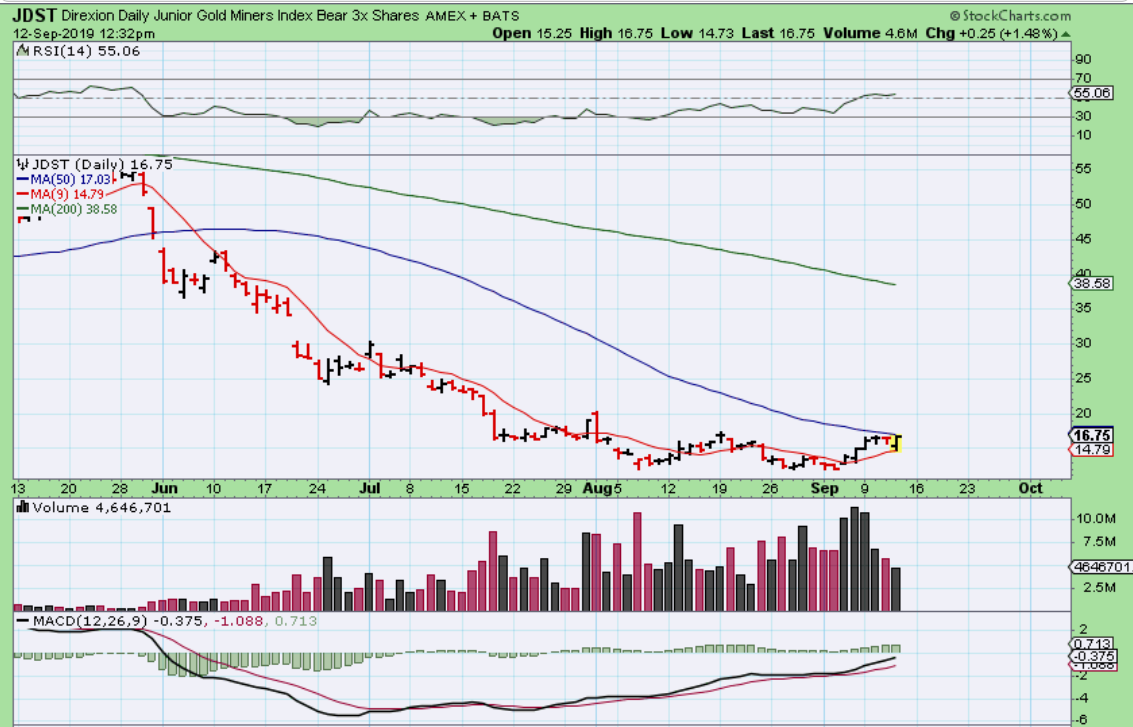
JDST – I posted this in the comments, as GDX & GDXJ Gapped open and began to sell off. JDST was actually a bullish looking chart, siting on the 9 sma & crawling along the 50 sma.
.
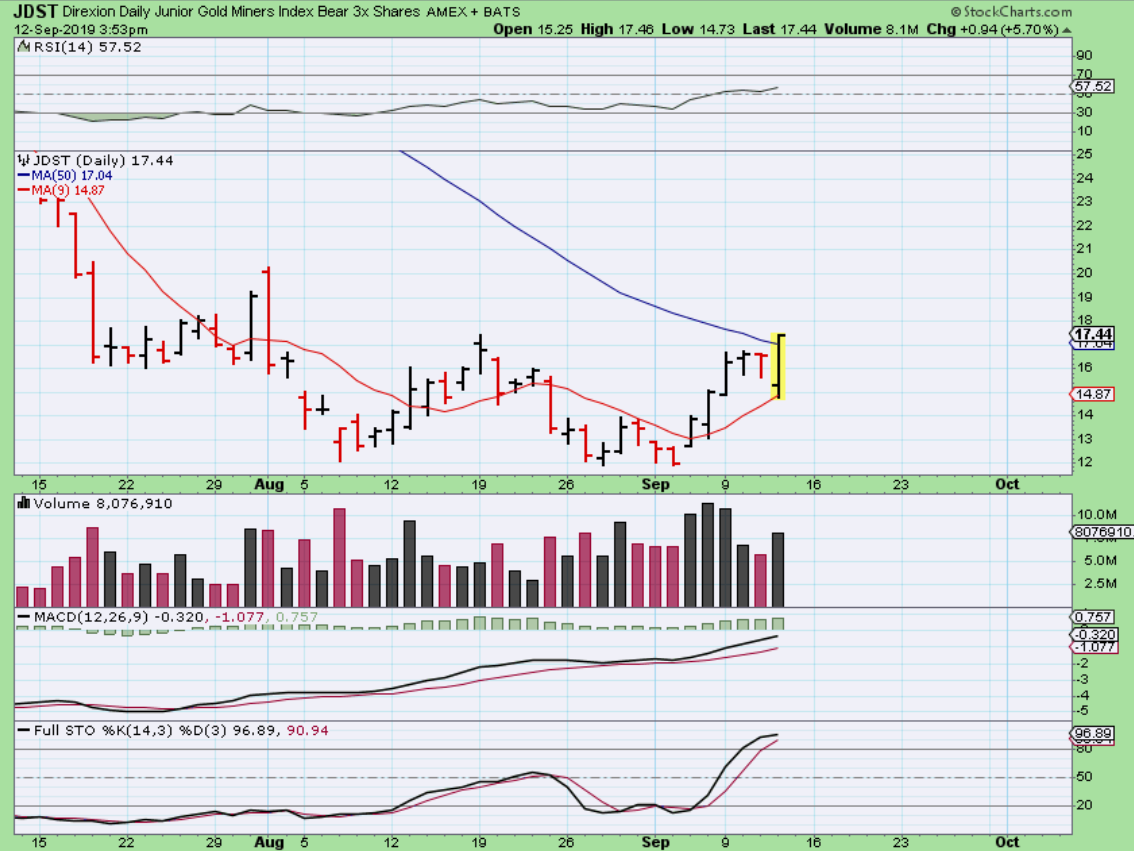
JDST – And then it broke out as GDXJ made new lows. IF GDX & GDXJ sell off into the Fed Day, JDST could reach near $20 in a measured move off of the 10 sma.
.
I want to discuss Energy Stocks. They Gapped down Thursday and it looked dreadful in our accounts, but was it? It sure did feel like it if you looked at your account, but along with Oil putting in those reversal candles and possibly signaling that it will move higher , I will explain why I don’t think it was all that bad for energy stocks ( So far anyway) …
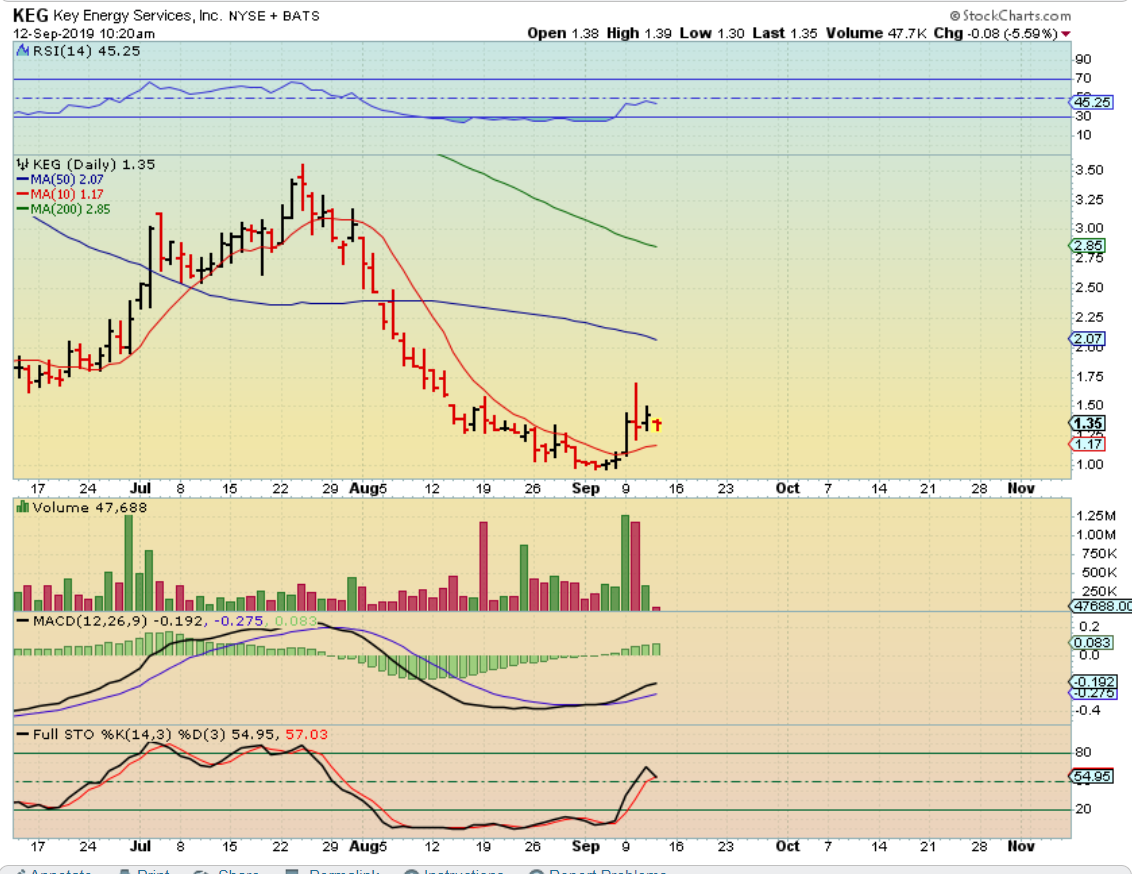
KEG – I posted this an hour after the open. It was down 6%, and that seems like a lot as it sits in your account, but lets take a closer look at it after it closed…
.
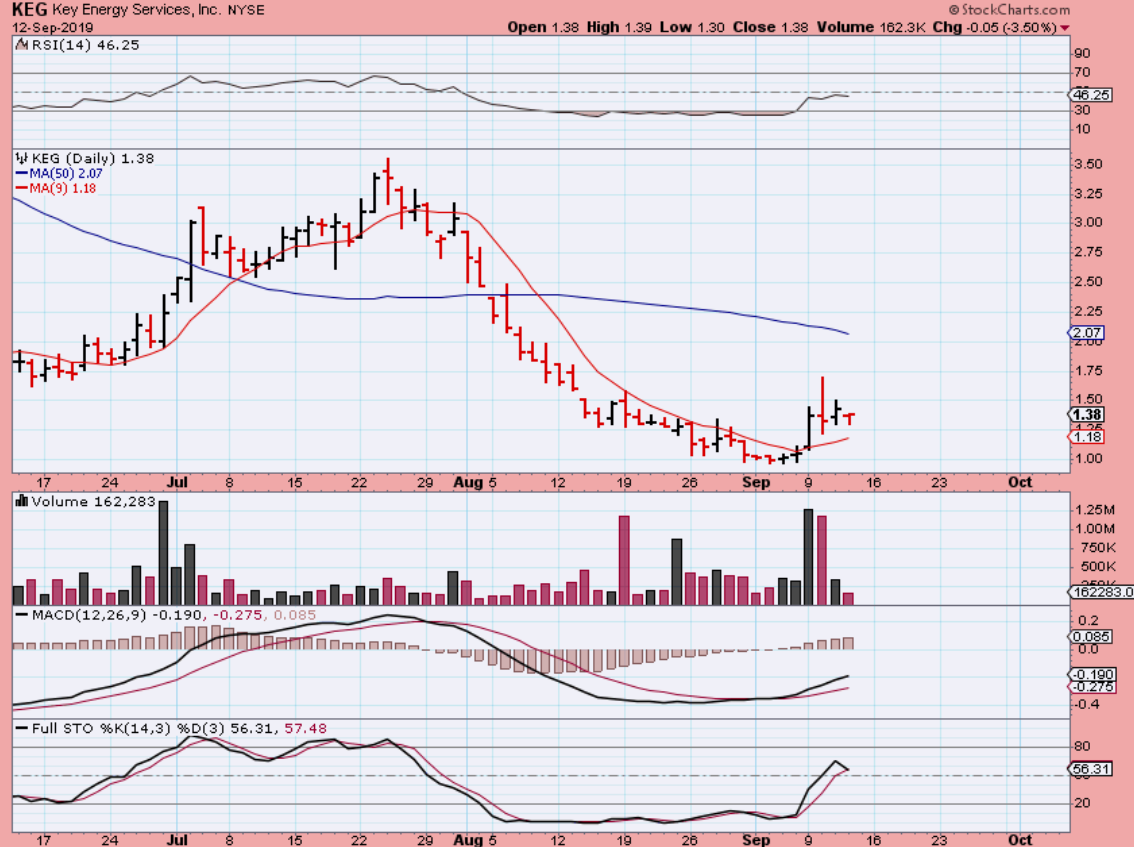
KEG – We want to remember that KEG moved up over 20% Monday and another 20% Tuesday, before selling down a bit. 40%. It ran from $1.00 to $1.75- so that was 75% gains in 3 days!. Thursday it dropped 6% and yes, 6% is a lot, but not if you look at this chart. It closed down 3.50% and that may be a small bull flag above the 9 sma. A run to the 200sma is still possible.
.
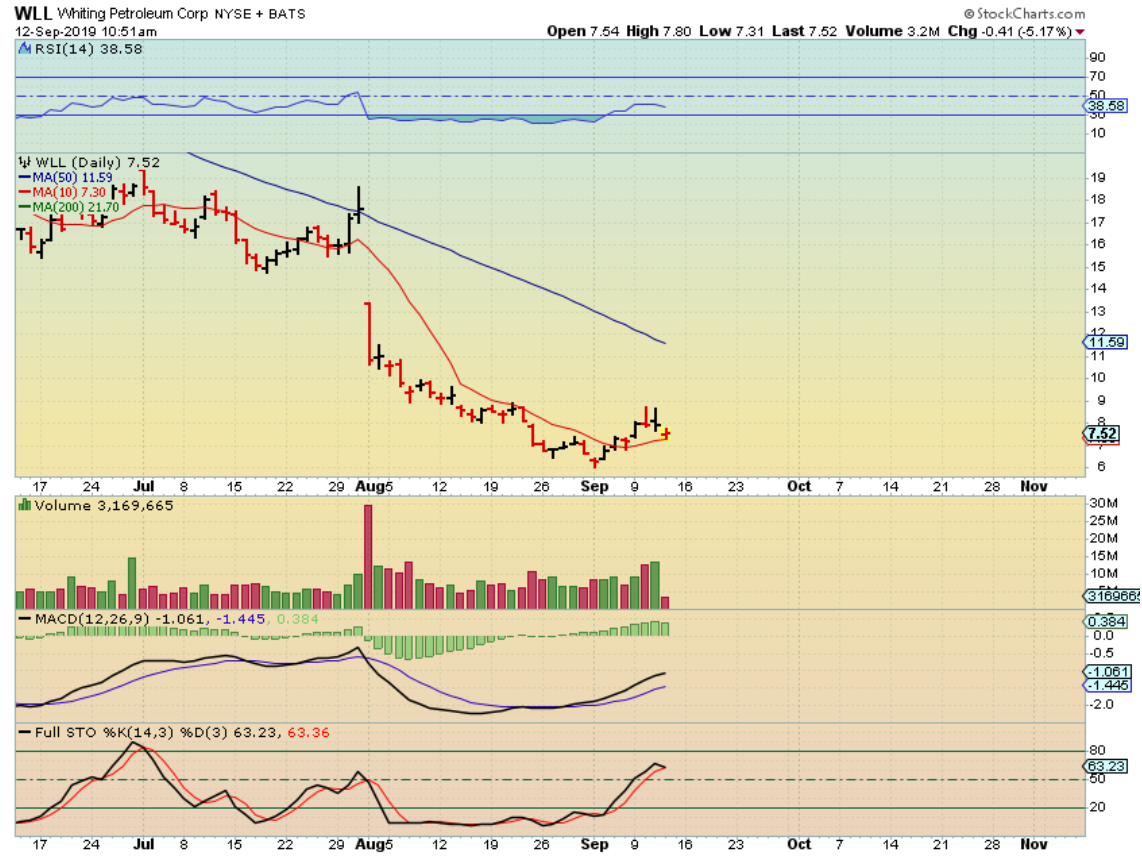
WLL – I posted this one too, because it dropped right down to the 10sma. That was another 6% loss, but in the big picture it looks small. This stock also had a big run from $6 to almost $9.00 in 5 days! So this drop could be normal back test of the 10sma. We’ll see.
.
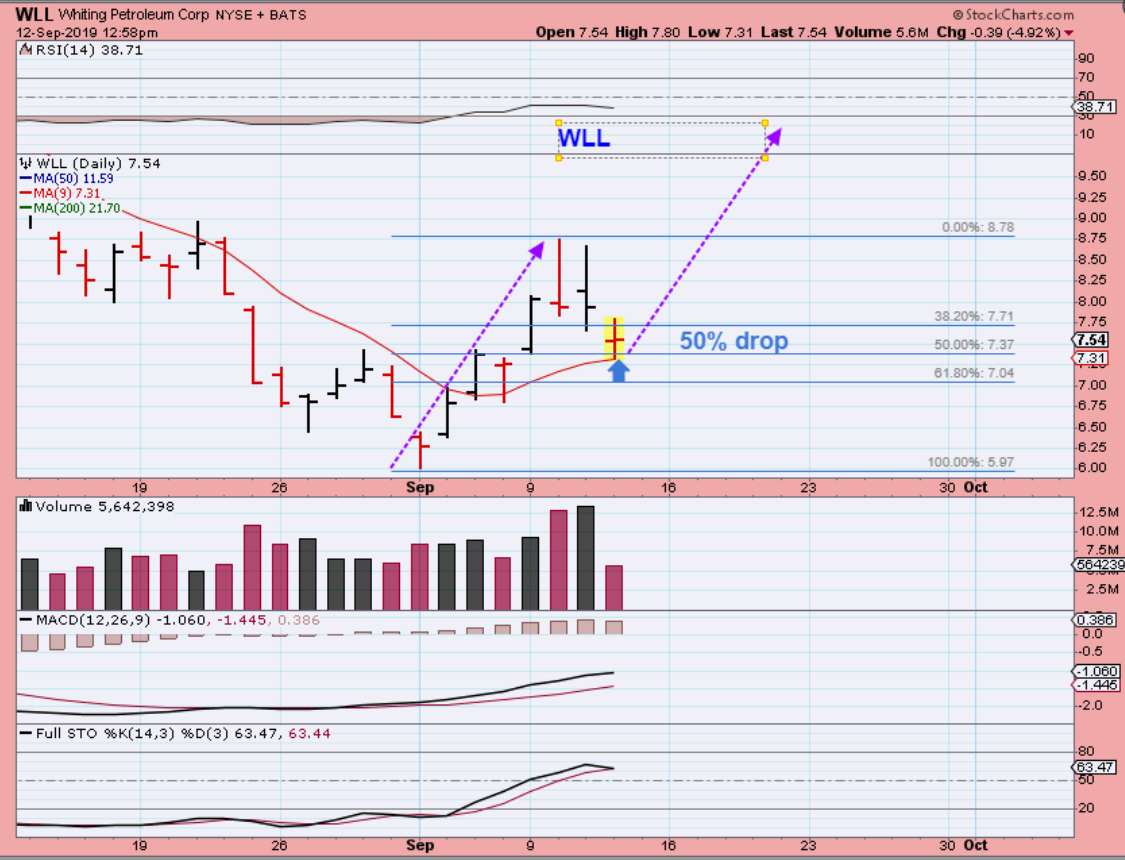
WLL – I zoomed in and we have a 50 % drop, right to the 9 sma. If this acts bullishly going forward, it could run to $10.00 from here (purple arrow). We’ll see.
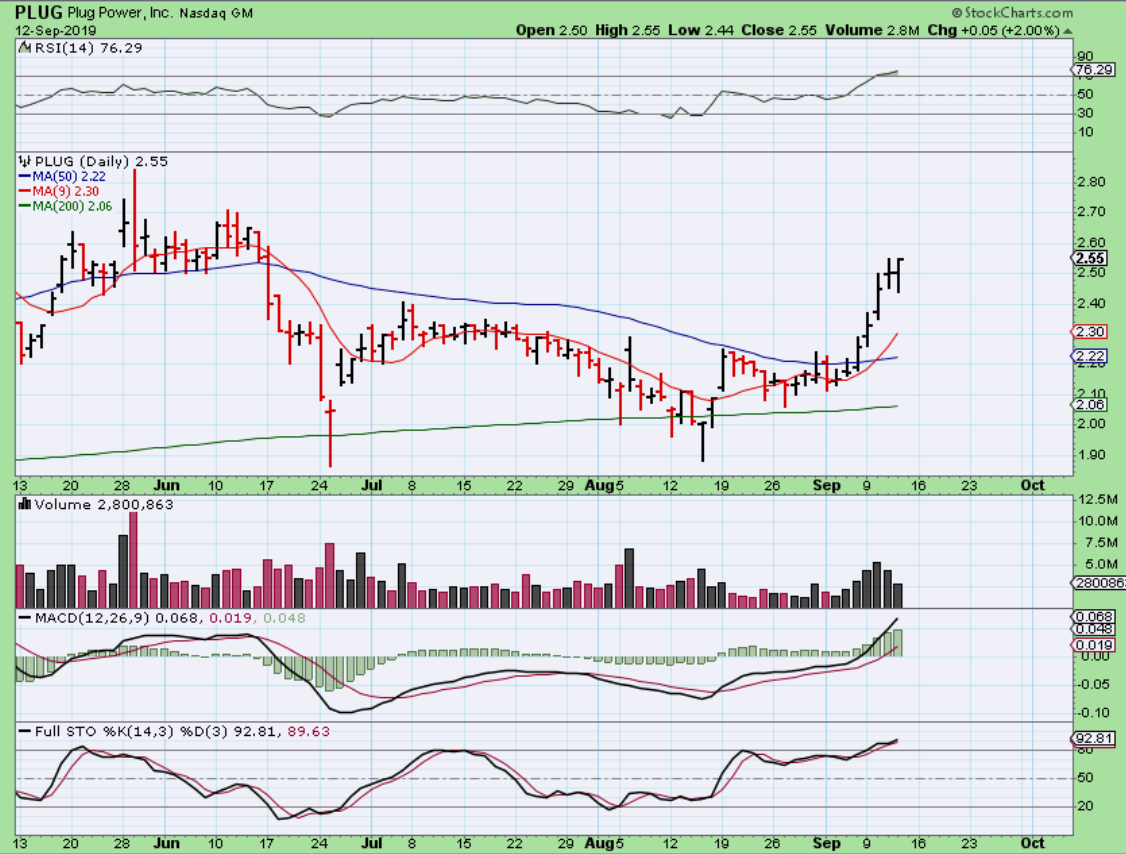
PLUG – PLUG dropped & recovered. BLDP was green too, but these are energy less attached to Oil. And CLNE is almost a buy if it reverses on or around the 10sma too.
.
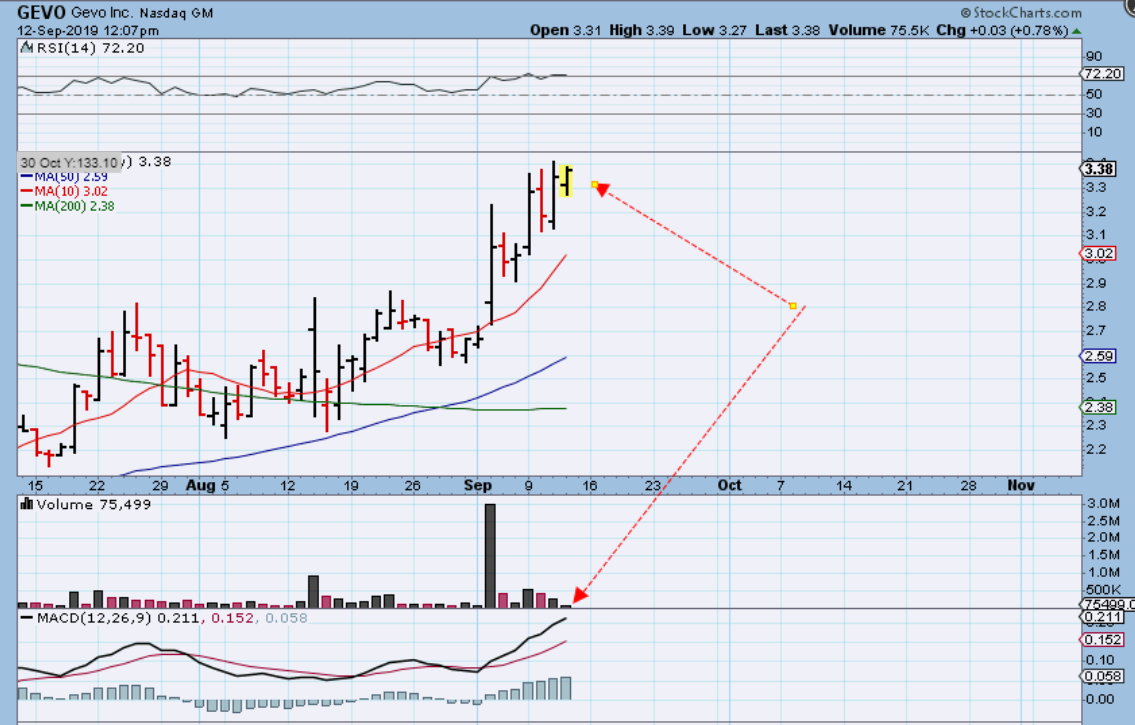
GEVO – GEVO was up , and I announced live that I was selling this high. Why? Recently having near 500,000 volume per day, I saw this midday with only 75,000 at the highs. In my mind, I view that as running out of Buyers at the highs– so I will take profits & buy a pull back if I get one. It then closed down .
.
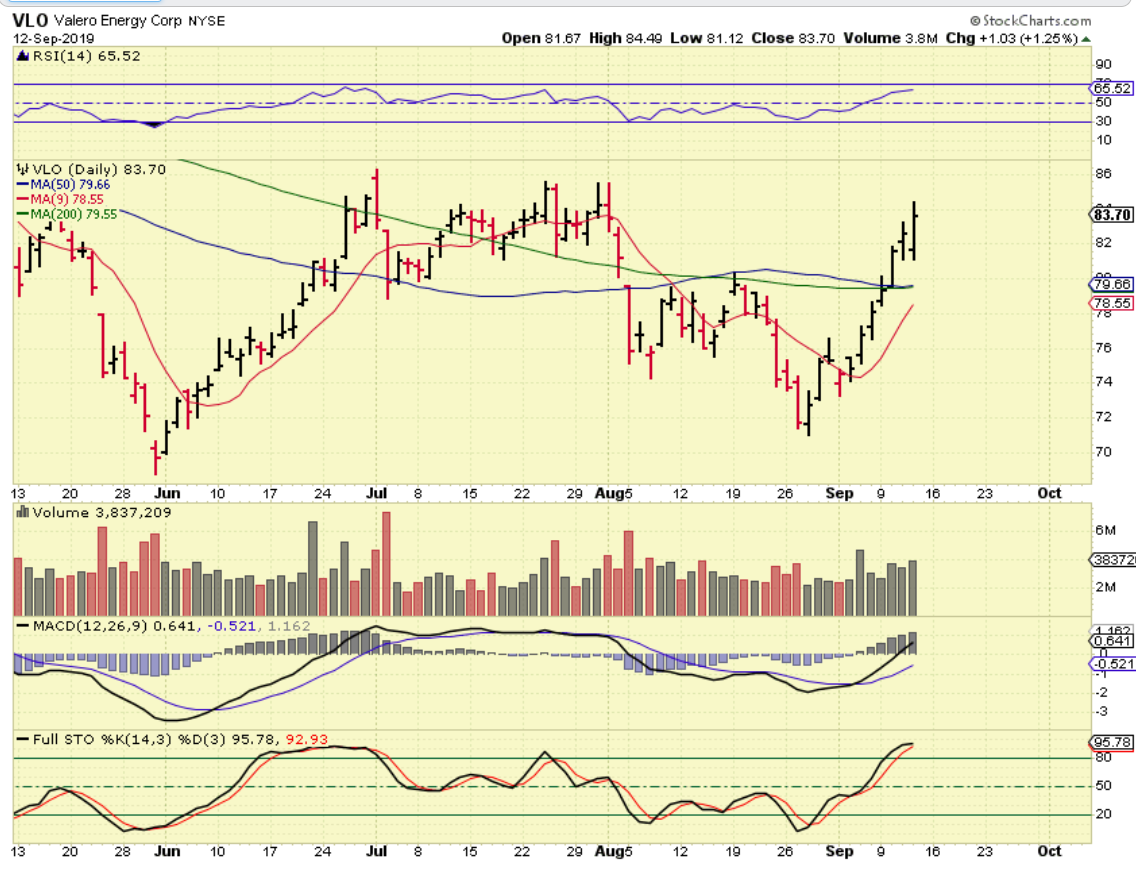
VLO – VLO gapped down with Oil gapping down & selling off, but it flipped & went green, so this gave me a bit more confidence that maybe we are seeing a normal chop in a bull run. (MRO dropped to the 10 sma).
.
So I just wanted to say that Energy Stocks as a whole do not seem to have violated any boundaries. It was a Massive run higher in just 5 days for many of them, so this drop may simply be part of the chop (as shown in charts above). I bought Gush at $3.00 & sold GUSH at $3.50, and it is still at $3.88, so even a leveraged position is holding highs so far.
Would I put my money where my charts are? You may recall that Oil sold off Wednesday after the inventory report while oil / Energy Stocks did not. I had to leave for the afternoon and mentioned in the live trading area Wednesday that I was cutting a few positions in 1/2 and lightening up, since I would be away.

