Wednesday – Oil Inventory Report
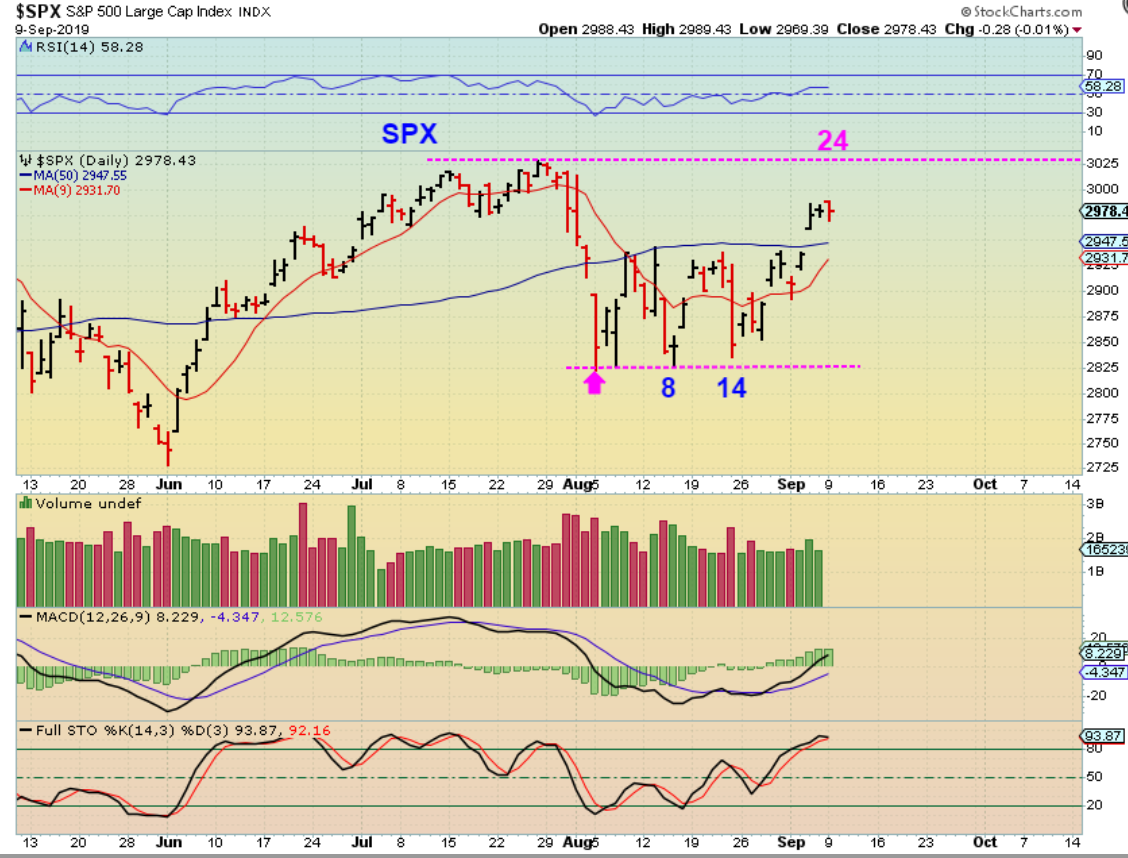
FROM YESTERDAYS REPORT : SPX – Day 24 was a slightly new high , but price has stalled above the 50sma so far. We should make it to former highs in this daily cycle, but we might dip down & back test the 50 sma & 10 sma & also ‘gap fill’ before doing so too. This doesn’t really look weak, because both the RSI & MACD are bullishly aligned and TRAN moved higher.
.
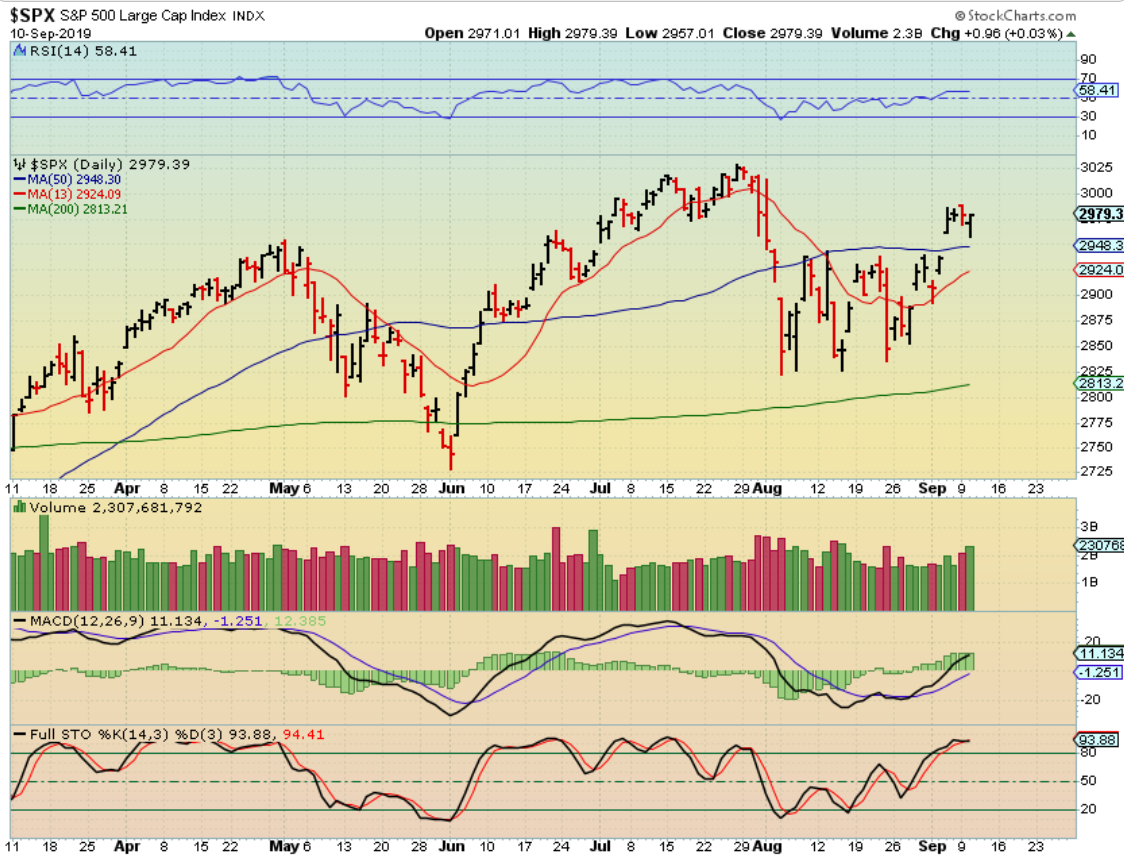
SPX – We did drop and reverse higher, so it may continue to recent highs as expected.
.
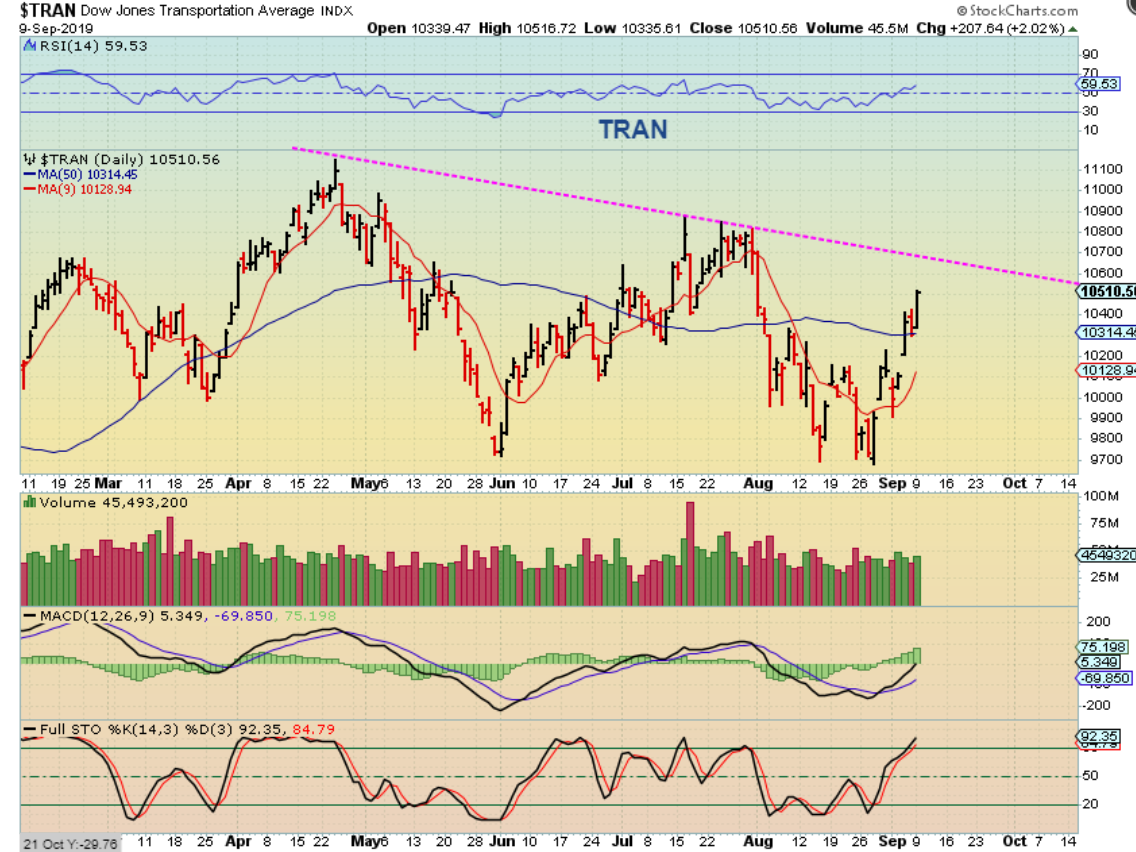
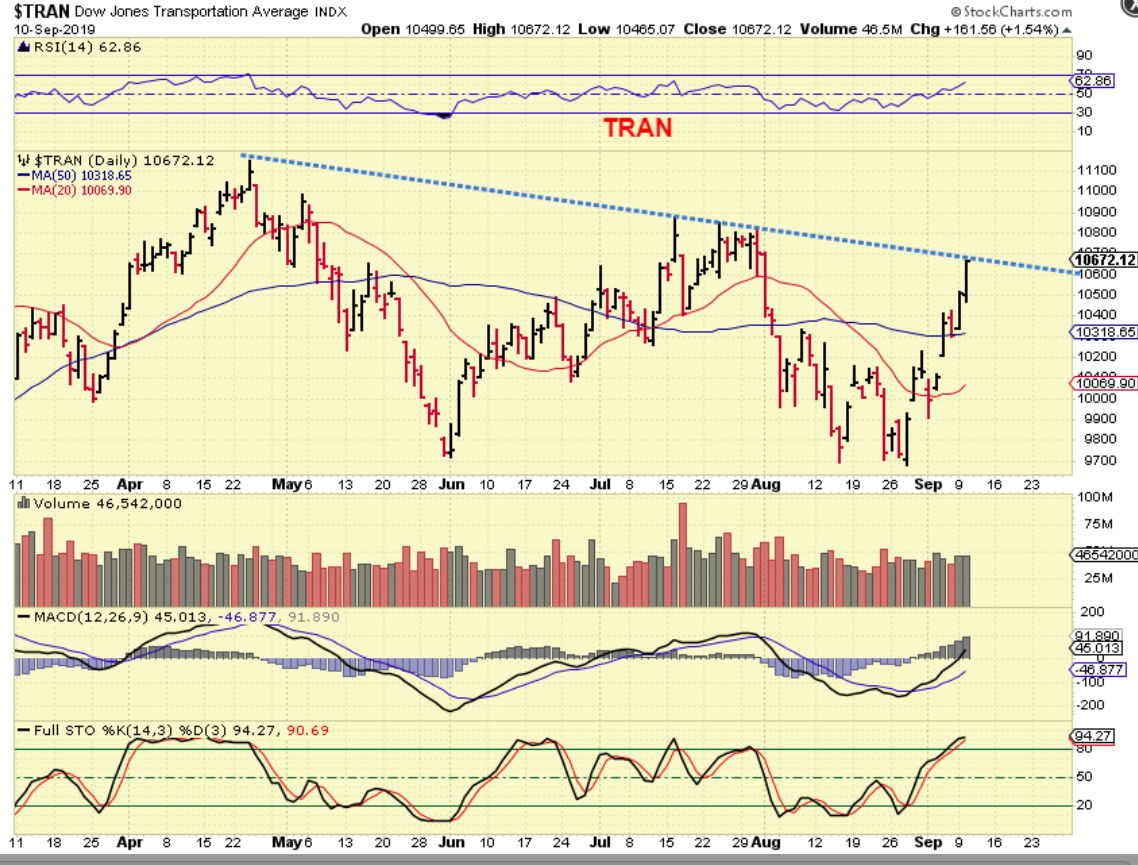
YESTERDAYS REPORT : TRAN – TRANSPORTS & The RUSSELL 2000 closed near the highs, looked to continue higher….
.
TRAN NOW -Continued higher & Could break out
.
WTIC – Oil broke out but now dropped. It may just be a short term back test, but Wednesday is the Oil Inventory Report- Stay alert if you are in energy- the report is 10:30 Eastern Time. I did not sell my positions.
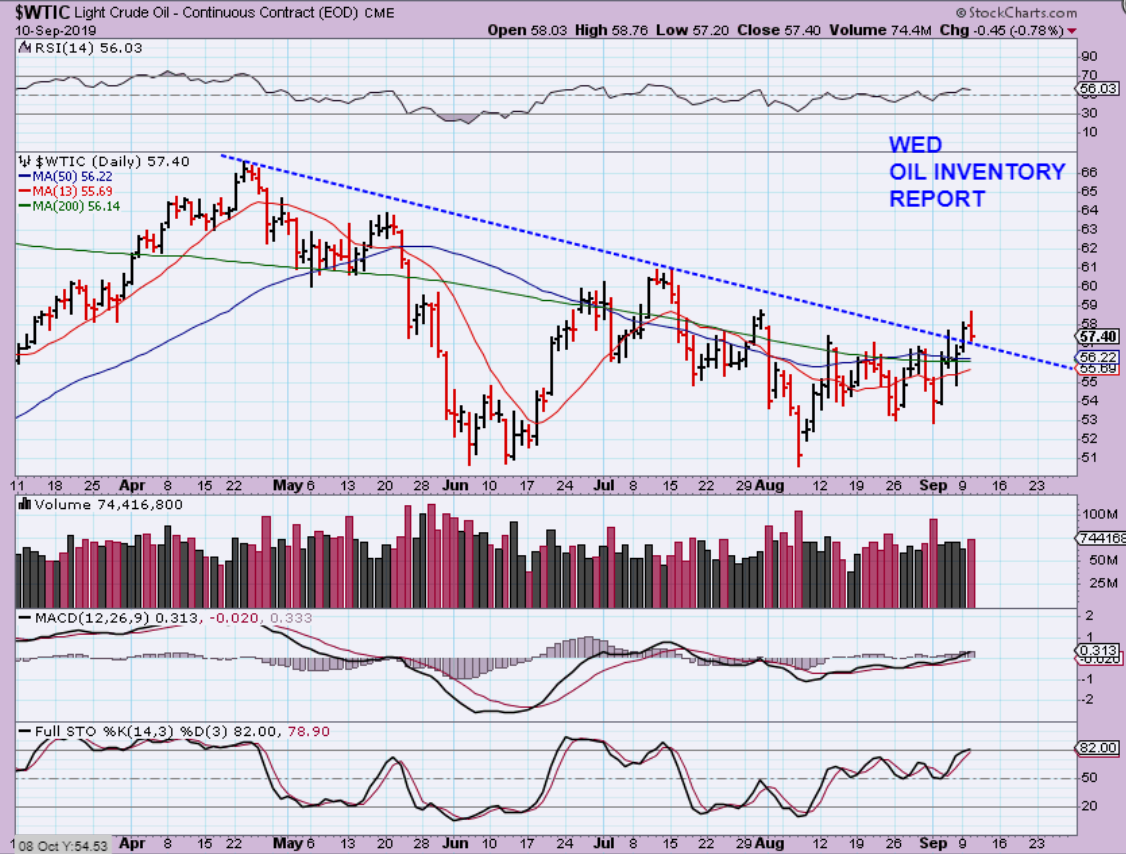
Edit: Oil is higher in pre-market, you have time to sell any positions or lighten up a little before the report If you want to.
.
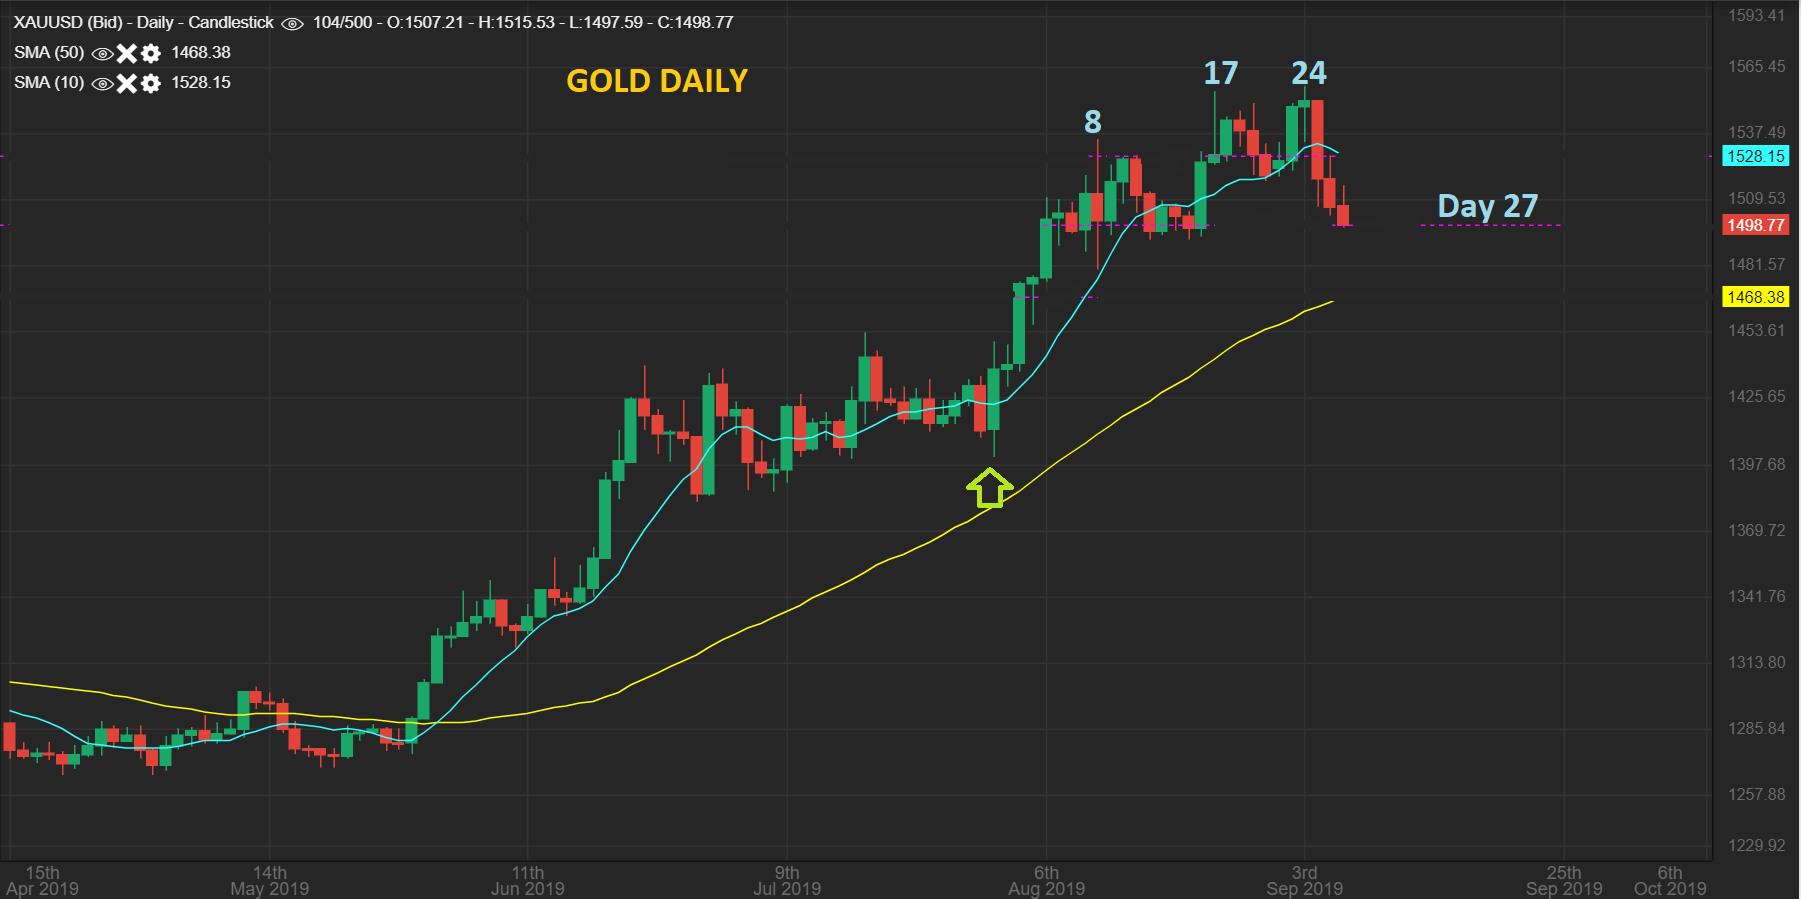
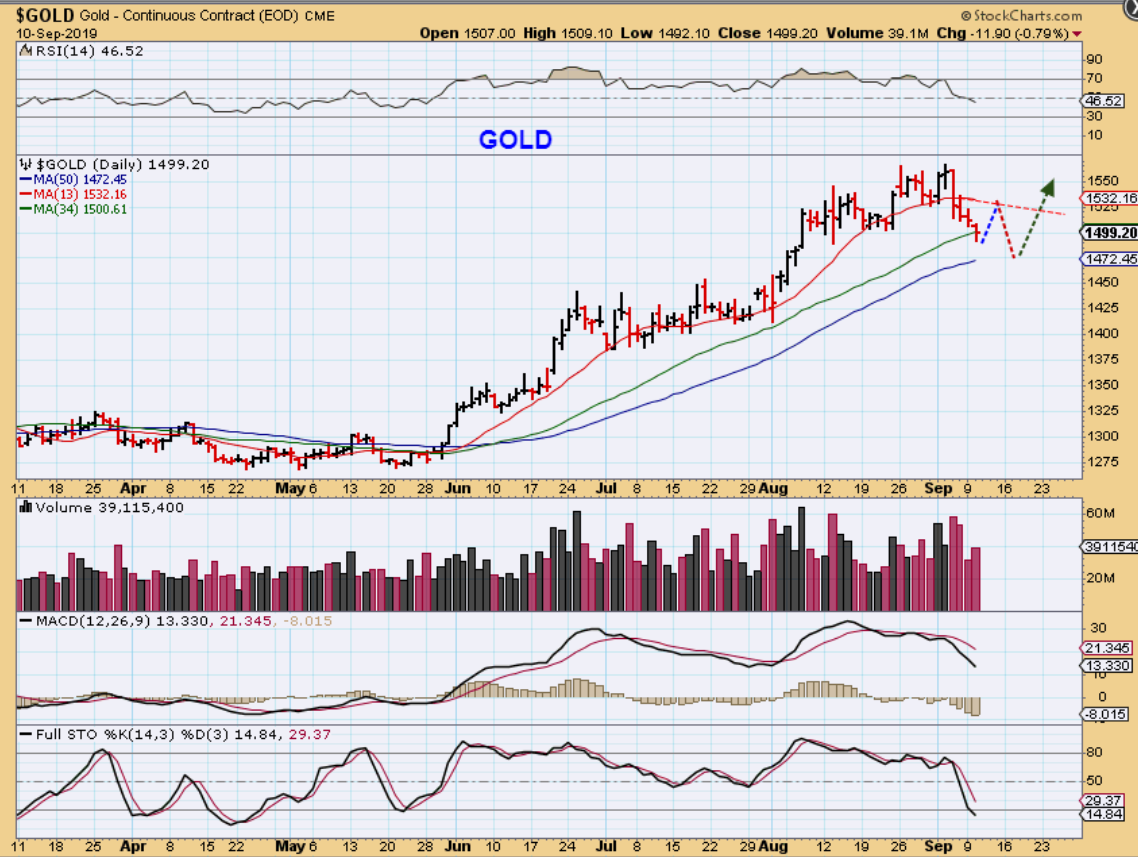
FROM YESTERDAYS REPORT: GOLD CAN still run higher after a dcl . We are on day 27, and daily cycles often run 30+ days ( maybe roughly 32-36ish lately). It doesn’t have to drop straight down, it can get choppy and could come around the FOMC Meeting next week. Maybe Gold will get to the 50sma area, and I have discussed a possible a-b-c type drop.
.
GOLD DAY 28 – Gold acted as expected. It may get choppy as we approach the Fed Mtg next week. We could get an oversold bounce soon.
.
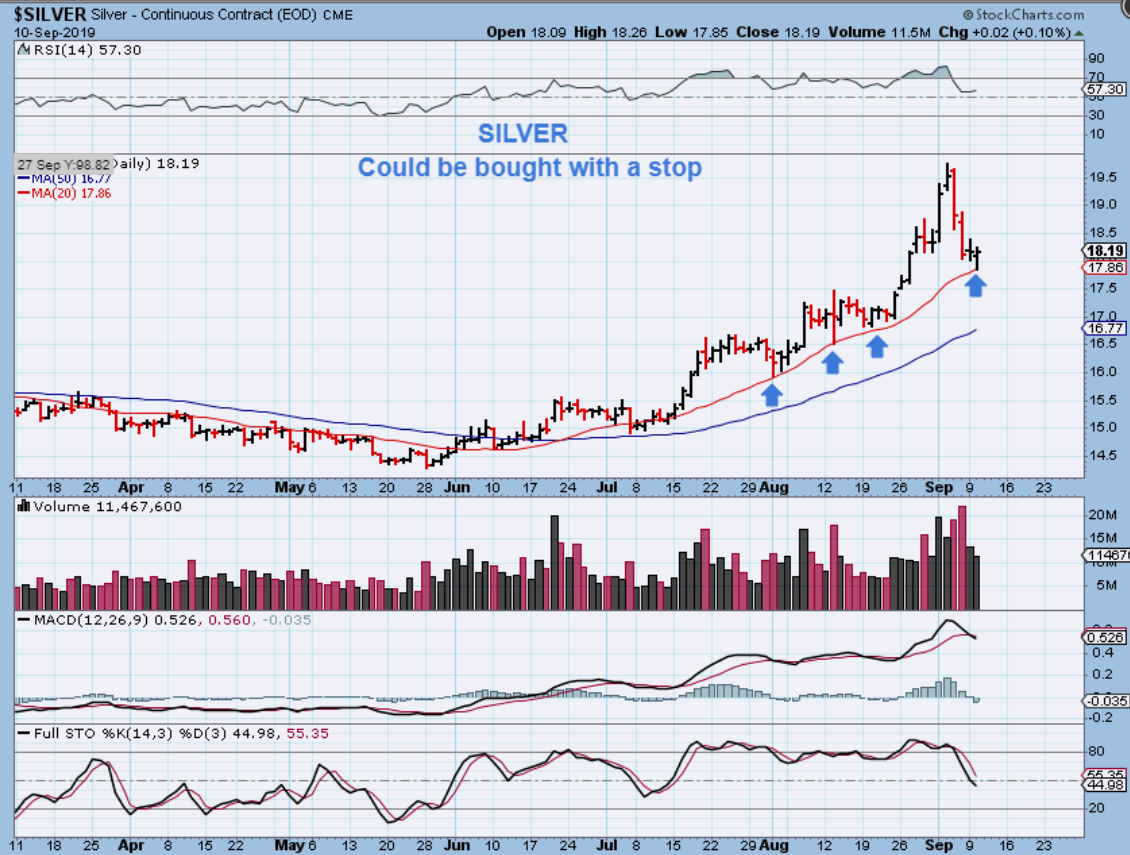
SILVER – Silver looks to be on day 27 and reversed on the 20 sma. This looks ready to bounce. You can buy it with a stop, but it might now quite be the lows yet, with that fed mtg ahead and this being day 28 of possibly 30+ days.
.
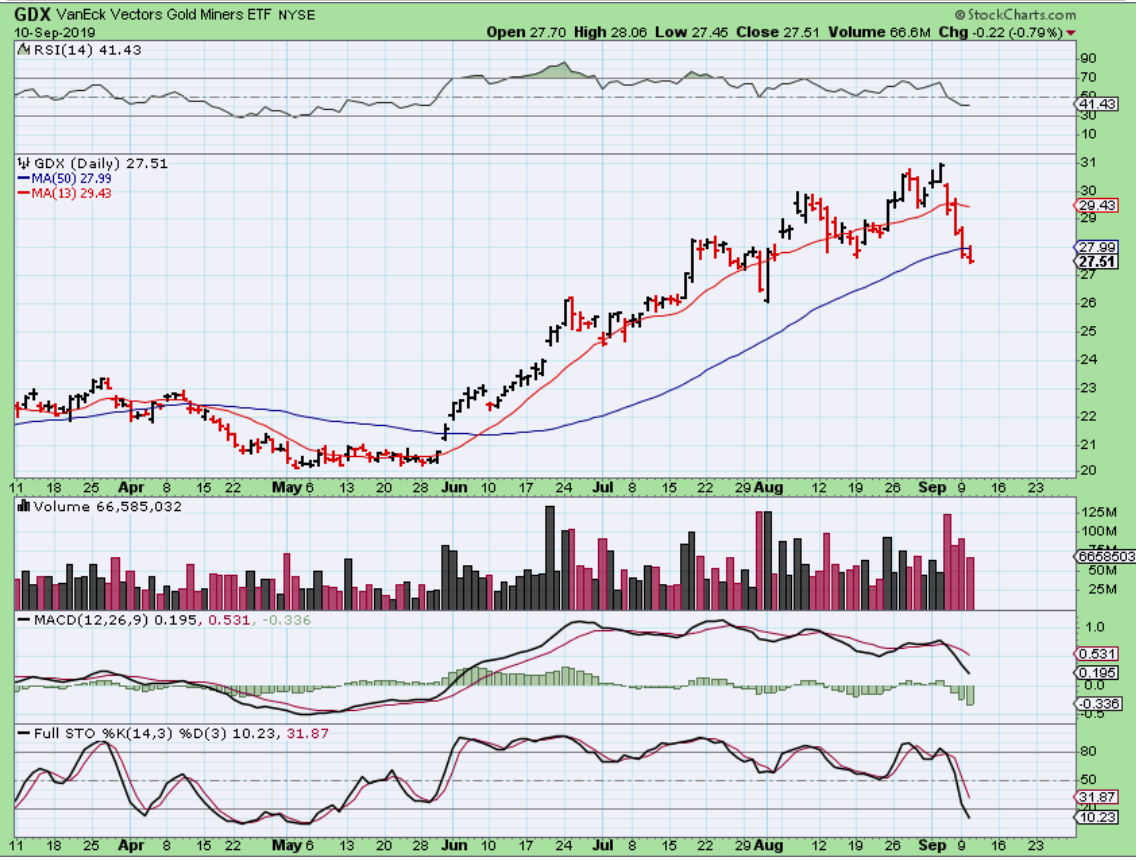
GDX – GDX closed below the 50sma. If the Bull continues, this may end up being a shake out in hindsight later on.
.
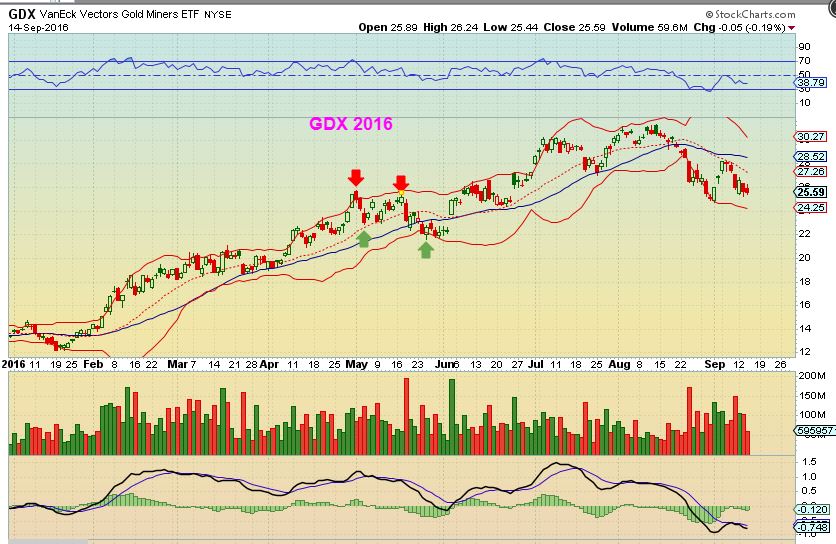
Just a sidenote: GDX in 2016 closed below the 50 sma for I think 8 days before resuming its run higher.
.
There really wasn’t a lot of change yesterday. We have movement and action, but the cycle count is just 1 day older in Miners and I’ve already discusses that Miners can bounce & drop again or drift and bottom somewhere around the FOMC Mtg, so we are just waiting for signs of a change.
Energy stocks took off higher again on Tuesday. Some looked fine while others pulled back as the day went on, likely because Oil pulled back. I’ll touch on that a bit below. Wednesday is Oil inventory report, so we’ll see what happens after that is released. You have 1 hr after the US Open to make any changes if you wish to do so.
.
Enjoy your Wednesday trading!
.
~ALEX
.
I posted a number of Energy Stocks yesterday and some continued higher, some popped & dropped, so I want to briefly discuss that here first . For example:
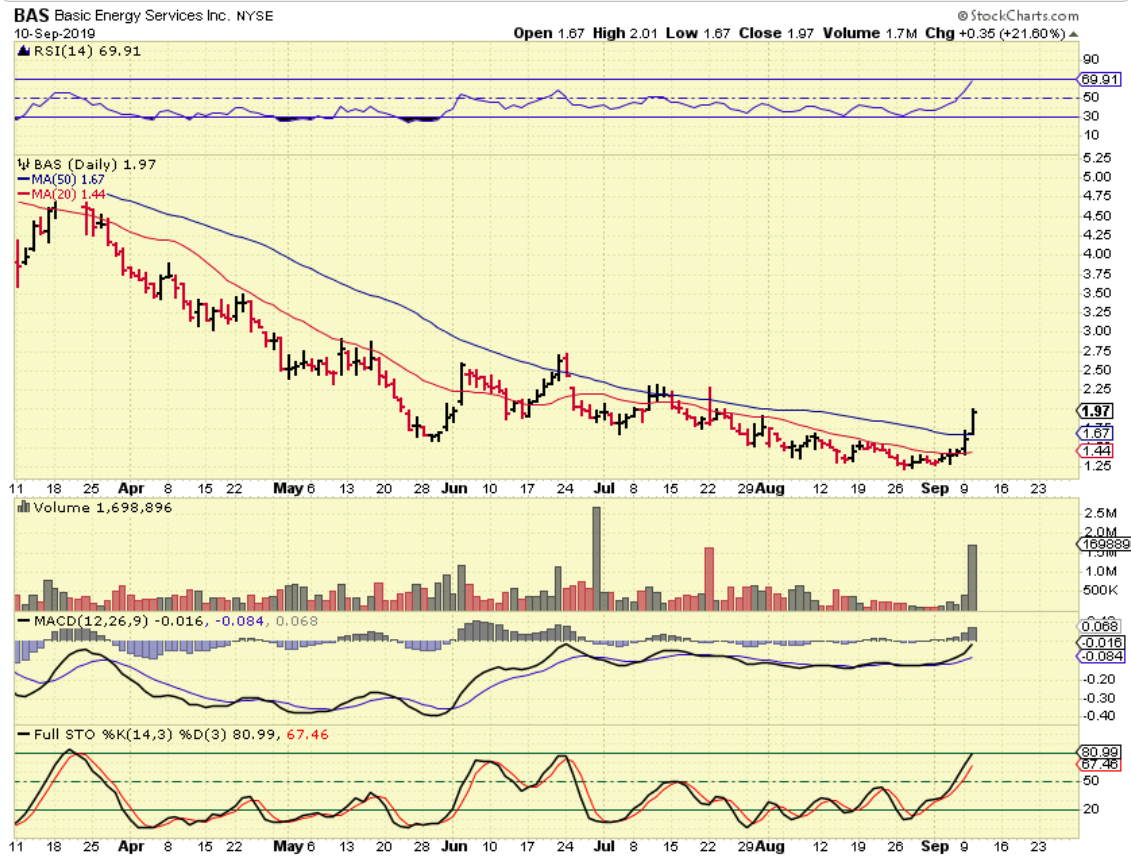
BAS – Bas Popped out of a base, and here we see that it continued higher and closed up another 21+%.
.
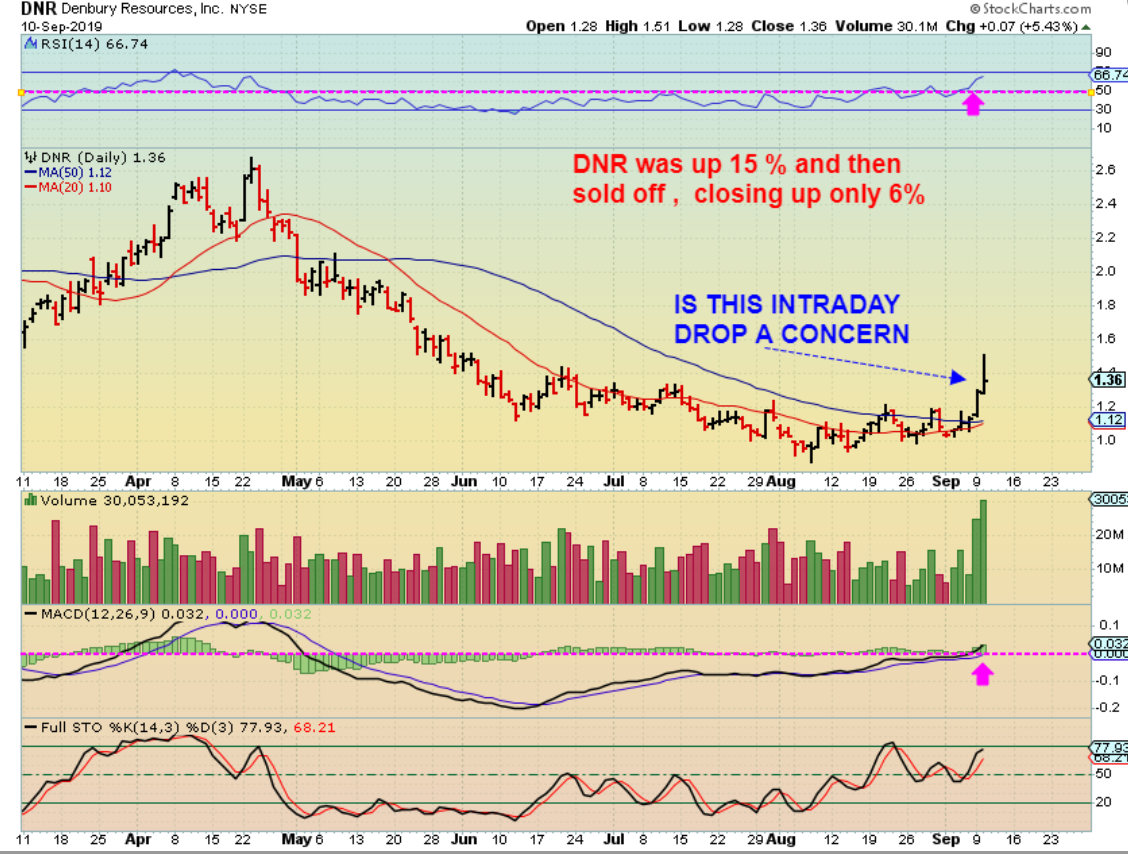
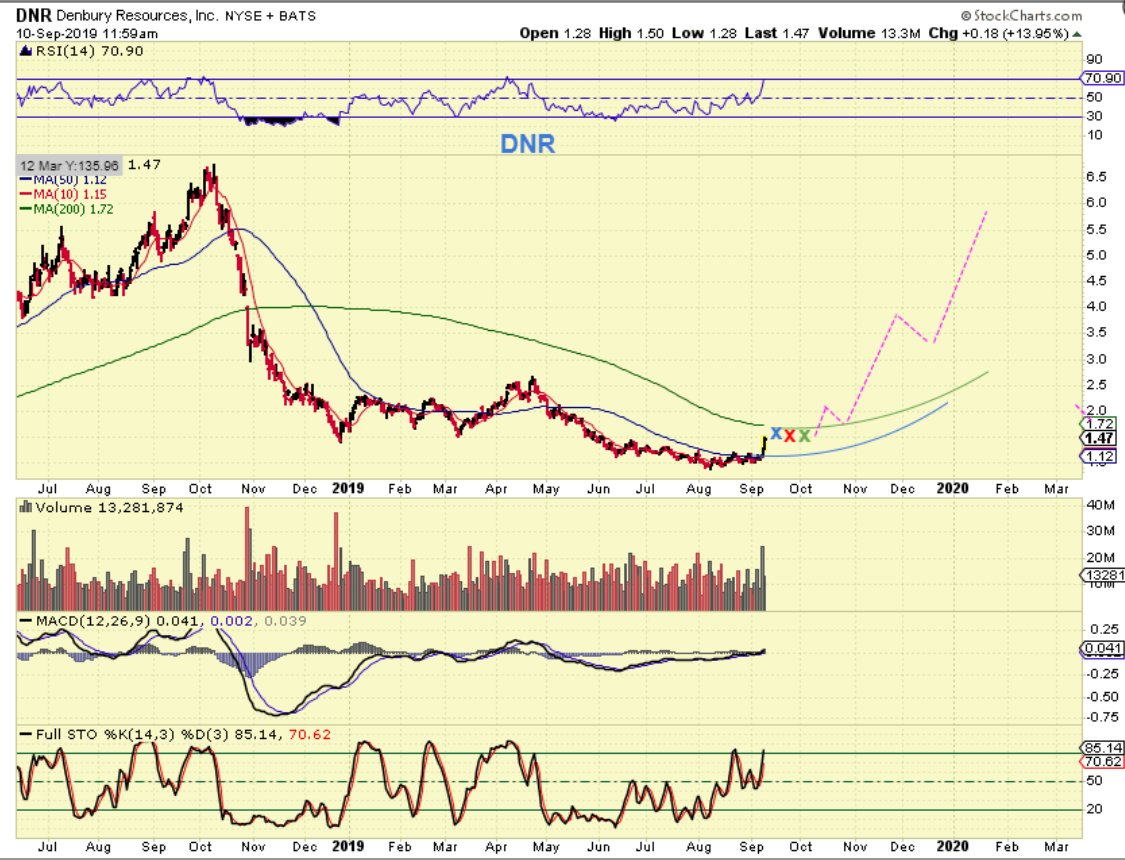
DNR– I have been pointing out DNR and after a nice bullish break out, it Popped & reversed Tuesday. I was asked if I am concerned about that candle? See the chart. It does not bother me at this point , I’ll show you why..
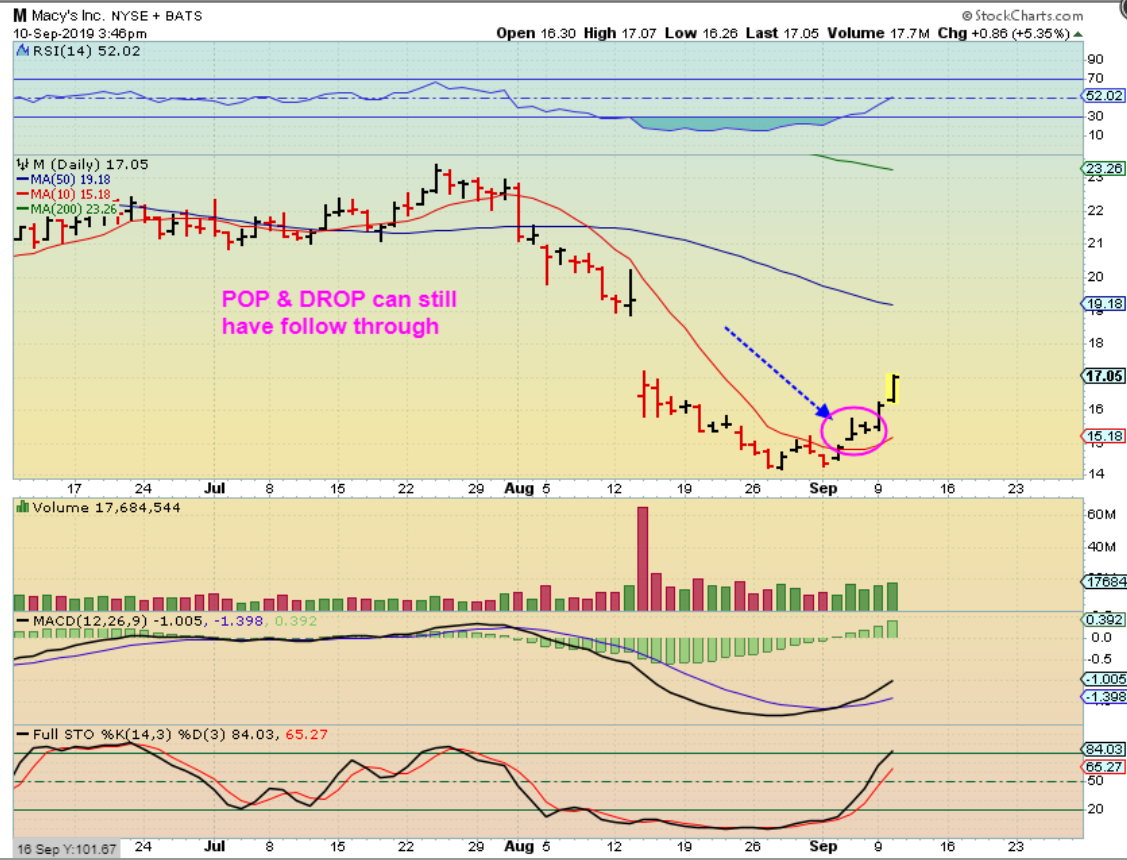
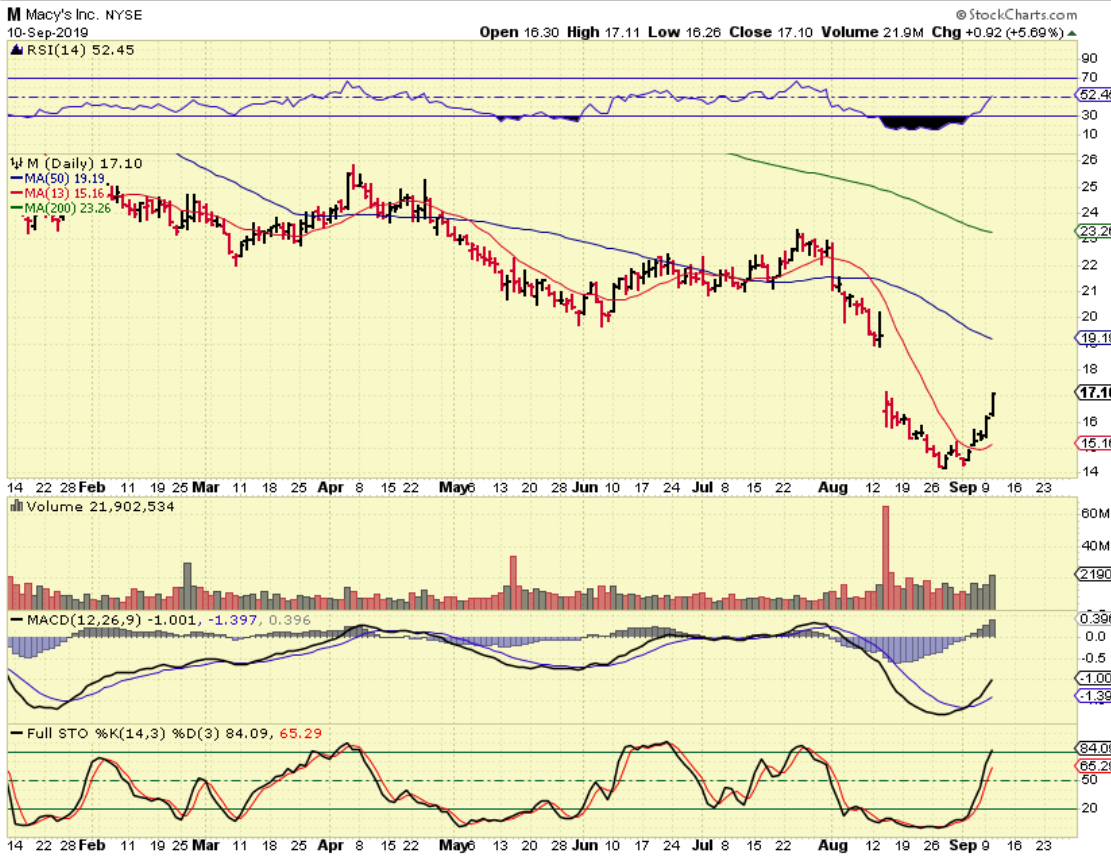
M – Notice that MACY’S had the same candle formation out of the base. I have seen this often with profit taking right out of a base, but it can still continue higher. Macy’s popped & pulled back , but then it merely stalled for a day or 2 and then continued higher. So we’ll just see what happens with DNR, but…
.
DNR- It has great potential if it remains bullish. I was expecting possibly a run to the 200sma on many of these, and then a squeeze play or crawl before breaking higher. We’ll see what the OIL INVENTORY REPORT does to Oil today.
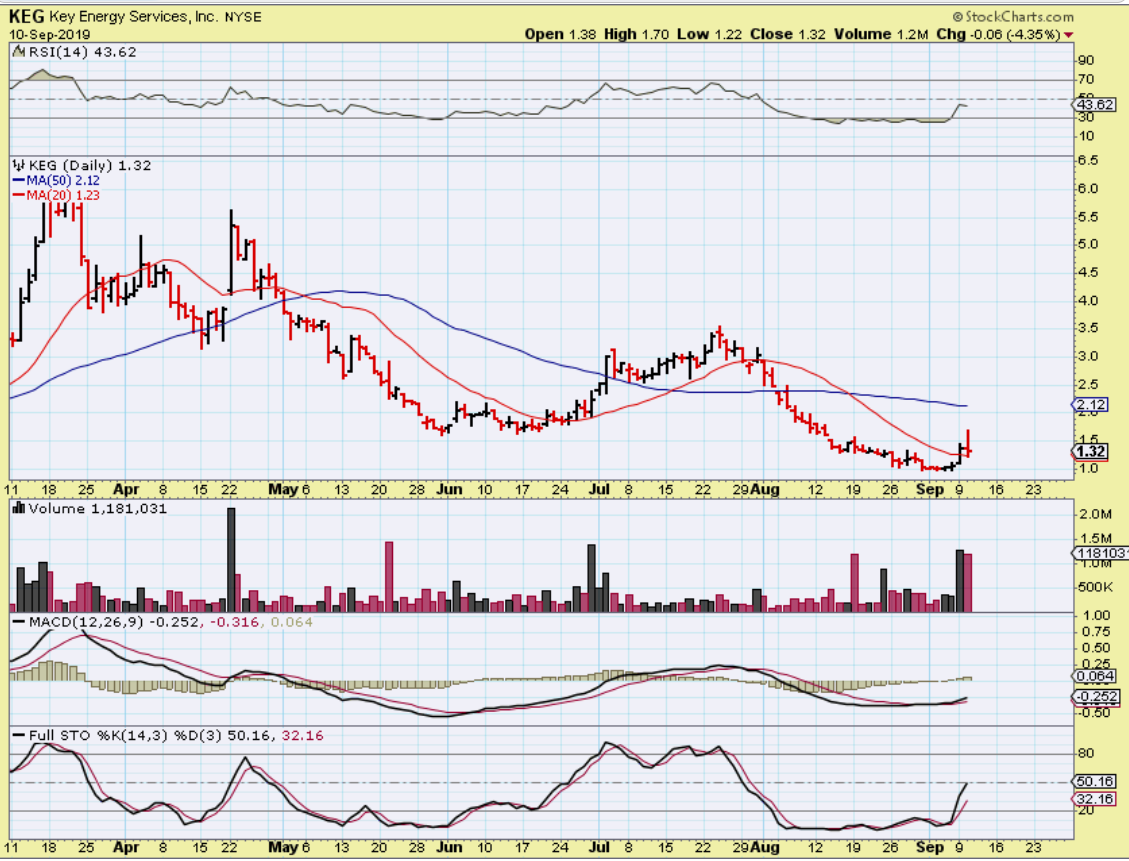
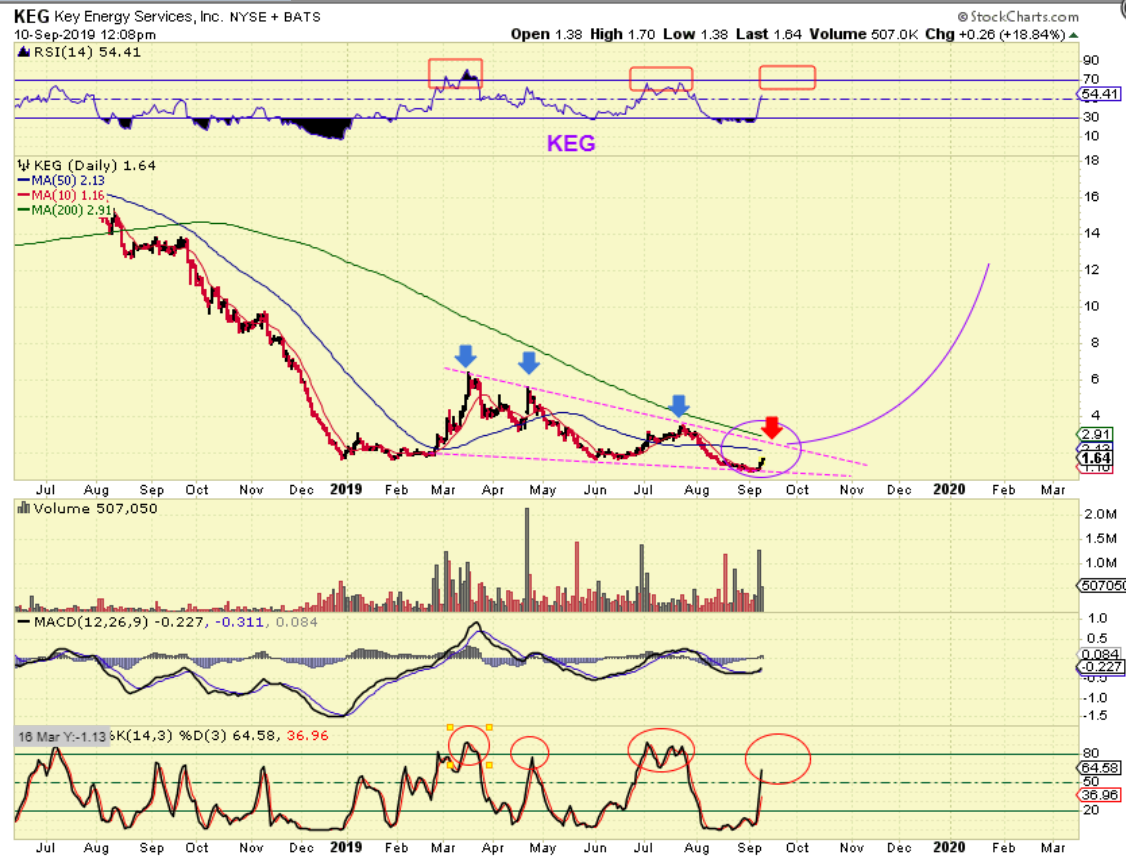
KEG – Keg ran up in the morning another 20%, but then it too sold off too. 🙁 It is still oversold and could rally from here to the 50sma as expected, we’ll see…
.
KEG – It was another one that is beaten down and looked like it should run to the 200sma before seriously stalling, so at this point I am watching that inventory report.
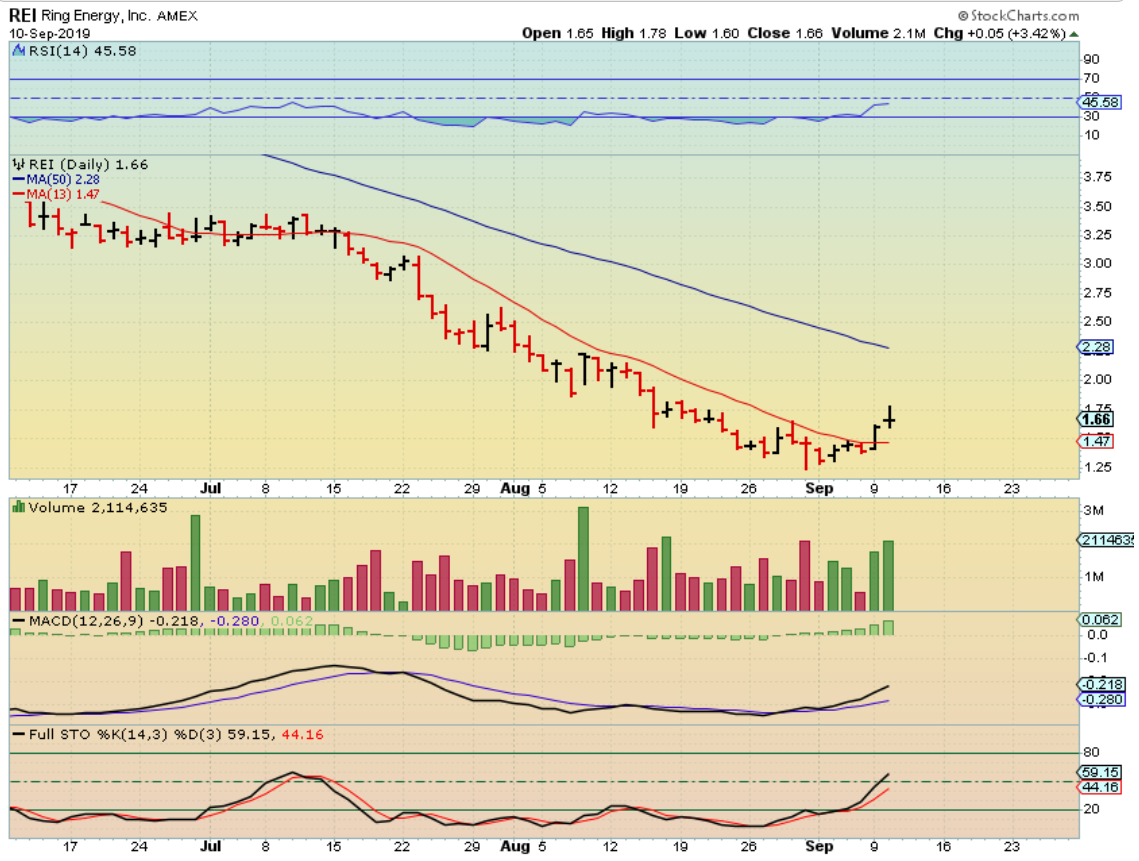
REI – I bought this one after Tammie mentioned it, and I do like it at this point. I like the volume swelling as it broke the 10 sma and I can use a stop under Mondays lows.
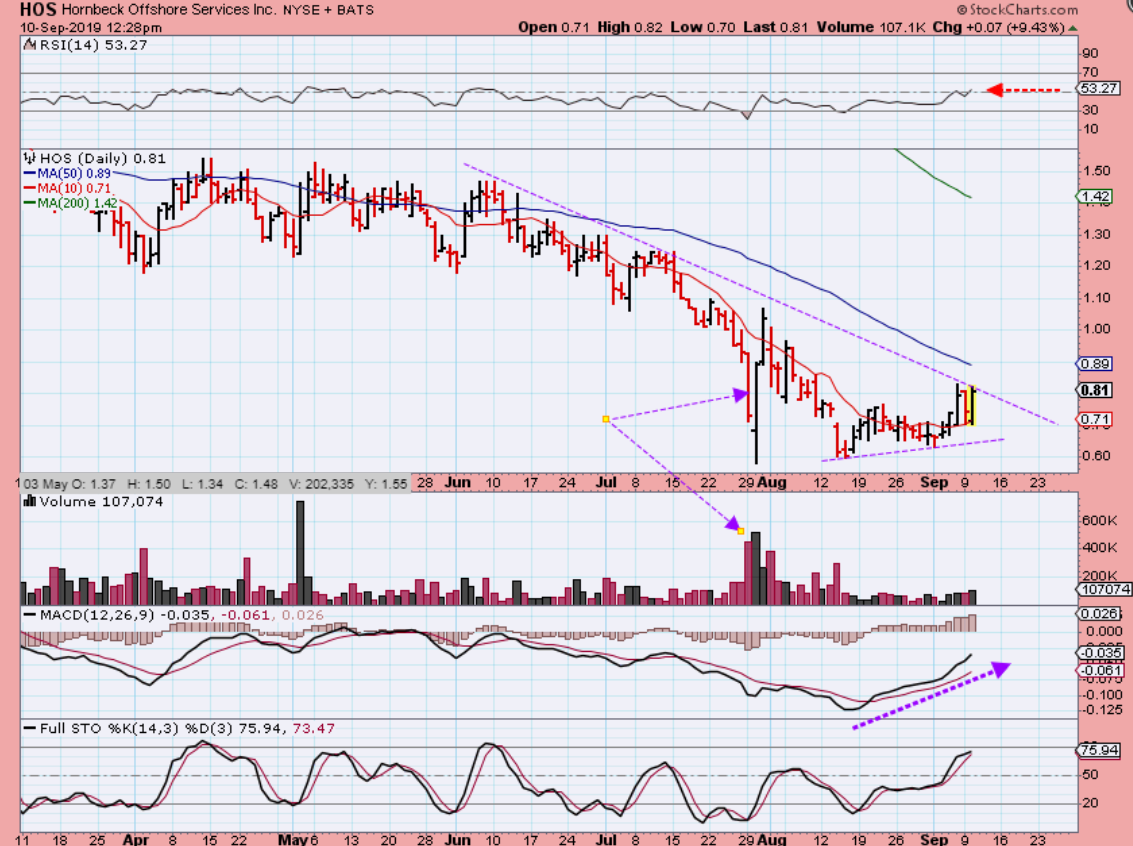
HOS – Hos is another energy stock that has a great MACD divergence. I don’t own it, but I do think that it can be bought if the sector remains bullish after that inventory report.
RETAIL STORES – I don’t really know why, but after reading how ‘Amazon has killed all of the retail shops’, they seem to have bottomed and are making good %-Gains. IT MAY JUST BE ANOTHER BOUNCE, so a lot of this is for short term traders, as you’ll see.
In many you will see a major multi-month sell off, now being followed by some strong moves out of the lows this week. Let’s take a look and remember that not all are currently set up as low risk trades, but putting them on your watch list for a pullback or support area may be worth it. Experienced Scalpers may trade them too.
..
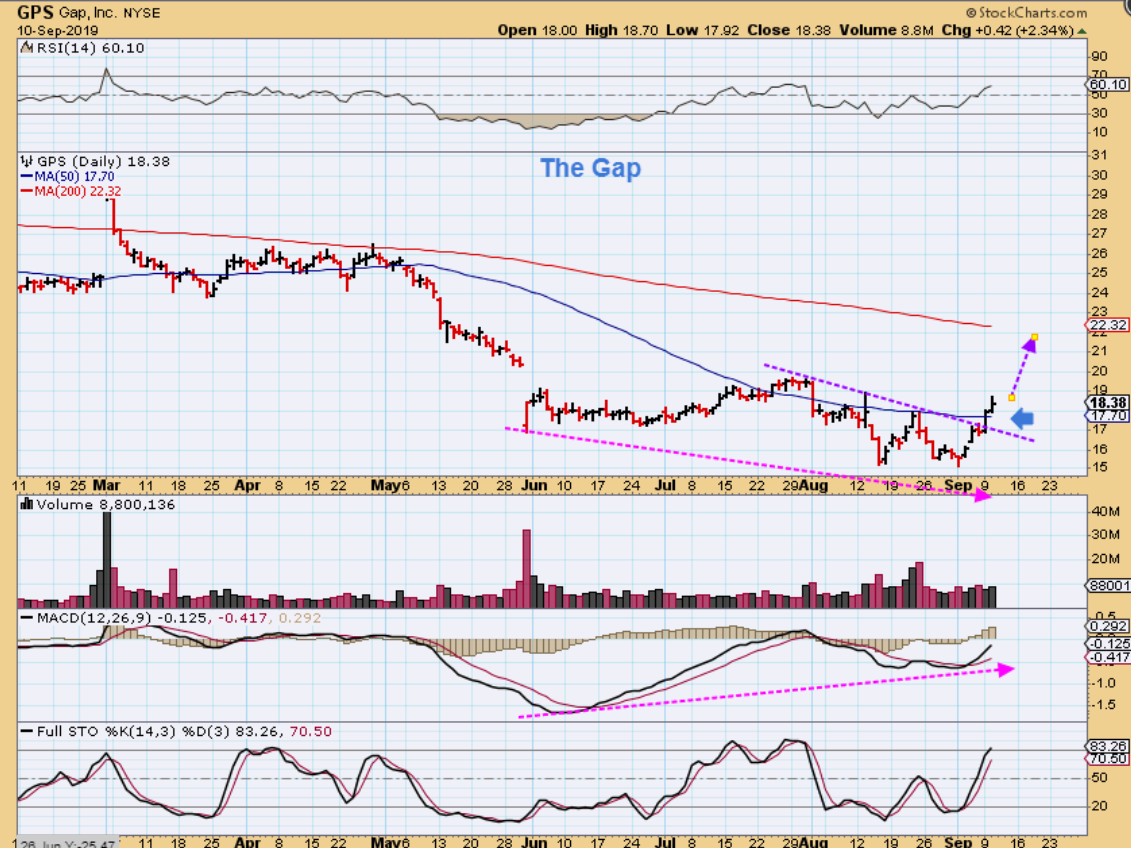
GPS – The Gap has formed a base and broke a short term down trend line & the 50sma. A run to the 200sma would be a nice gain, $18-$22. The set up looks good and the General markets may be moving higher to recent highs too. I am short term bullish on some retail stores.
.
M – Macy’s is recovering from a crash and looks ready to do a quick gap fill on the way to the 50sma. I think that a short term day trader could work with this, others may want to wait for a less risky set up ( like if it does a pull back to the 10sma first).
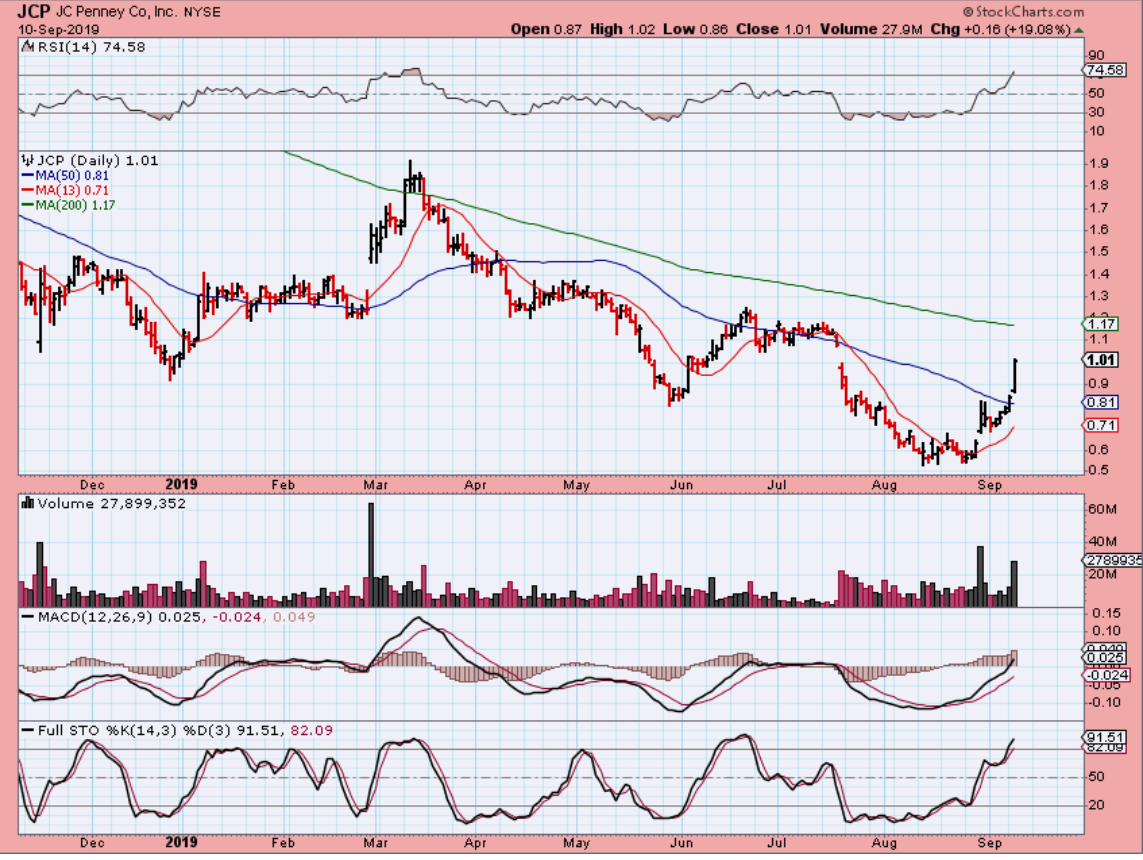
JCP – Let’s be honest- this has been a bearish downtrend, but if the sector can recover, it does have upside potential. JCP was trading under $1. So far I see 3 pretty equal length rallies ( 1 in March, June, and now). If it continues higher and can get above the 200sma, that may start a change of character worth noting.
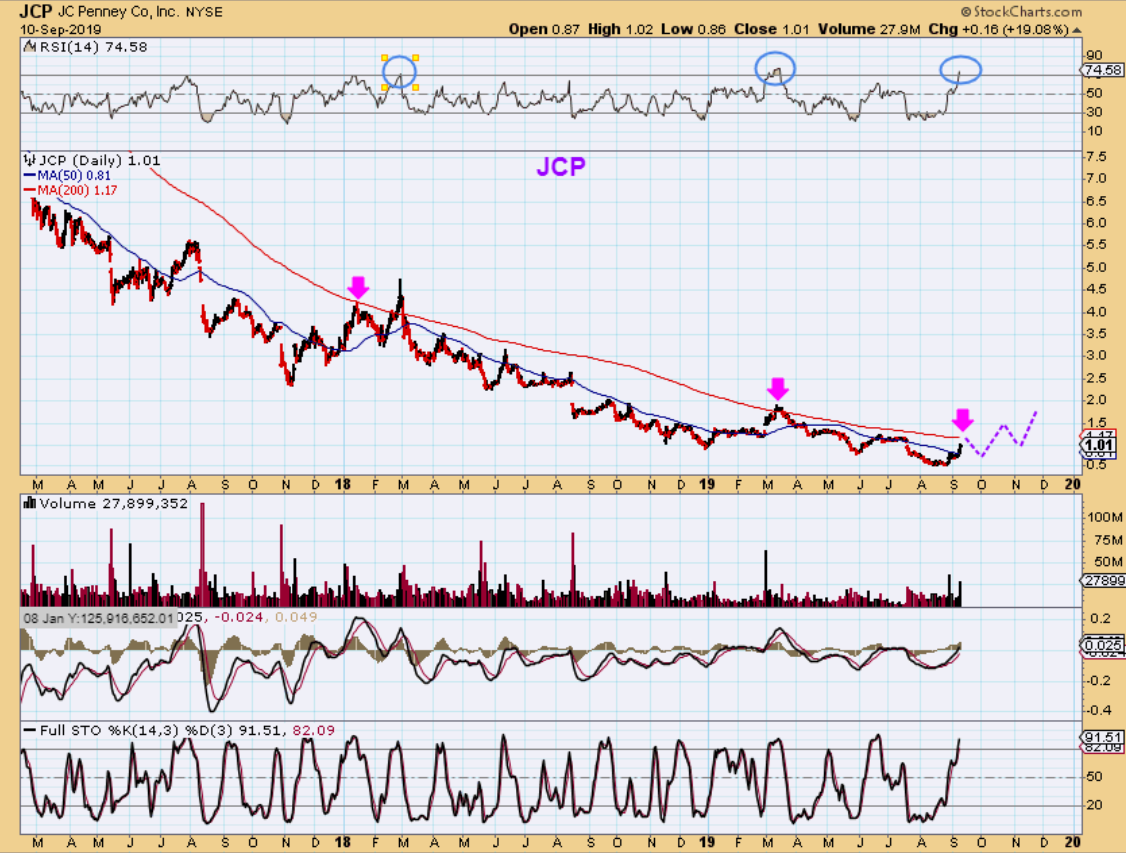
JCP – So in the bigger picture you can see many false rallies in the past to the 50 or 200 sma, and this may be no different, so I am talking about ‘short term traders’ or ‘putting it on a watch list and watching for a recovery’.
.
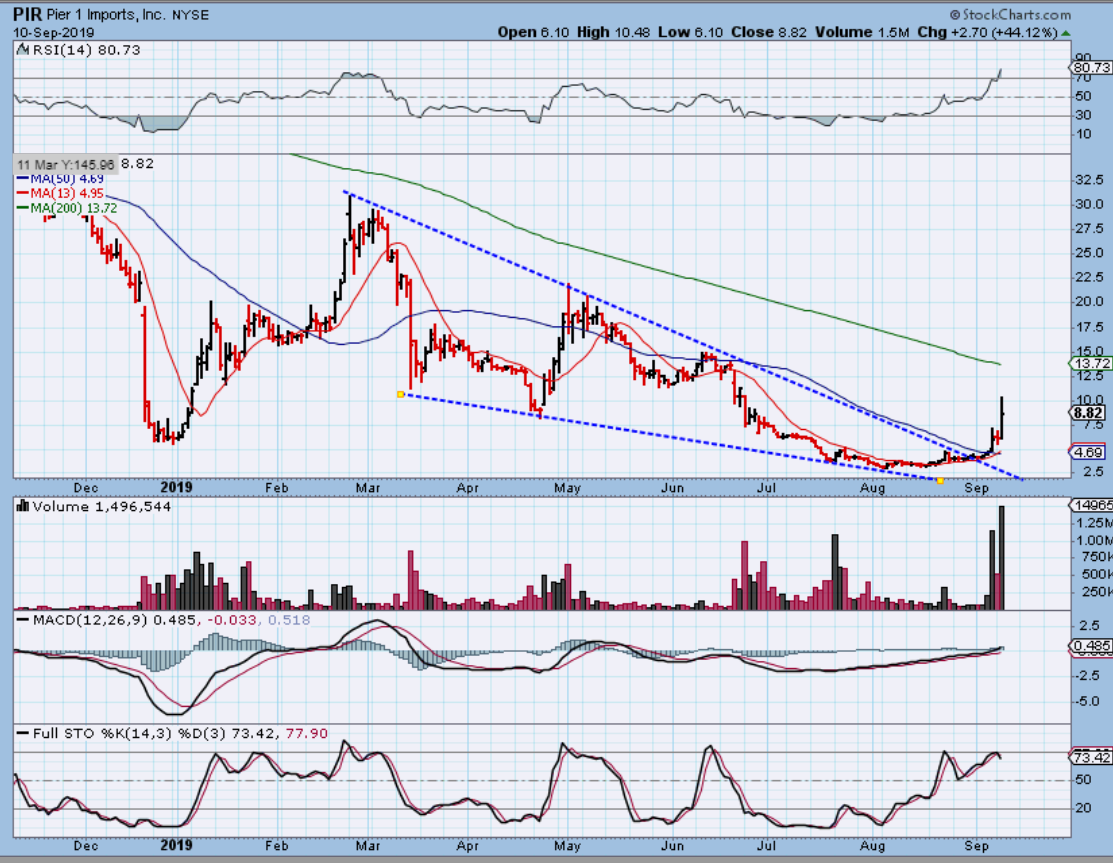
PIR – Did Pier One just go from $2.50 in August to $10.50 yesterday? Due to a reverse 1:20 split, it did. Short term day traders may find that a run to the 200sma makes great gains, but a pull back first could really hurt too – so this is for faster traders/ scalpers with experience maybe like Rocky or JT.
.
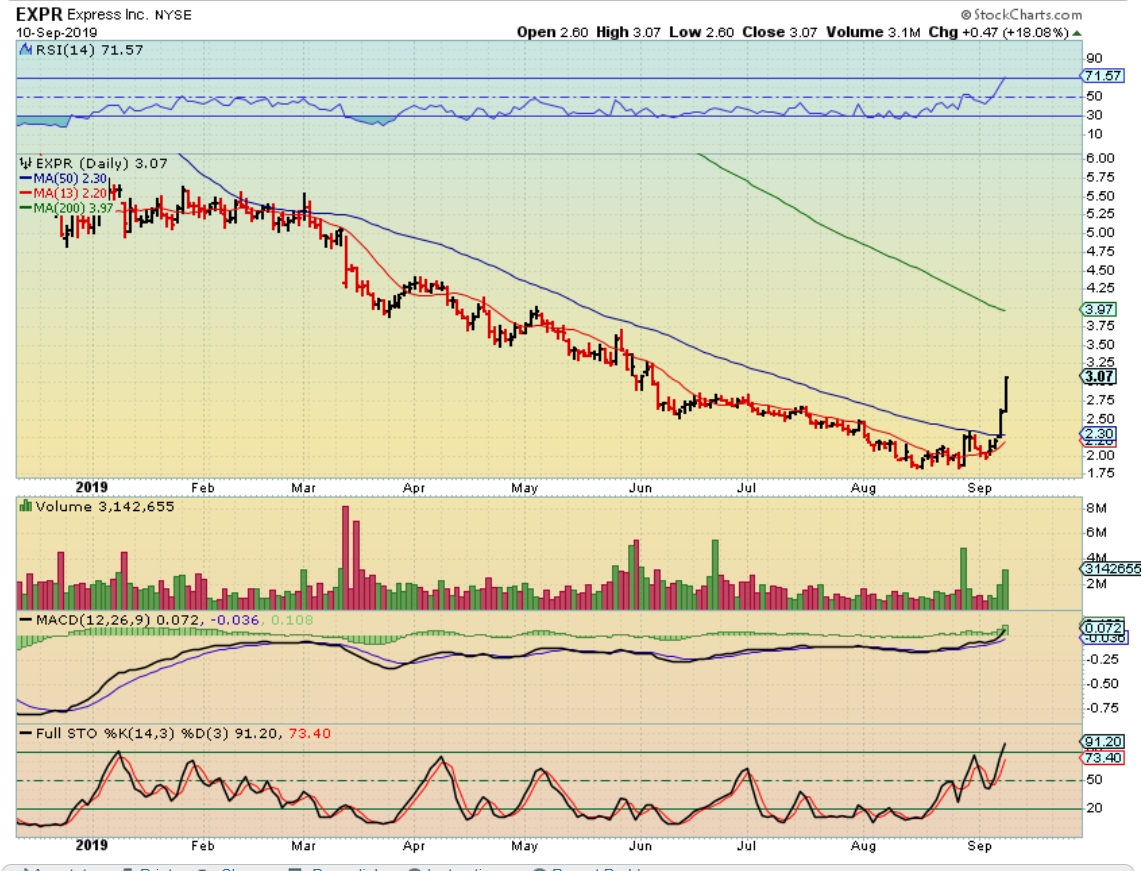
EXPR– EXPR traded at $12 last year, but has had a rough time in 2018. Suddenly it broke the downtrend & 50sma and took off, putting in two 20% gainers in a row. Scalpers may be able to work with it, but others should see if it back tests the 50sma & THEN tries to get to the 200sma (watch list). The first POP to the 50sma in August was an earnings release pop, so this could be an attempt at a recovery.
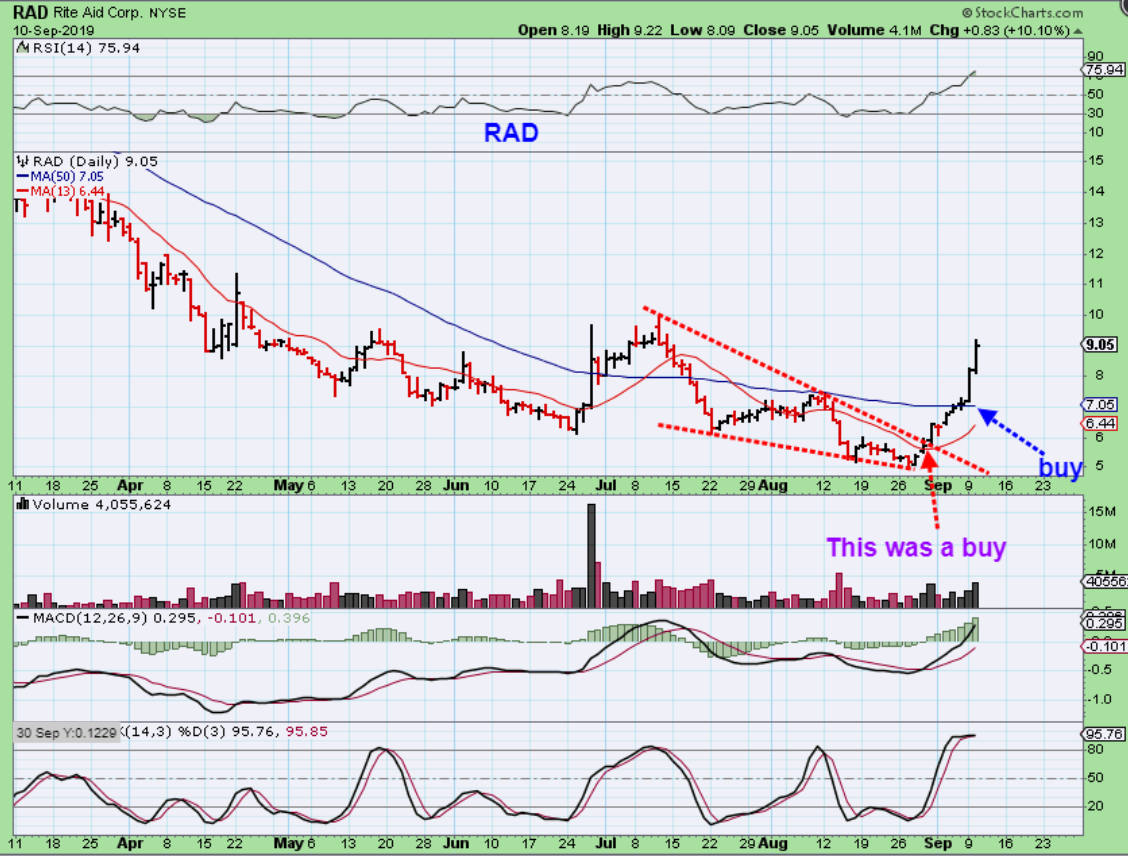
RAD – This is a nice run, but IT IS NOT A BUY here for the average trader. A back test of the 50sma would really hurt if you entered up here ( $9 to $7) , but if we do see a back test of the 50sma soon, that would be a buy if it reverses there.
.
I have occasionally mentioned stocks like HBM, FCX, AA, CLF, AKS, X, STLD, etc and other “Metals” in the past months, but they’ve been a bit choppy & difficult, a couple of them sold off, and they seem to be basing, not breaking out yet. That said, I haven’t really pursued that area with the Precious Metals doing so much better. There are still signs of possible ‘bottoming’ though , so I thought I’d revisit that area here.
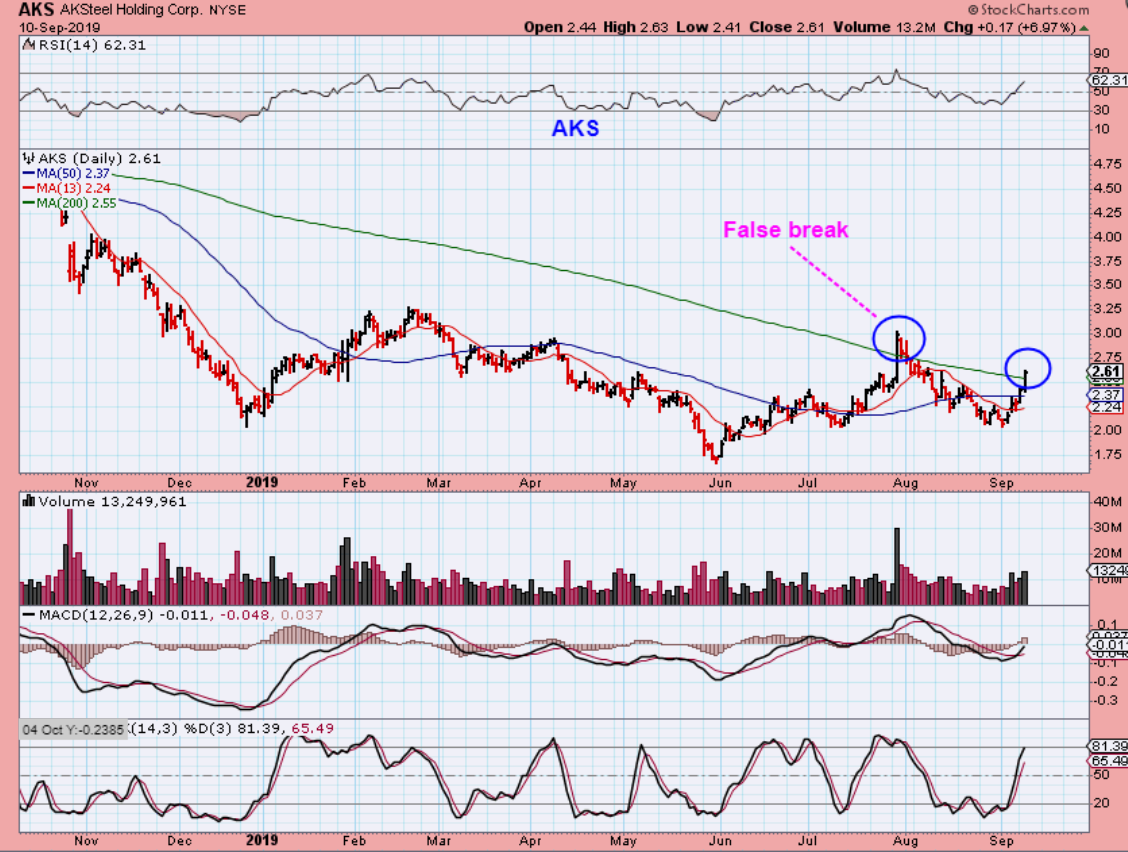
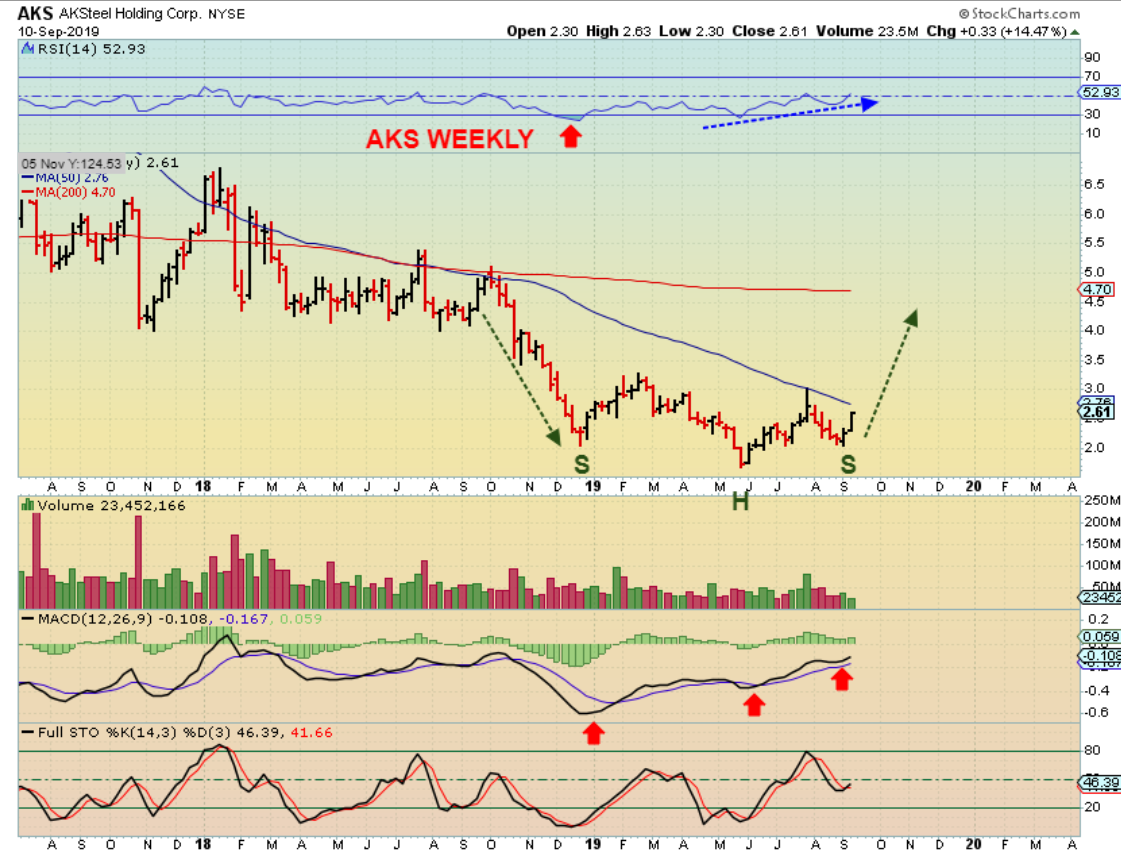
AKS – AKS seems to have a higher low and break of the 50sma. This would be a nice long 9 month base so far. It is now trying to break the longer term resistance of the 200 sma again. It failed last time, so Why is this interesting looking or even good looking to me? …
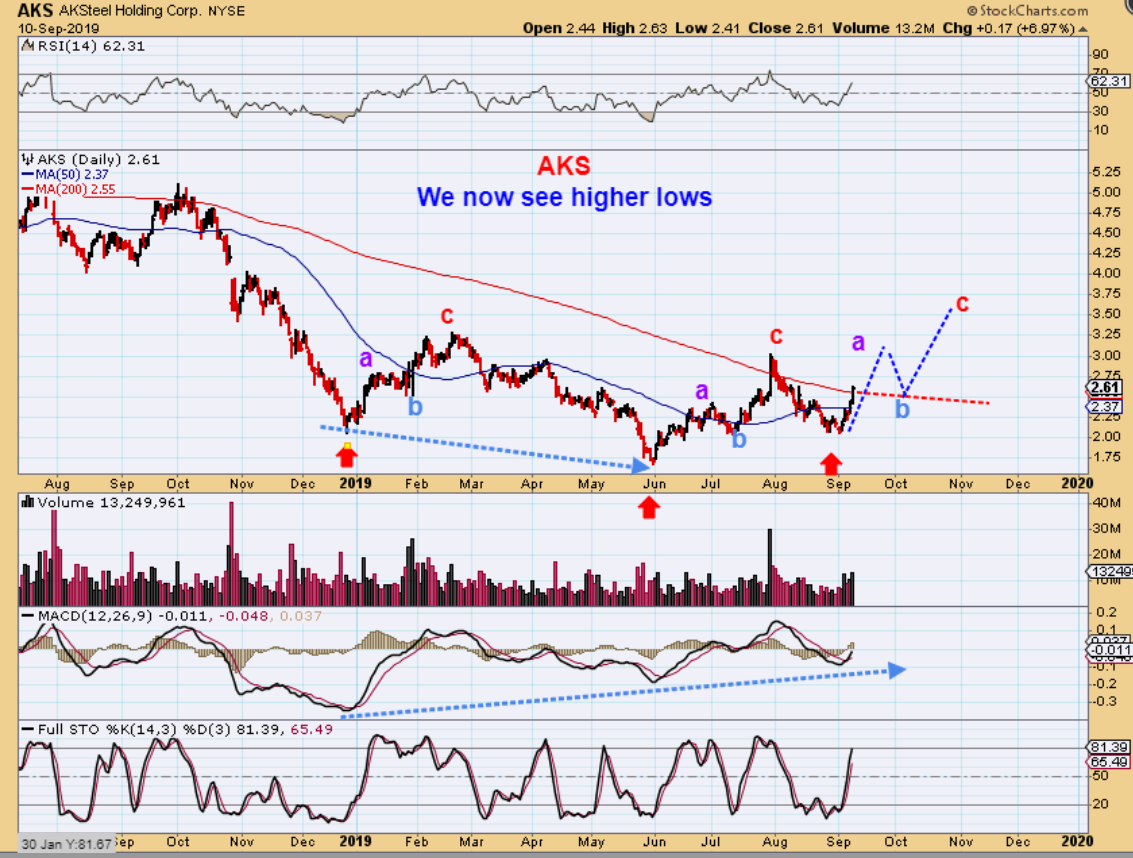
AKS – AKS has moved higher in a-b-c type waves higher. I now see a higher low and strong MACD, so this attempt to break that 200sma & Hold there or even rally is better positioned. It is a bullish set up and the Base may be completing. It could be bought with a fairly tight stop.
AKS WEEKLY – and the weekly also shows constructive signs of improvement, so it may just be a matter of time until Commodities and those other ‘metals’ begin to act more bullishly too. ( USD DROP?).
.
X – US STEEL is in a downtrend too, but a large Bullish Descending Wedge may be setting up here. You can see how this could quickly go from $10 to $20 or $30 if this sector turns bullish.
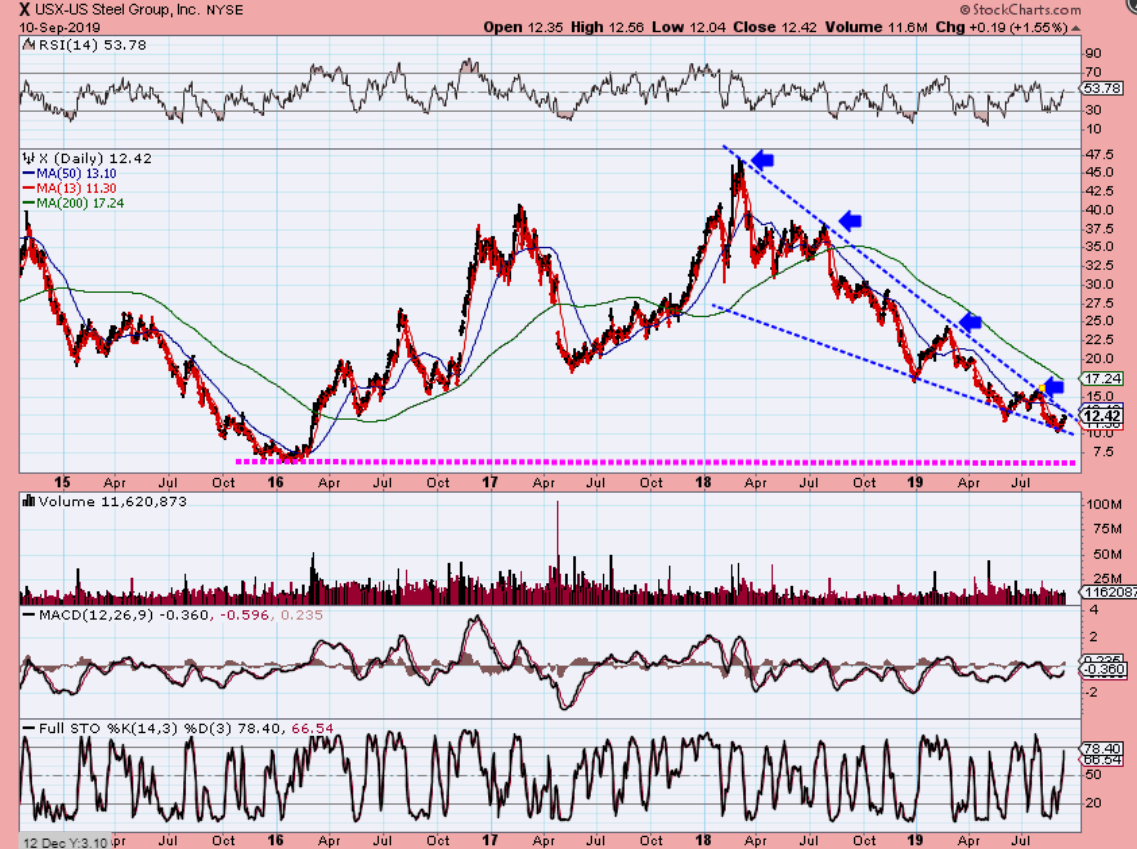
–By request from Rocky, this chart is actually an EXCELLENT Set up.
In fact, this is one of my absolute favorite long term set ups, but I need to read about the company and do research too, since I do not know the company at all. Lets look at the short & long term charts.
.
MAXR – At a glance it looks a bit choppy and hard to hold. We see strong runs higher that gained the 50sma in May & then it dropped down & lost it again. Since each prior run higher lasted for a couple of weeks, Yesterdays break of the 50 & 200 sma could find follow through over $10 actually…
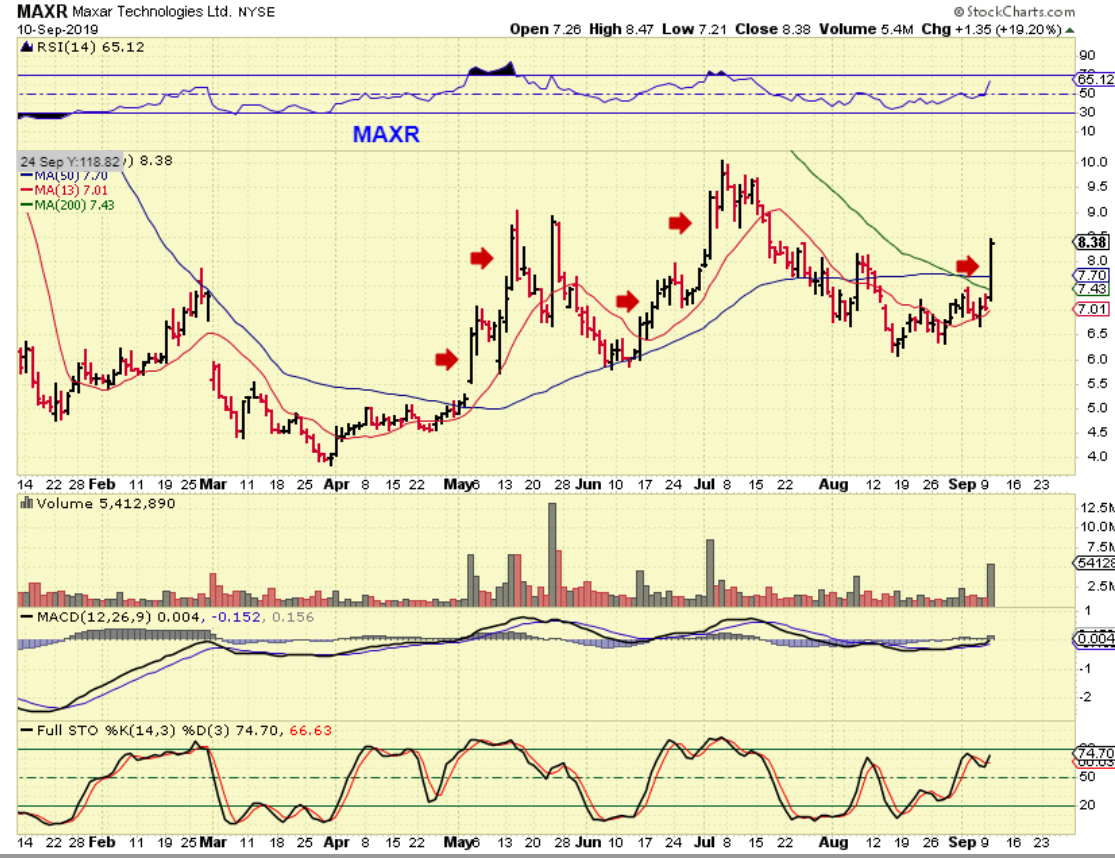
MAXR – Stepping back you now see a much better picture of what is taking place. MAXR is putting in a LONG 8-9 month base and the break over the 50 & 200sma looks quite bullish. Technical traders will like this if they see it. This looks rather excellent, but Stepping back further…
.
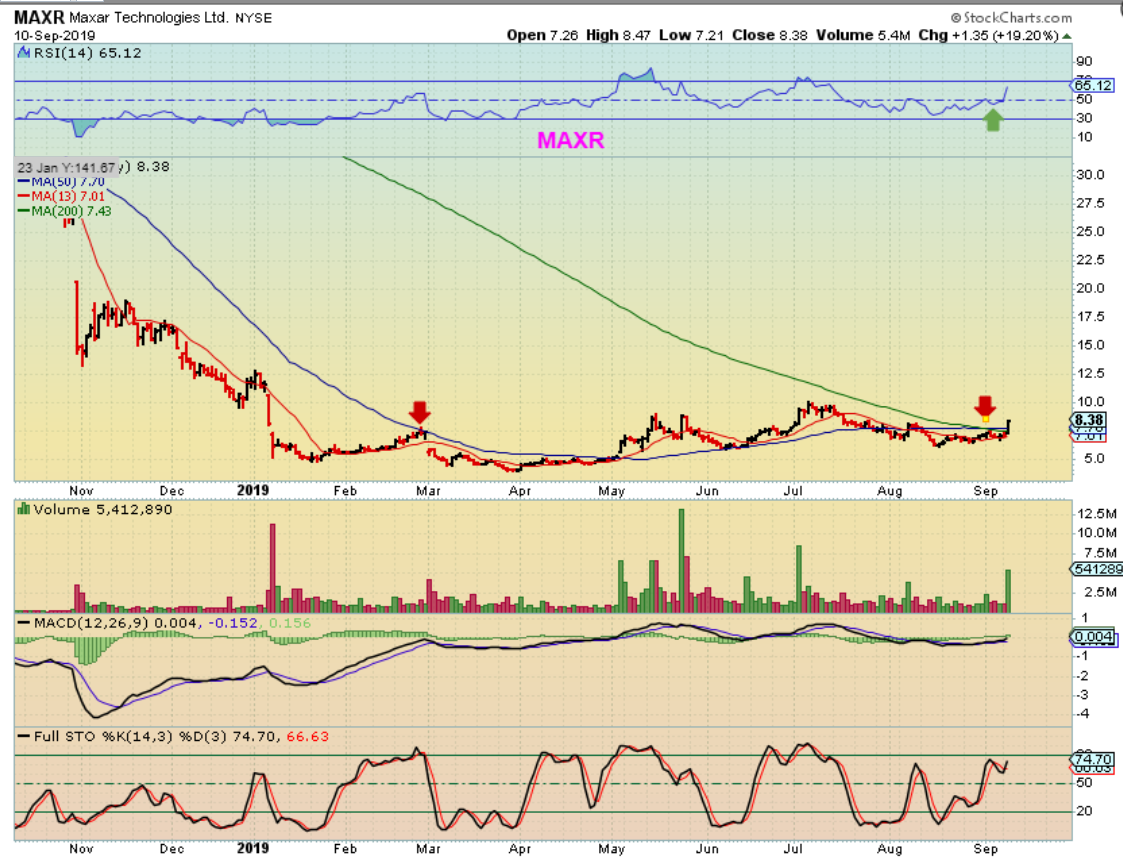
MAXR – I love this chart. This has price in a longer term Bullish set up. It is above the weekly 10 & 30 ma and that volume (weekly chart) only represents 2 days this week. THIS is what I meant when I said that this type of chart is one of my absolute favorites. It is a longer term Buy & Hold as long as it continues to act correctly.
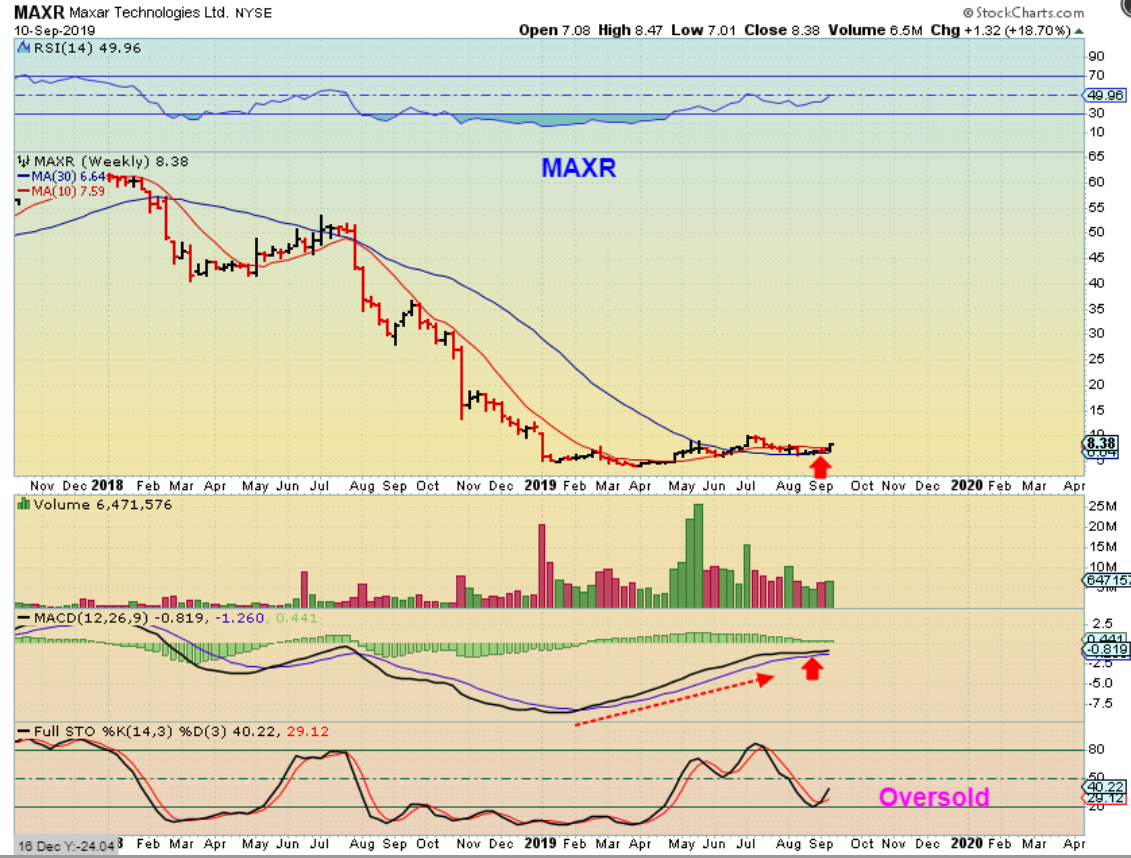
Any set up can fail, but this is definitely one of my favorites. Yes, it has been 8 months of choppy sideways action on a daily chart and some of that choppiness may not be finished, but this chart can perform very well if it starts running higher. Keep this on your watch list Chris 😉
.
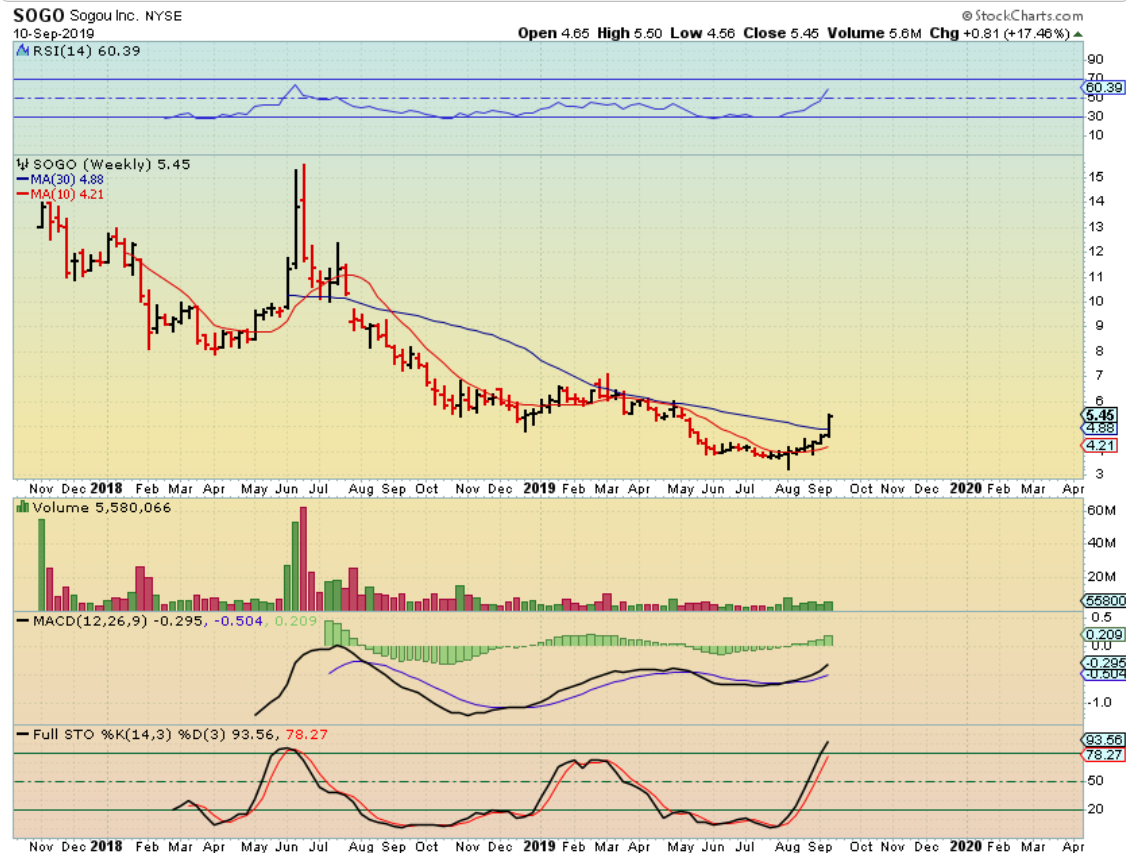
SOGO is great too, but the daily is too extended for me to say that it is safe to entry, so a pull back would be a buy