Tuesday September 9th – Energized
SPX – Day 24 was a slightly new high , but price has stalled above the 50sma so far. We should make it to former highs in this daily cycle, but we might dip down & back test the 50 sma & 10 sma & also ‘gap fill’ before doing so too. This doesn’t really look weak, because both the RSI & MACD are bullishly alighned and…
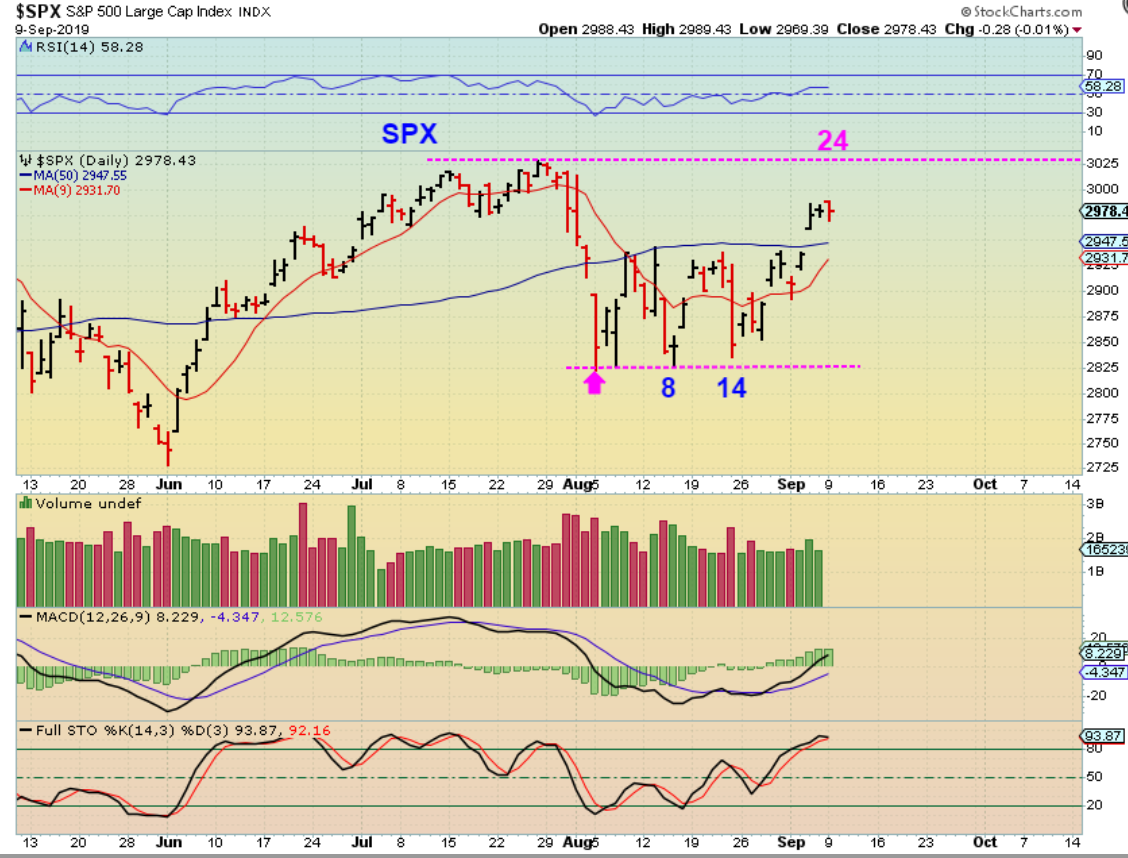
.
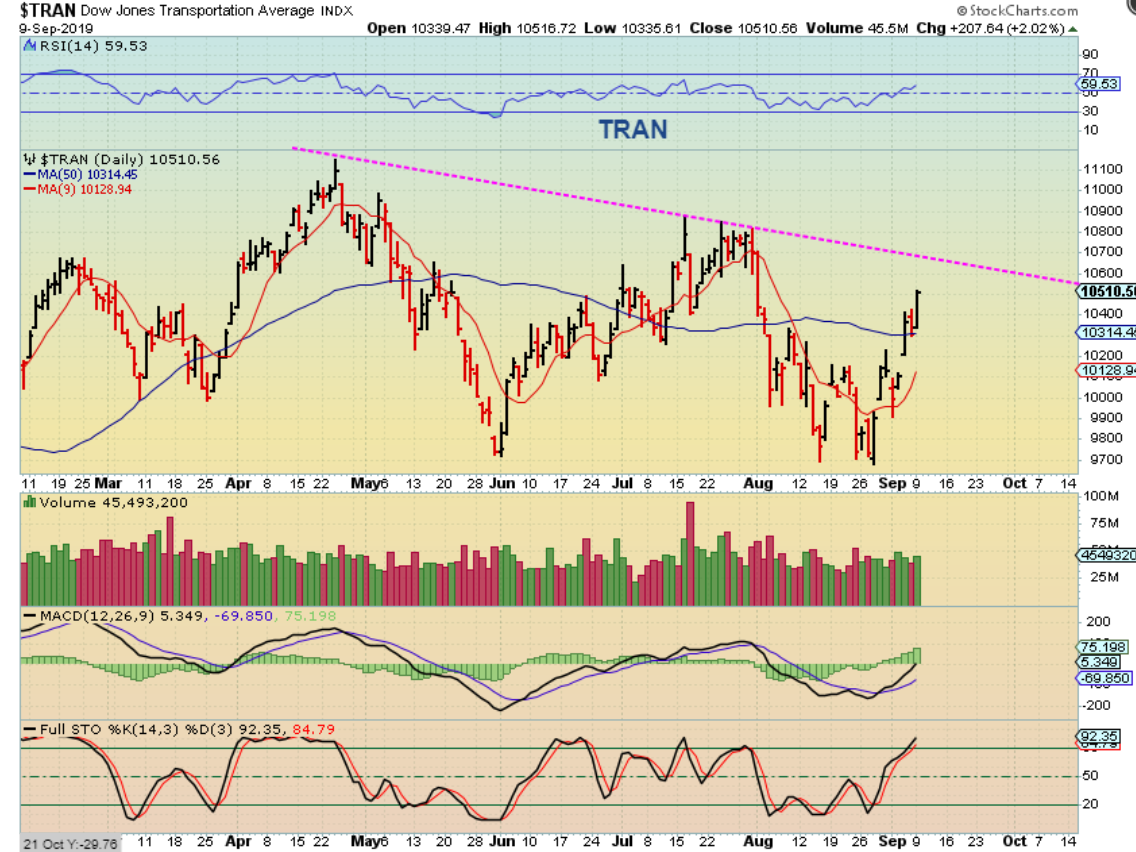
TRAN – TRANSPORTS & The RUSSELL 2000 closed near the highs.
.
WTIC – I think that OIL Is finally pushing through to a break out, and when Oil gets going, it really could run strongly to the former highs. Think about this sideways chop for 3 months as a base, and you begin to see that Oil really could get going. Let’s dig a bit deeper.
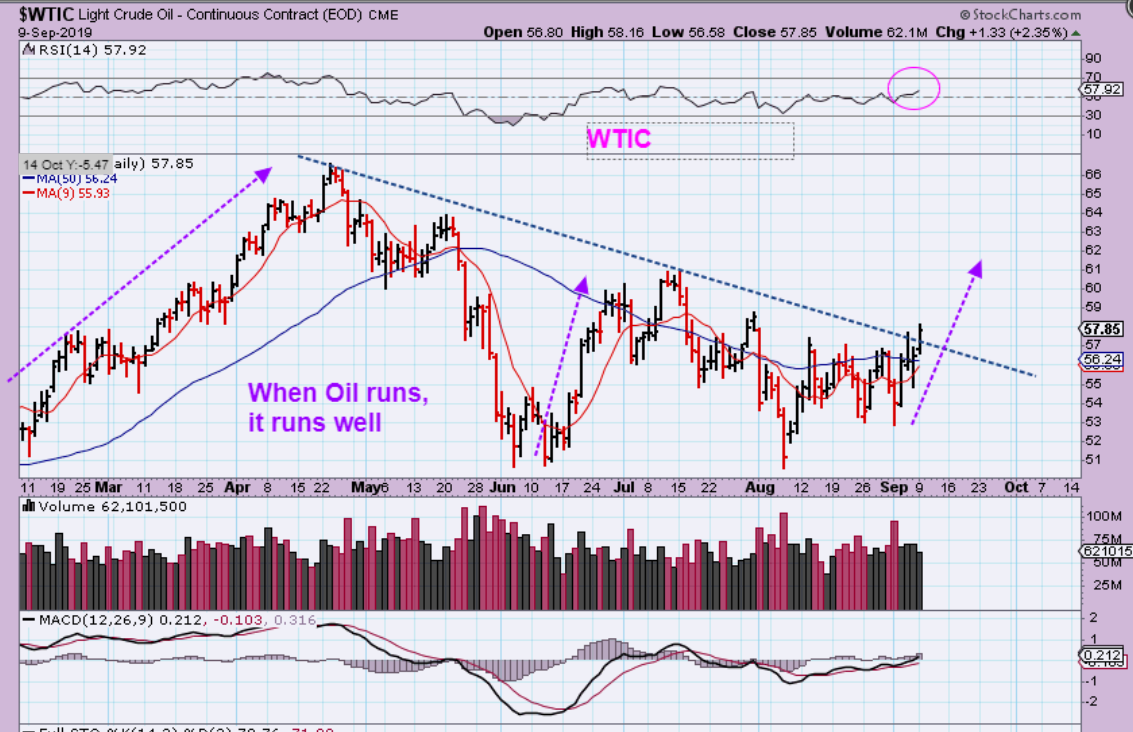
.
And that break out by oil seems to be being confirmed by many of the Energy stocks leading the way. I have mentioned buying them in past reports, as low risk due to them still being at the lows & bases. We bought Miners in the lows in MAY and rode many up 50 – 100%. I will discuss that & some new set ups later in the report.
.
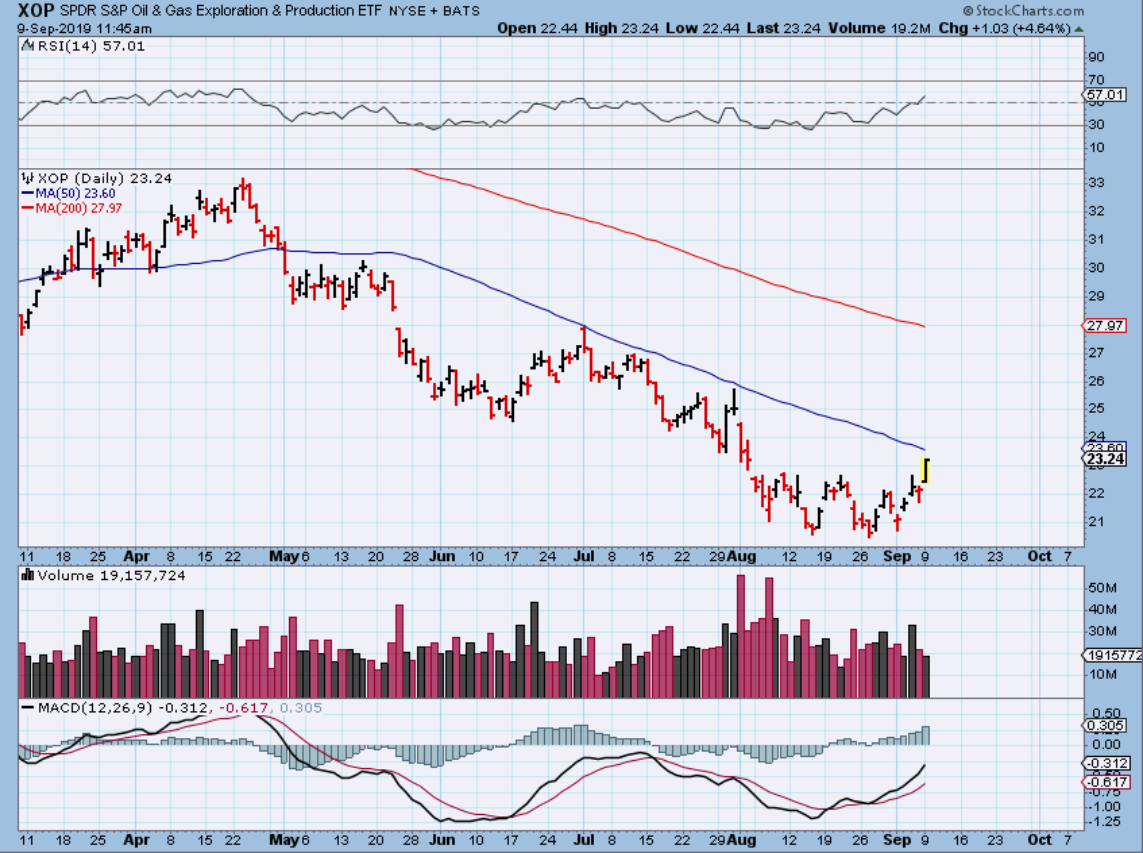
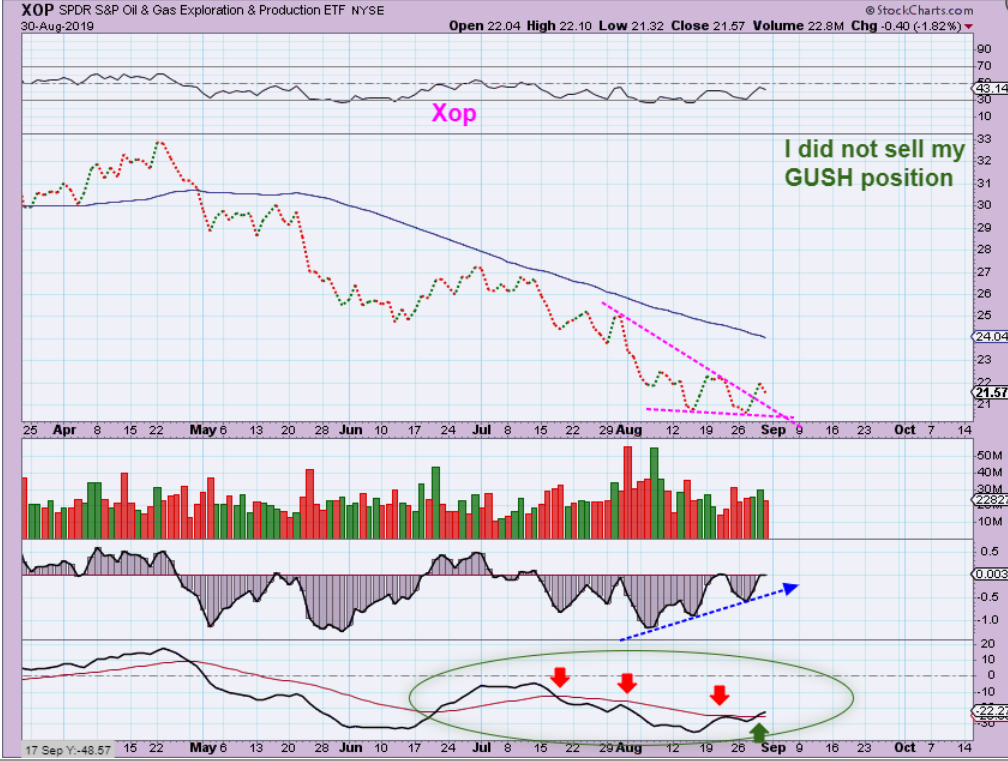
XOP #1– I Posted this in the morning, simply to say: ” If you bought GUSH when I did, this 50 sma for XOP is an ‘initial target’. It MIGHT stall at the 50sma when it gets there.” That said, some may want to-
1. lighten up on GUSH?
2. Sell 1/2? Get out to lock in gains?
3. Hold & see if it can break out? As the day moved on…
.
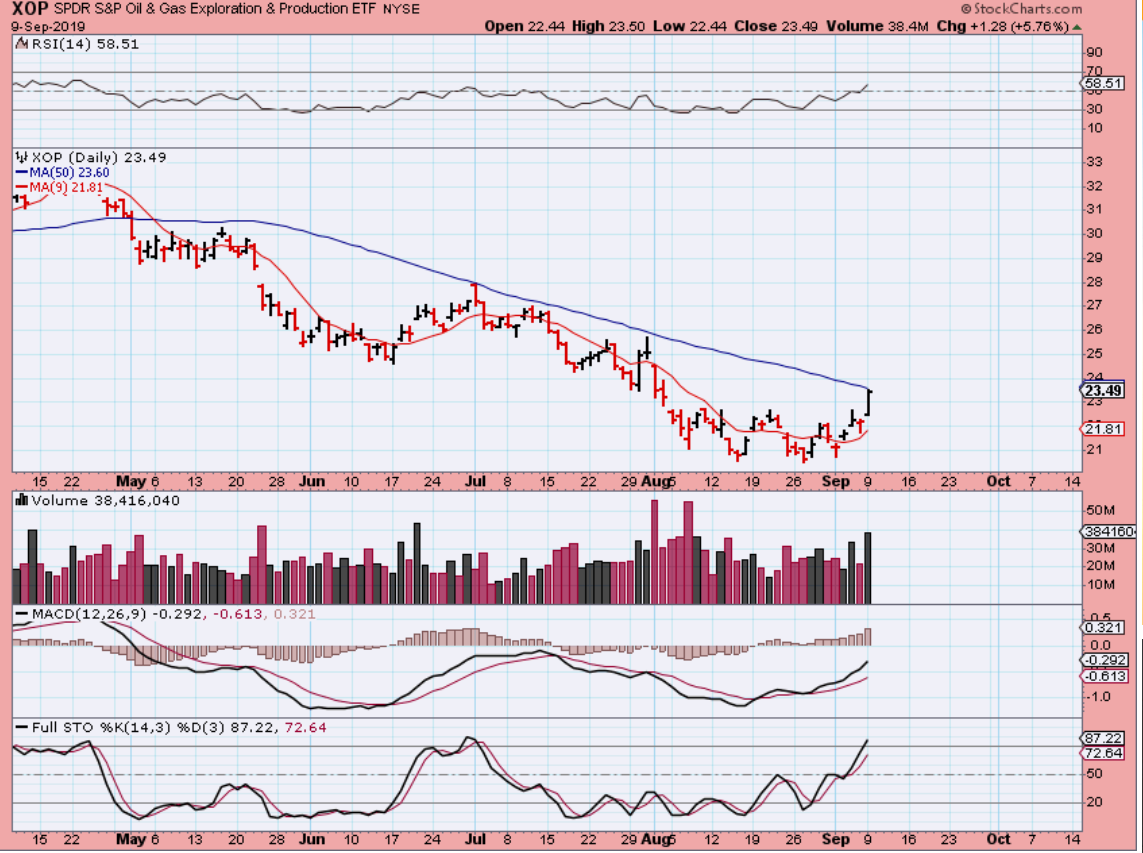
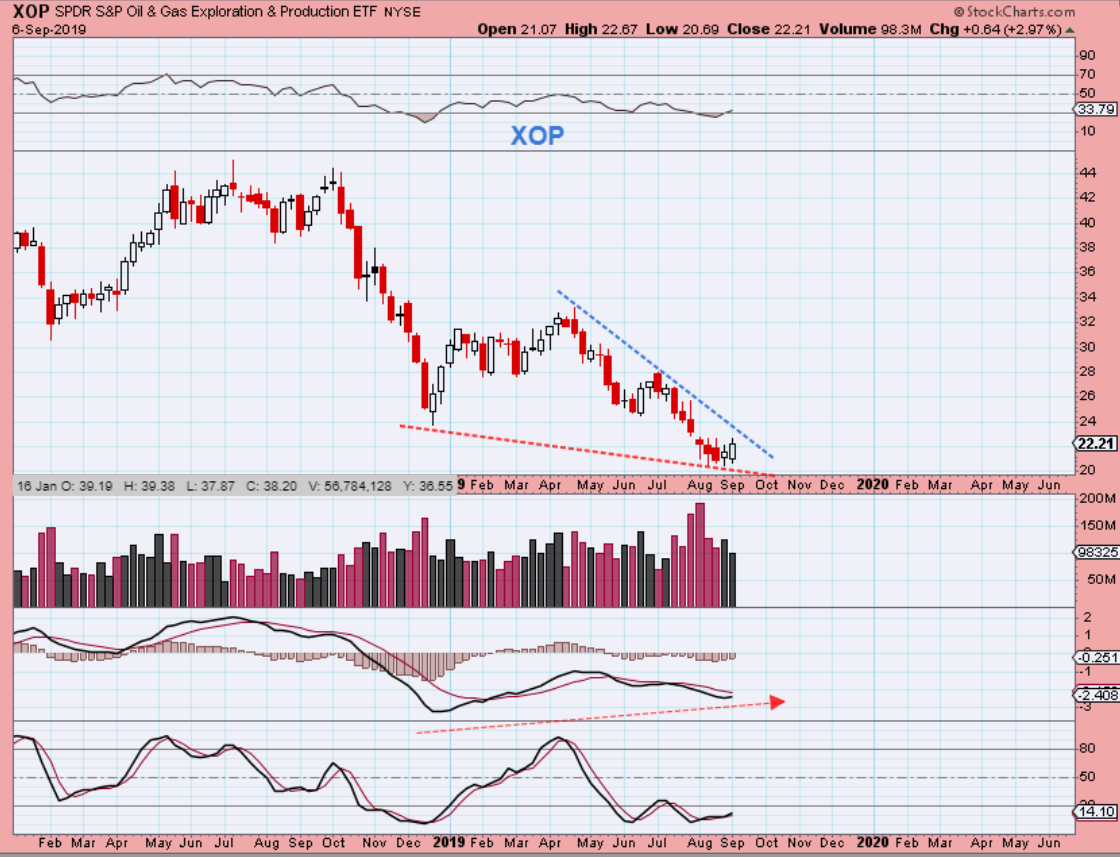
XOP #2 – It tagged that 50sma, & GUSH was up another 17.5% Monday to $4, but honestly… I THINK THIS CAN JUST BREAK OUT. That is a 1 month base, so realistically this can gap or break right over that 50sma. Why do I think that? Partly because Many Energy Stocks were up double digit % and breaking their 50 sma. I’ll discuss this later.
.
Let’s discuss Precious Metals
.
I have discussed ‘cycle timing’ getting late and divergence as showing that the run for Gold & Miners is aging. With negative divergence, and normal pull back or a DCL can serve to correct that, but if not, an ICL may need to develop to remove bullish sentiment. Let’s review…
.
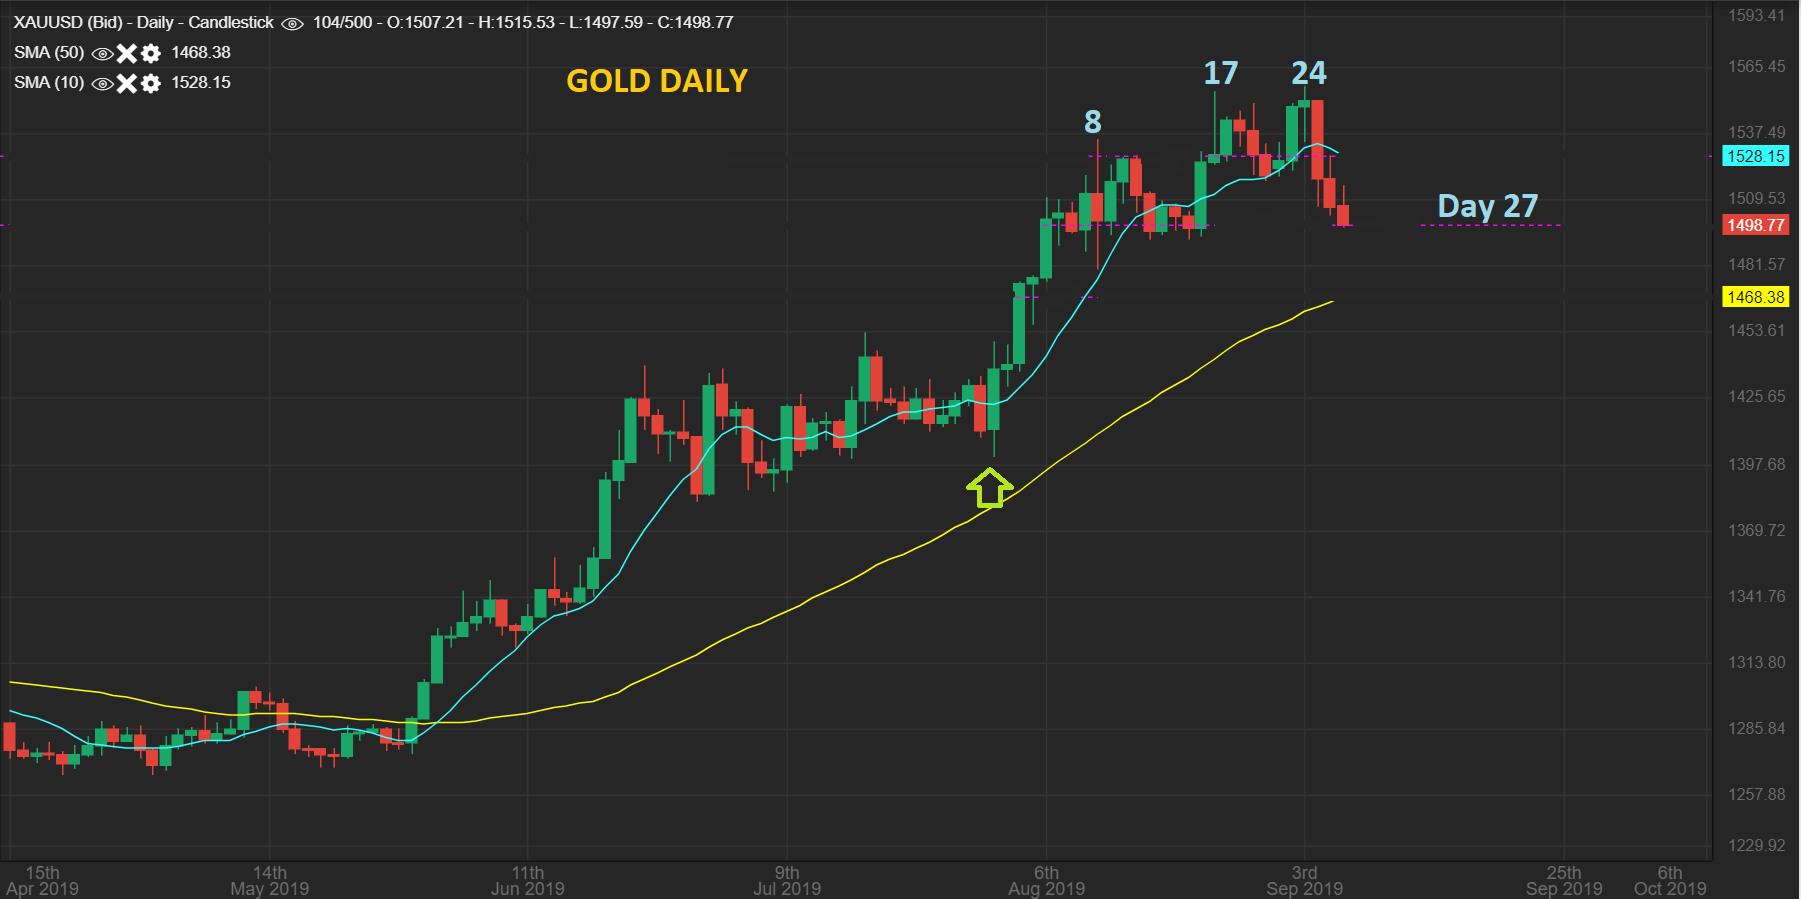
GOLD CAN still run higher after a dcl . We are on day 27, and daily cycles often run 30+ days ( maybe roughly 32-36ish lately). It doesn’t have to drop straight down, it can get choppy and could come around the FOMC Meeting next week. Maybe Gold will get to the 50sma area, and I have discussed a possible a-b-c type drop.
.
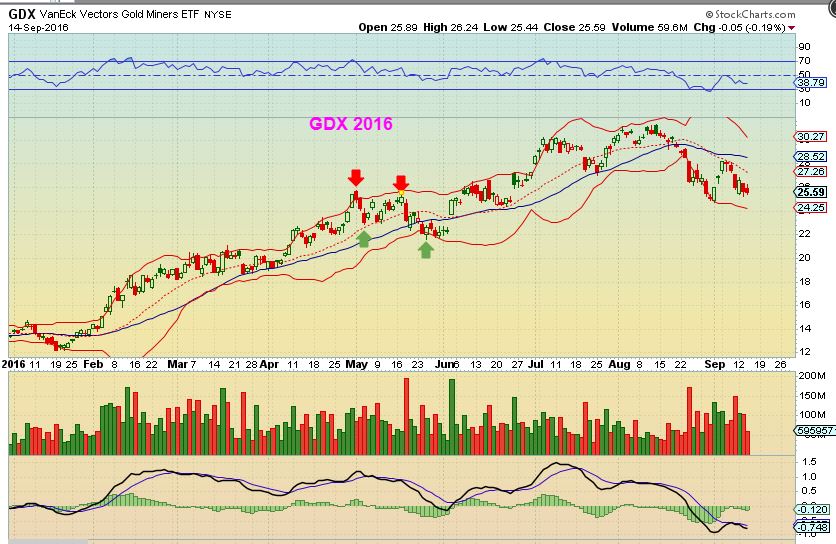
GDX 2016 Got choppy & did an a-b-c type drop, so I posted this shot of it too– Stepping back, it was a small double top, a choppier period of trading that dropped into that ICL. This drop took the entire month of May. We could see something like this too.
.
I just wanted to point this out with the 2016 chart too: During a choppy sell off, things feel terrible as price drops. The good part is that, as you can see here, if it is a bull market the losses are erased on the next run higher. Here it took only 2-3 day pop off of those lows in June to erase weeks of Chop & Losses.
.
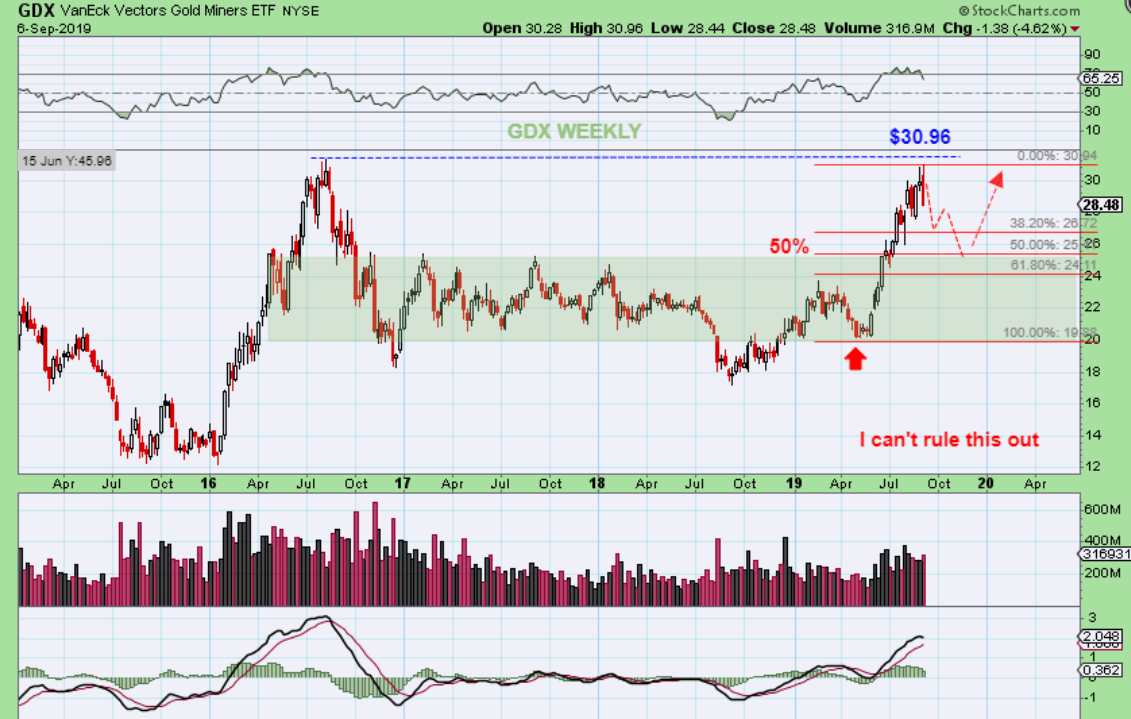
GDX WEEKLY– This was my chart of GDX in the weekend report 10 days ago. It warned of a reversal too. We were out of Leverage ‘Buy & Hold’ positions from the May lows and GDX got choppy.
.
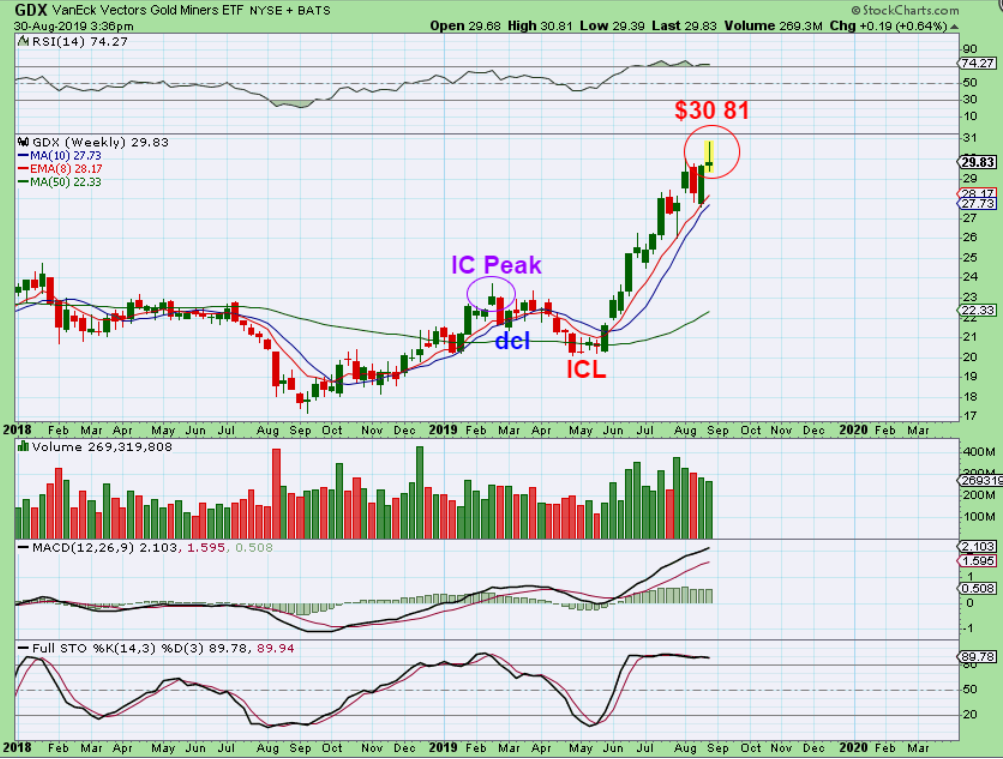
GDX – Monday saw GDX drop 2.8%, it broke that 50sma, and may be heading for the first fib target that I discussed. The 10sma is curled down, so a reversal and break above that 10sma will signal a dcl is in place, but this may have further to go since the cycle count is just in the late 20’s.
.
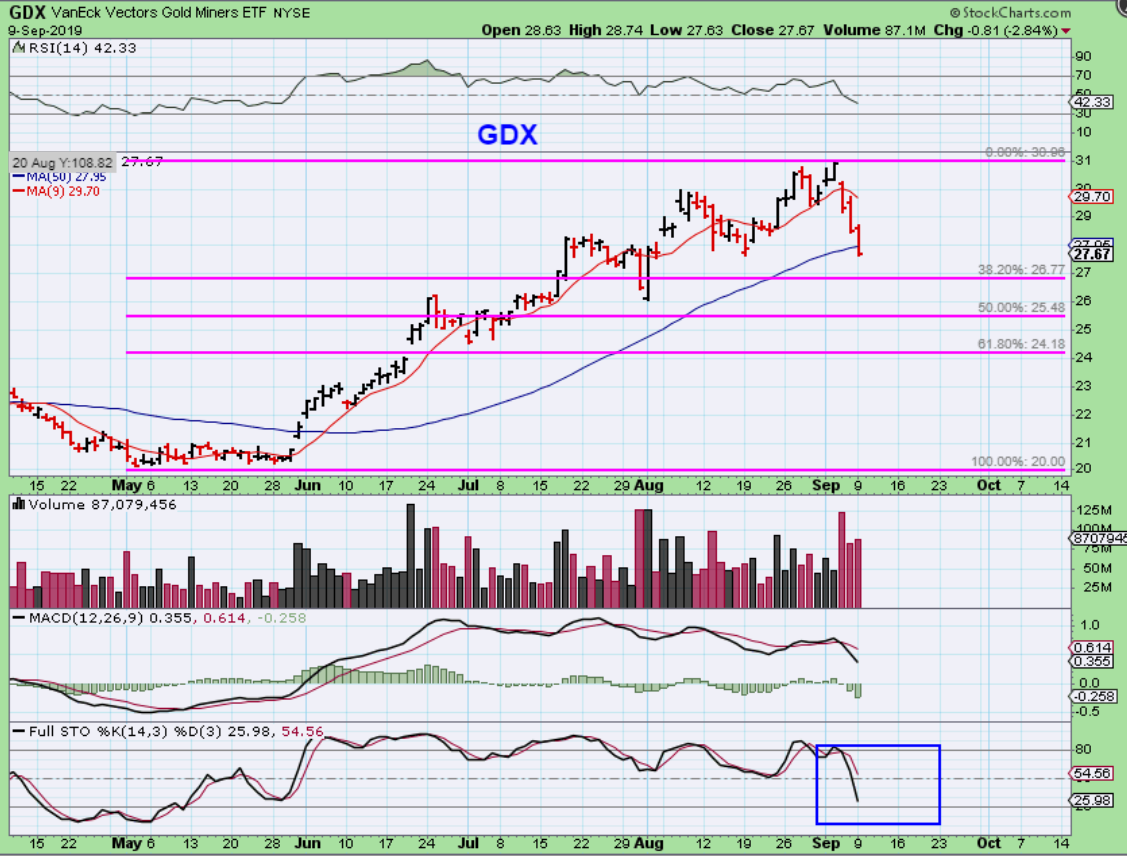
SAME CHART : I have pointed out many ways that this can play out, so we can’t tell if it will be an ‘a-b-c’ dop to a dcl? A ‘V-Bottom’ dcl? Just ‘Choppy’ to the lows? We just have to watch it. Remember how Giddy & excited the Bulls got? A DCL changes sentiment, so we are seeing that now with a 50sma break, people will dislike the Miners.
We are nearing a time for a dcl, and the FED MTG is close. They could arrive days apart or on the same day.
.
GDX WEEKLY – An ICL? In My Last WEEKEND REPORT, I said that I cannot rule this out if we dcl at fomc and then bounce into a L.T. daily cycle & continue to sell off even deeper into October as a ‘Pan and Handle’. This is still on the table, so we can play the next DCL long in case Miners just blast off higher, but we do do as a ‘Buy’ with a stop in case it drops into that ICL.
.
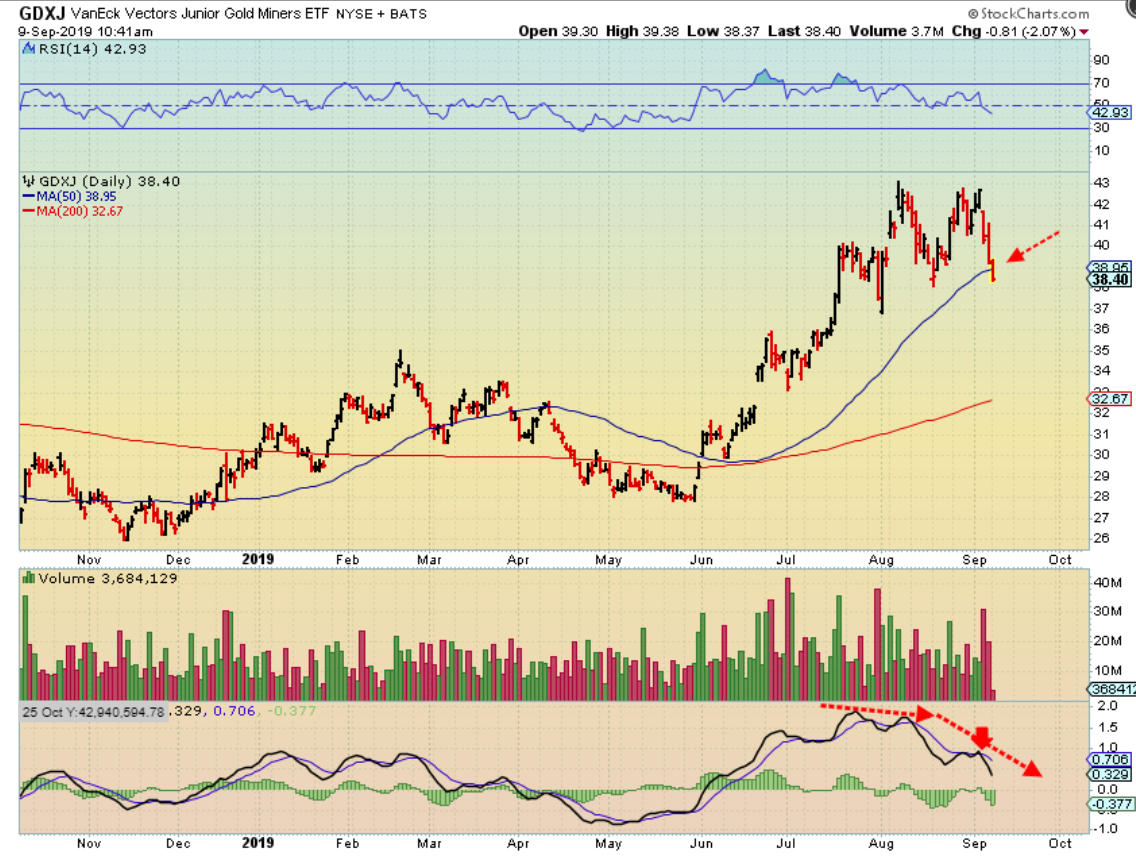
GDXJ – GDXJ cut the 50sma within the first hour of trading, and I posted this just as a reminder or as a learning lesson. Notice that divergence in the MACD & RSI that I warned signals that the rally was weakening. I cut the leverage (JNUG) purchased from the May ‘Buy & Hold ‘ lows, and I only traded it short term in my personal account. I did NOT recommend leverage in my reports after this type of divergence appeared. It was true that Individual Miners could possibly still rally into day 28-30 or so, but Leverage was not worth the risk for those not in front of a screen. We see now that the selling is taking hold heading into FED WEEK next week.
.
The General Markets stocks are trade-able, but the ETFs stalled. Soon the General markets will be coming due for a dcl near the FOMC meeting too, so use stops.
Oil & Energy were bottoming and choppy, but this sector looked to be setting up the best to me, and fast gains are being accumulated. These are acting similarly to what we saw with individual Miners out of the May lows, and though I had some cuts in the Miners gains, Energy stocks have more than hedged it. Some pops off of the lows or out of the bases have been up 7%, some are 12- 15%, some are 30%, some are 60% . I’ll discuss that below.
I get requests about the MJ Sector, and I’ve discussed a few good looking bases or set ups, but it still doesn’t quite seem ready to put in a good run, so I am going to hold off posting charts at this point. When I see solid bullishness, like we see with Energy, I will focus on it a bit more. I sold my HEXO position as a possible bear engulfing.
.
Enjoy your Tuesday trading.
.
~ALEX
.
As mentioned above with the Oil Energy part of this report: I have mentioned buying Energy Stocks in past few reports, using a stop. I was viewing them as low risk due to them still being at the lows, even a hedge to some of the Miners dips. We bought Miners in the lows in MAY and rode many up 50 – 100% over 3-4 months. I do think that we could see these trashed down, beaten down, oversold stocks rally like that for 3-4 months too, if Oil can break & finally run. NOTE: JUST LIKE MINERS- BE AWARE OF EARNINGS & INDIVIDUAL RISKS, So I have personally gathered a small basket.
.
FOR REASONS OF BUILDING CONFIDENCE- let me discuss a few past set ups that I have pointed out, since this can Build Confidence that this sectors set ups are playing out well.
.
XOP for GUSH. GUSH WAS UNDER $3, double bottom low, strong divergence. I bought it at $3, it fell to $2.77 on a back test of this line…
The weekly looked Bullish
.
XOP today is pushing higher on higher volume to the 50 sma, GUSH is $4. I sold mine at $3.50-ish, but put the Money in other Energy stocks that have done very well already too.
.
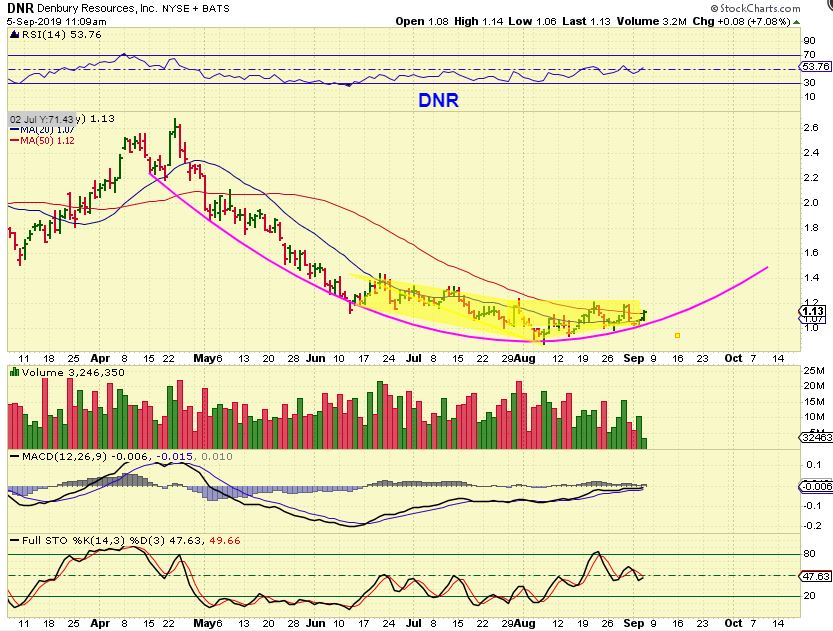
DNR -I have repeatedly mentioned that I like this base & that I own it. It was trading under $1.00 at times…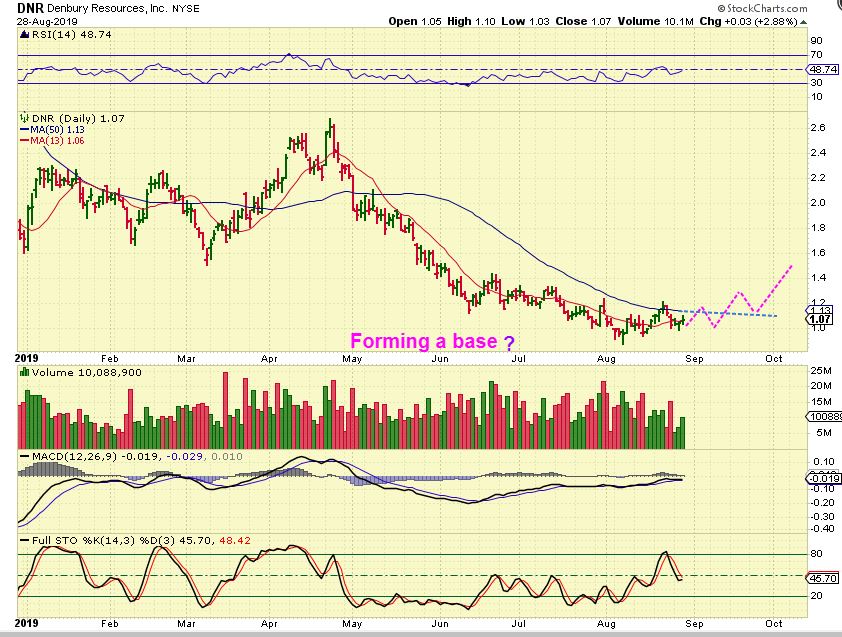
.
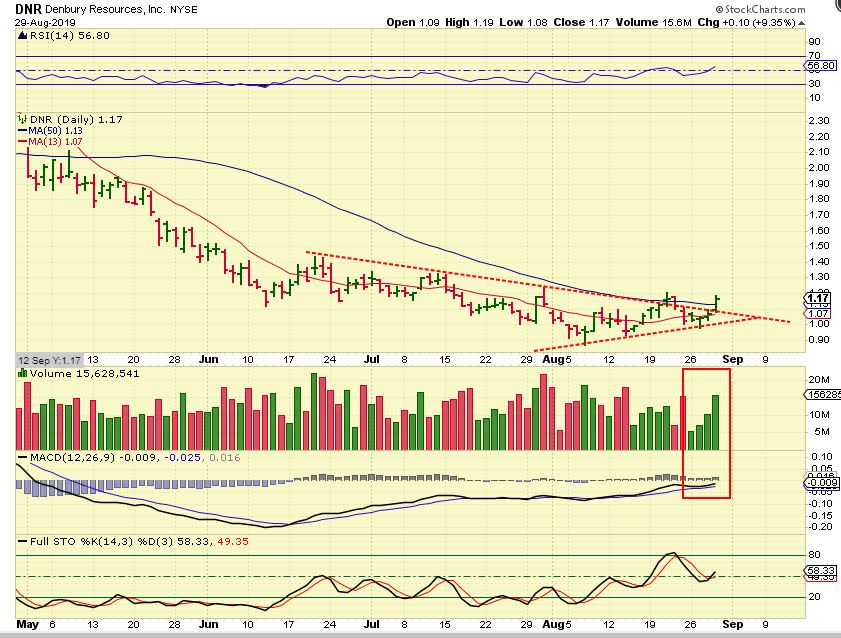
DNR – August 29th & it was breaking out, I added to my position as it showed that it was acting correctly. See the Volume, MACD kiss, RSI above 50%, etc .
DNR – On Sept 5th I pointed out that this is still a nice round base forming
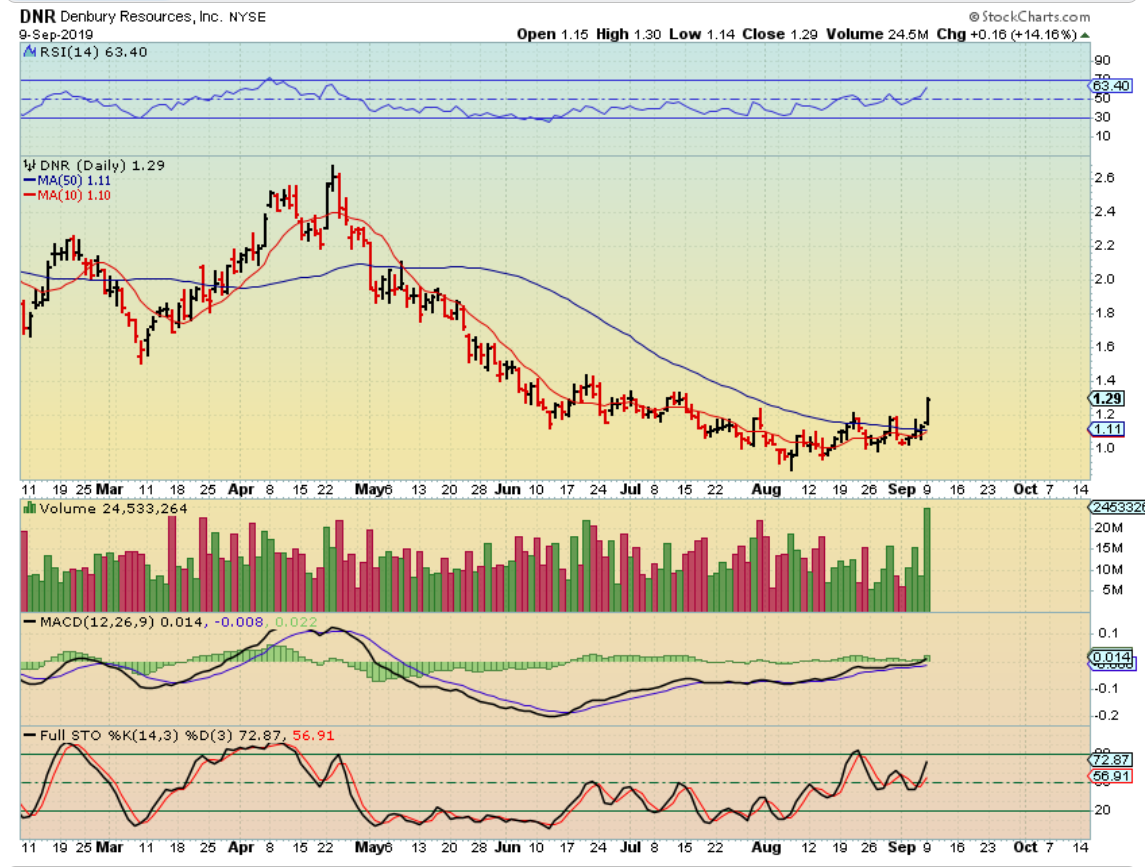
DNR – Look at that 14% pop with Volume Monday. I see MANY lining up this way, and these gains are similar to when our Miners pushed out of their lows.
.
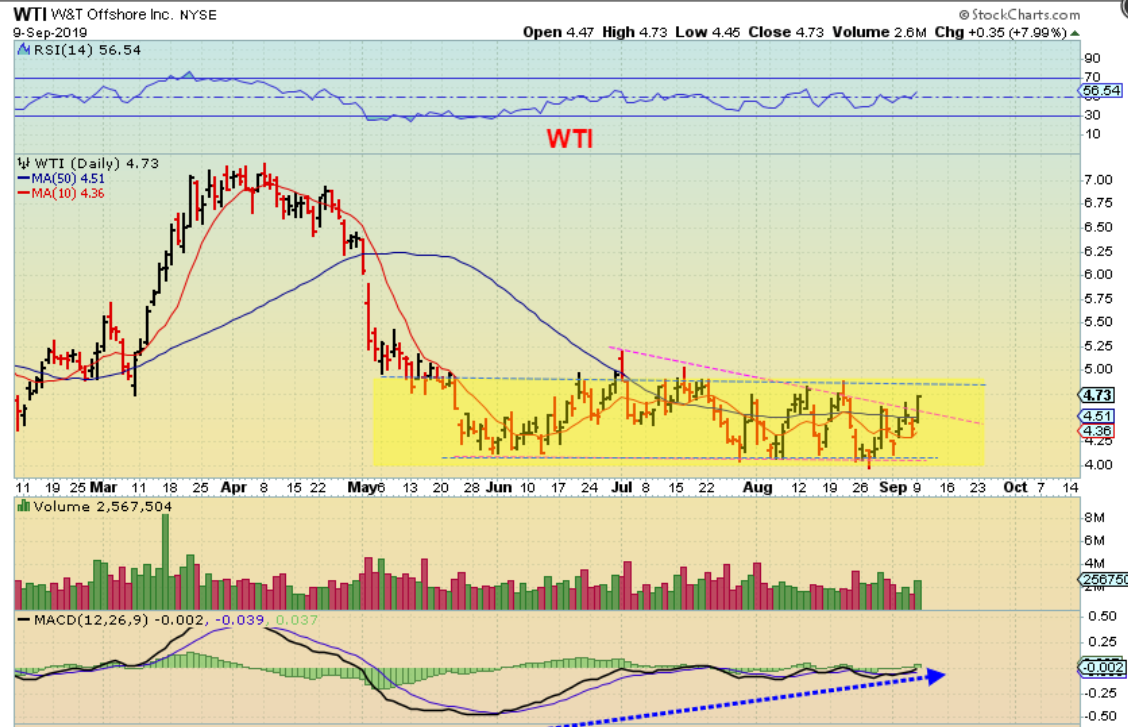
WTI – This was posted last week as similar to DNR – “Look at the base and also see other set ups mentioned”…
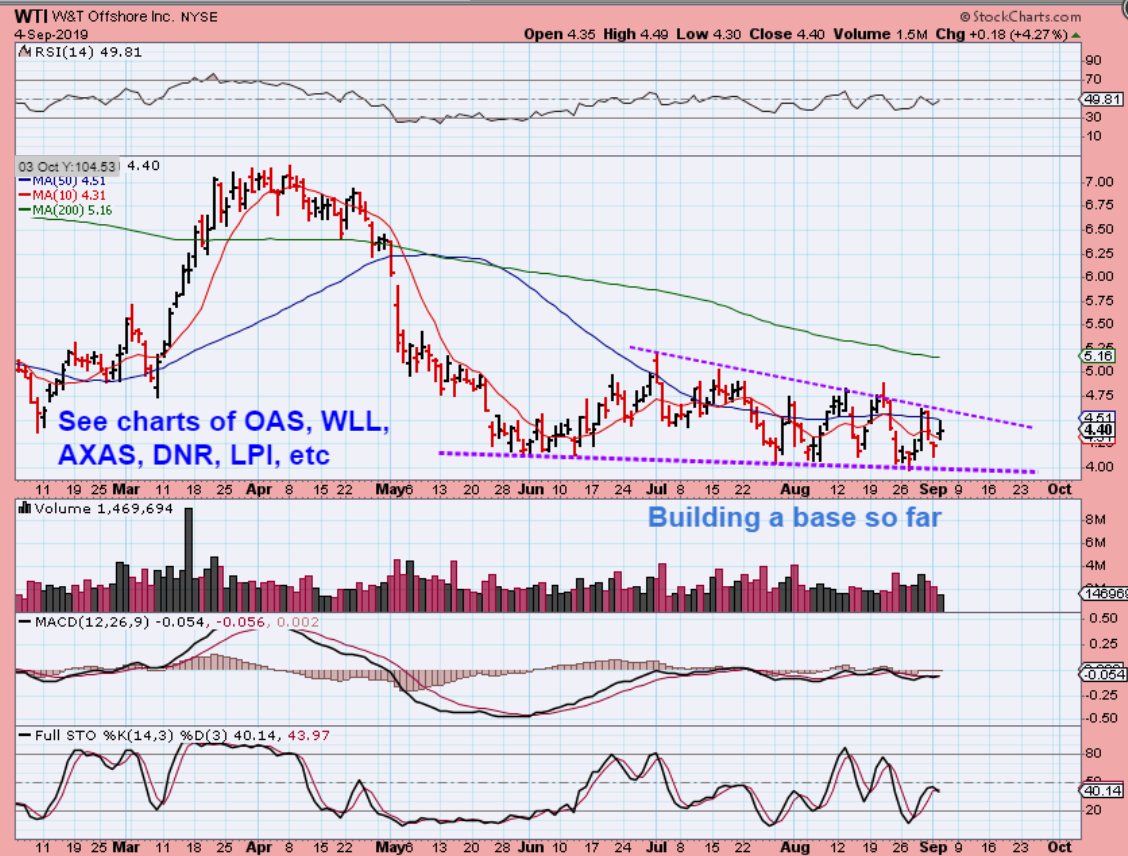
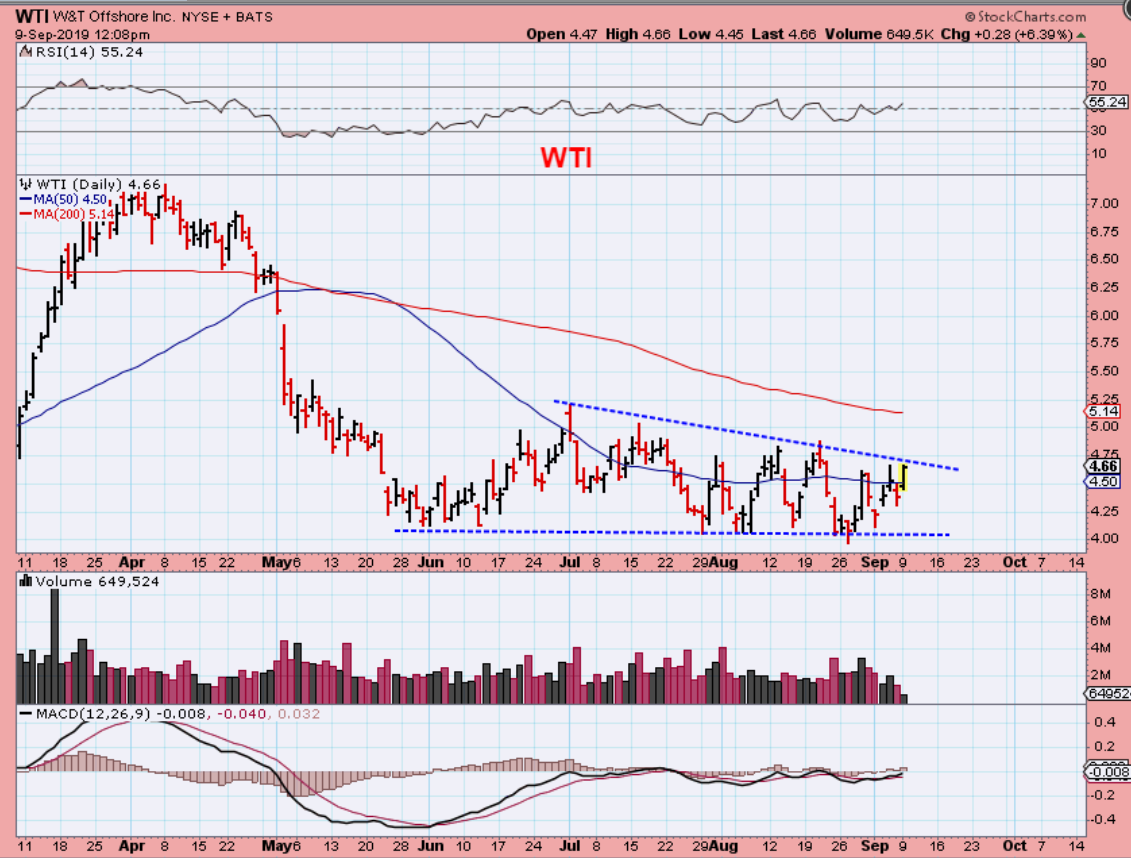
WTI – WTI looks like DNR did last week to me, so I grabbed this and posted it midday Monday. It looks ready to break that triangle…
.
WTI – It closed higher, now up 8%, but I think it is still a buy, since it may do what DNR did.
.
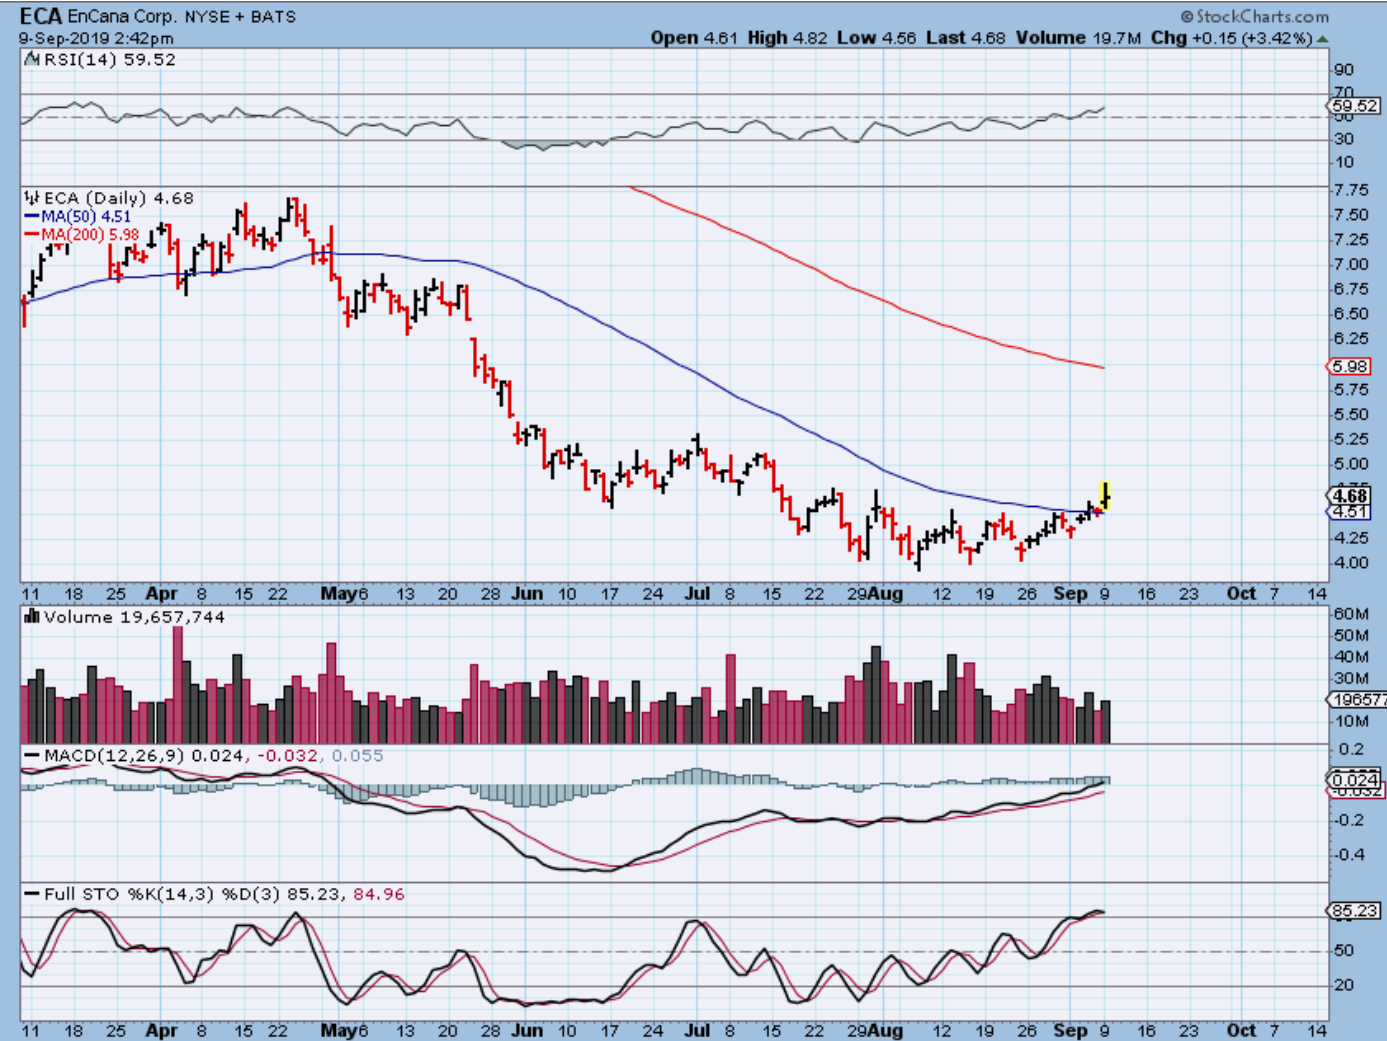
ECA – THIS BASE is similar to the DNR base too. ECA popped above the 50sma & pulled back midday. It started to rise into the close, so it closed at $4.72 and with that long round base, I still consider this a buy too. A stop at 50sma can make this lower risk.
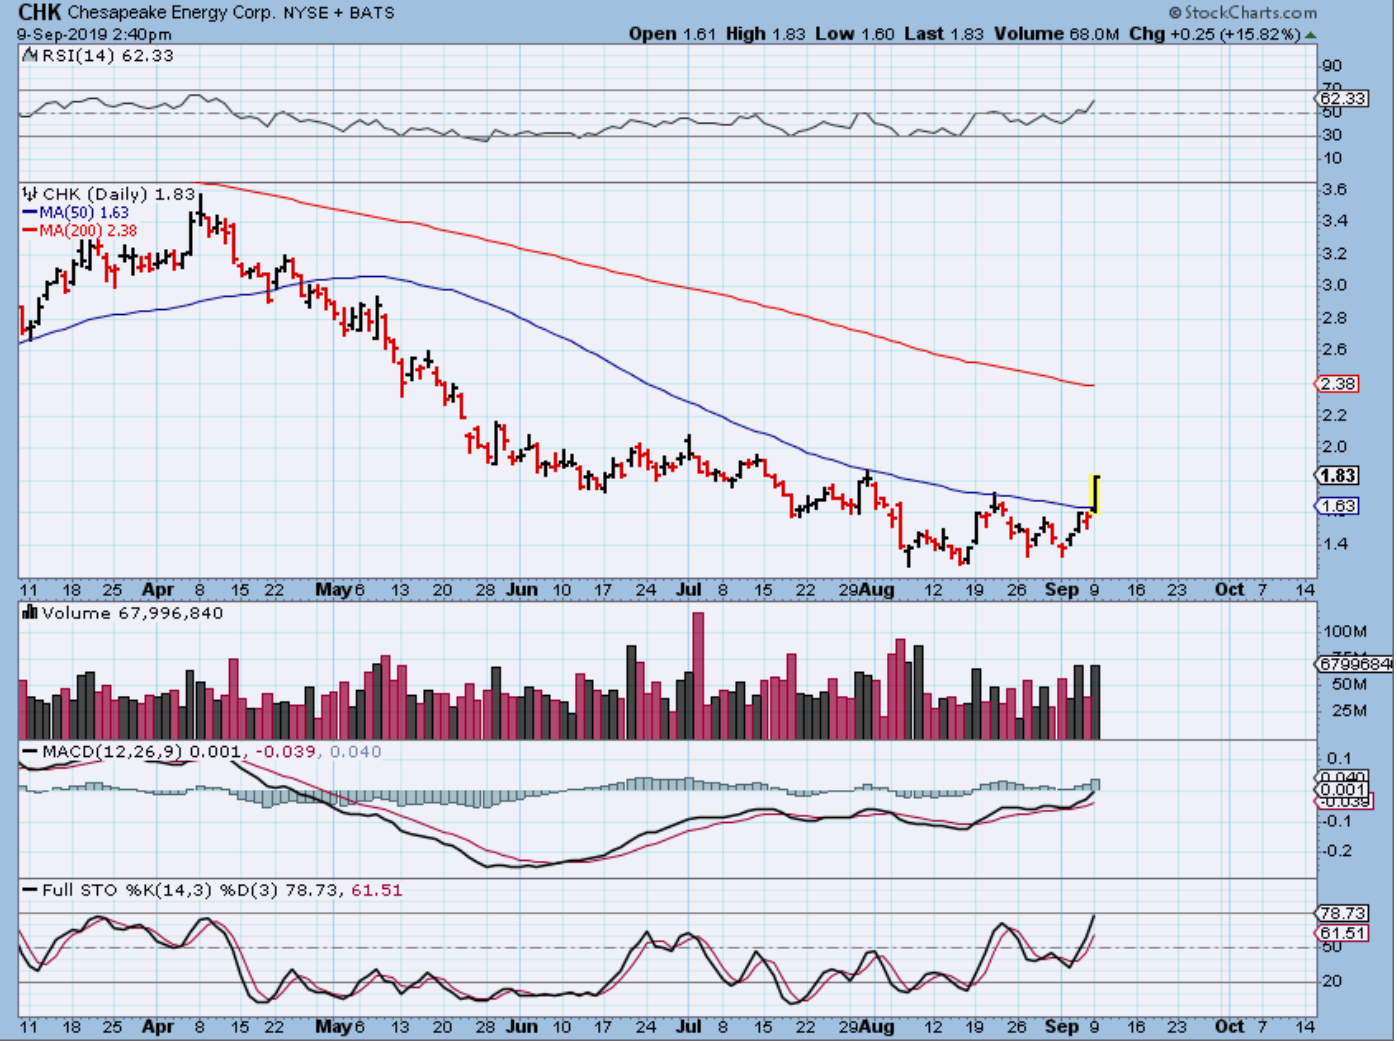
CHK – Another choppy base and can’t you also see that it is very similar to DNR, WTI, ECA, and others? And see how it Popped right over the 50sma- that is 16% Monday alone. These are bullish bases with MACD divergence that seem to be leading Oil & Energy sector higher.
.
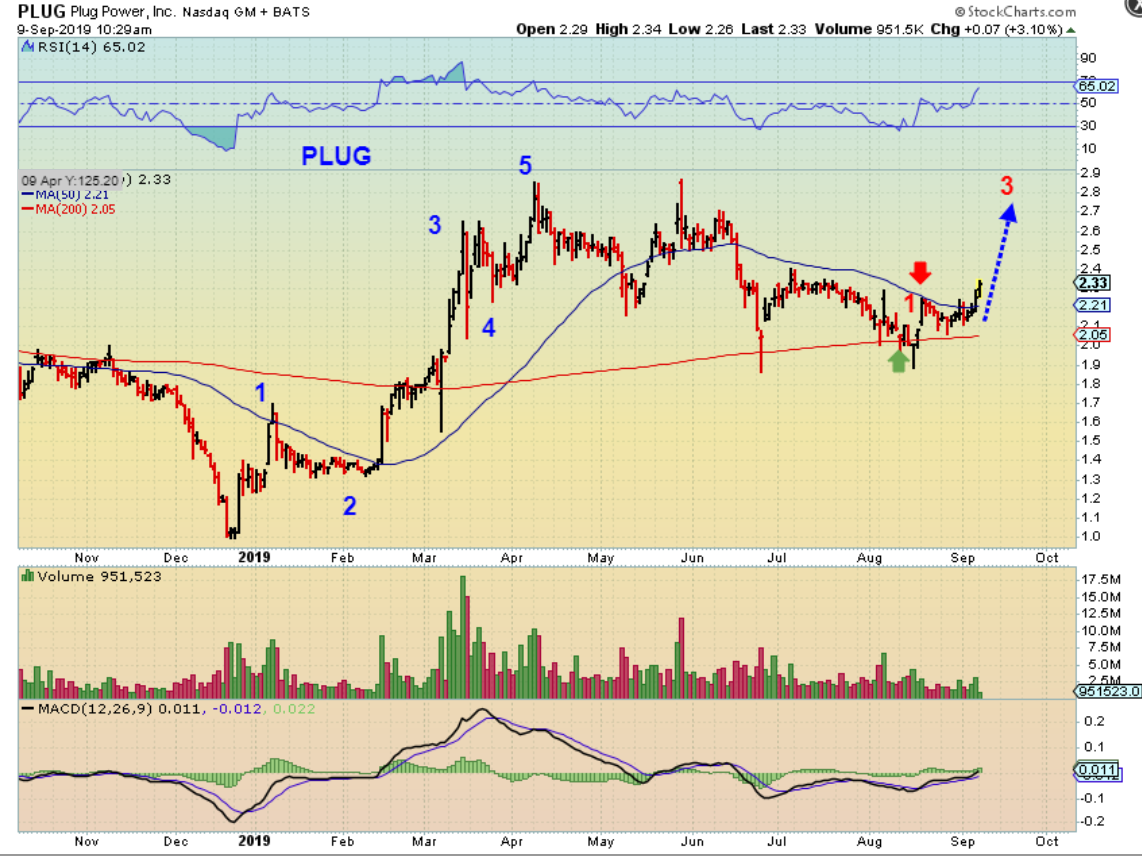
PLUG – I mentioned that I bought PLUG at the 50sma also . This is slowly moving higher too, and has good potential, but it can also still be bought with a 50sma stop. Notice that PLUG already ran 200% in Dec – April and then held the 200 sma support on a consolidation of those gains.
.
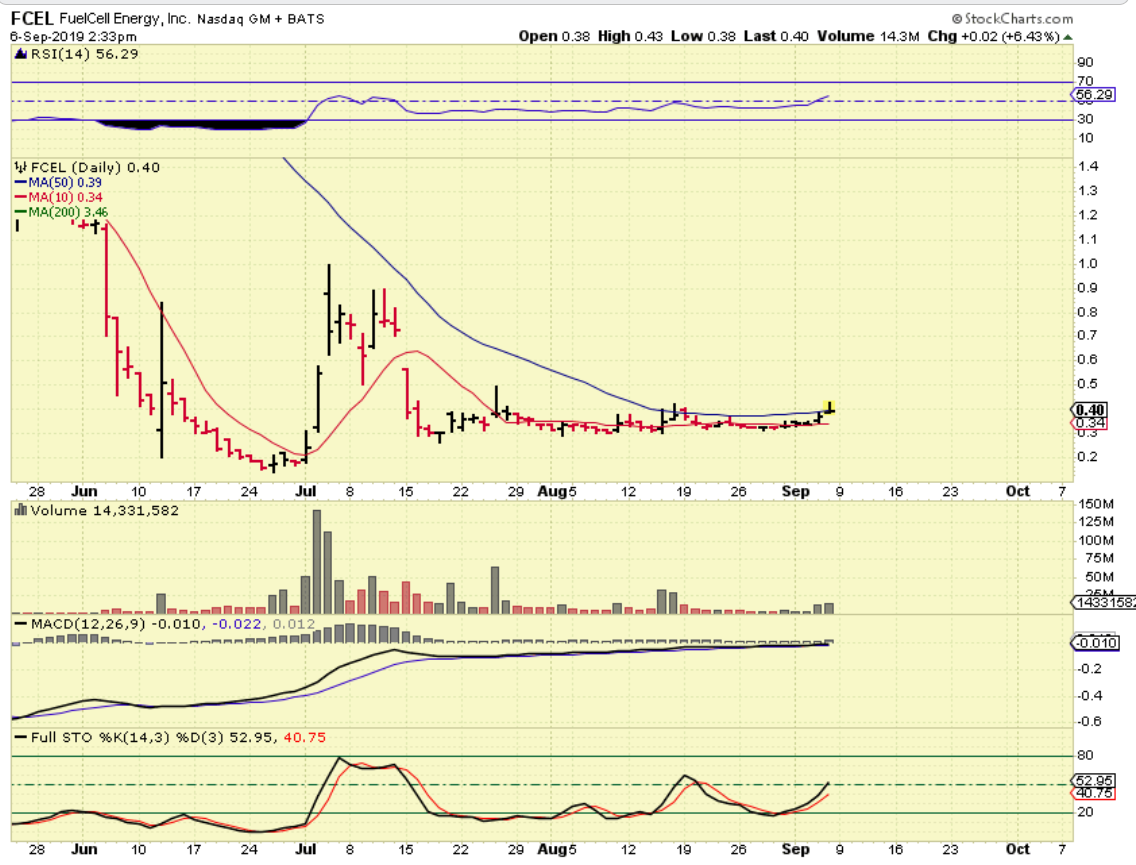
FCEL – Last week I was looking at FCEL crawling along the 50sma and forming a tight base. It popped in a BIG WAY last July. Unfortunately, I DID NOT BUY THIS, but I love this set up and…
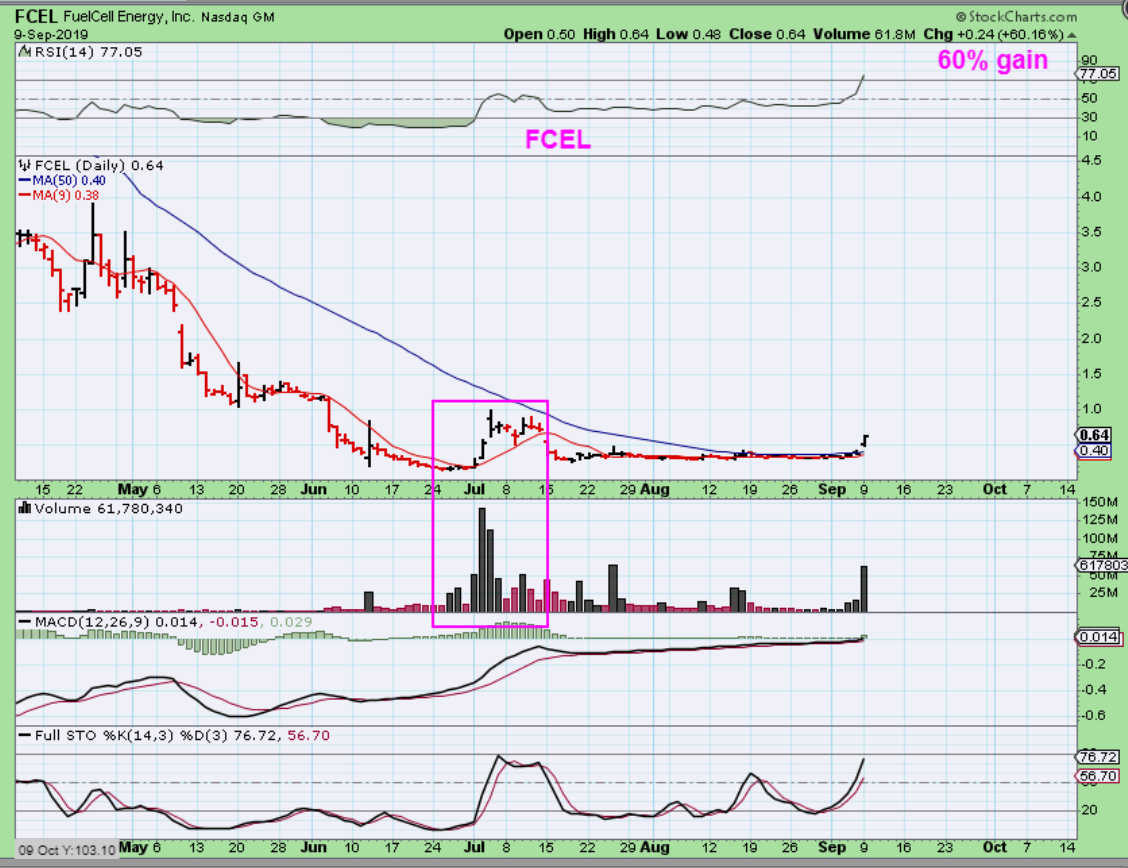
FCEL – Now I wish I had bought it. This long flat base popped 60% Monday. I know that a few DID buy it after I posted that chart, so congrats! I think I’d just let it ride, it closed near the highs, but if it gaps open Tuesday, you could sell some to lock in gains. You could even sell your whole ‘cost’ and just let the rest ride for free.
.
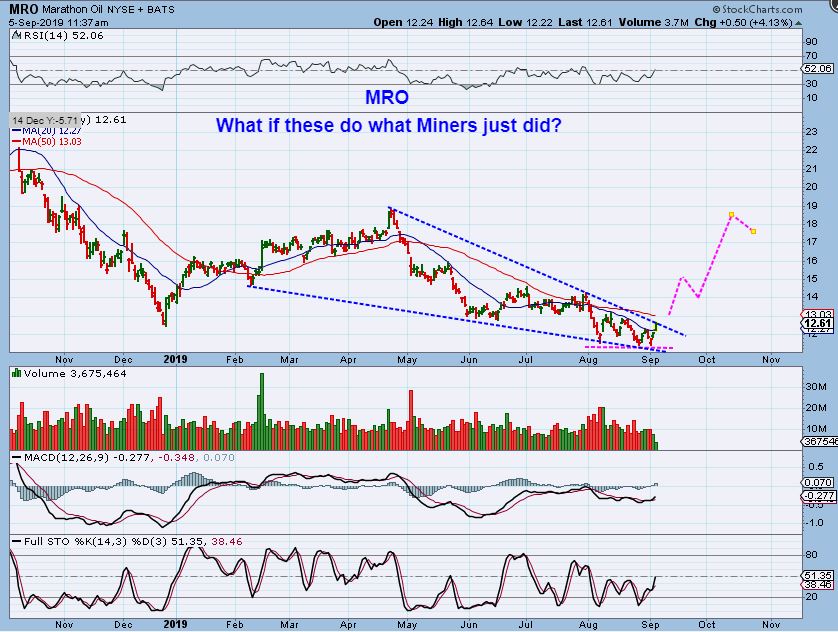
MRO REMINDER FROM LAST WEEK : Using this chart, I pointed out MRO & VLO as bigger companies that looked to be bottoming too. Look at that MACD as it put in new lows. Watch the 50sma & it looked ready to break down trend line…
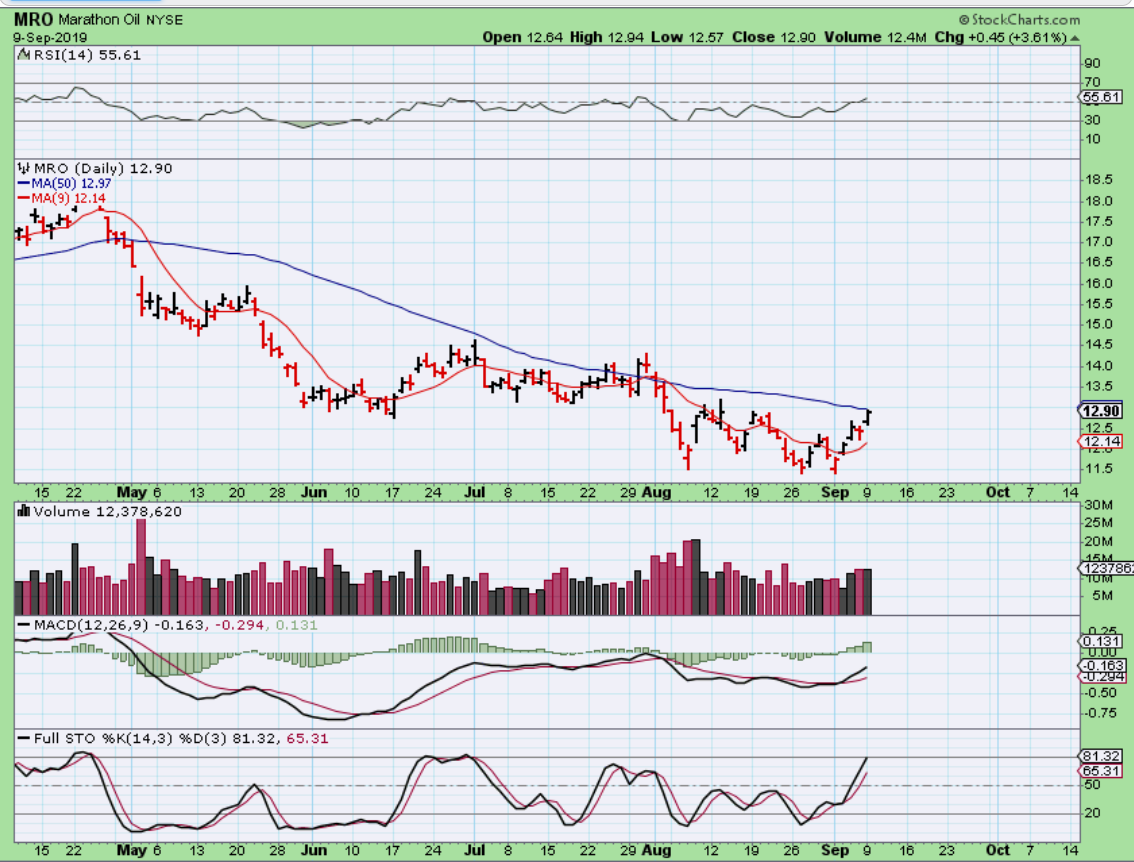
MRO – Mondays chart shows that trend line has been broken and now MRO ( & VLO) pushed up against their 50sma. This is a buy here or on a break out of the 50sma.
.
BAS – This is a tight wedge type base to me, so I bought it when it was already up 6% and posted in the live area Monday. Notice that the MACD is a much higher low than the price lows.
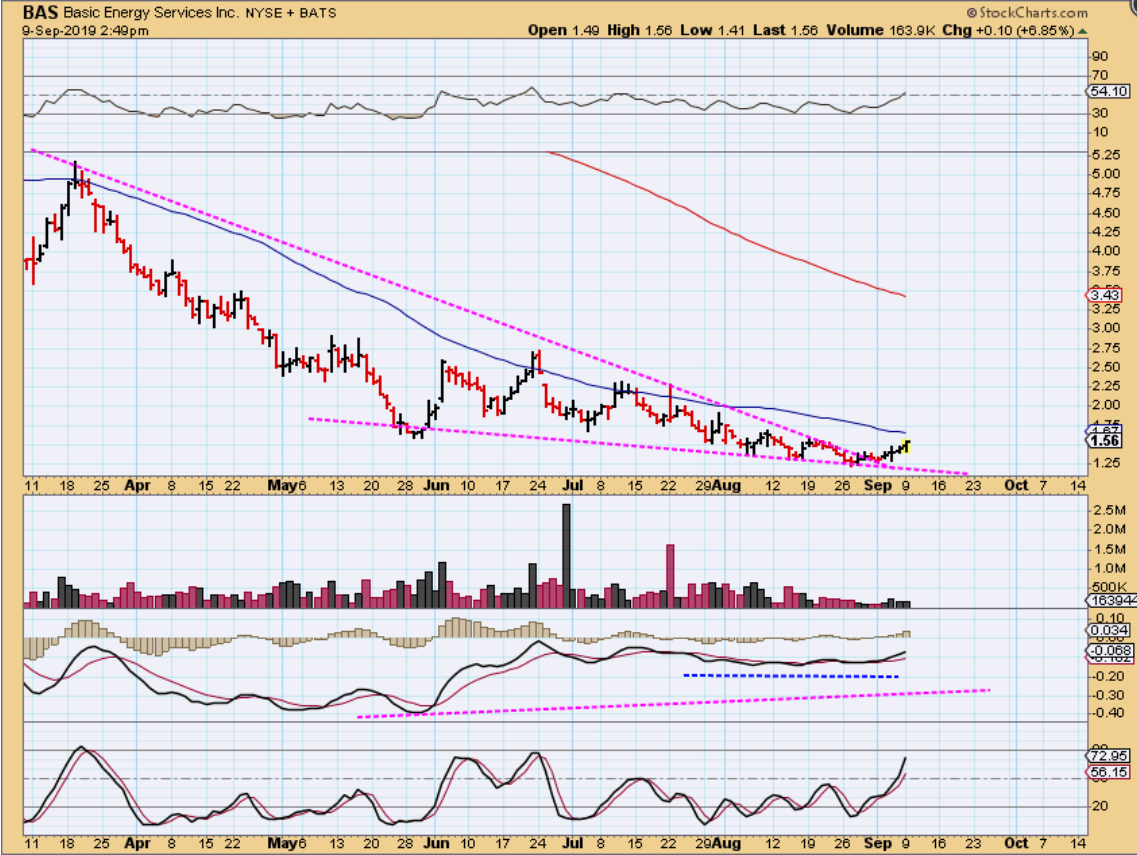
BAS – Bas quickly moved up a bit more and closed up 10%, tagged the 50sma and sold off slightly. I still think that this is a buy, especially if it gets above the 50sma. A tight wedge -like base like this has great potential. In fact…
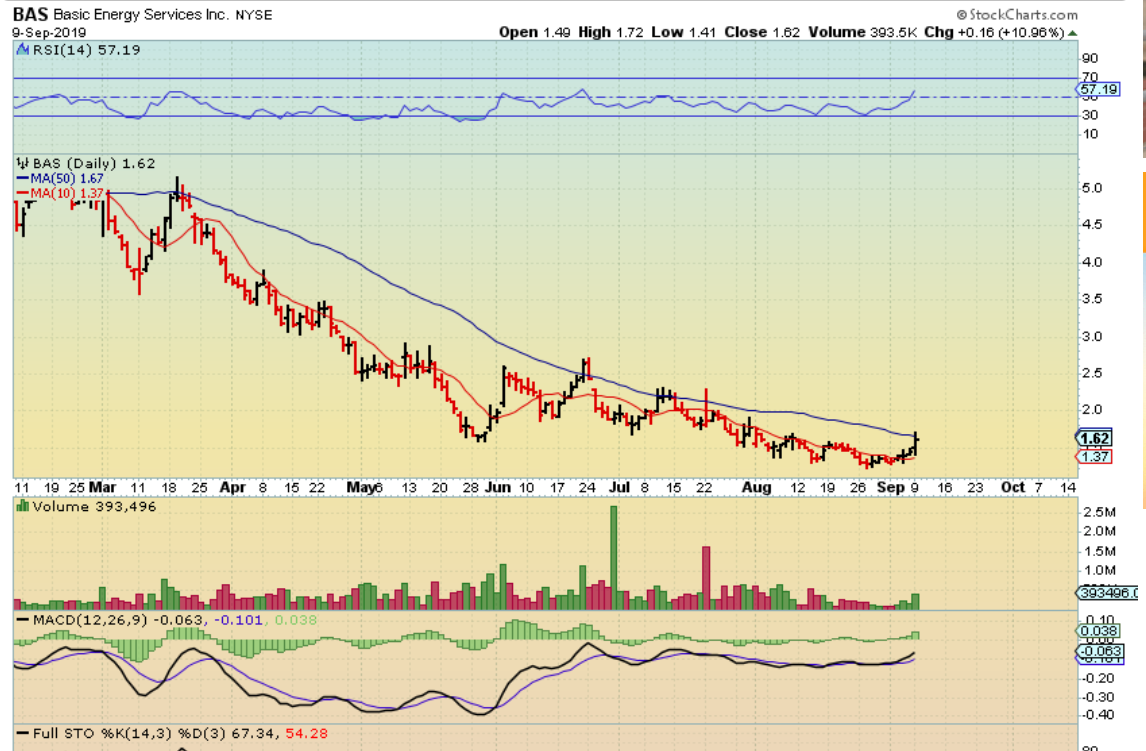
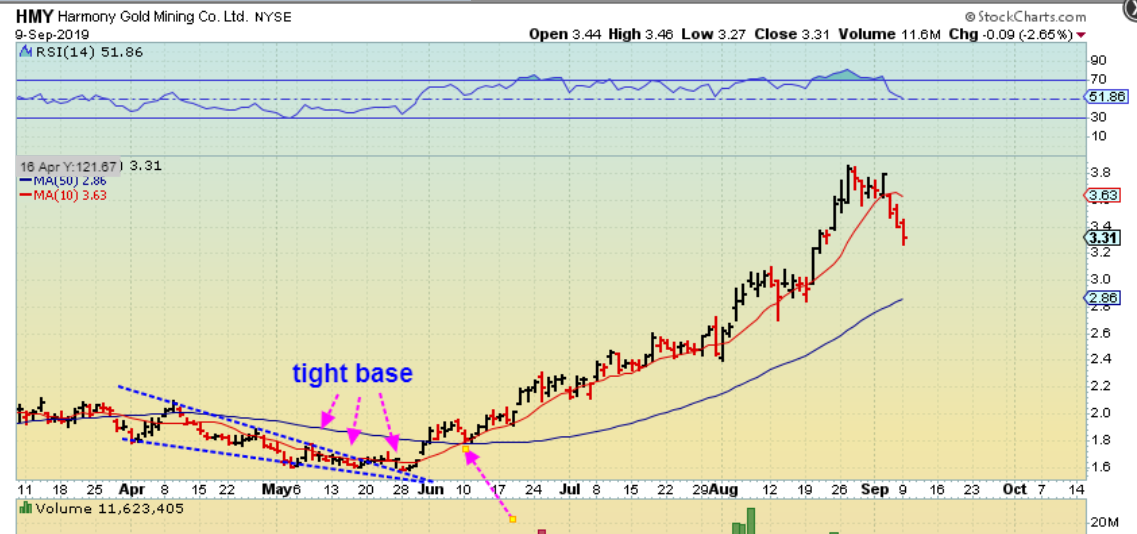
A tight wedge-type base can lead to a nice strong rally if the sector remains bullish. (HMY) Do you wish you bought HMY at that 50sma? Look at the chart of base above again.
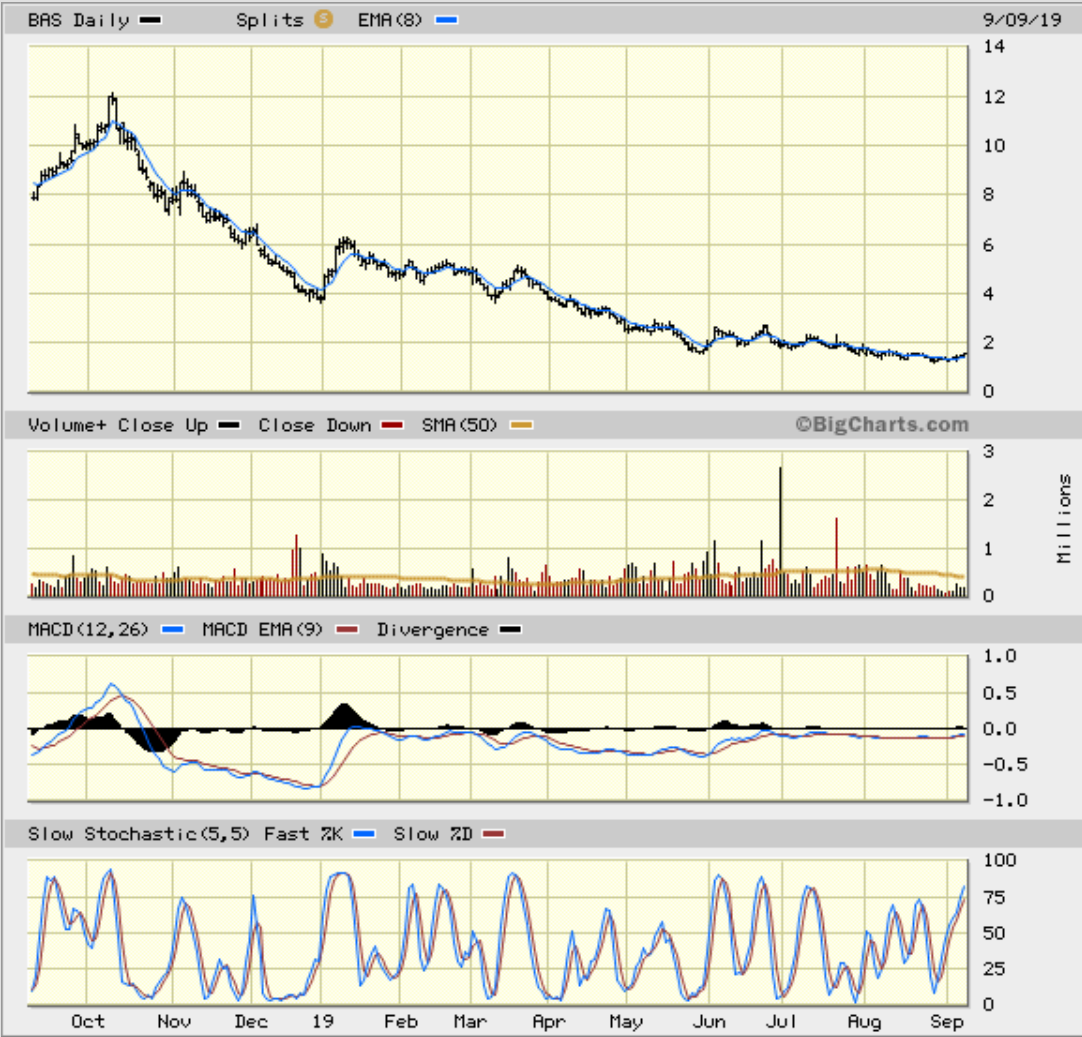
BAS – This was a $12 stock last Oct & now is at $1.50 ( no splits have taken place, it is a beaten down energy stock). I can picture this doubling ($3) or tripling ( $4.50) fairly easily if it remains Bullish.
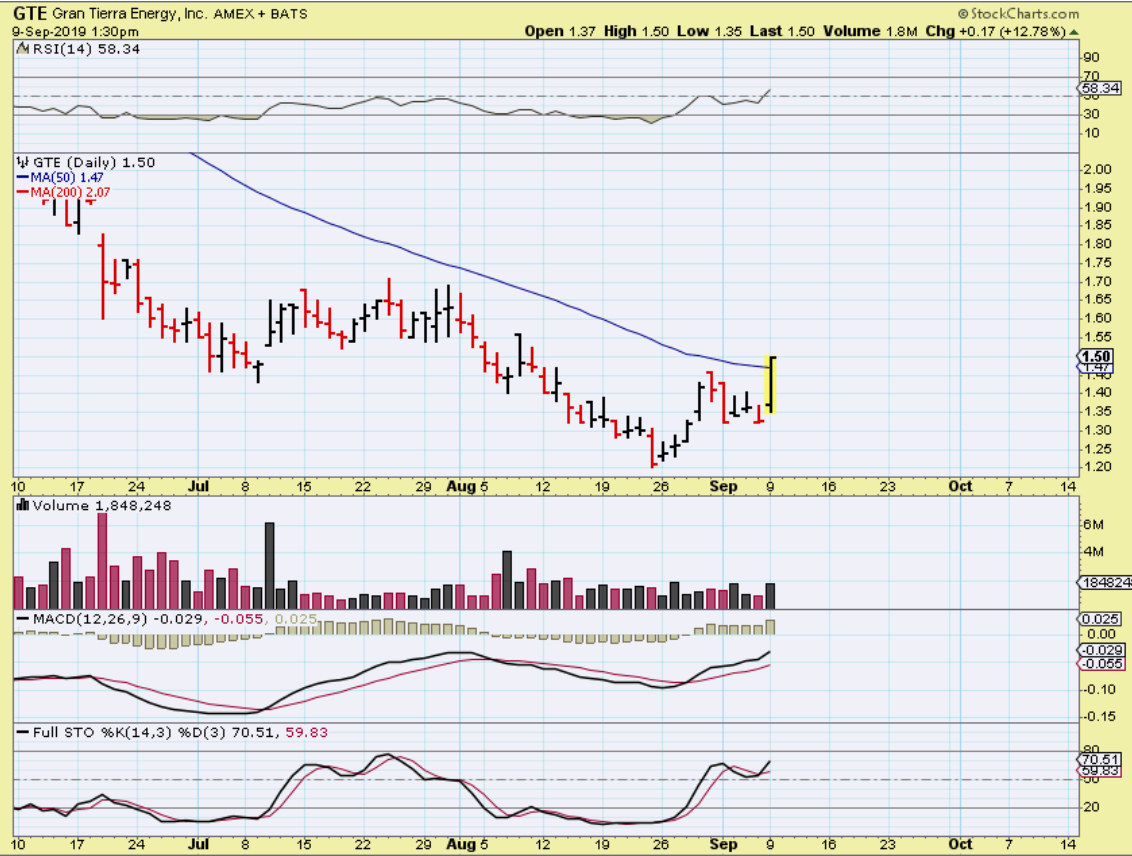
GTE – GTE has beautiful divergence at the recent lows, so I bought this and posted it in the live area. It was pushing the 50 sma with strong volume midday( 1.5 million) that doubled by the close.
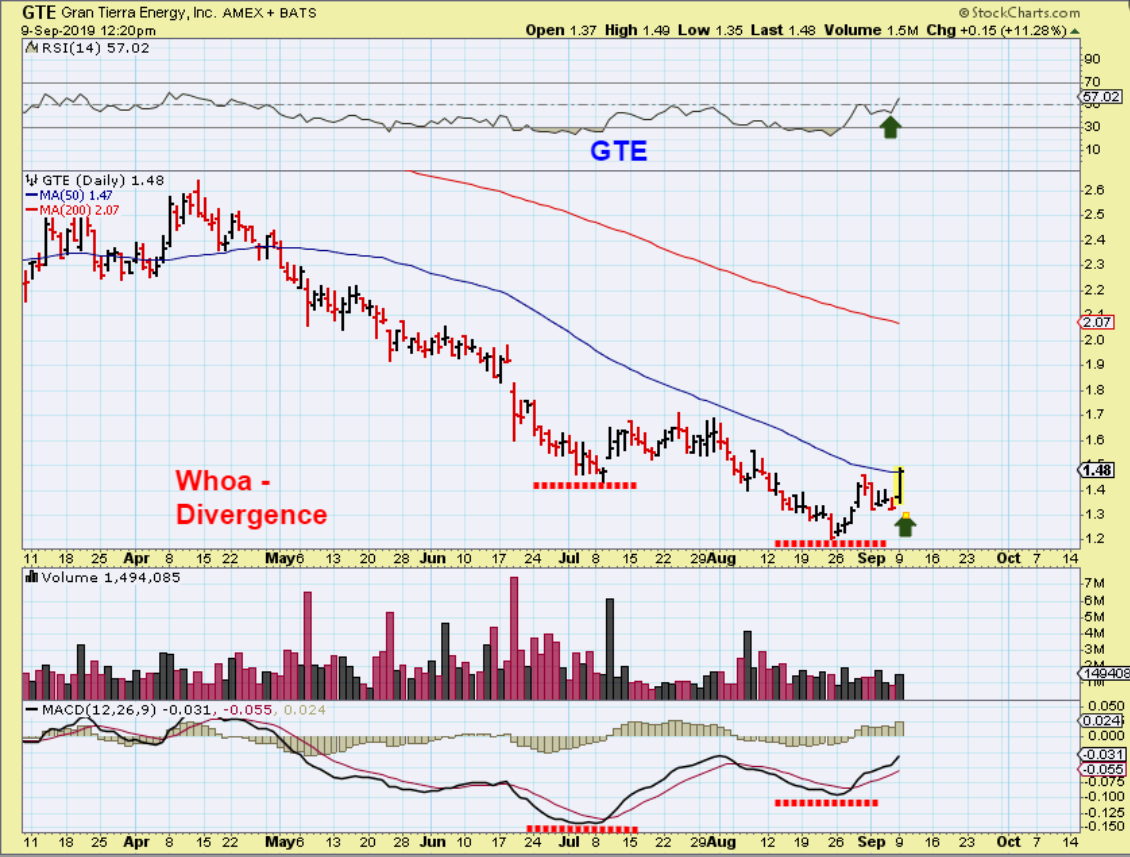
GTE – And it broke through shortly after. This sector is acting very well. It ended up closing here with 3 million volume.
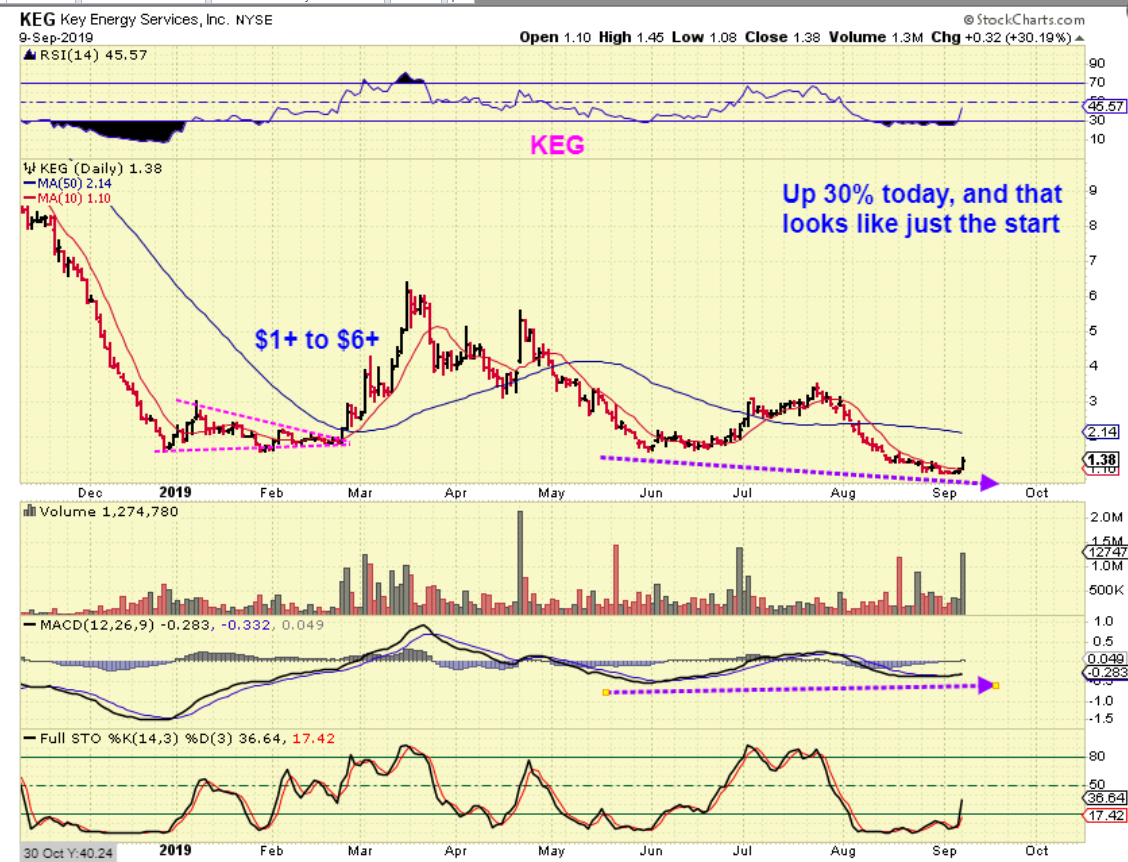
KEG – KEG was moving with big volume right at the open, so I mentioned it when it was near $1.12 and bought it. KEG then just kept climbing, up 30% Monday alone. Another tight base, still quite oversold, and look how it ran in early 2019. $1.30 to $6.45. Big Gains.
.
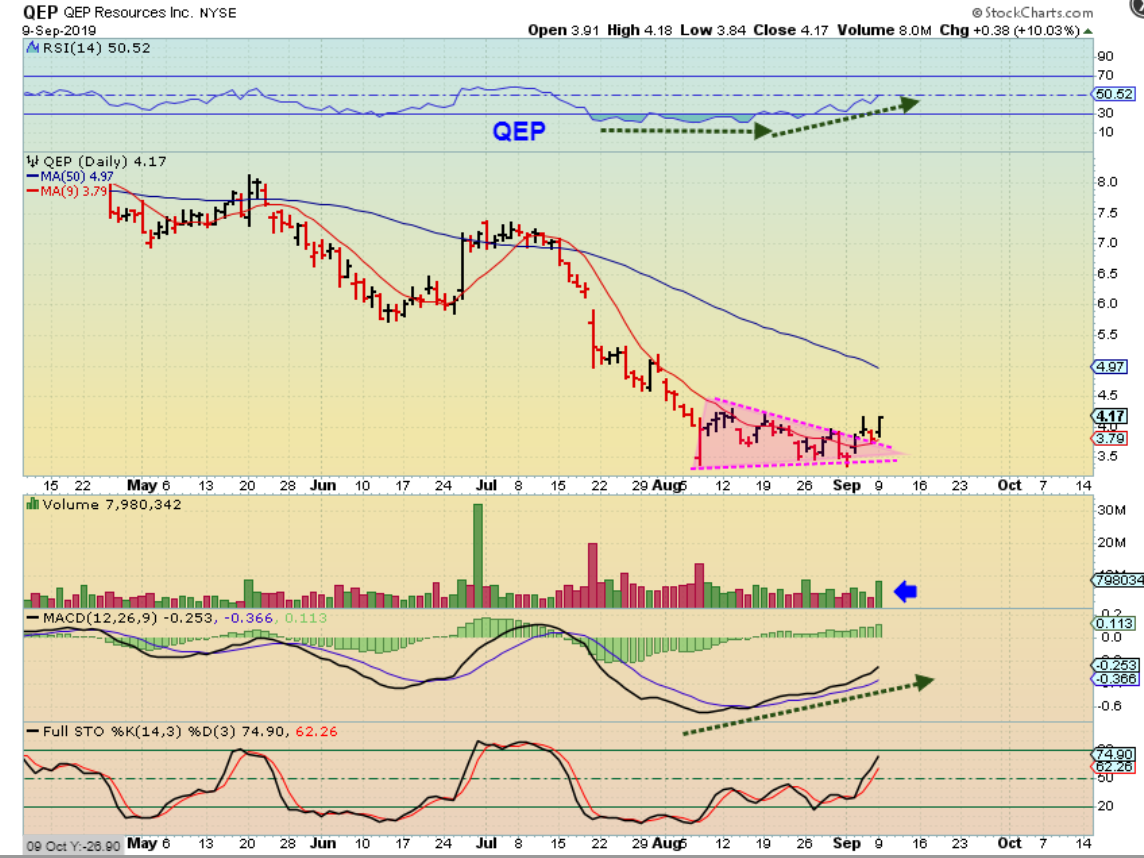
QEP – ED mentioned QEP ( Thx Ed!), and I like this set up a lot too. I could draw this as a square base like DNR had, but this also is a Bull Wedge and it broke out. It should run to the 50sma for starters. This was cut in half since July, and could double over time too (If the sector remains bullish).
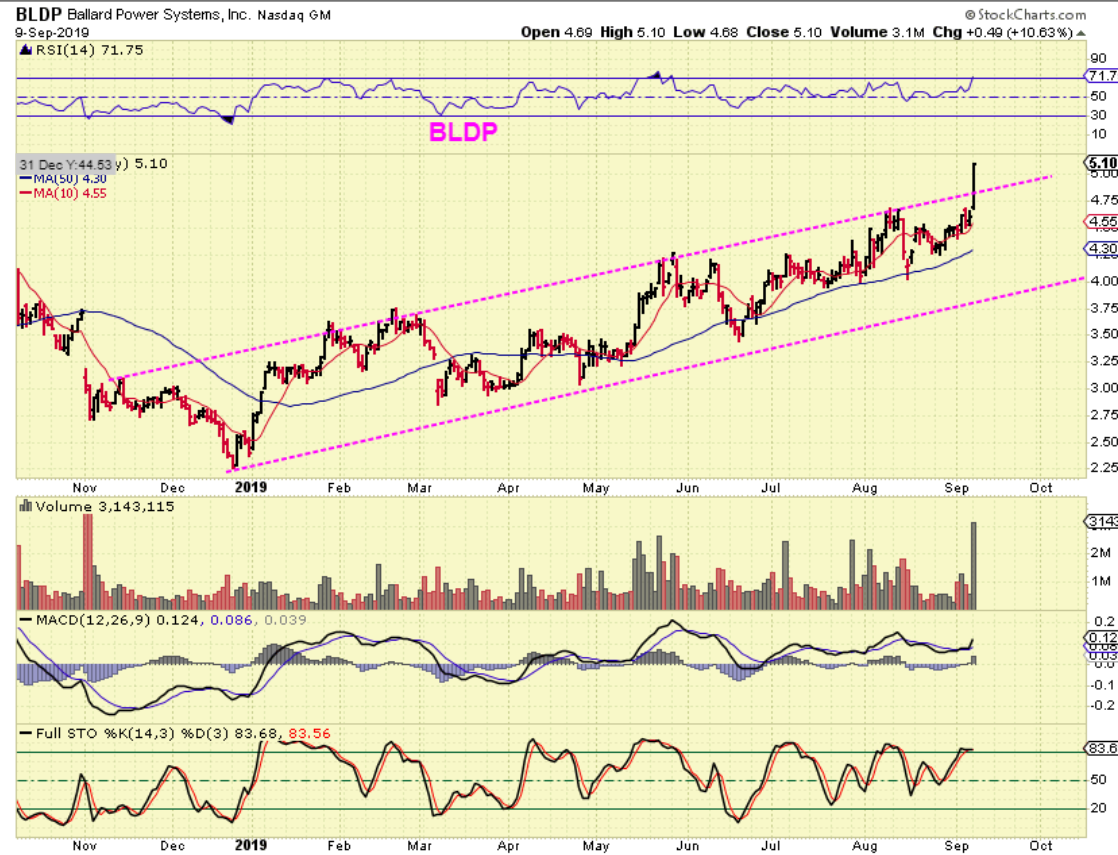
BLDP popped 10 % and was mentioned by Maria early in the day when it was just breaking higher. This has been in an up-trending channel and broke out. That makes it tough for me to buy, because these often back test that channel, but it is obviously bullish. Since it has proven itself from the December lows, I would say that a Pullback can be bought with this one.
There are MANY Oil / Energy stocks in various stages of set up, like AXAS, BTE, AREX, RIG, LPI, OAS, etc etc . Above are some that I feel can still be bought and gains can be made over time. IF OIL breaks & Runs, these can run like the Miners did when Gold broke out & ran. Some are basing and I may mention them in future reports( AXAS), others are near the 50 sma, but the ones that I have mentioned in the last 2 weeks reports have been rewarding buyers quickly. Enjoy your Tuesday trading!
.
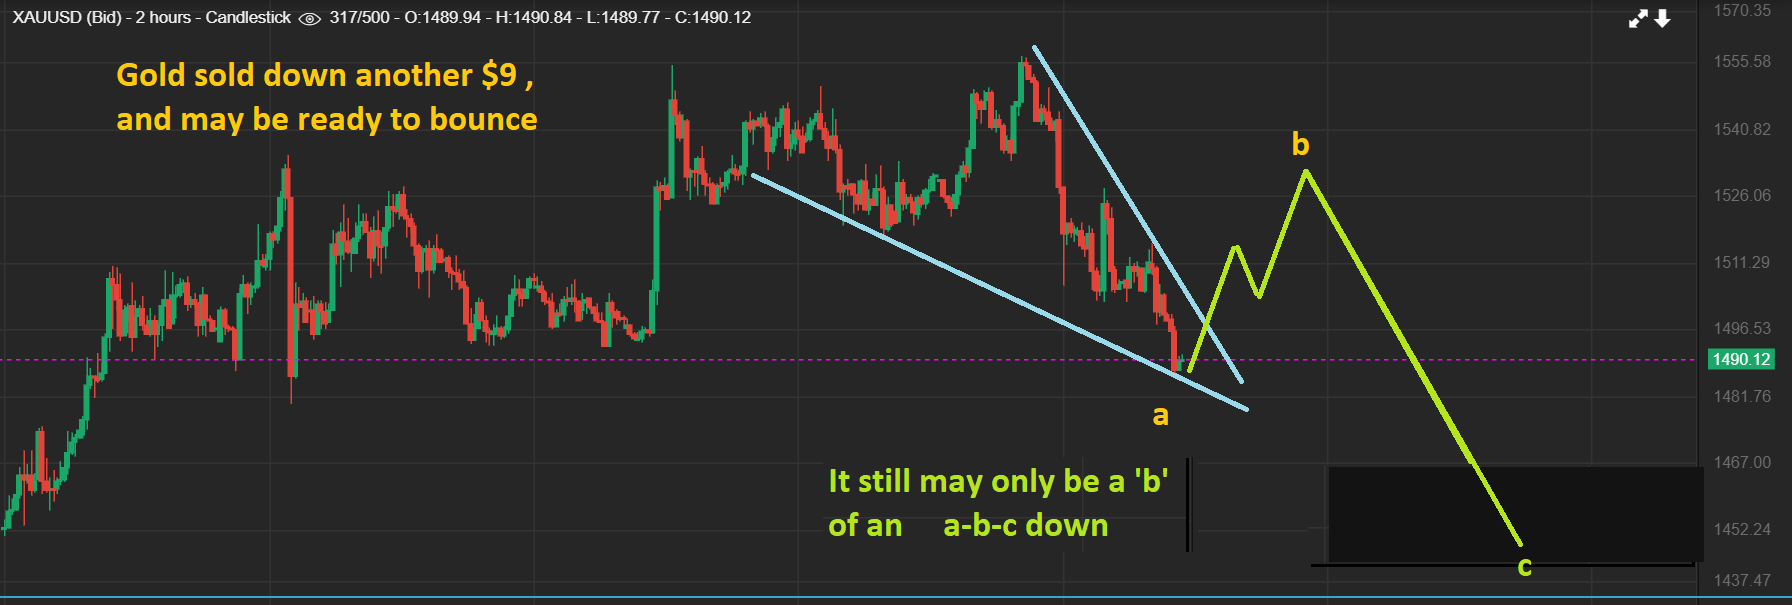
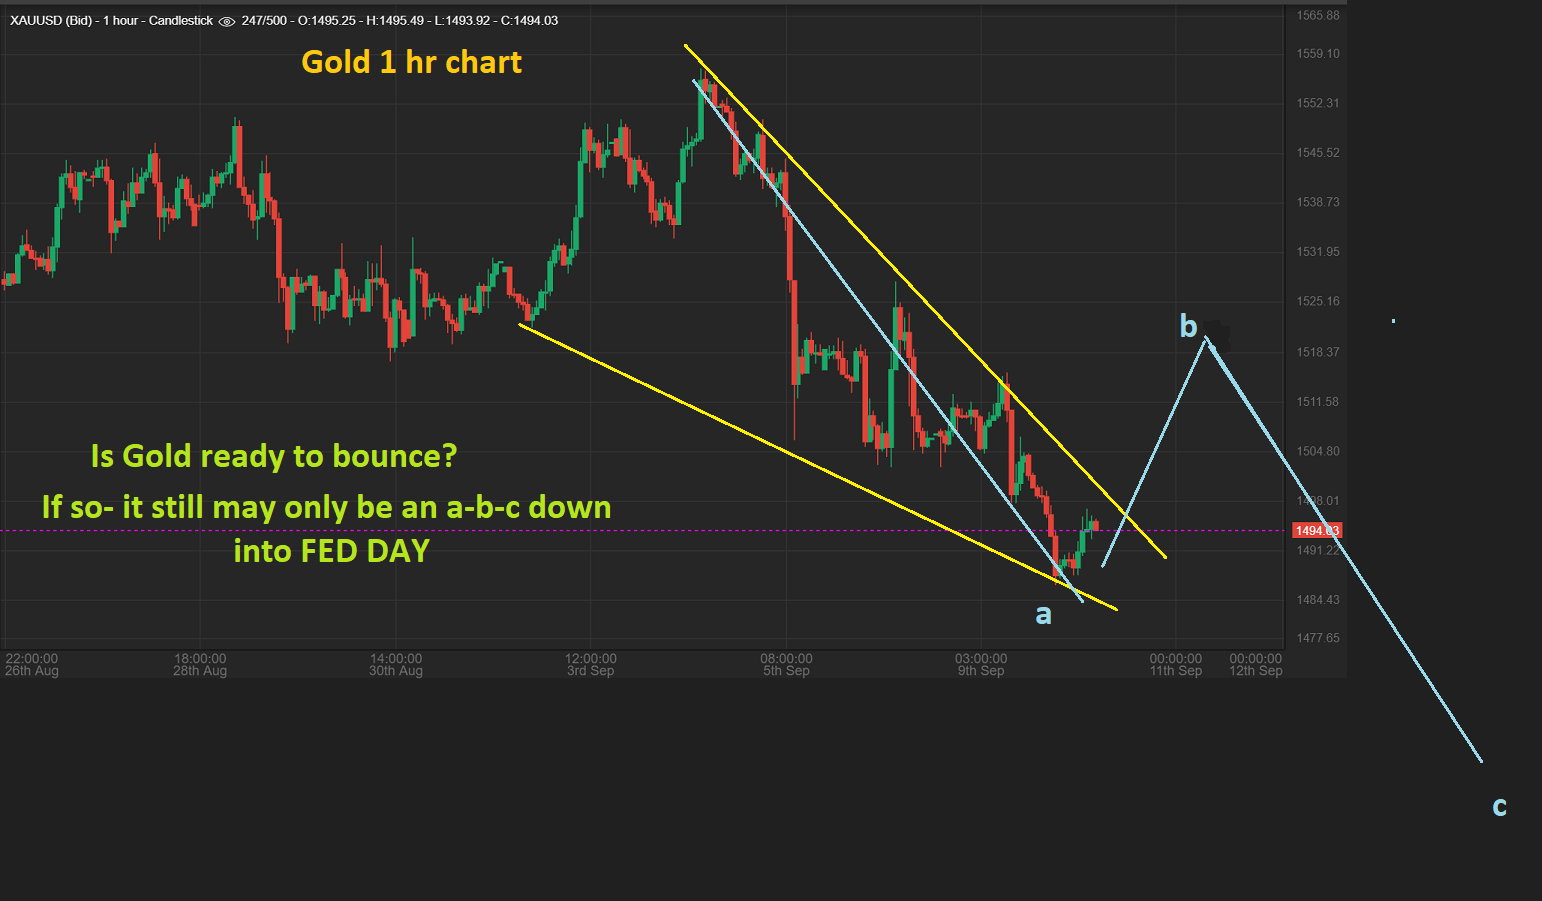
EDIT: As I am about to release this report at 6:30 a.m. Eastern time, I see GOLDS 1 hr & 2 hr charts forming a descending wedge. This means that Gold MIGHT be ready to bounce, but I just want to remind everyone that it still MIGHT only be the ‘b’ leg of an a-b-c into the fomc meeting. Only time will tell.
Gold Hourly Chart
Gold 2 Hr Chart