Wednesday September 4th
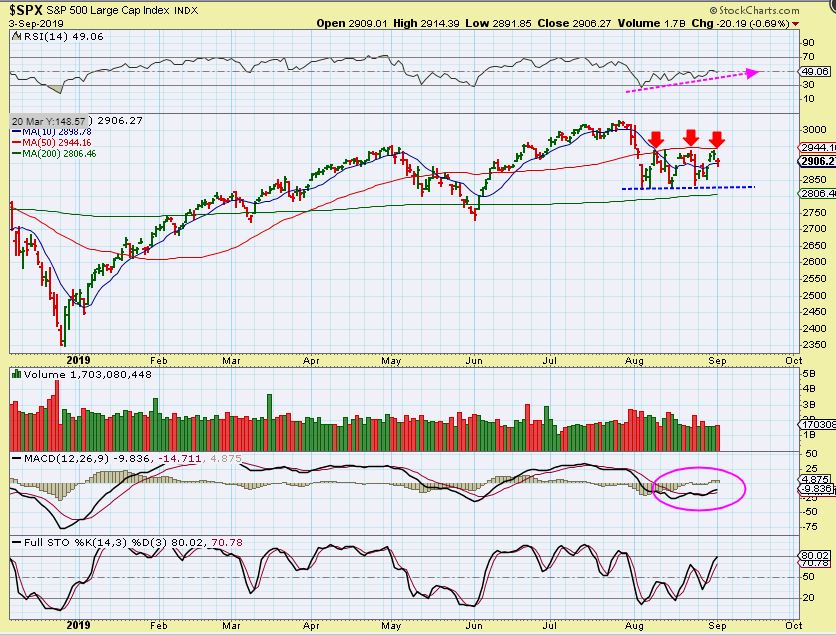
SPX – The General Markets are still stuck in this trading range. There is improvement in the indicators, but this really needs to break out sooner than later, since the daily cycle will be coming due for a drop over time. As I mentioned last week, itis starting to lean more toward the short term bullish side and could break out. If it does, I’d expect price to reach prior highs.
.
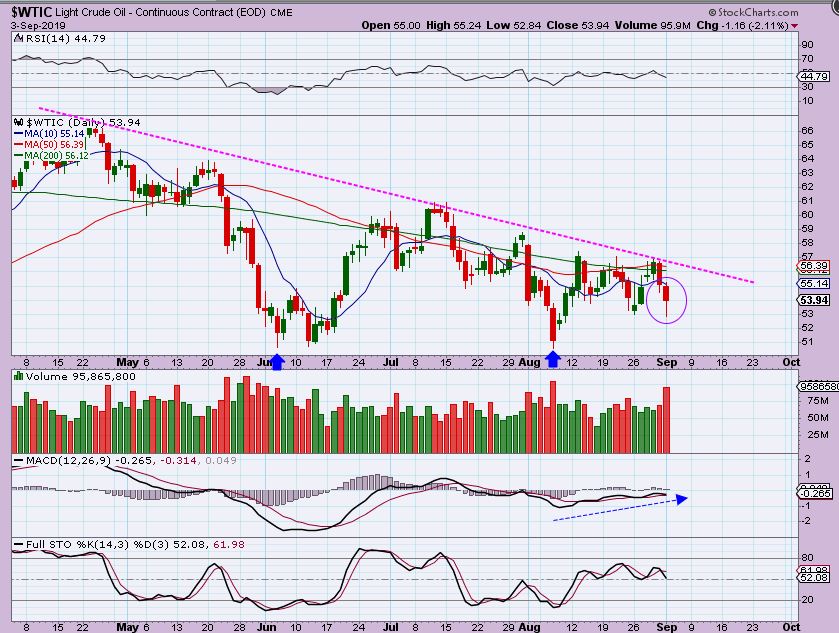
WTIC– Oil dropped and tried to recover as the day went on. Look at this chop, it remains very hard to make money in this choppy type of up & down action, but it could break out above that downtrend over time and then a more sustained move could be expected.
.
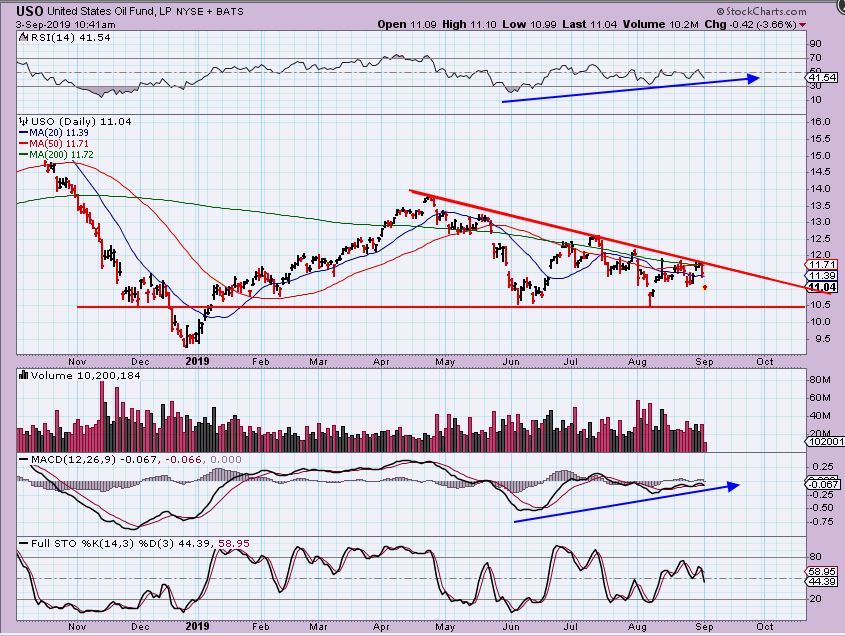
USO – I grabbed this chart an hour after the open simply to show that Oils drop wasn’t looking ‘dangerous’ to me, but simply another choppy day in the markets, but the MACD is rising. Then Oil recovered as the day went on.
.
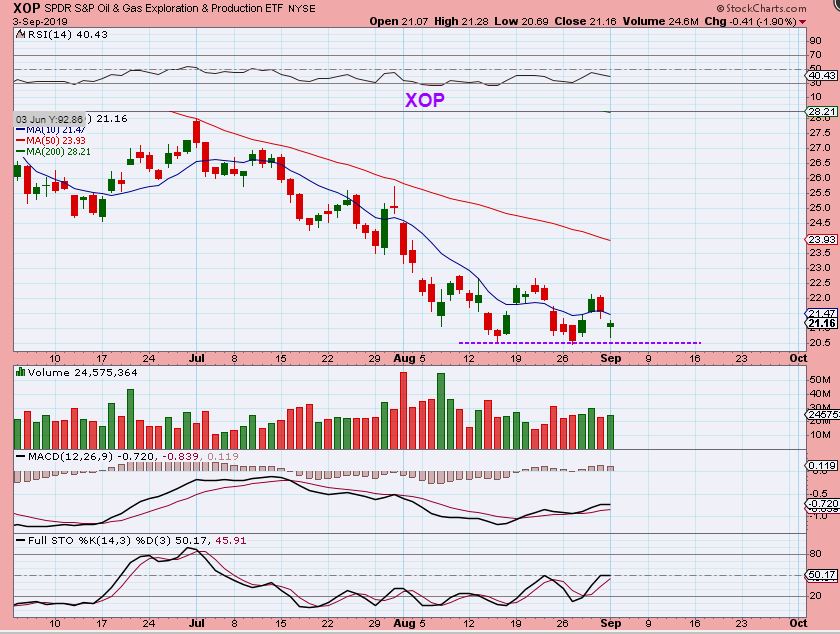
XOP – It was the same with XOP. A drop & reversal while the MACD rises. This may be building a base.
.
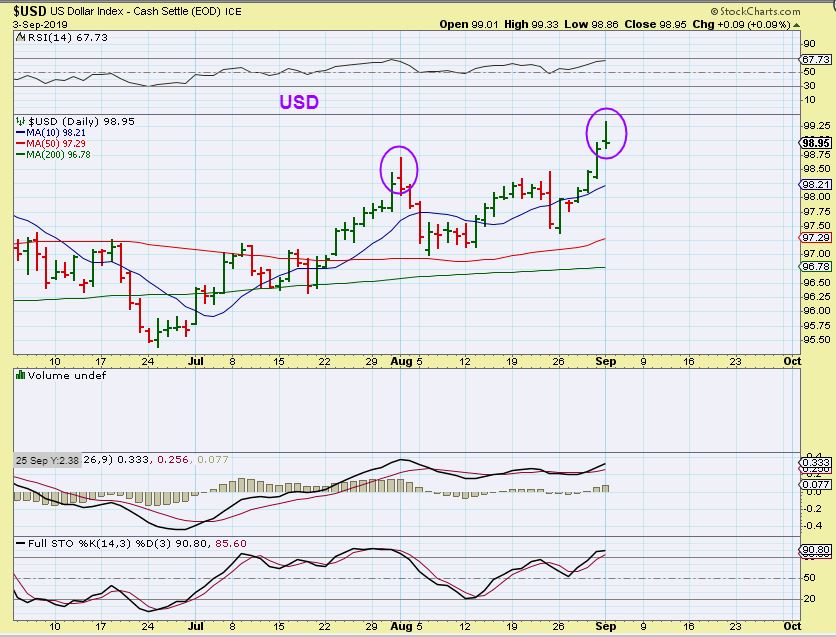
USD – THE USD MADE NEW HIGHS, but with that, Gold & Silver moved higher too. The USD ran up & then reversed lower, dropping into the close . This looks like a reversal candle. If the USD drops from here, Silver could continue its run toward $21. Gold has already reached my initial target of $1550, but it can run to $1600.
.
GOLD – When GOLD moved out of the May ICL, all we had to do was BUY & HOLD as it had plenty of time to just run higher. Here we are in September, 4 months later, and I begin to think about the possibility of the intermediate cycle peaking . That just calls for caution, but I’m still bullish.
Gold has been rising, consolidating, rising, consolidating, but there is also the anticipation of that pullback sooner or later ( ICL), so this makes it a bit more difficult until we get that ICL to buy & hold comfortably again. For now I have admonished holding a good basket of Miners to catch any upside surprise.
.
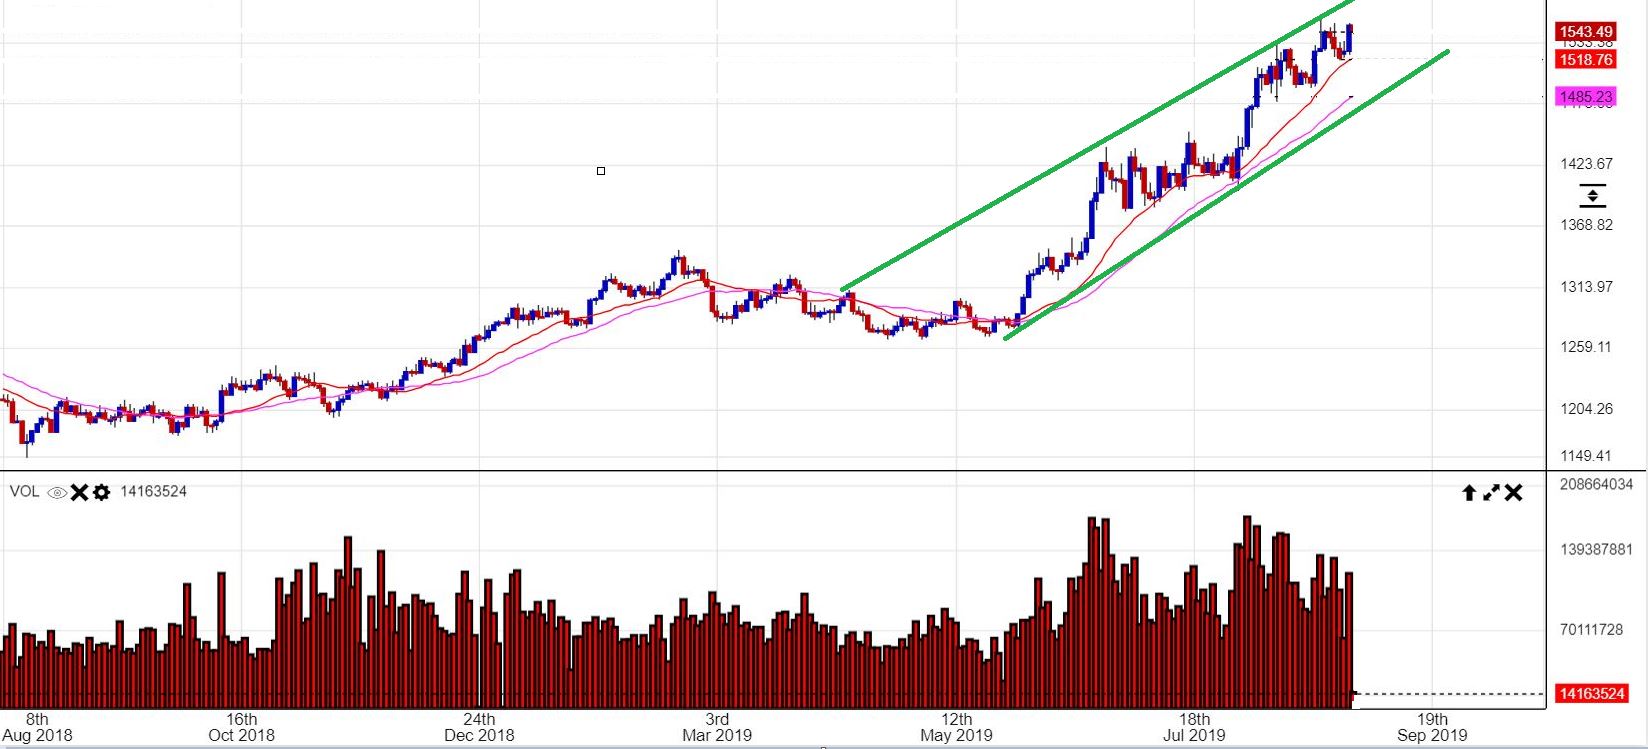
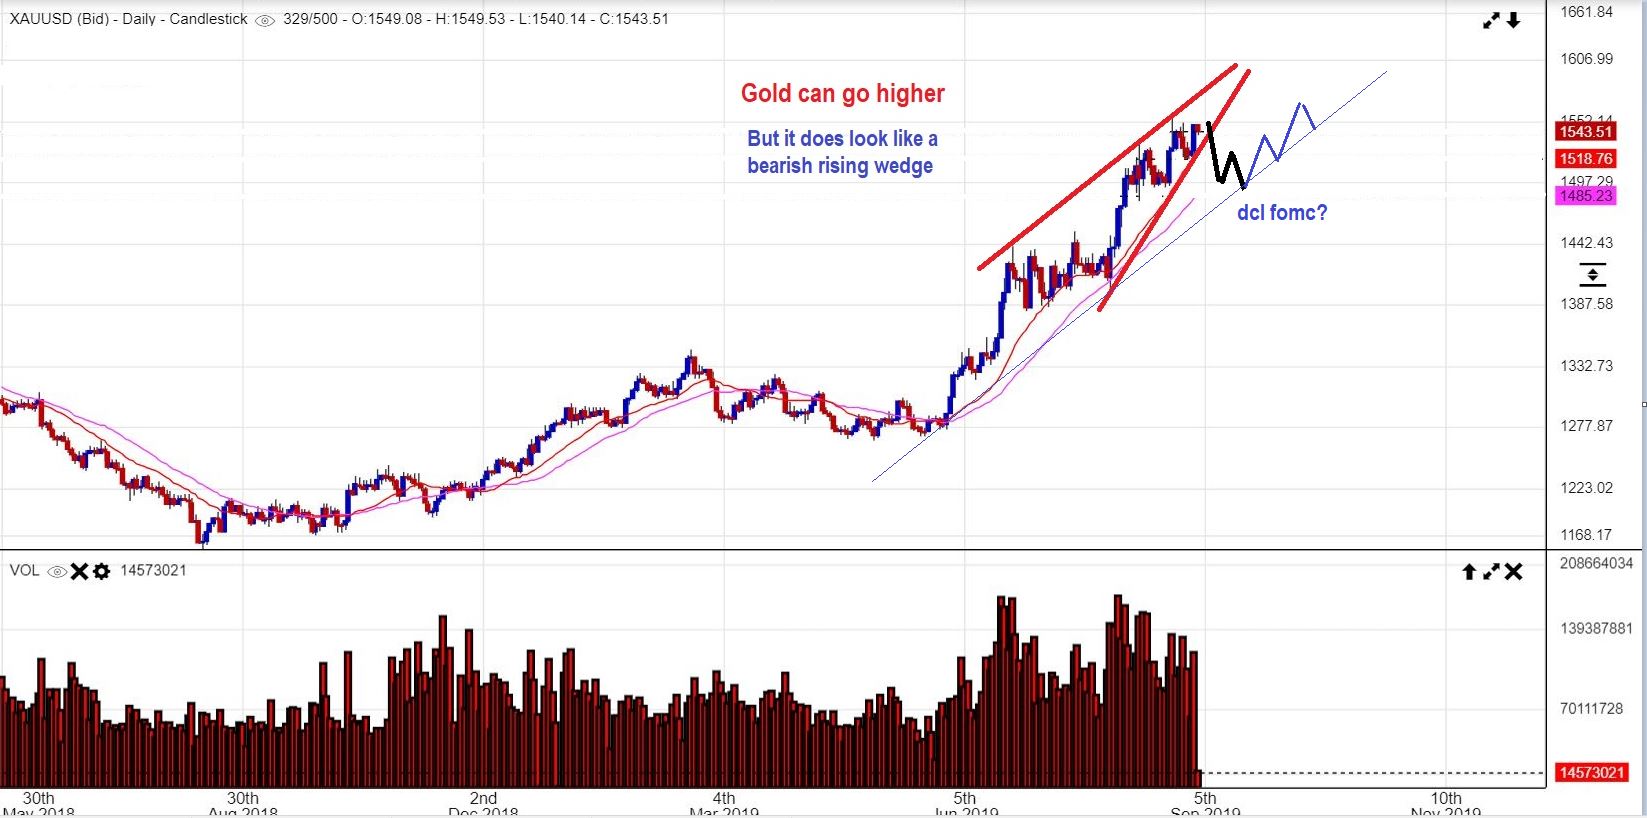
GOLD – From this channel, we see that Gold can
1. Continue to climb a little bit higher along the channel, or
2. It could even go sideways choppy like we saw in July, or
3. It also could dip down to the lower channel. Lets take another look…
.
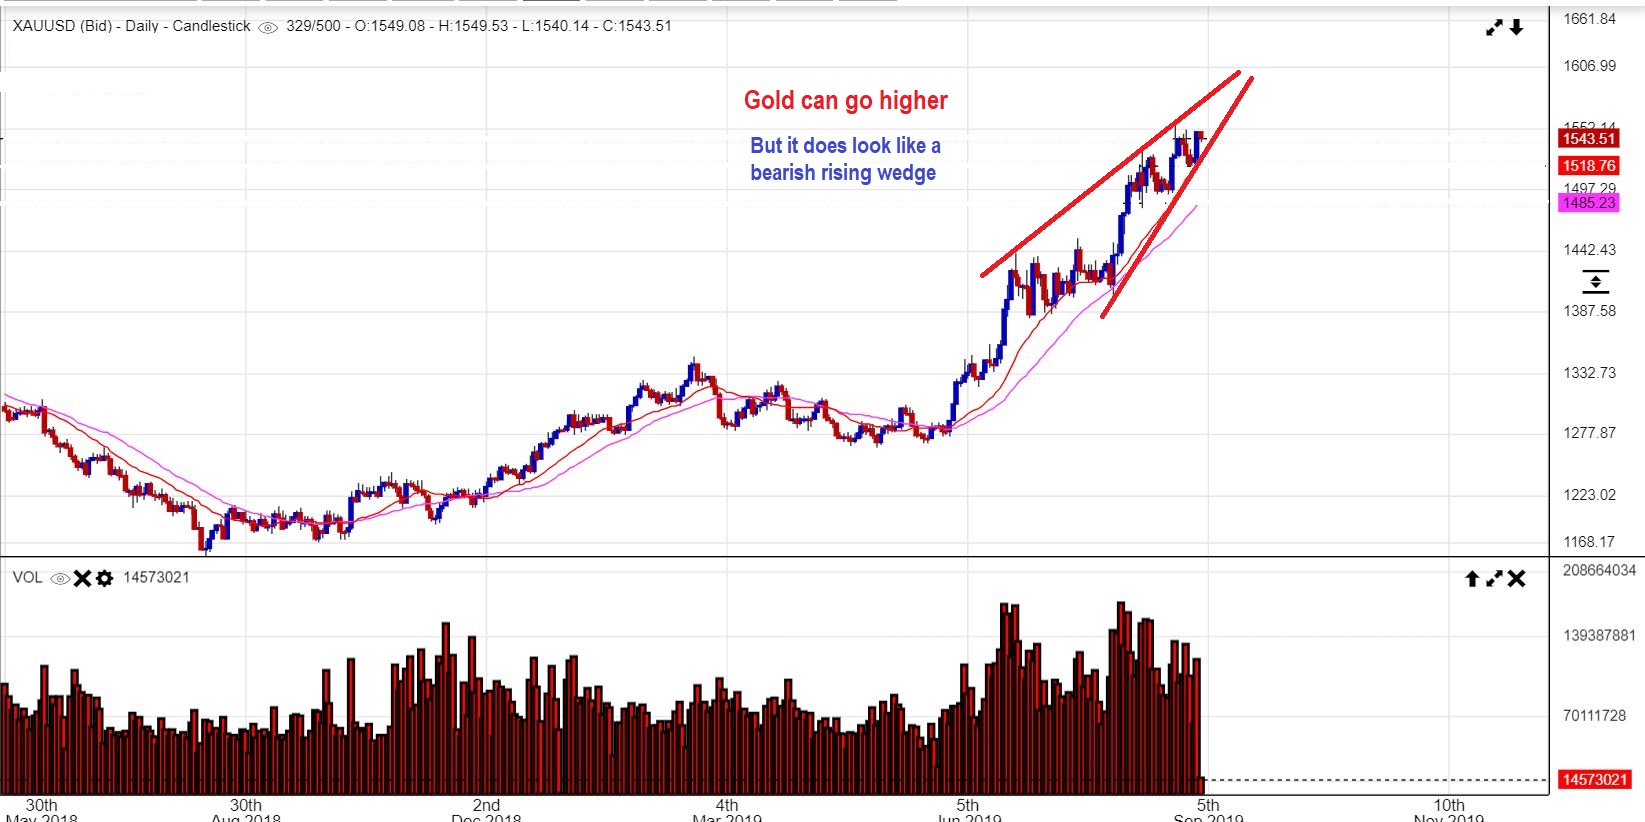
GOLD – This view does make it look like Gold will peak soon on the $1550-$1600 area, and then drop. You can see that Gold DOES have a little more room upside, so if the USD pulls back as expected, Gold can move a bit higher too.
.
GOLD – SO IT IS A BIT UNCLEAR HOW THIS MAY PLAY OUT-
1. IS THIS GOING TO PULL BACK INTO THE FOMC MEETING SEPT 18th & Bottom then? Maybe, Or
2. Is GOLD going to slowly crawl higher & ‘Peak’ around the FOMC ?
Looking at the above Gold chart, you can see that the last ICL drop into May was rather mild, maybe we get another Mild dip into the next one too, but it is still unclear as to when that will happen. For now I am holding a basket of Miners and will discuss trading a few at the end of the report.
.
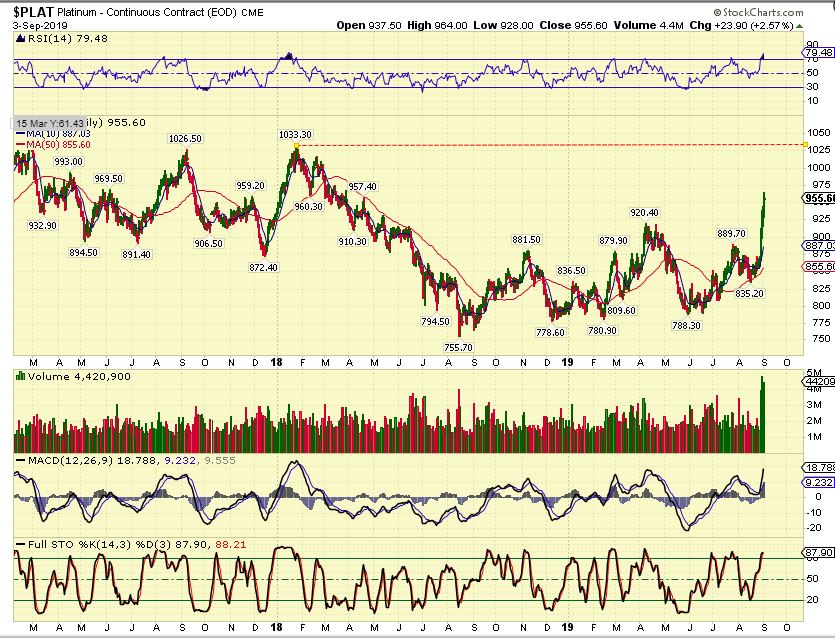
PLATINUM continues to rip higher. It has already met the regular measured target, and may be running to 2018 Highs in an extended move.
.
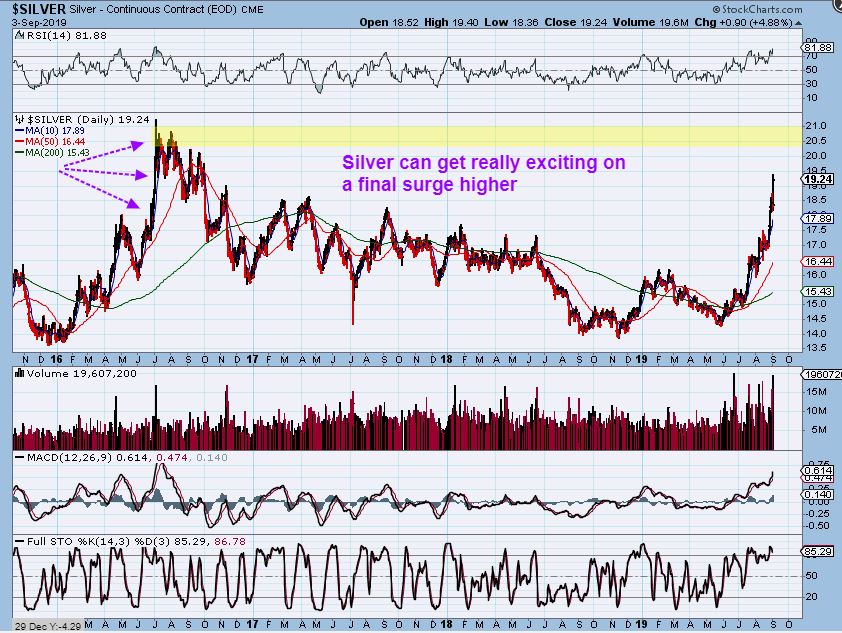
SILVER – When you step back, you can see that Silver is in one of those straight up runs. It could easily get to the $21 area if this continues. Silver was up almost 5%, but some Silver stocks were barely up, so that should tell us something.
.
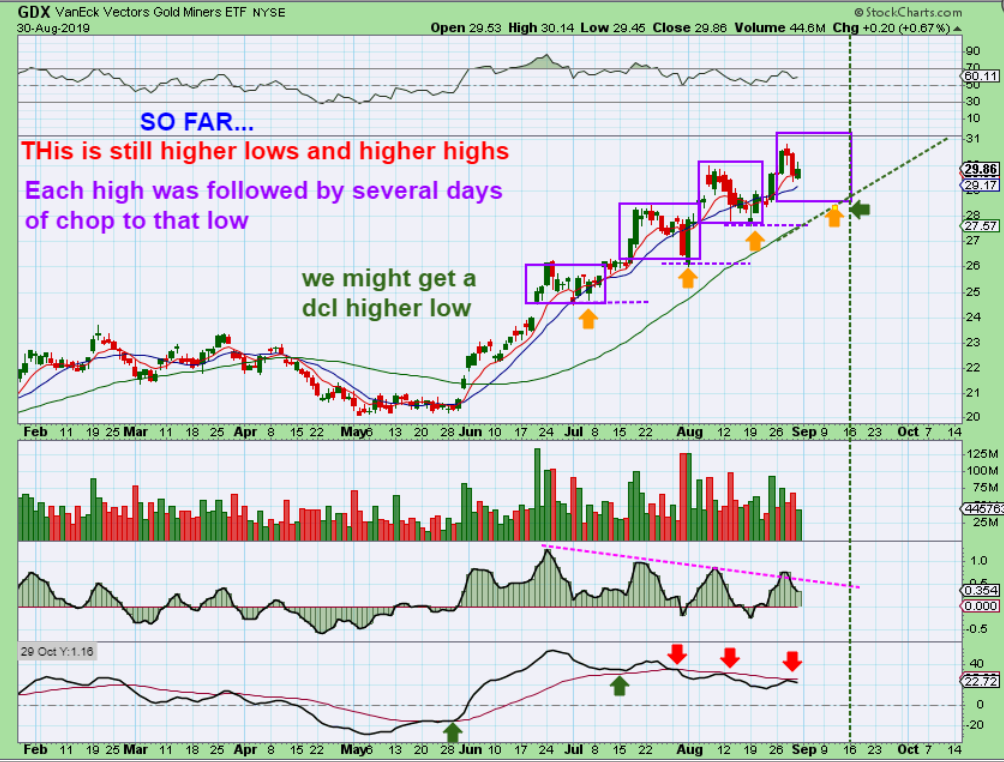
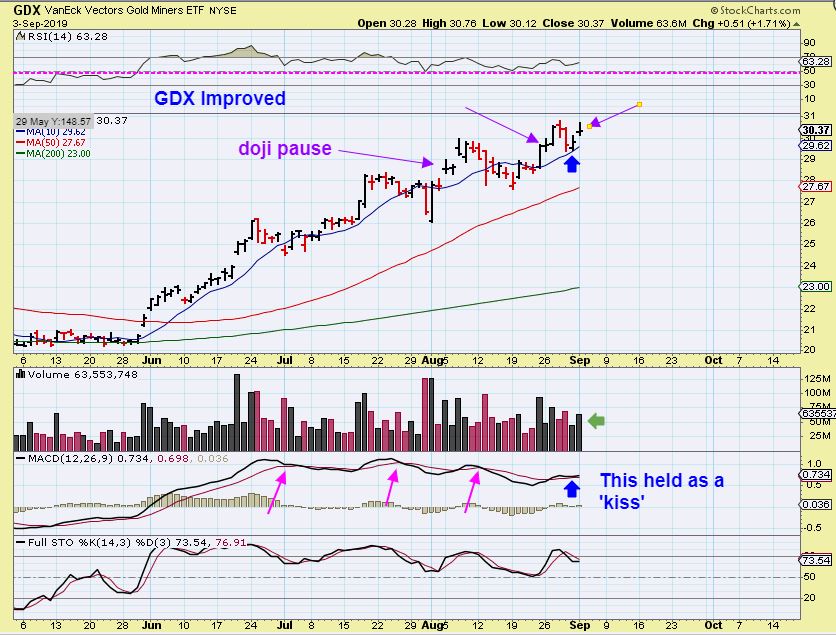
GDX – I used this chart to show the Choppy trading that Miners ETFs have displayed. I was trying to show the fomc mtg ( green line) and estimate how a dcl could develop there. It would require more sideways chop. Question: With GOLD up $25 and $Silver up a whole Dollar, did GDX just rip 5% higher too?
.
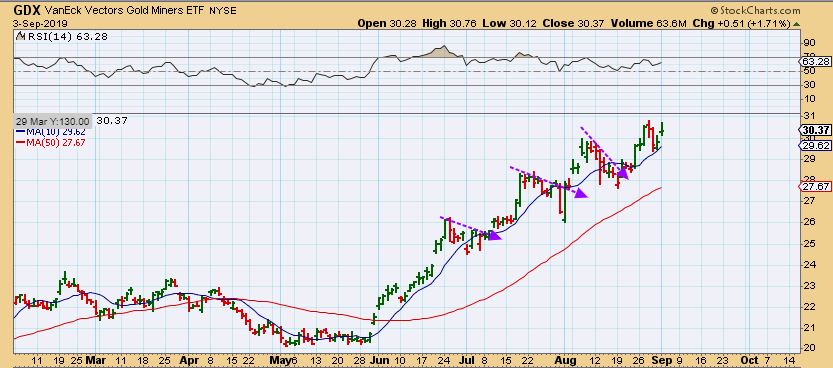
GDX – GDX was only up 1.7% with Gold & Silver ripping higher. I do think that there is improvement in the charts, but that was not a great day for Miners. Notice this: The MACD has been breaking up and then breaking back down (Magenta arrows). For the first time, we got a cross over & back test ‘kiss’ rather than breaking back down through. So far, that is improvement, but this run may be peaking for now. I called for $31 long ago, and we can’t even quite tag that yet.
.
GDX – GDX sold off into the close, while GOLD & SILVER held a lot of their gains, so that is a weak day of action compared to the Metals. This may just remain choppy & sideways, with good days and bad. We saw that in 2016 before the May ICL too. More time will tell…
.
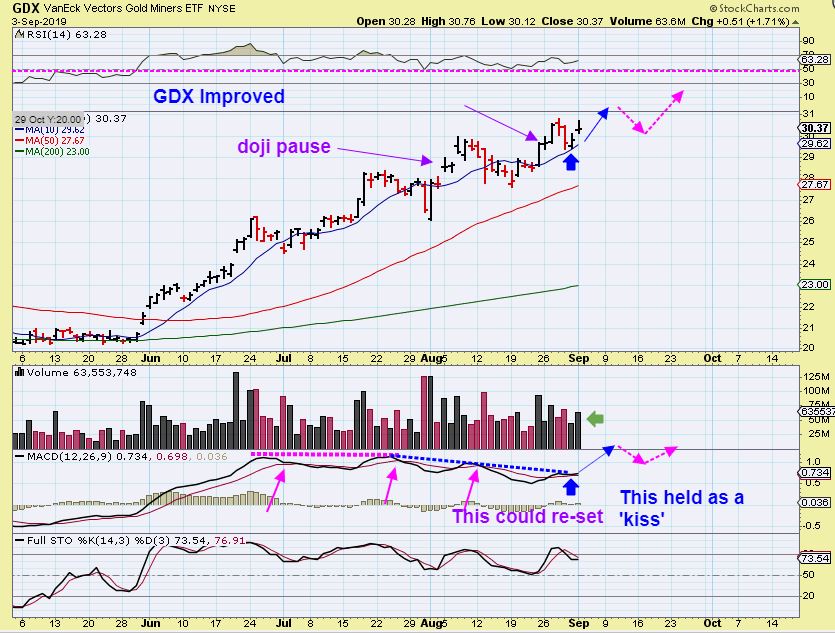
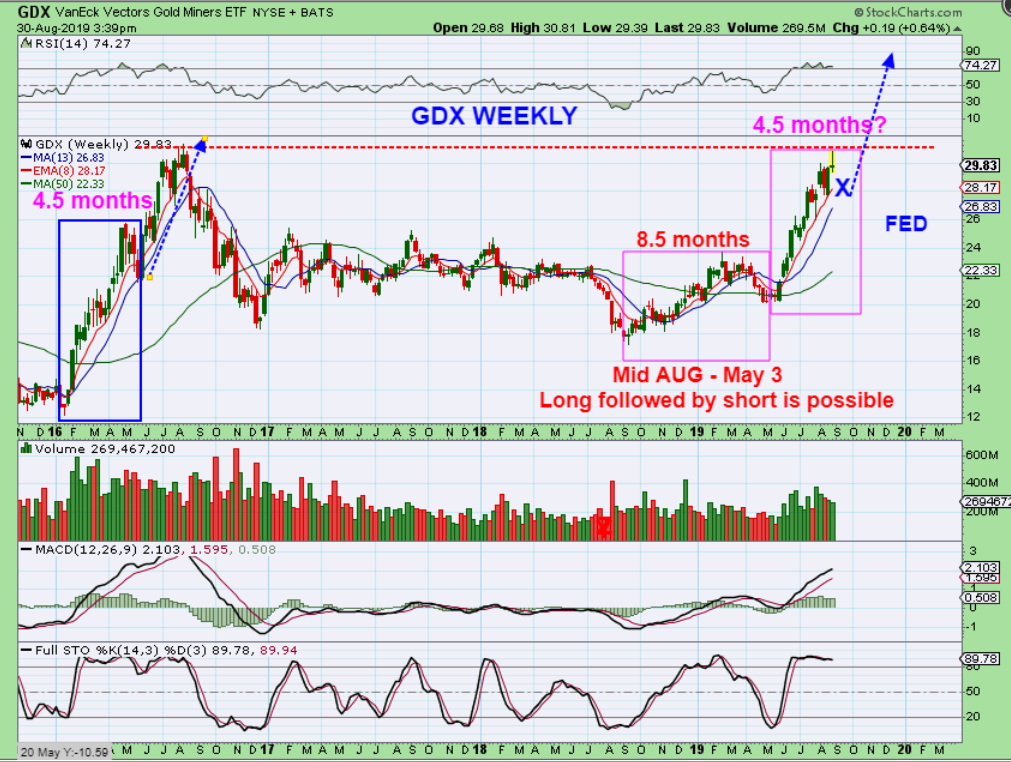
GDX – But I used this chart in the weekend report, and it fits a choppy , toppy kind of week , where we then dip into the FOMC for September 18. This could still happen.
.
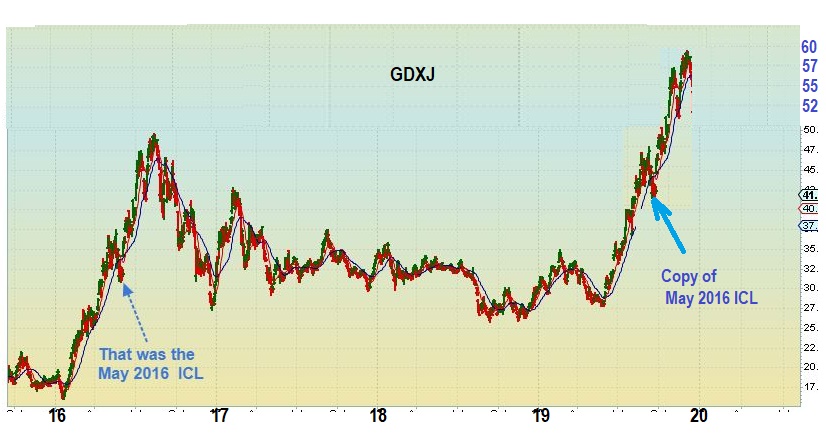
GDXJ- GDXJ dropped last week and found support at the 10sma, so that can be viewed s short term bullish too, but GDXJ may just remain sideways and choppy too. All of this still fits…
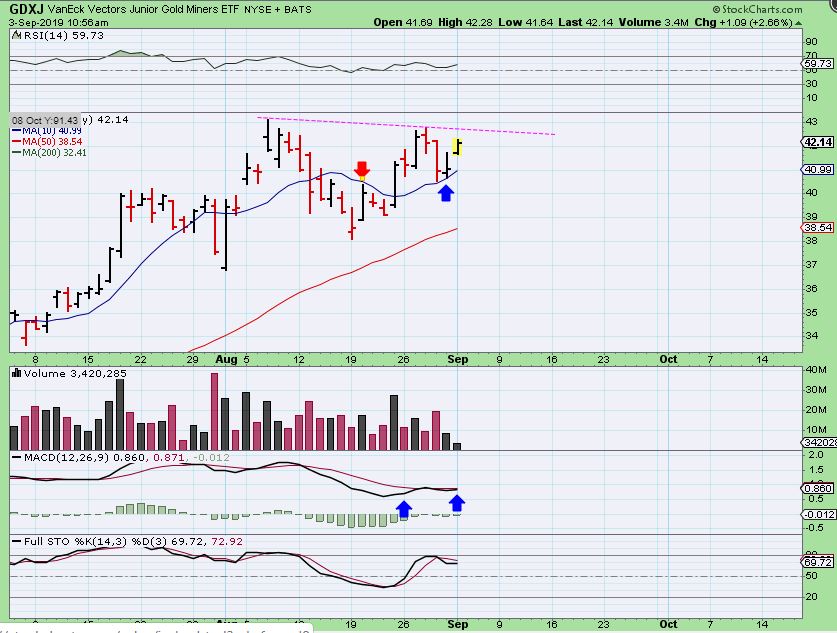
All of this still fits this chart that I posted a while ago. This was my idea of seeing more discern-able dip sooner than later, and that could show up like the MAY ICL dip in 2016. We just can’t tell if that dip will come before or after the next FOMC Mtg.
.
So the General Markets remain range bound, OIL is chopping up & down, looking bullish one day and weak the next. Then we get to Precious Metals and certainly Gold & Silver did bullish run higher Sunday through Tuesday, but GDX was up less than 2%. We like to see Miners lead the Metals, but they have become choppy. It should be noted that various individual Miners are doing their own thing. I called for that a while ago- saying that some Miners may ignore times when GDX drops & they could put in a bullish run on their own merit. That is why holding a basket of Miners can help. I am definitely seeing that now. I will discuss that further below.
.
Enjoy your Wednesday trading!
.
~ALEX
.
Let’s pick up where I left off saying that some individual Miners may ignore times when GDX or GDXJ dips. This is GDX, notice the choppy sideways trade at times.
.
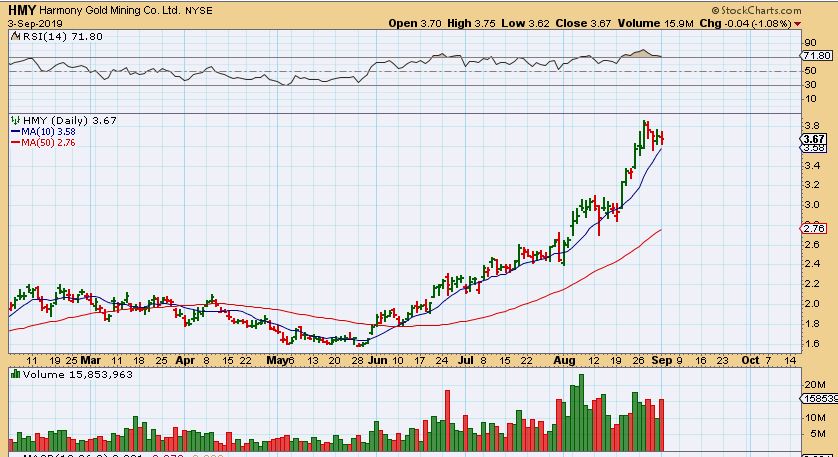
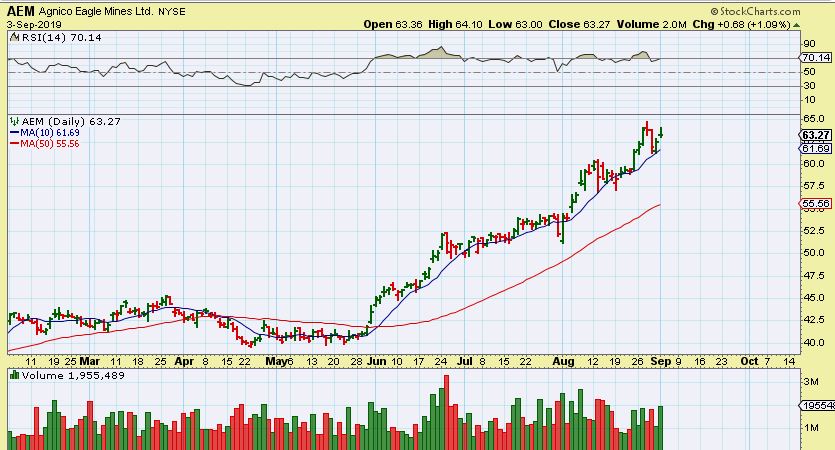
This is HMY & AEM, and you can also look at DRD, AXU, RGLD, AU, EGO, and a few others and you’ll see that they do not really have the deeper dips that GDX had. So…
.
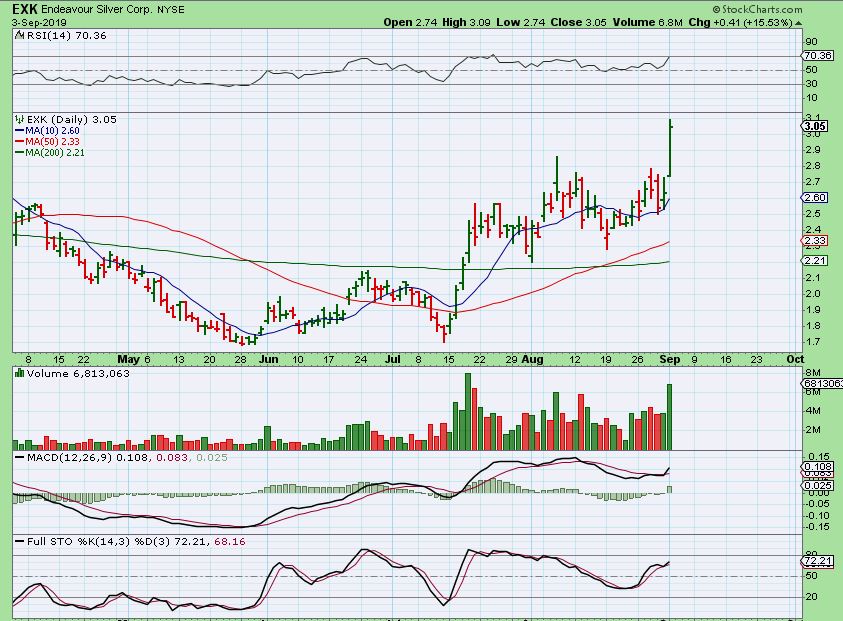
EXK– EXK popped 15% out of nowhere Tuesday (Surprises to the upside) . So while GDX & GDXJ sold off into the close, we do still see some individual stocks out performing, so I am continuing to hold my basket of Miners.
.
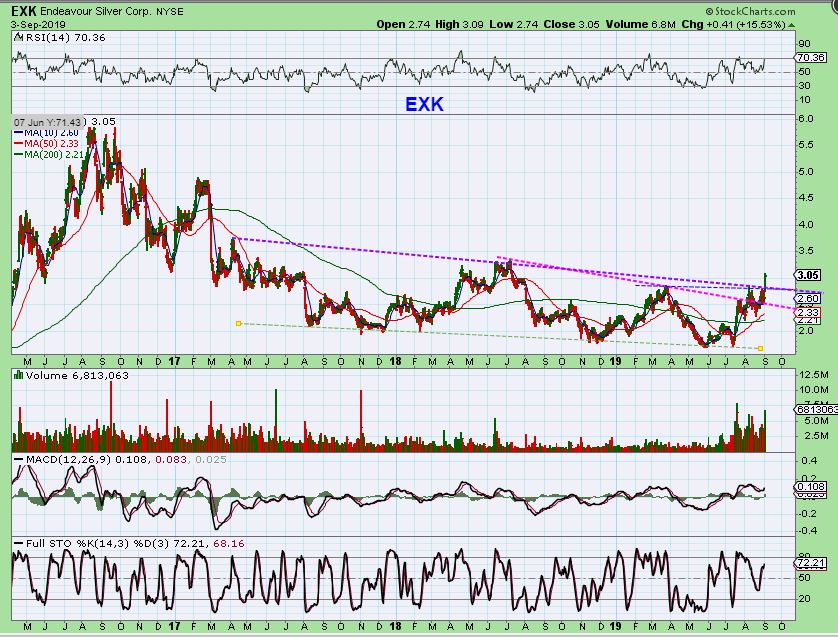
EXK– Many Miners have a multi-year base and can run back to their former highs. For EXK, that is another 100% move from here over time.
.
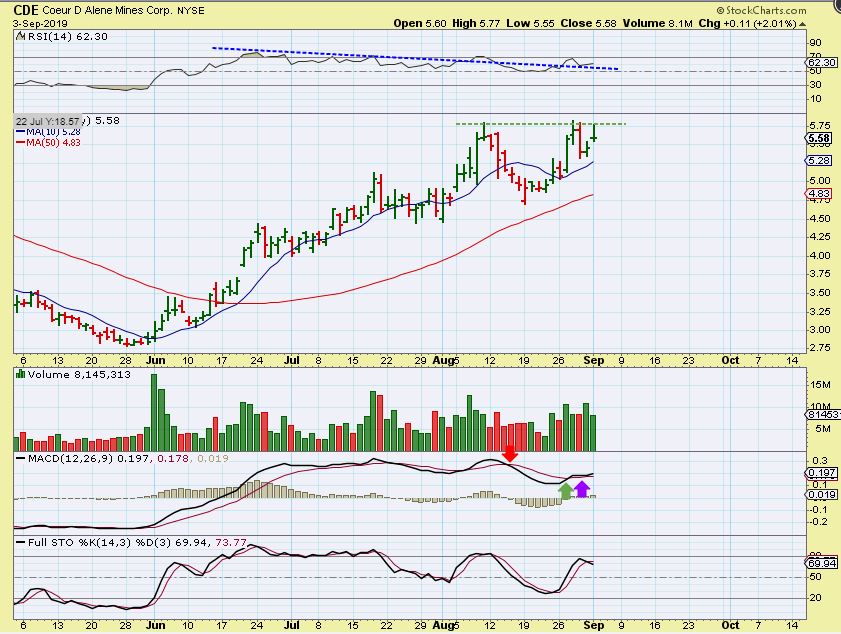
CDE – The RSI & MACD could be improving with the sideways movement, So I stepped back and saw that CDE is battling a resistance area…
.
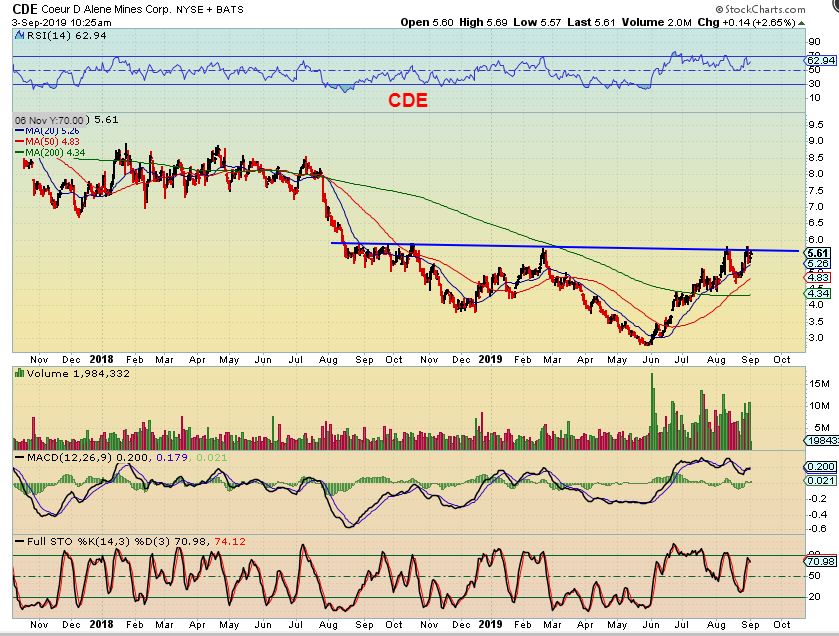
CDE – Battling resistance. So that sideways chop with improving MACD & RSI may be foreshadowing a break out in the future. CDE can pull back from here, but it may not drop very much if we do get a precious metals pull back into the FED MTG.
.
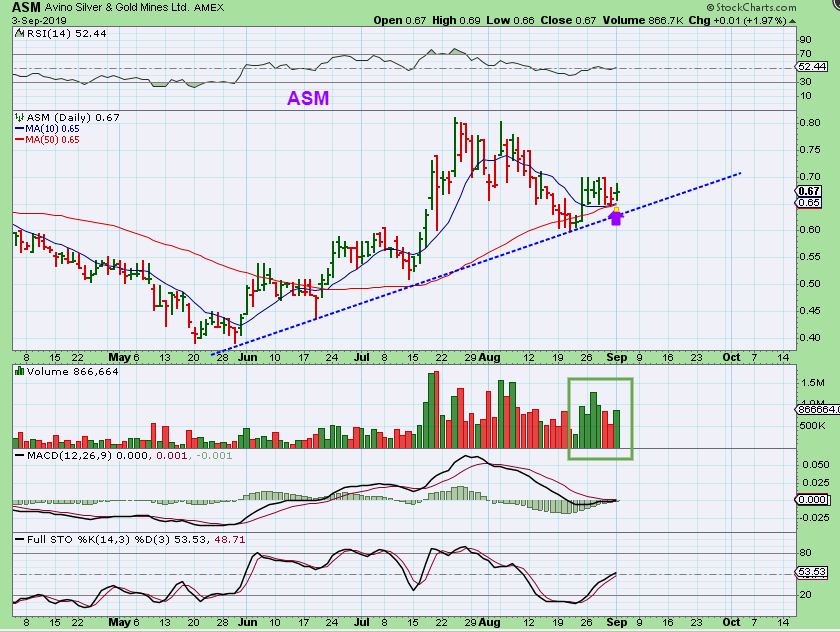
ASM – ASM had a strong run in July and has actually moved up 100% since the May lows to the peak, but in the last few weeks it stalled at the 50sma & uptrend line. Even Silvers big Pop Tuesday didn’t restart the fire, but I do like this set up, so it is a good one for your watch list. Lets step back…
.
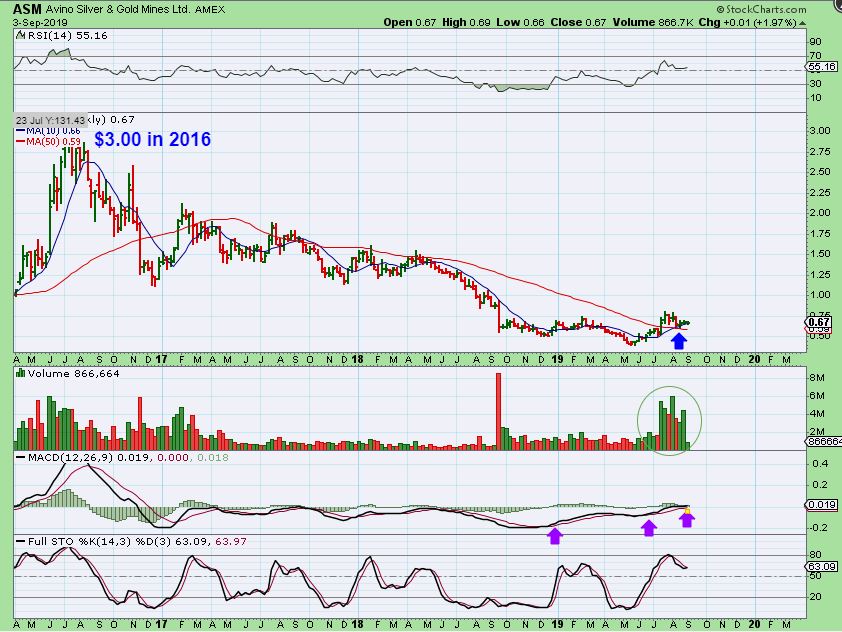
ASM – The Big Picture shows that even though it ran up 100% in the last 4 months, it has MUCH higher possibilities over time. We are seeing strong volume since July, so I still own this one at this point.
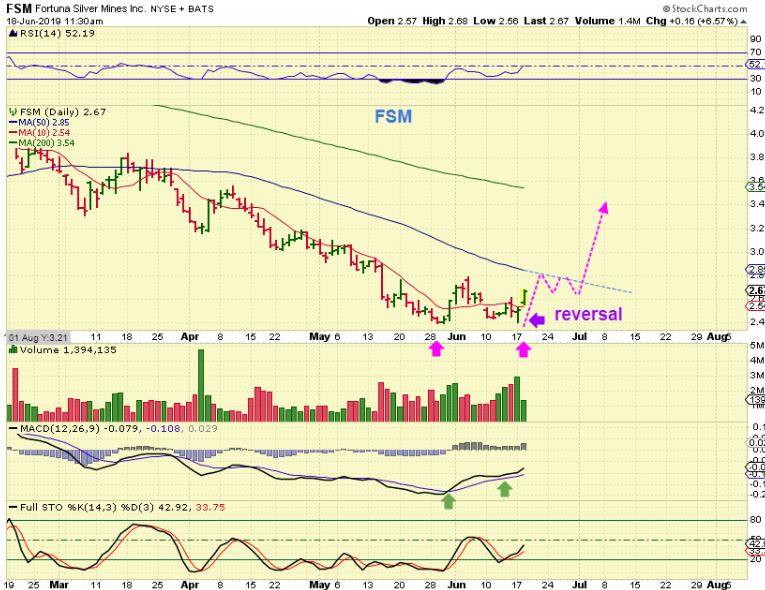
FSM – I liked FSM Tuesday morning, trying to break higher here.
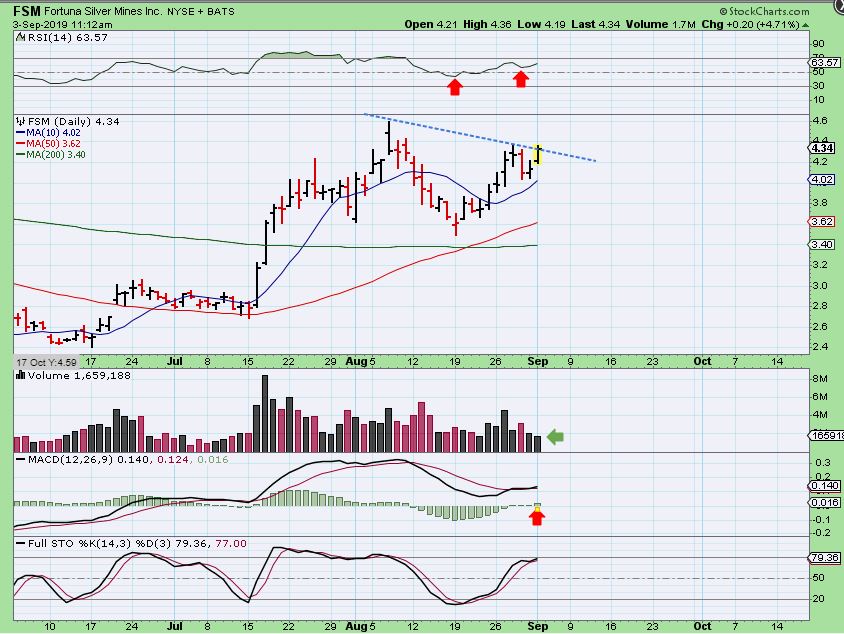
.
FSM – It closed with good volume & I added some back to my portfolio, knowing that I can just hold on for the choppy ride, or stop out of the new addition if I want to. And…
WITH THESE 2 CHARTS, WE BOUGHT THE LOWS FOR OUR FIRST BATCH, SO I HAVE CUSHION IN THIS MINERS PRICE
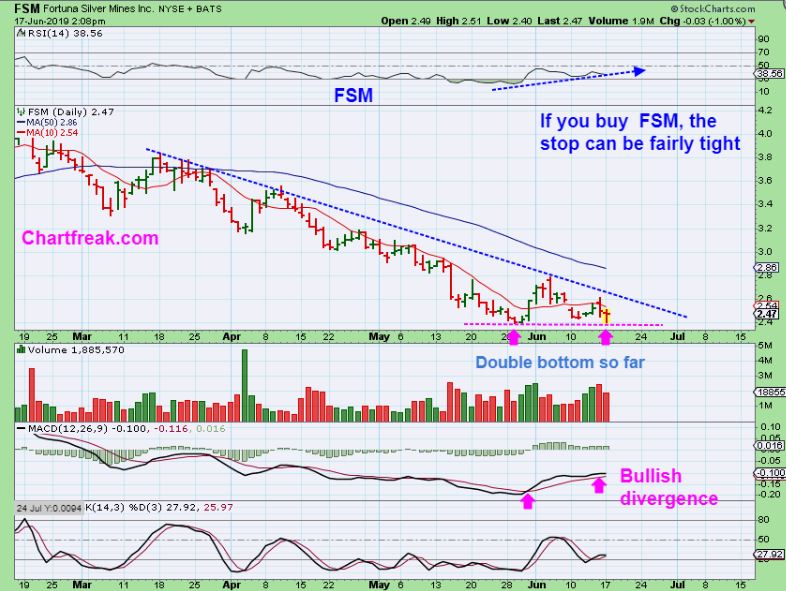
WE BOUGHT THE LOWS FOR OUR FIRST BATCH
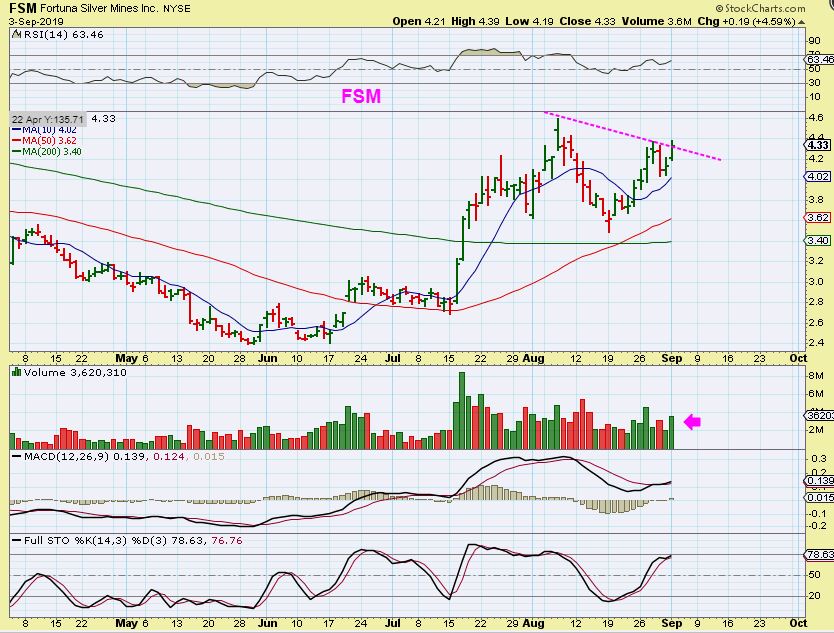
FSM– The Big Picture is good, but it did hit resistance (blue line). I think it will work its way above that on the next good run.
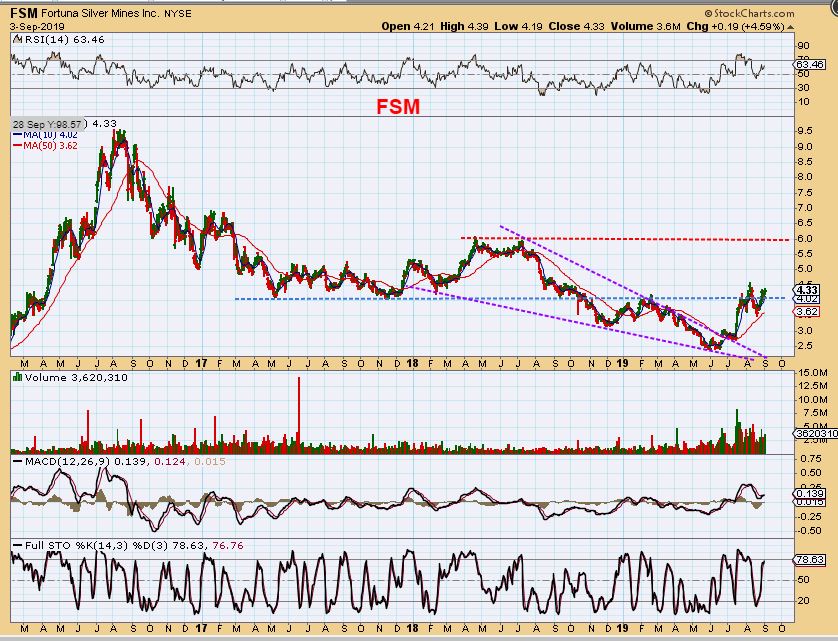
.
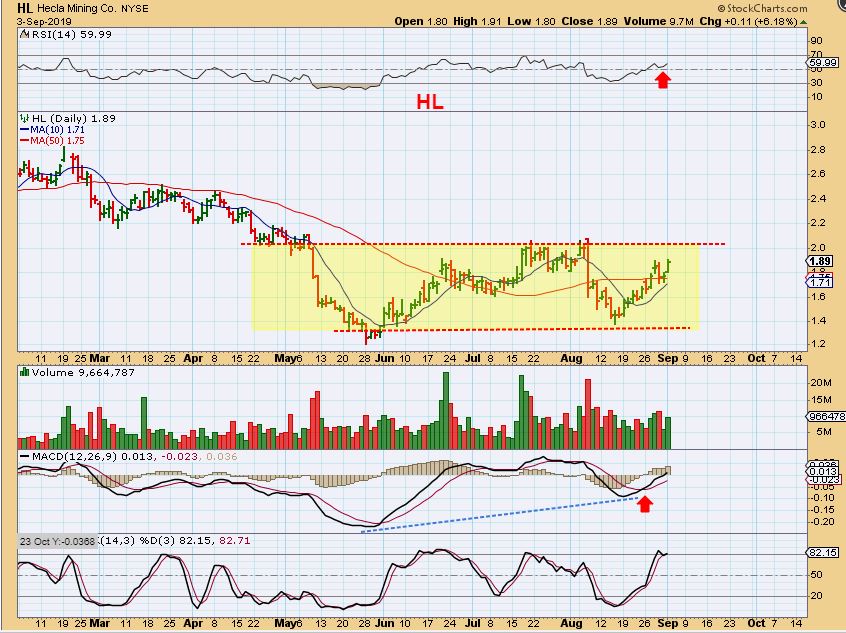
HL – Hecla is also a laggard, NOT ramping up from the MAY ICL & holding gains, it has double bottomed. Now we may be seeing a base formed, and HL was up 6% & held that 50ma. So some of these lagging junior stocks may start to play catch up.
.
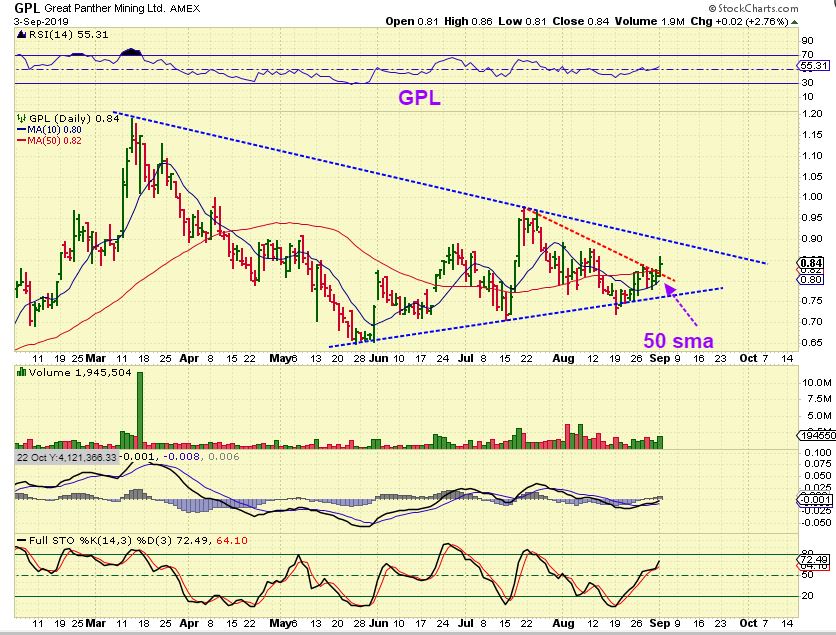
GPL – Another one that has been slow to get going, but could play catch up is GPL. I’d keep it on a watch list. It can be bought here, since a stop under the blue line gives you a lower risk entry, risk/reward wise.