
Wednesday August 28th
We are invested in the Bull Market of the Precious Metals Sector, and even though the weekly charts are looking a bit extended, we keep seeing surprises to the Upside, as upside targets continue to get hit. I did mention in the weekend report that this could be an up week for the Miners, so let’s take a look at the Market action …
I’m not going to spend a lot of time on other sectors, there has been no important change. As a quick review…
.
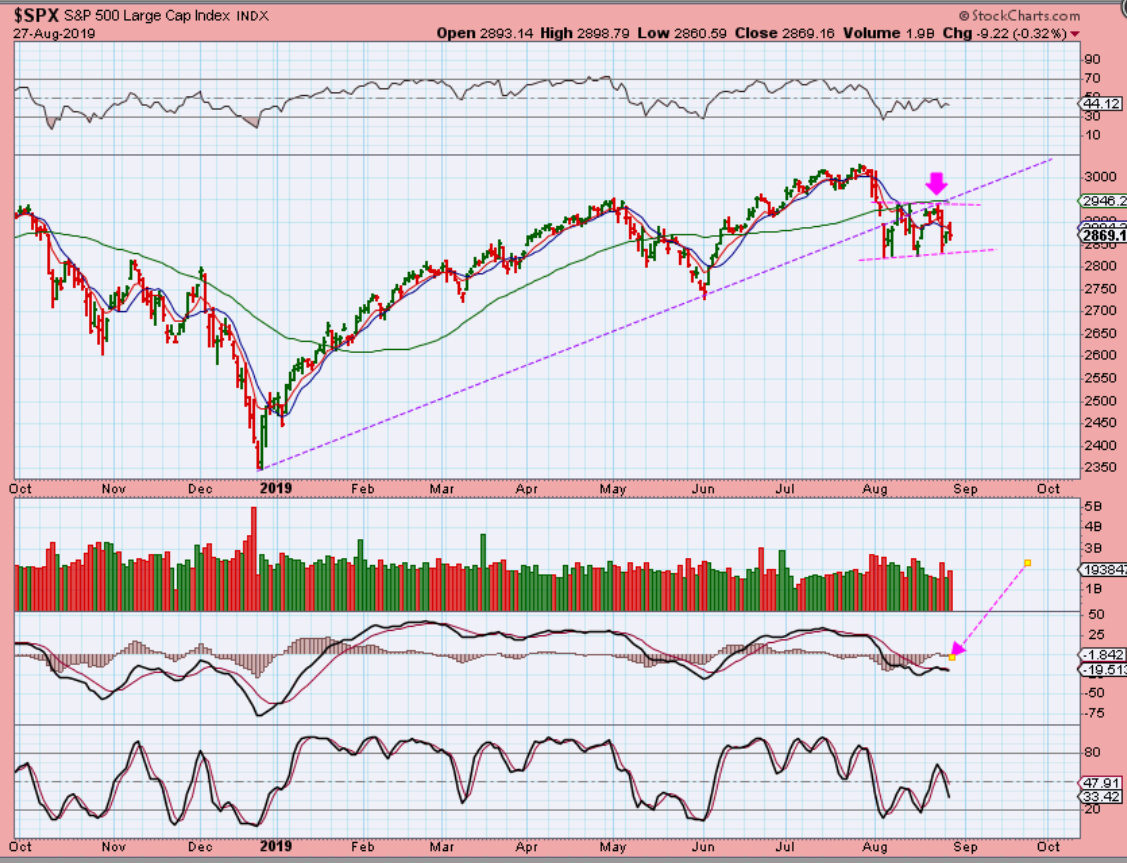
SPX – No change, and this recent trading range could be a back test, held back by the 50sma.
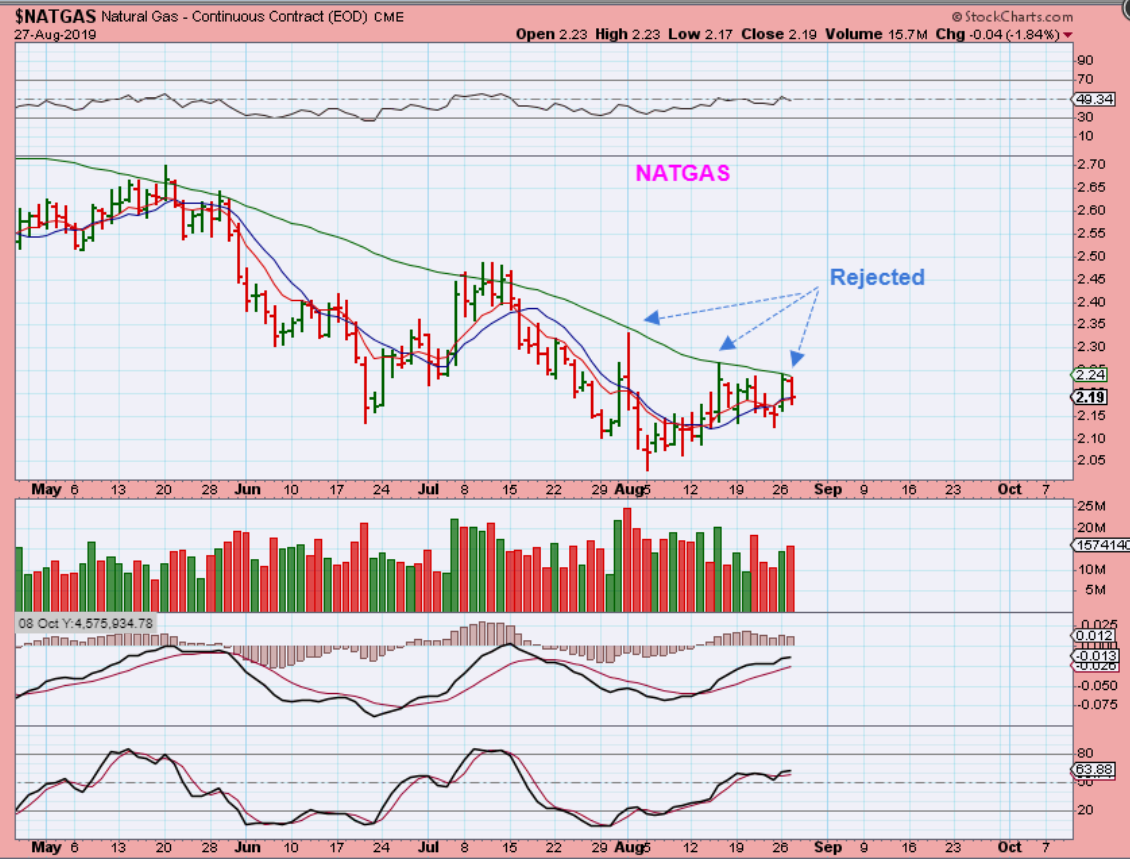
NATGAS – No break out on the possible bullish set up for Natgas. OIL Moved higher, but XOP, XLE, OIH Dropped to NEW LOWS.
.
In the weekend report, I did actually say that we could rally this week, maybe even into next week, but it was time to also be cautious. Certain weekly indicators that I use are signaling that we could be near a top for this intermediate Cycle, and also divergence is showing up in GDX GDXJ. I mentioned that we aren’t Bearish, just ‘cautious’ under these conditions. Tuesday gave us more “Surprises to the upside”. QUICK REVEW FROM THE WEEKEND REPORT:
.
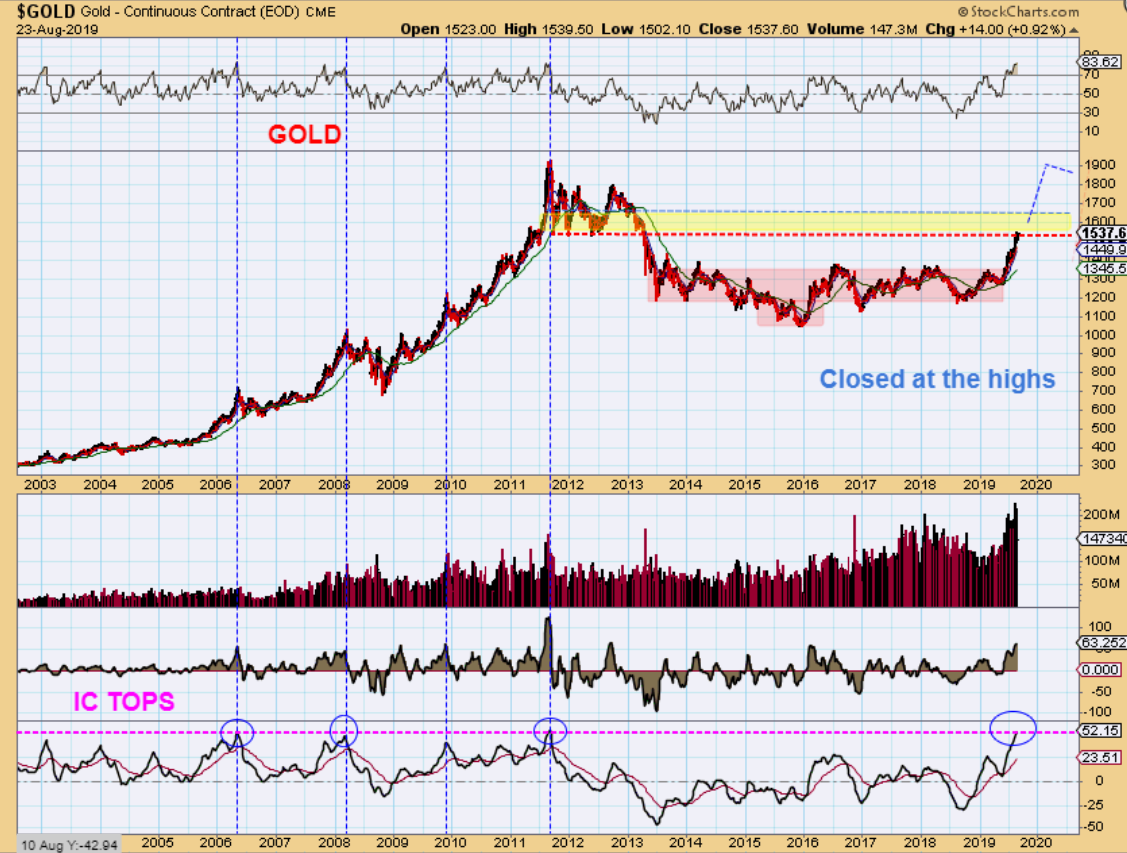
IN THE WEEKEND REPORT I Said: Look at my lower weekly indicator. I have marked the Major tops ( Intermediate Cycle Tops) DURING A MAJOR BULL RUN . Can we still get another week higher out of this? Yes, it’s a weekly chart, next week could rally. What about 2 weeks? Maybe, but I just have to use the tools that I have developed, and I need to view them ‘unemotionally’. My hopes , dreams, and desires are for Gold to rally to $1900 right now, but my charts are warning me that in prior Bull Market Rallies, it was time to begin a drop into an ICL soon. The best results now may come from Using & raising stops as we run from here.
.
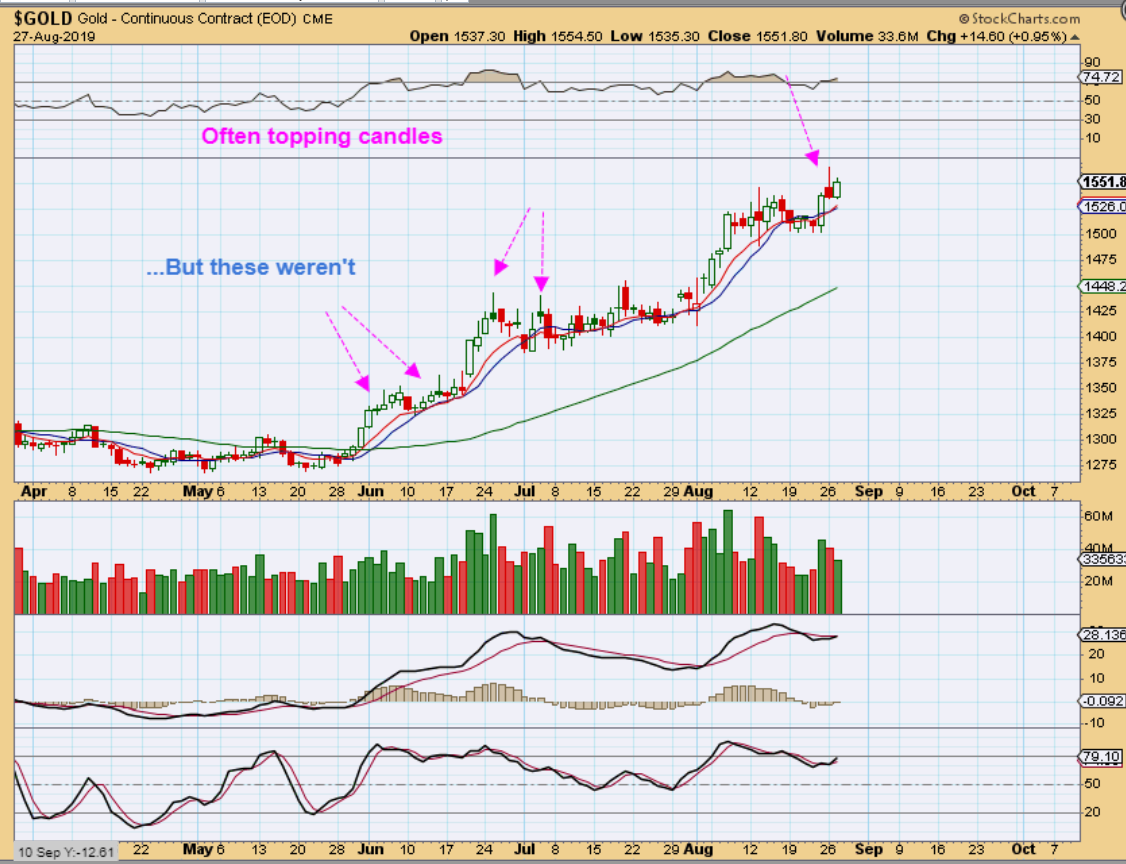
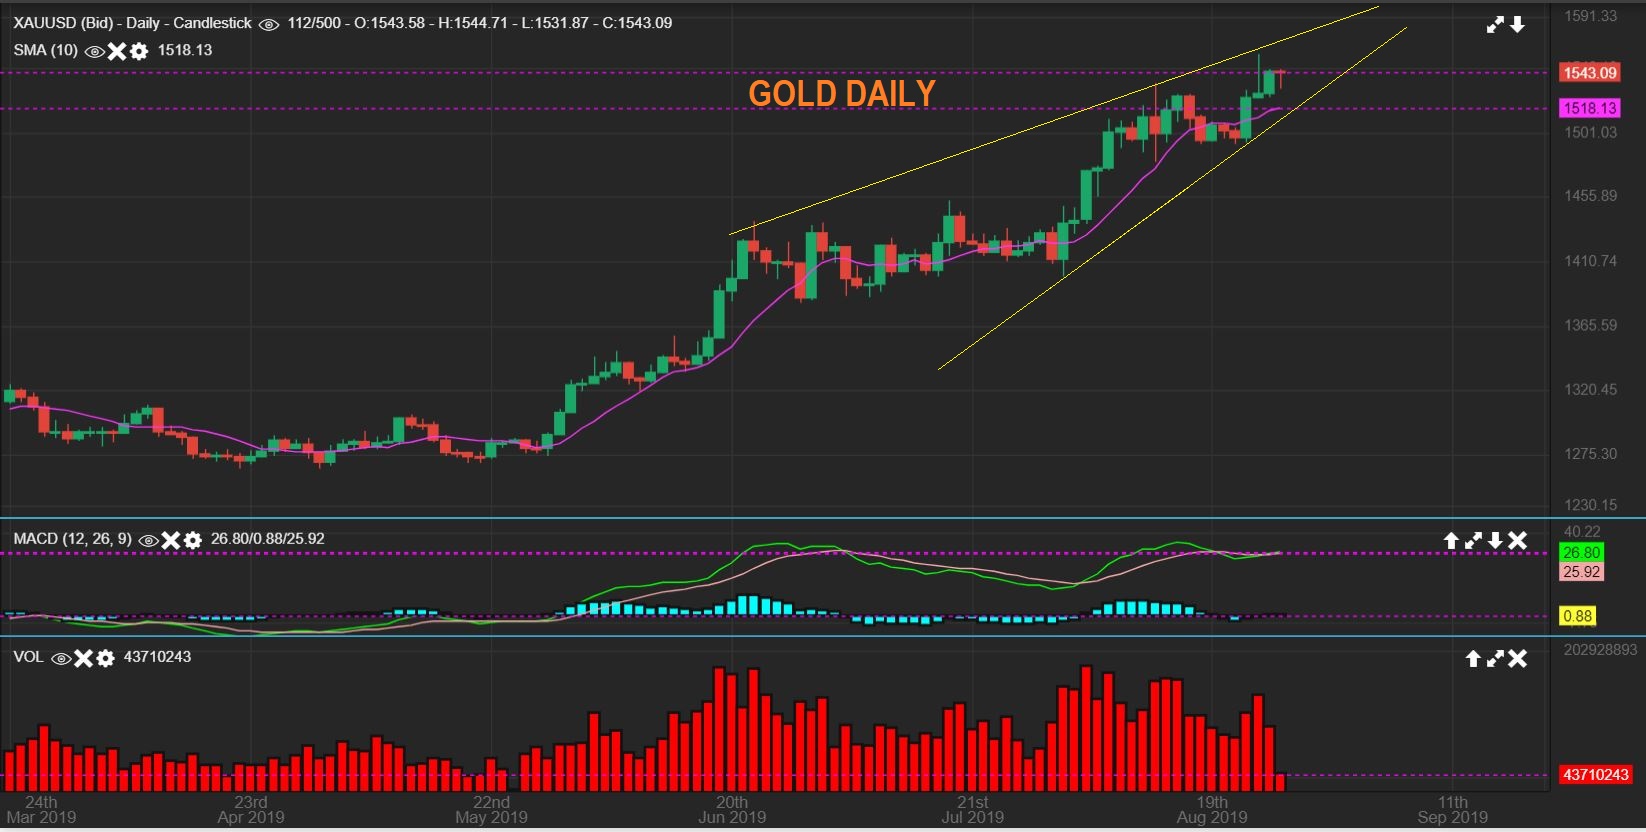
GOLD then Popped Sunday night to $1555 & dropped – This is often a topping candle but not always as seen below. Tuesday saw Silver take off higher, and Gold followed along. What else do I see when I look at the Gold chart?…
.
BEARISH GOLDEN WEDGE – Unless Gold can break strongly higher, I also see a bearish wedge forming. We do have some upside room, but we are closing in on that APEX and these are a sign of a coming pull back too.
.
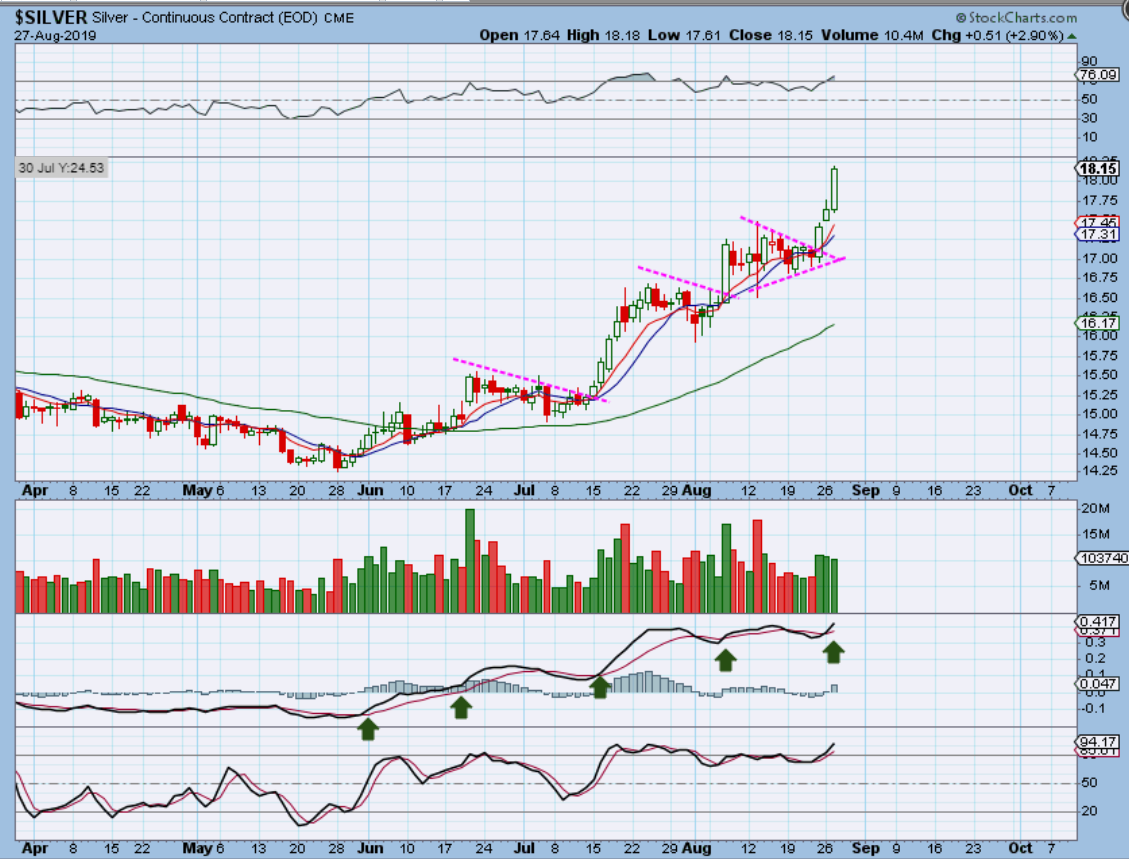
SILVER – Silver really pushed nicely higher, and the MACD actually remains strong on Silver, so surprises to the upside continued.
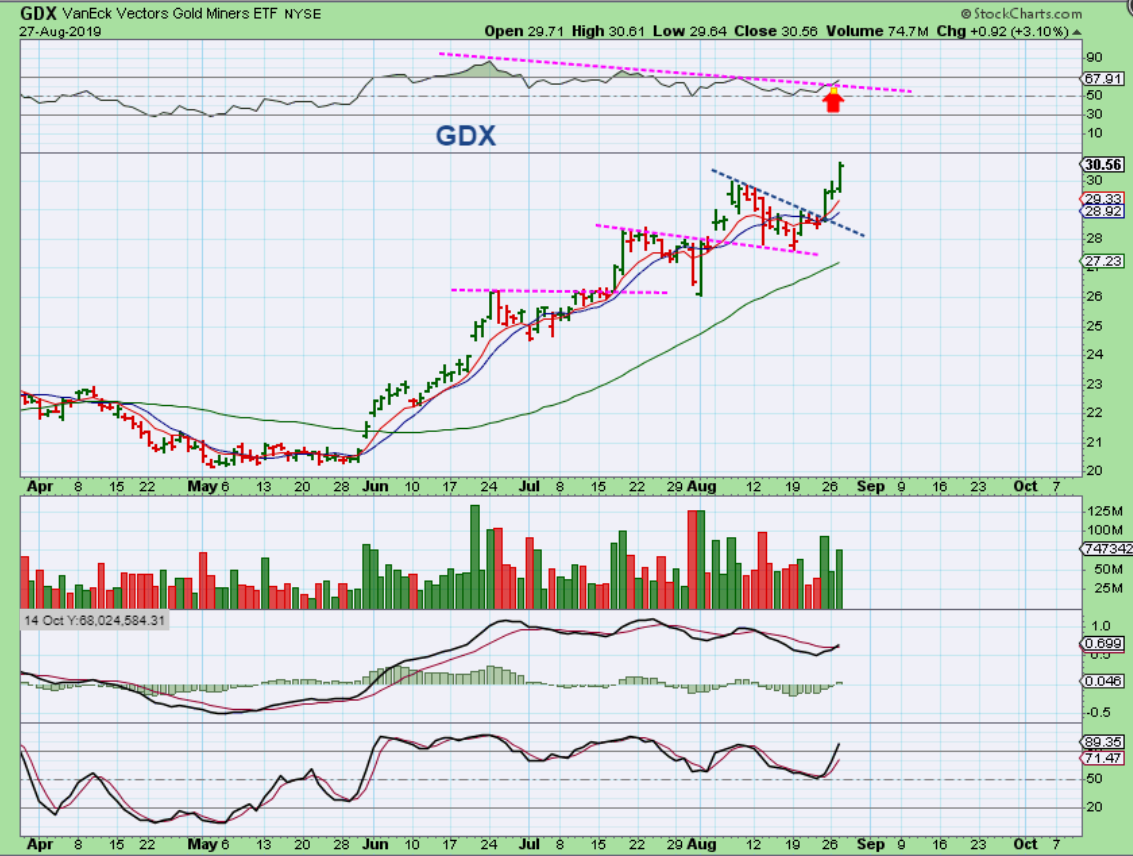
GDX – GDX Pushed higher Friday after the Jackson Hole speech with strong volume. That was a buy. It stalled on Monday, and Tuesday it gained 3% …
.
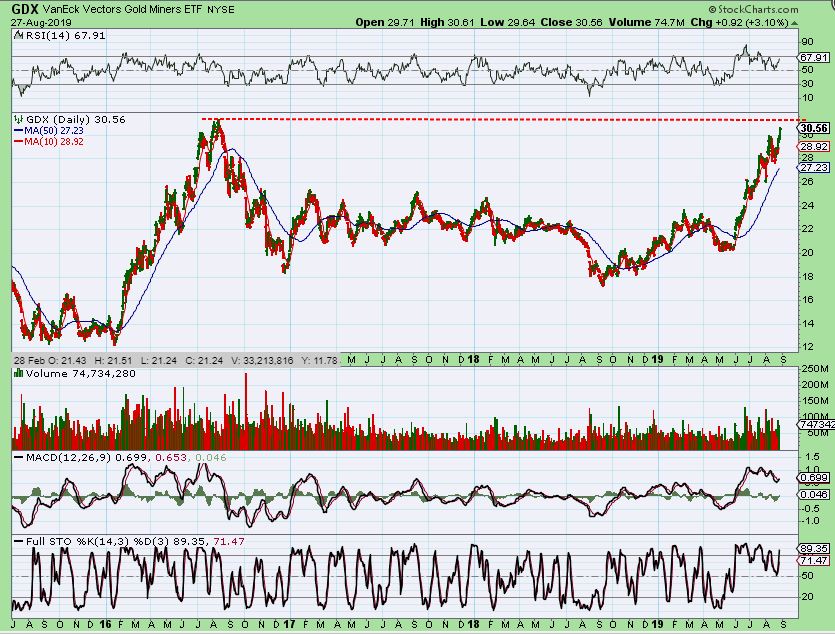
GDX moved to new 3 year highs, almost reaching the 2016 Highs. THIS is what I have expected all long once we break from that base – a run to former highs at $31.
.
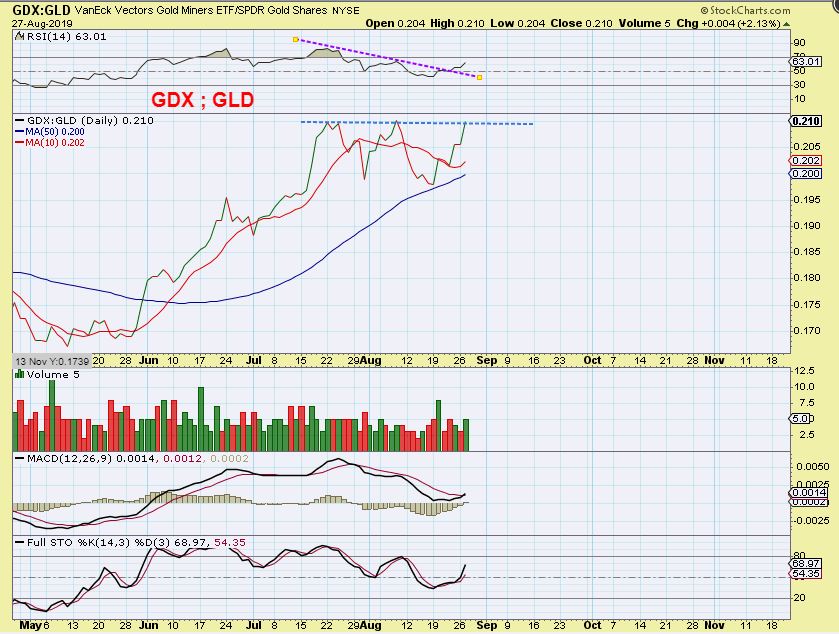
GDX / GLD RATIO: We even have Miners trying to lead Gold again, which is considered short term bullish
.
In last weekends report, this is what I wrote:
.
This was another choppy sloppy week, until Friday came along. 🙂 Especially after the Jackson Hole speech did we see the Markets completely roll over & sell off, and Precious Metals rallied Very strongly. That 1 day pop has Miners closing at the week highs, so this was a good week for Miners. This rally can continue into next week, but my report showed ( see the Gold Big Picture Review) that we are at a weekly point where prior Bull Market Rallies topped temporarily. I personally plan to Stay invested, but also Stay Frosty.
.
That is where I still find myself now, still invested yet still a bit cautious. It is tricky offering ‘Buy set ups’ in Miners this late in an intermediate Cycle, but I will keep doing so below, as long as the set ups forming are ‘lower risk’ when used with a stop…
.
Enjoy your Wednesday trading, and I will share some more helpful charts below.
.
~ALEX
.
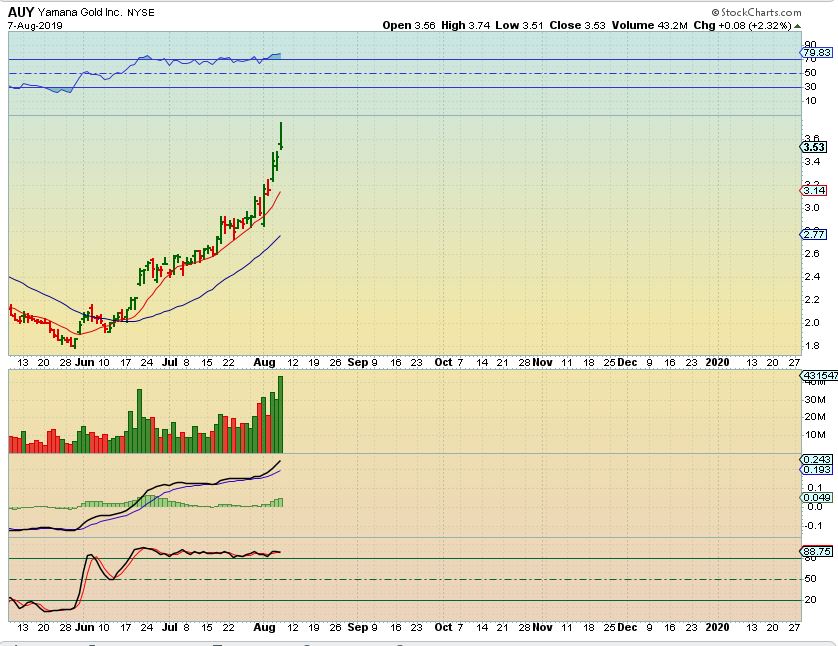
In a few of the reports over the past 2 weeks, I have discussed the stronger Miners and their ability to avoid a deeper correction so far. Using Charts for RGLD, AU, NG, DRD, HMY, EGO, etc. etc. , I showed that as they were breaking to new highs, they hardly pulled back when GDX dropped for 8 days. I felt thatas they break to new highs, these would be a good buy. I discussed how I felt that others could follow that pattern too, and were worth buying ( Using AUY as an example). Let’s review that idea again…
.
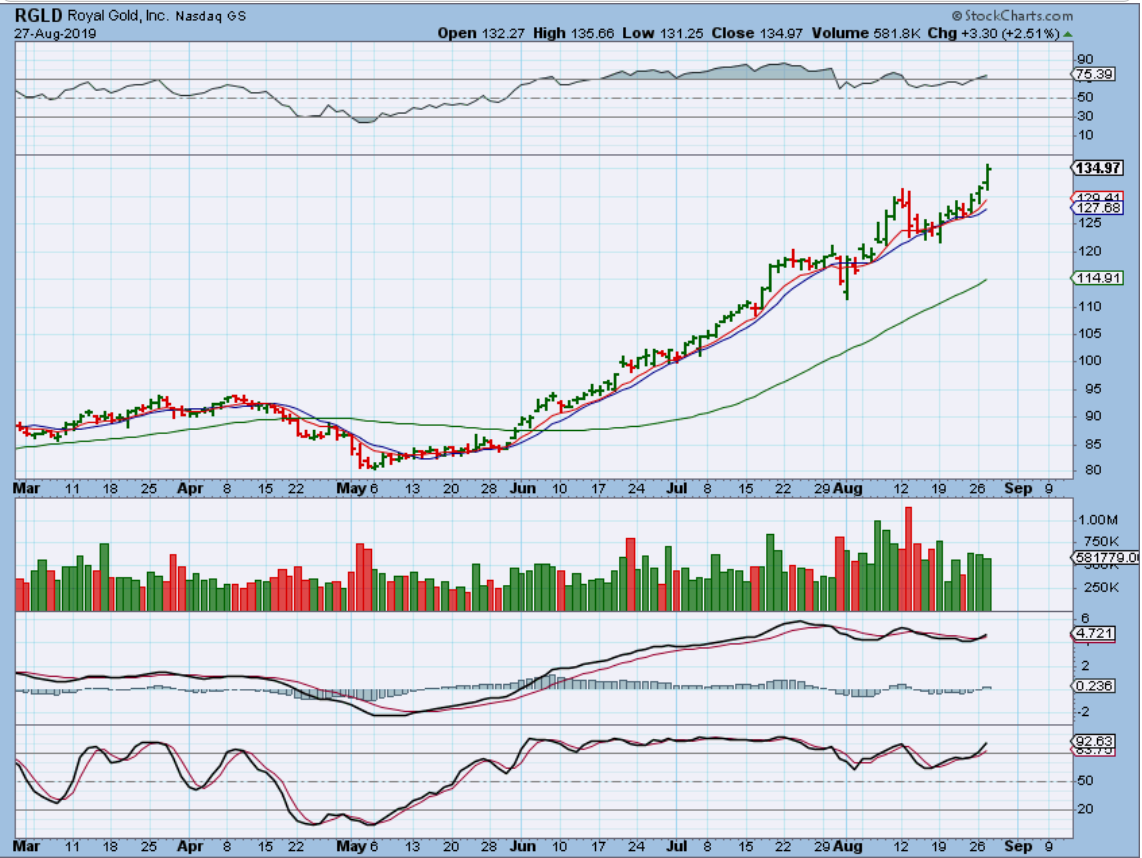
RGLD – So these are continuing higher. What 8 day pull back?
.
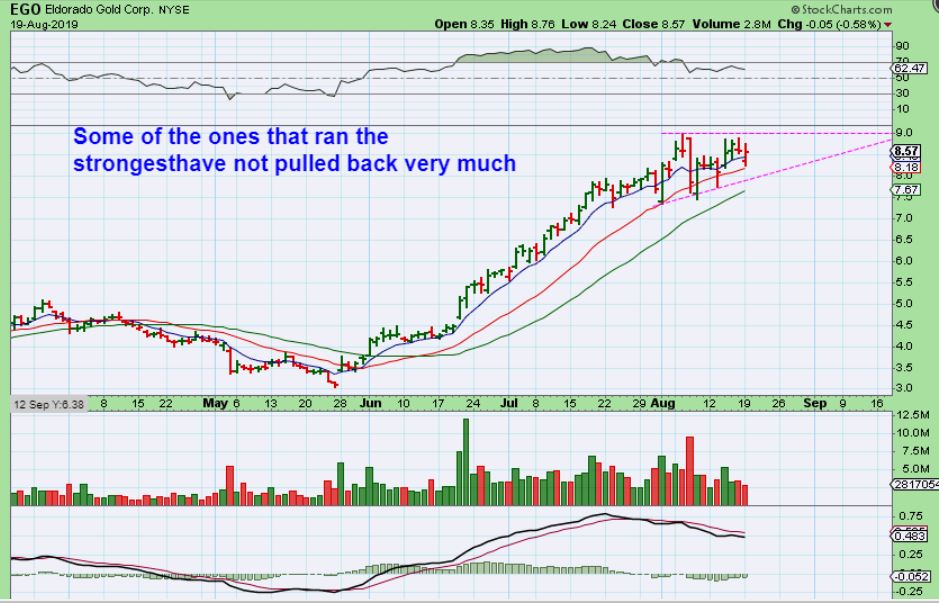
EGO August 19– I liked this because EGO was staying near the highs as GDX pulled back for 8 days. This was a buy…
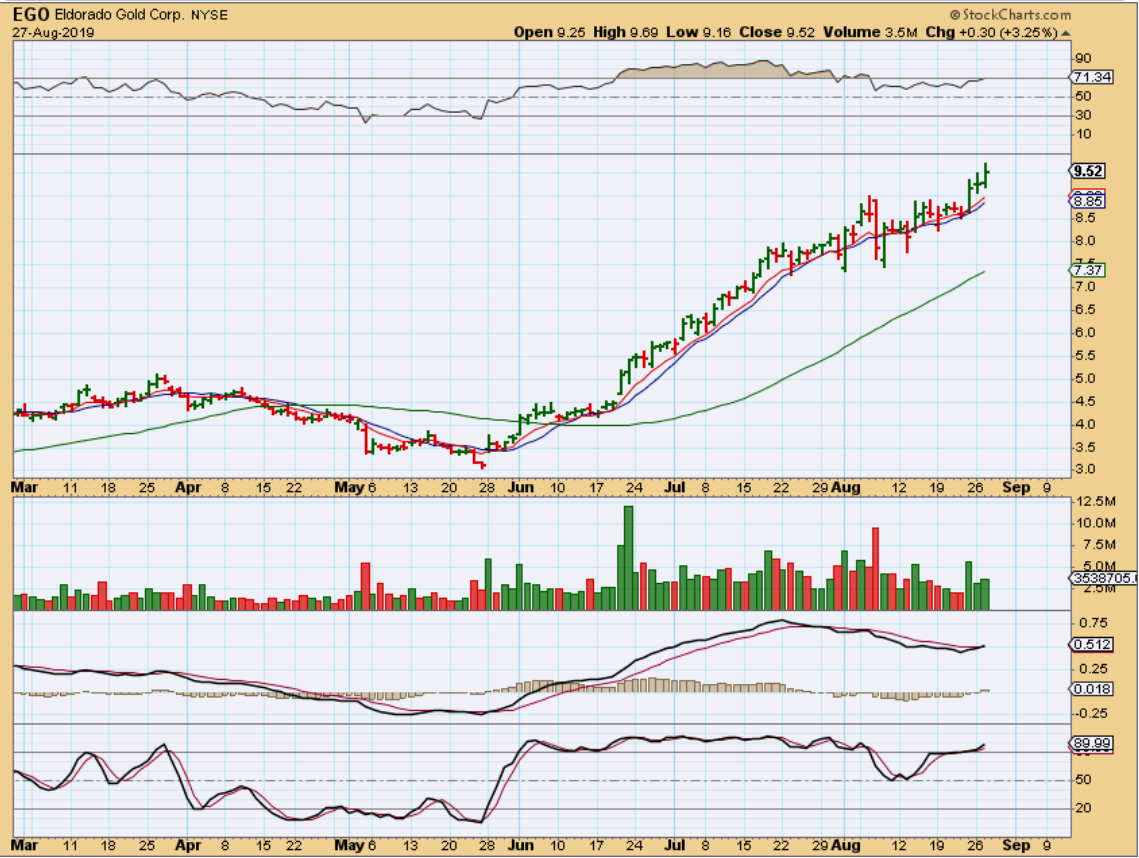
EGO – And you can see that it broke out & is still running.
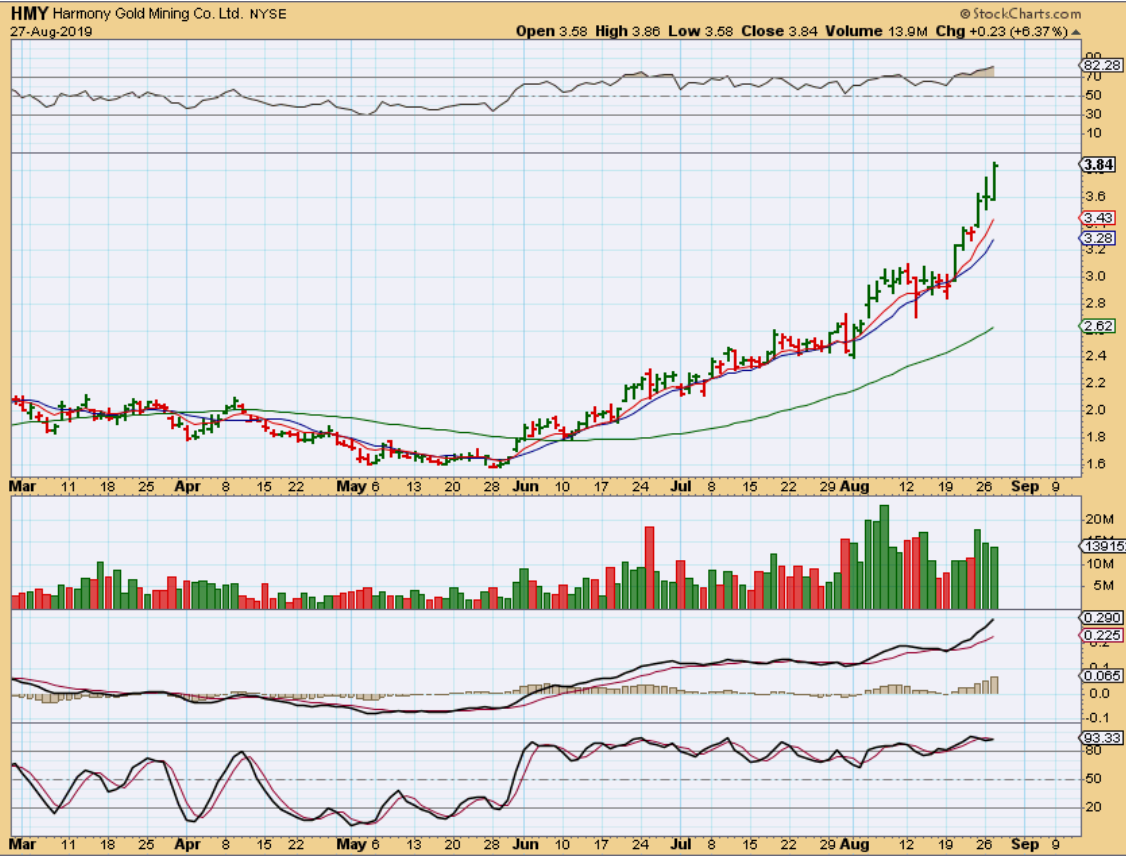
HMY – A week ago I called HMY a buy here because it was also hardly pulled back with GDX & GDXJ, and I added…
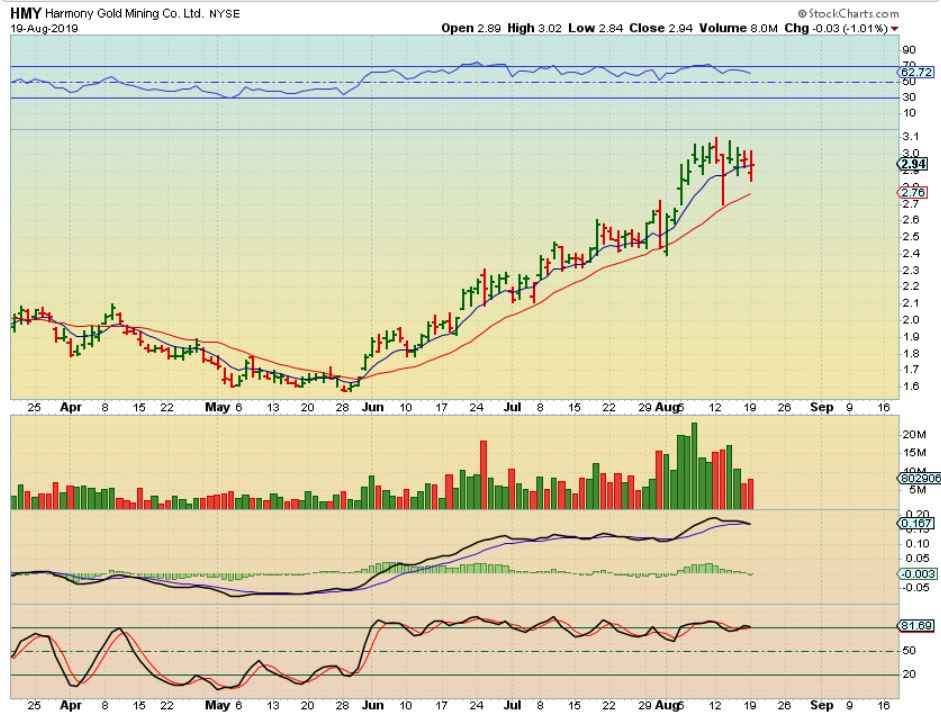
HMY – HMY is certainly extending into new highs recently. So the idea was to look for stronger performers and buy them…
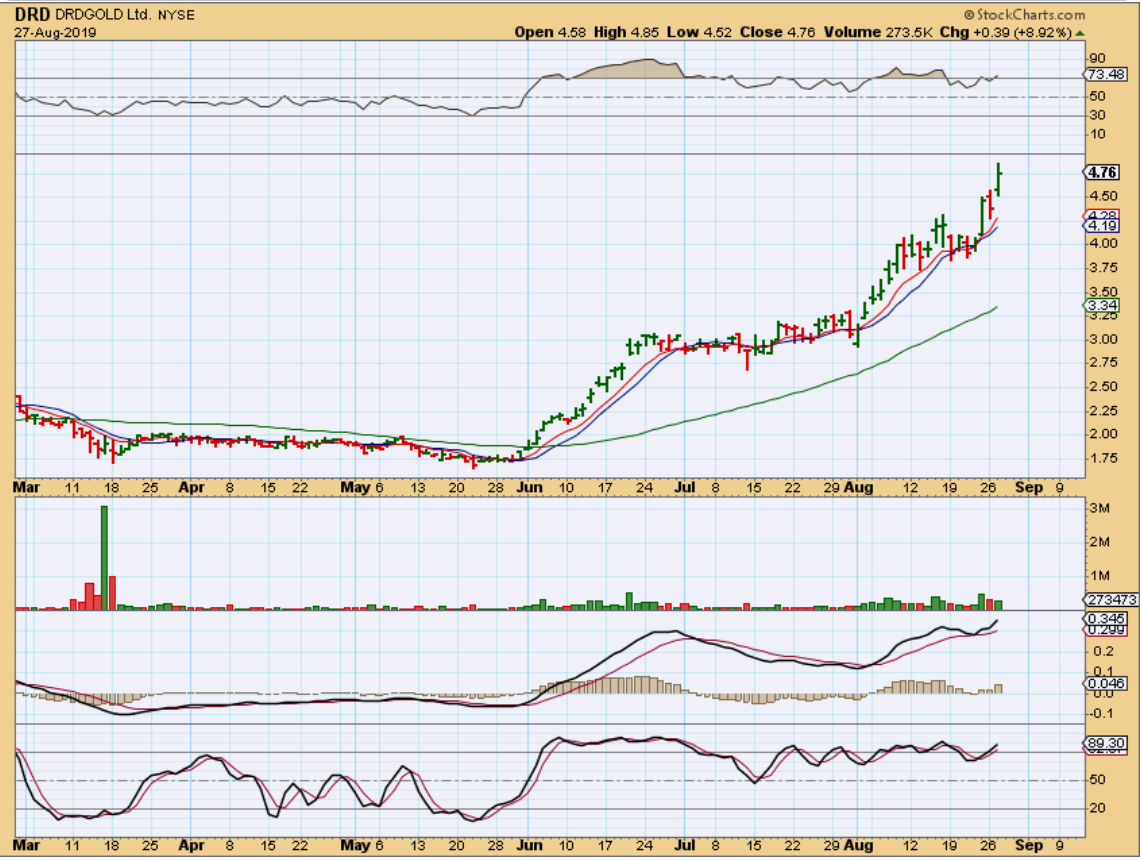
DRD August 23 – DRD was a buy on the 10sma, and again as it turned higher. I discussed its resemblance to HMY breaking to new highs too.
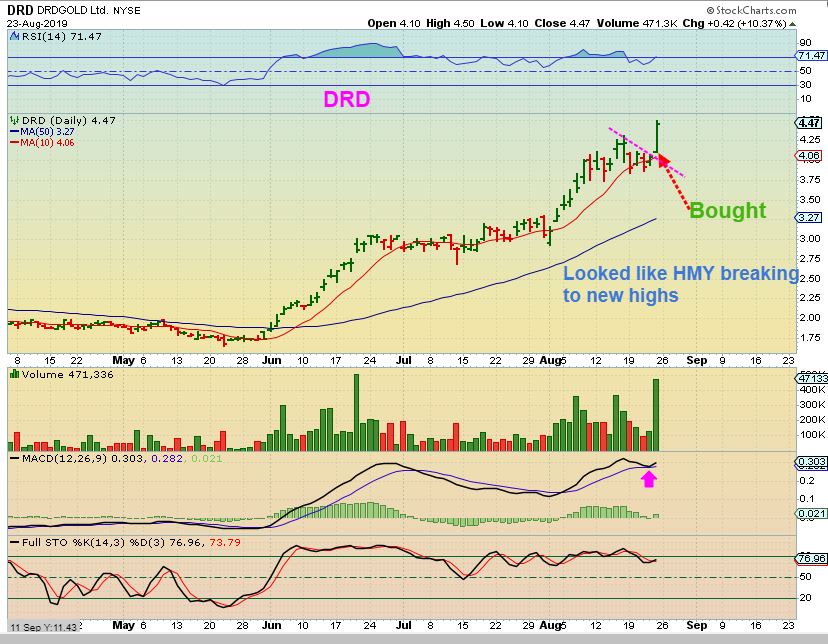
DRD – DRD dropped Monday and continued higher Tuesday, up about 9% again. This is now extending into new highs again.
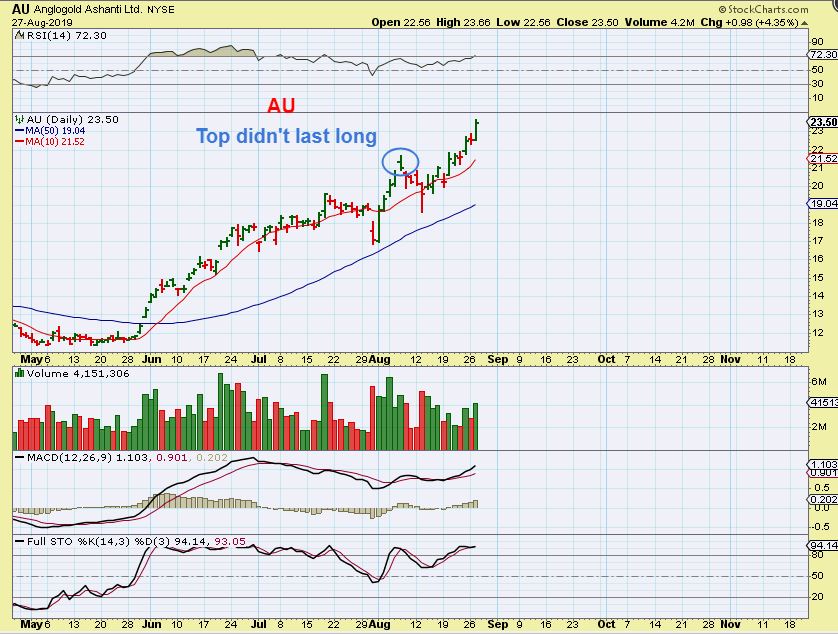
AU – AU was one of those that also ran straight up and here on Aug 7th, it put in a topping candle. It would be good for us to know if that was the end of the run?
AU – That was a topping candle, but the drop was brief ( 4 days) and here we are running to new highs again. These were the ones that I liked at that time. I still own them, but for new entries I would now tend to focus on something else…
Now I tend to focus on something else- the ones that look bullishly set up and could play catch up.
.
Remember this EGO set up ? EGO was pretty boring during that sideways churn…
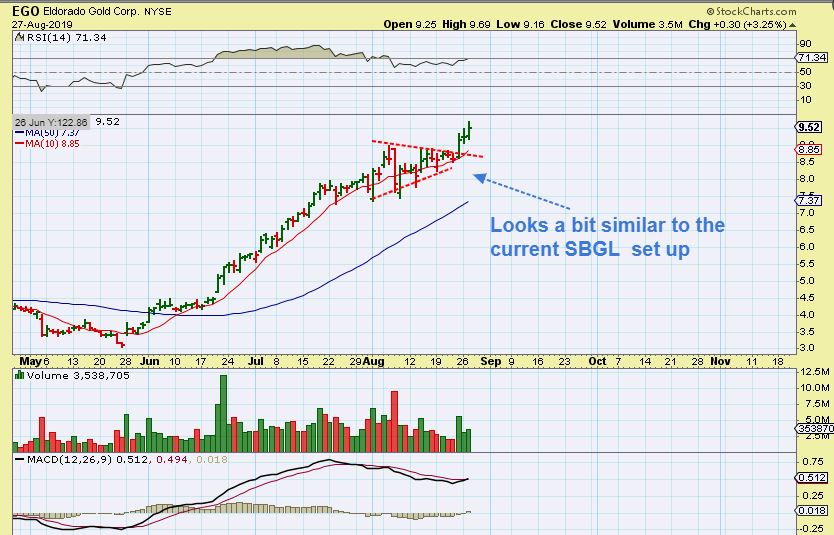
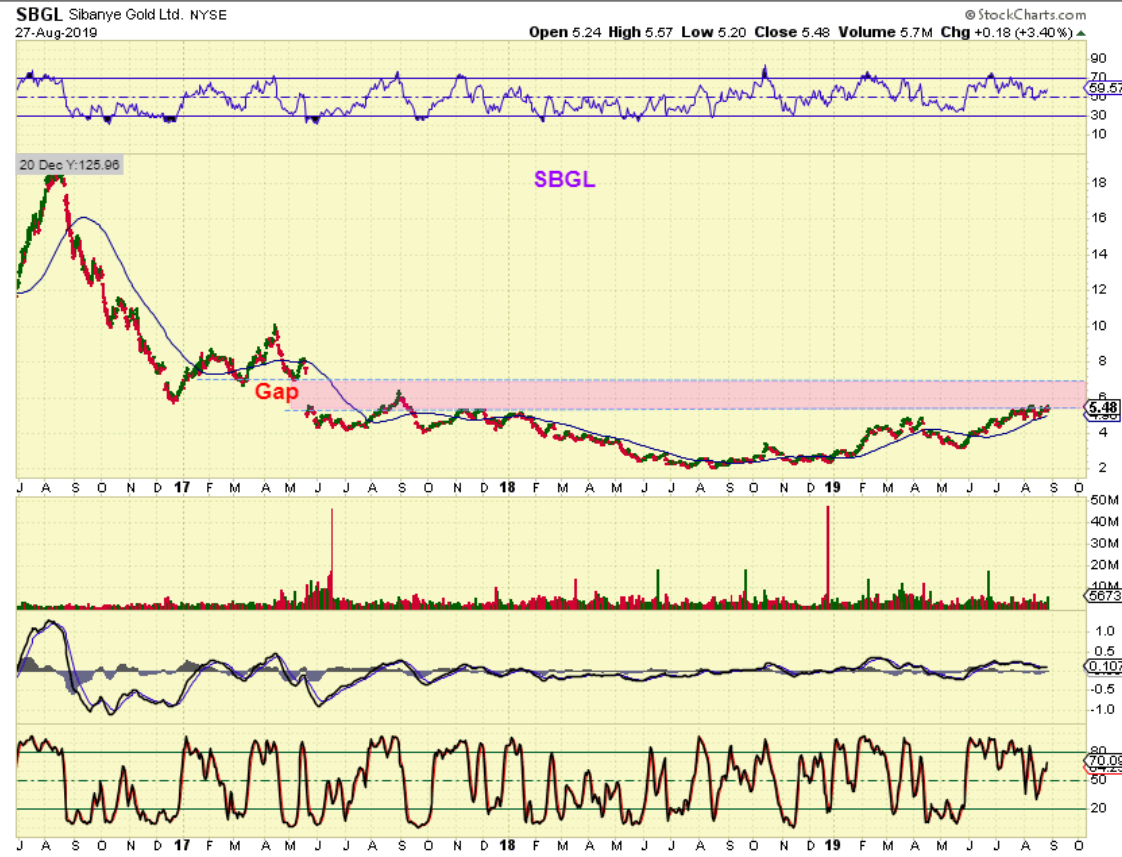
SBGL – This was a SBGL chart that I posted in the live area around Tuesday at 2:00 pm as a buy. It looks very similar to EGO before it broke out.
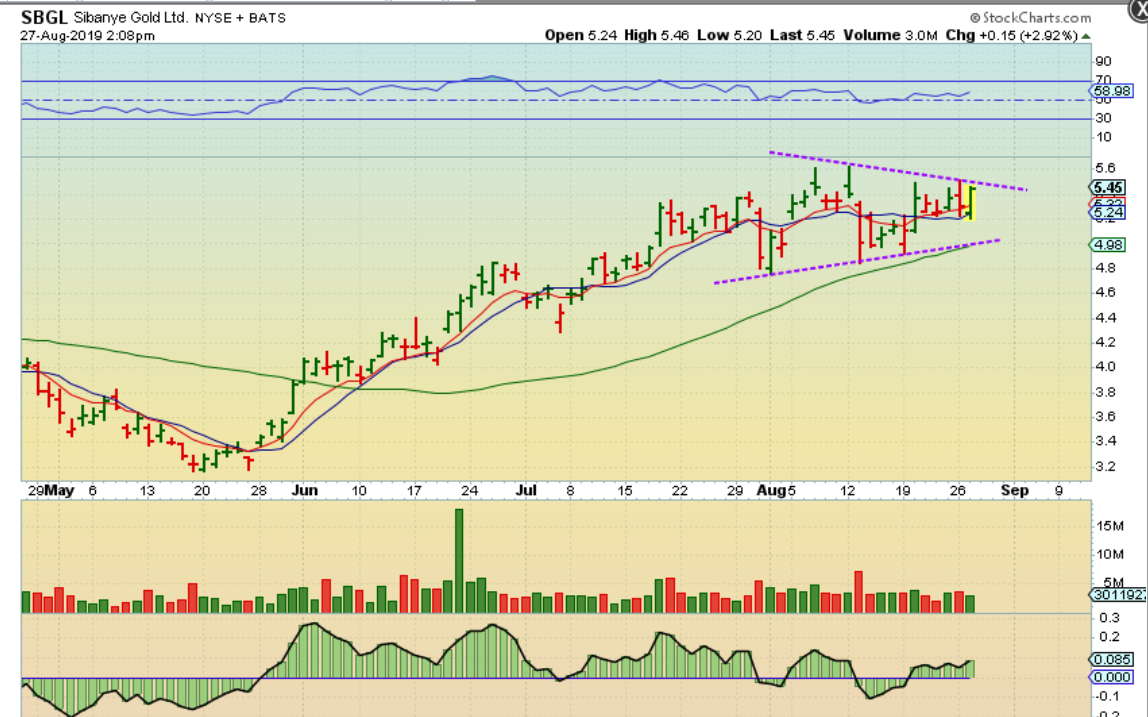
SBGL – SBGL is eating its way through resistance, but I have pointed this out before- it has a gap overhead with no resistance .
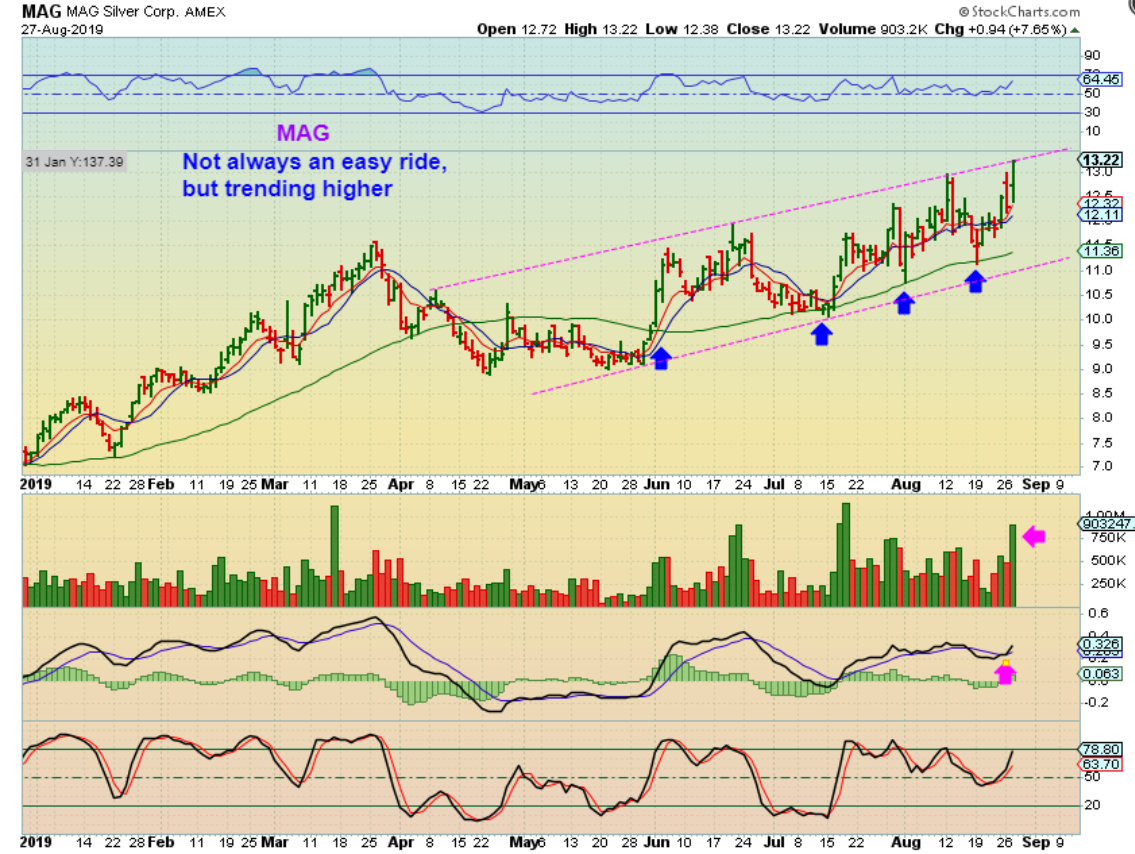
MAG – MAG is chopping higher. This has been a bit choppy and difficult, and a bit less explosive than I expected it to be, but it does keep popping to new highs.
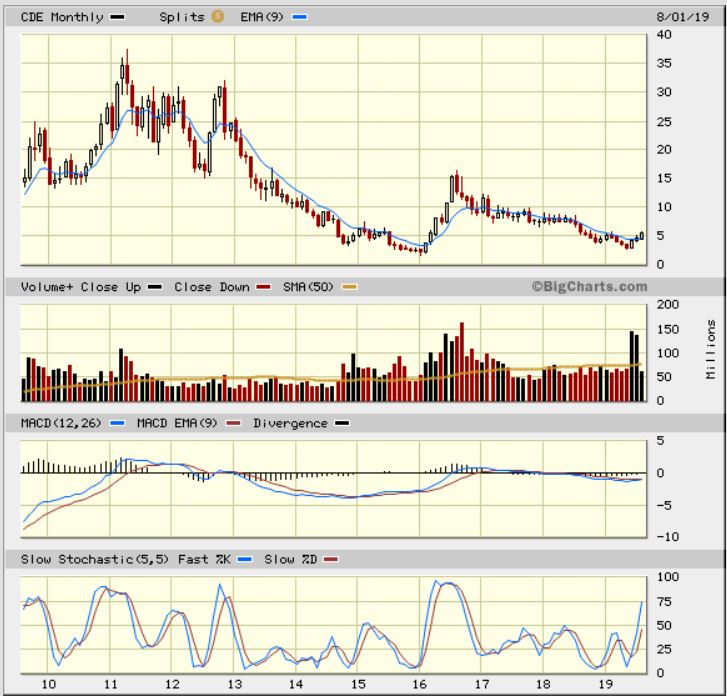
CDE #1 – CDE could play catch up, and I posted this to the live trading area Tuesday midday…
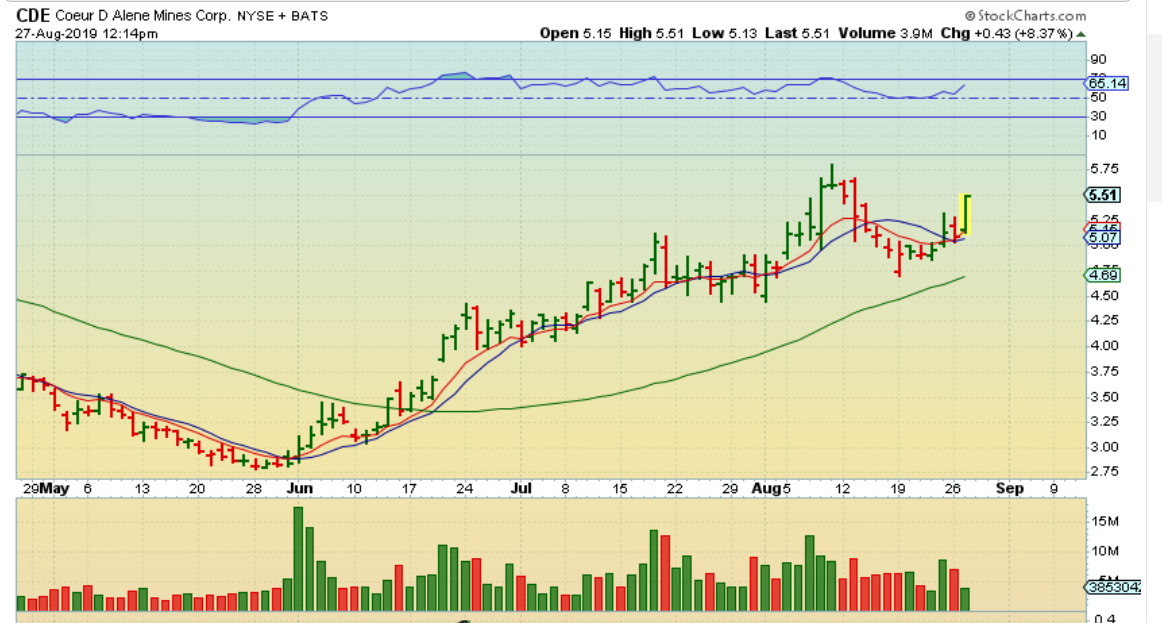
CDE #2 – I still own CDE and if this gets to new highs, it too could run strongly too, as long as this sector stays bullish.
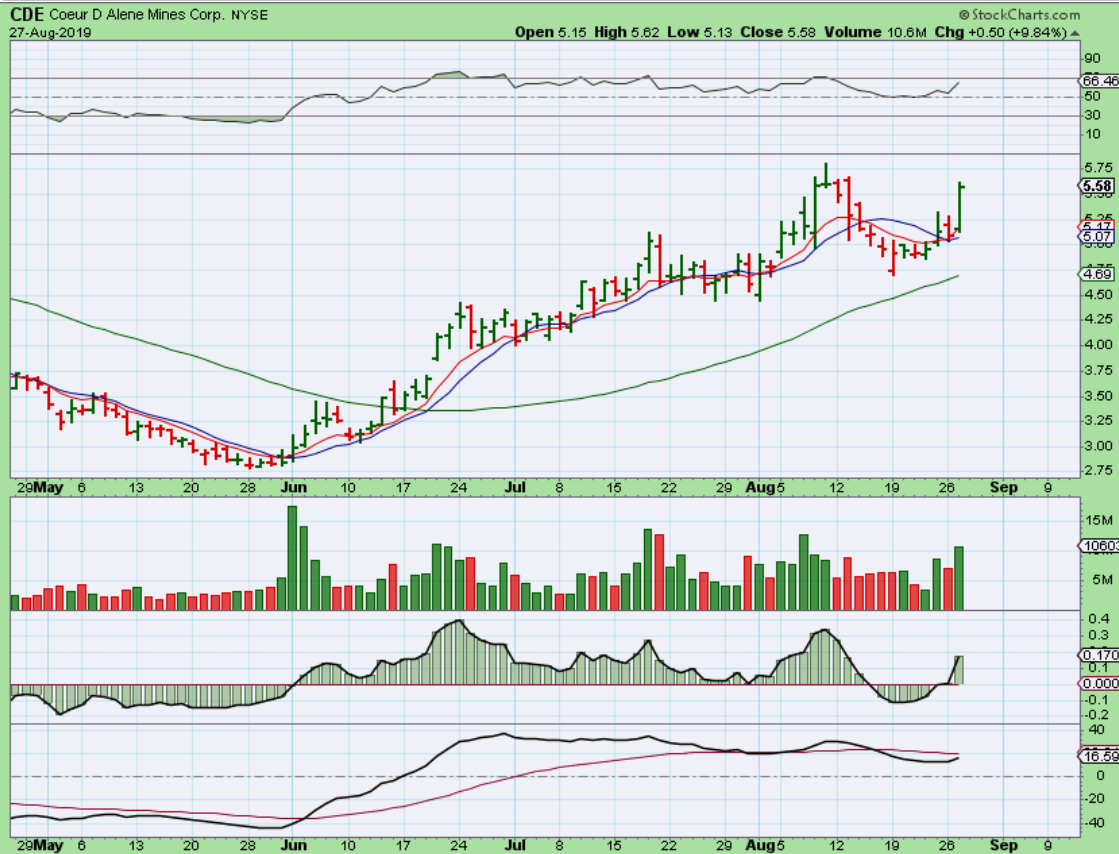
CDE – This chart from last week also sows the bigger picture potential for CDE.
.
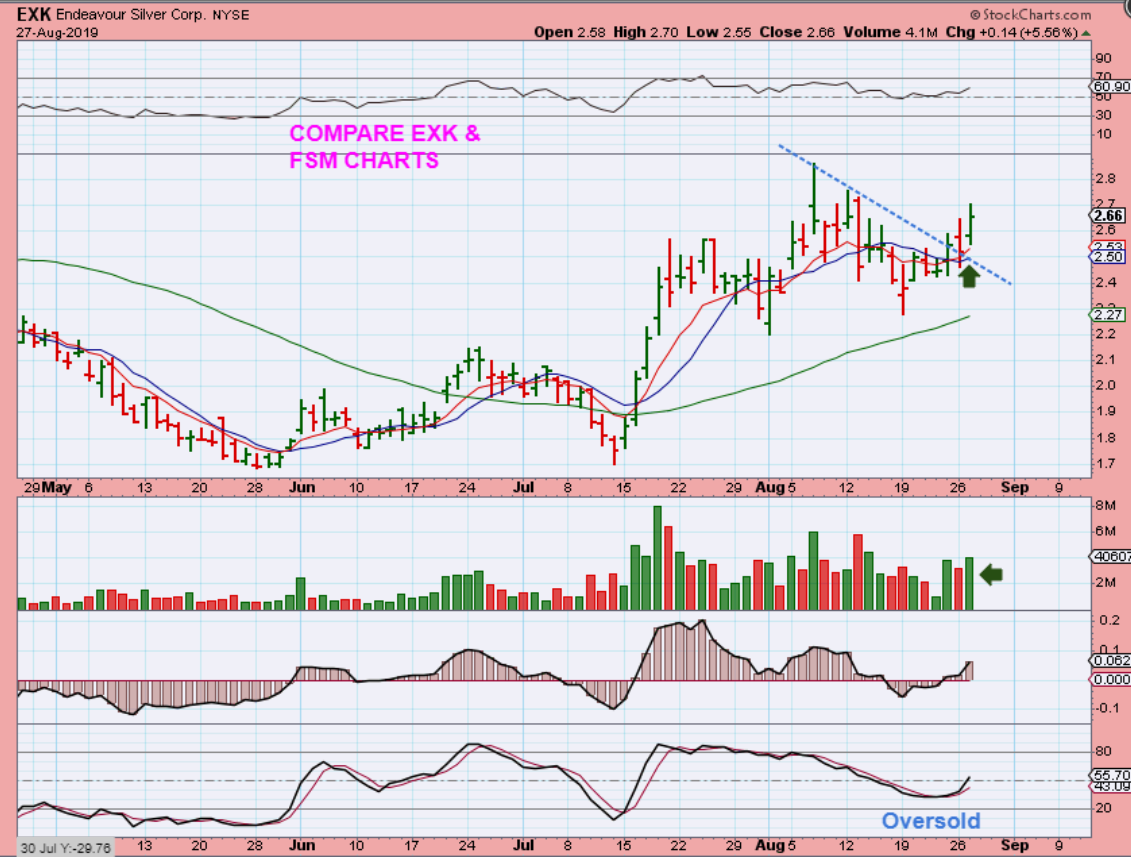
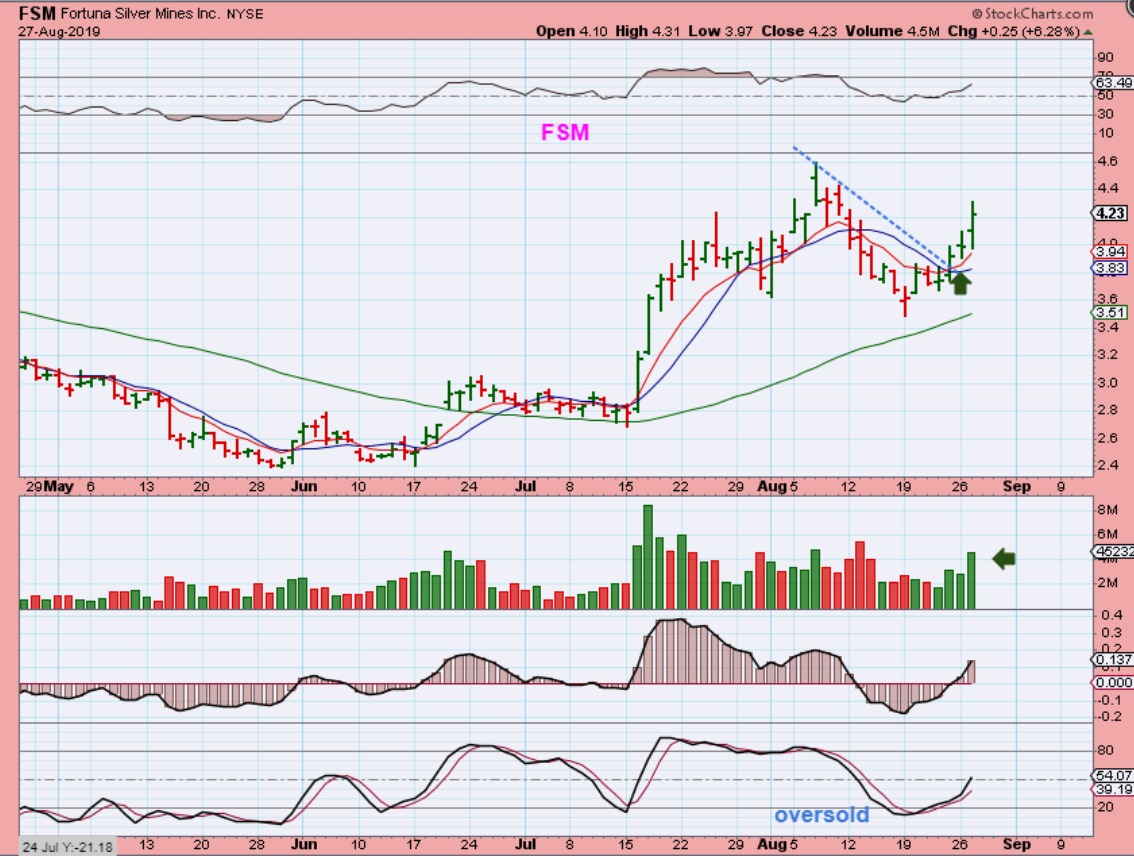
DID ANYONE ELSE NOTICE THIS? EXK & FSM CHARTS LOOK LIKE TWINS 🙂
.
EXK – Scroll down to the FSM chart below this one, and then scroll back up. These both look almost identical and ready to play catch up if Silver keeps running. This can be bought here as long as Silver remains bullish.
FSM – Very nice Volume came in on Tuesday. I called FSM a buy over a week ago at that reversal. It is still worth buying if Silver is going to push higher.
.
Now charts of Miners that could still play catch up
.
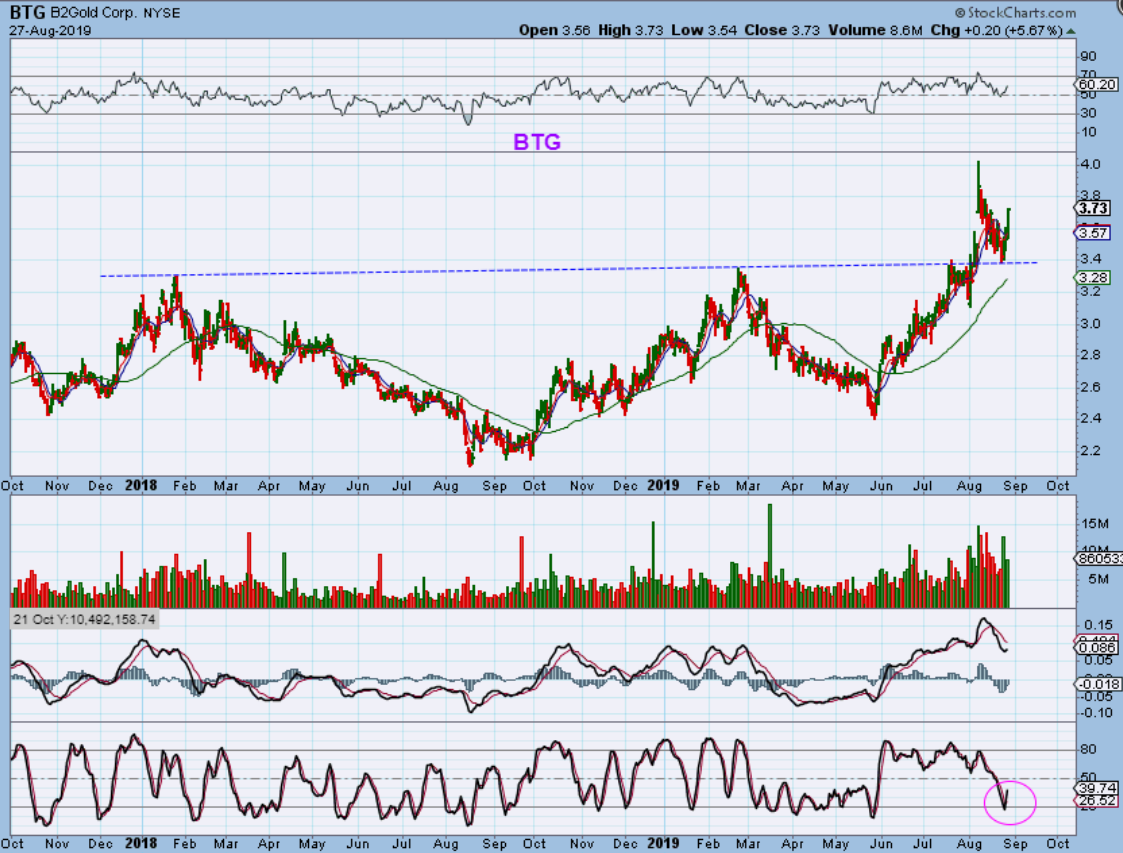
BTG – BTG is no longer extended. It did a back test and reversed higher.
.
These are obviously laggers, but are starting to improve…
.
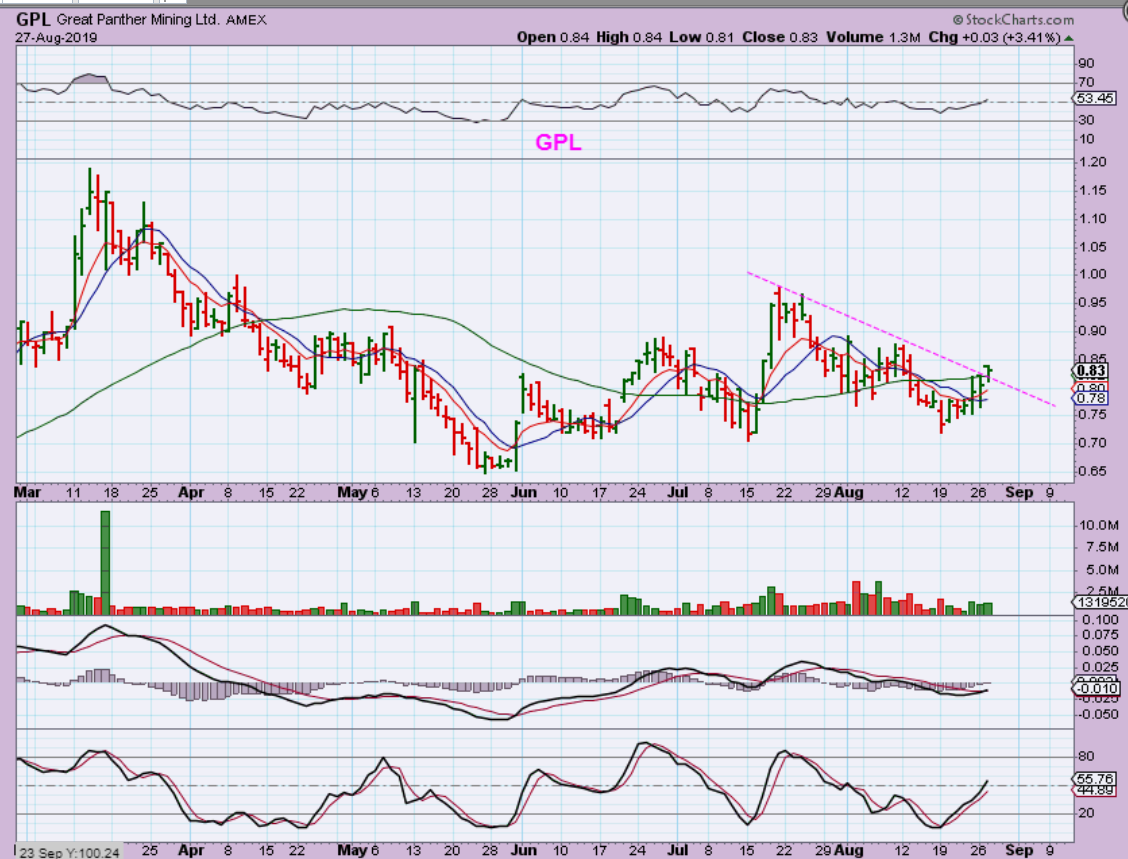
GPL – GPL still looks like a base, and it was struggling under the 50sma last week. Tuesday GPL did finally manage to close above it by the end of the day, so it is possible that this will now try to play catch up and run higher. It can be bought with a stop, but it is lagging.
.
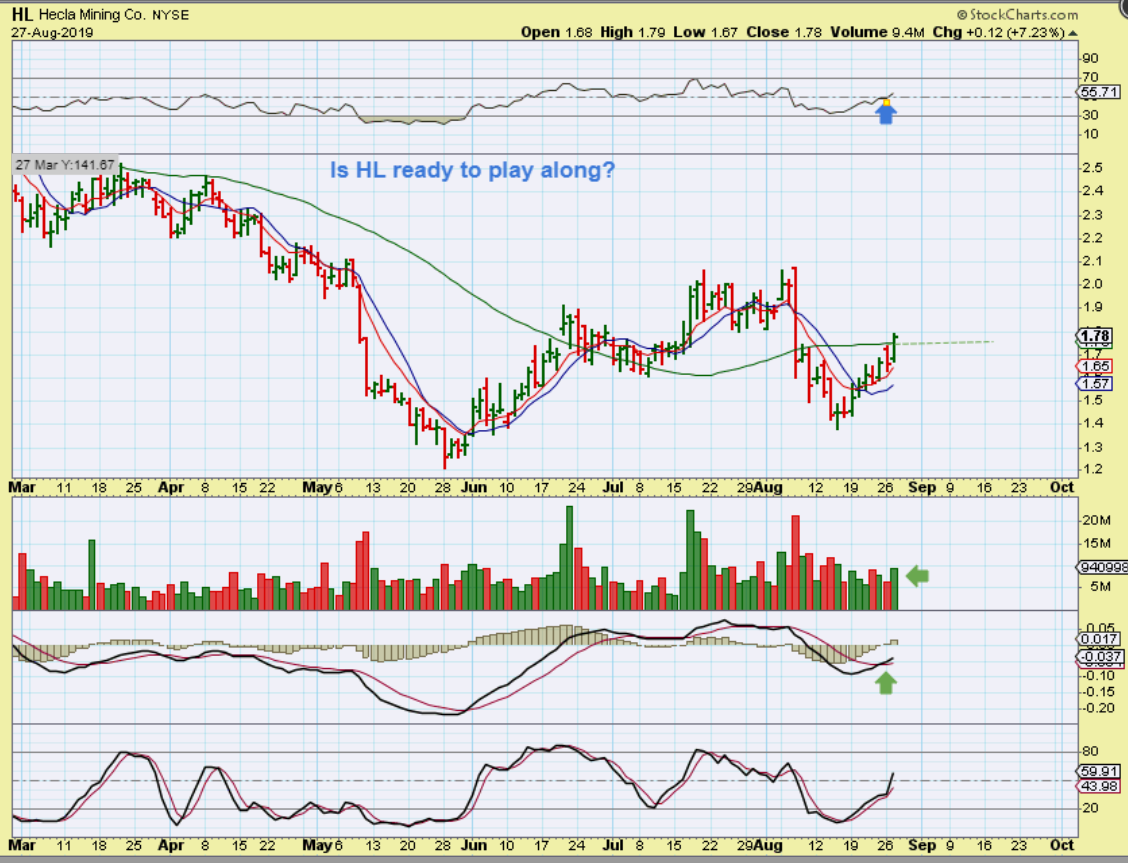
HL – HL is the same story, just now breaking above that 50sma again. These are obviously lagging, but they may be finding some Buyers now.
.
THM – THM dropped to the 50sma Tuesday and bounced. Volume came in strong, so THM MIGHT be ready to join the push higher.
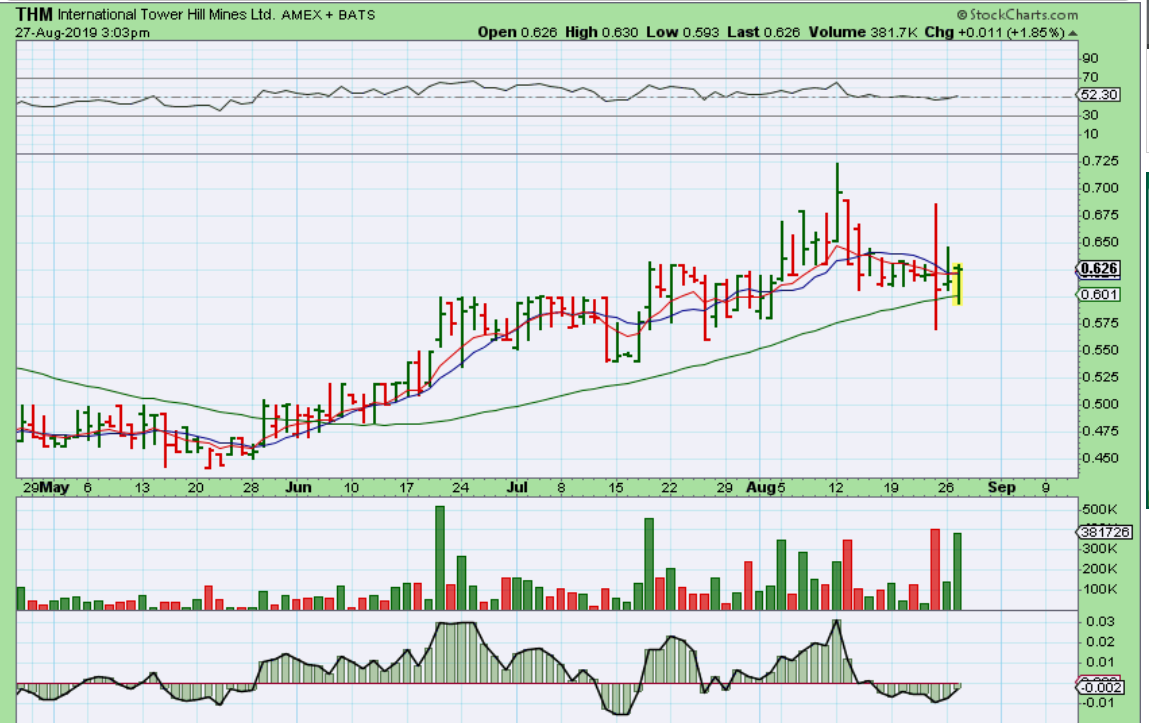
Note: If you are still just holding Miners that you have had for a while and riding them higher, that is fine. If you are interested in trading any of these set ups, hoping that they play catch up? That is fine too, but I still have been admonishing traders to USE STOPS and understand that in time we will be due for a normal dip into a DCL, eventually an ICL. I am seeing what looks to be a wedge forming now too, so as mentioned in that weekend report, time may be limited to this week or early next week.

