August 22 – Jackson Hole
The last couple of weeks have been choppy in many sectors, and so far that continues. Let’s take a look…
.
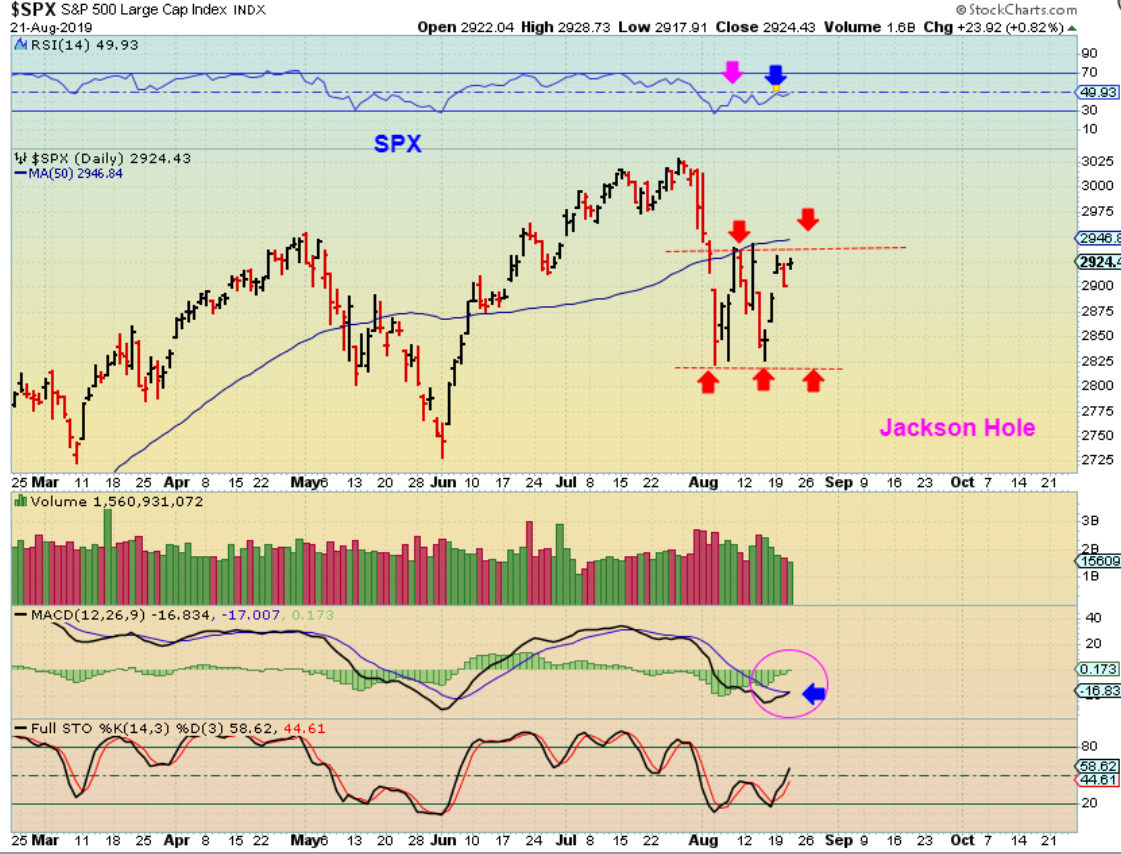
SPX – No change here , we are in a trading range, and the peak has been the 50sma. The Fed’s annual Mtg at Jackson Hole is likely to shed light on the next steps policymakers will use to support economic growth. That discussion can affect the direction of these markets.
.
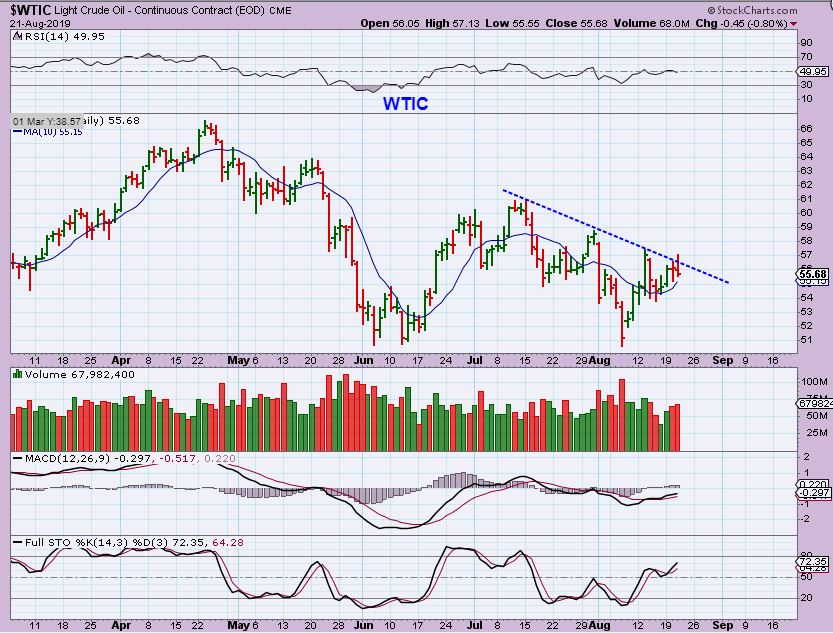
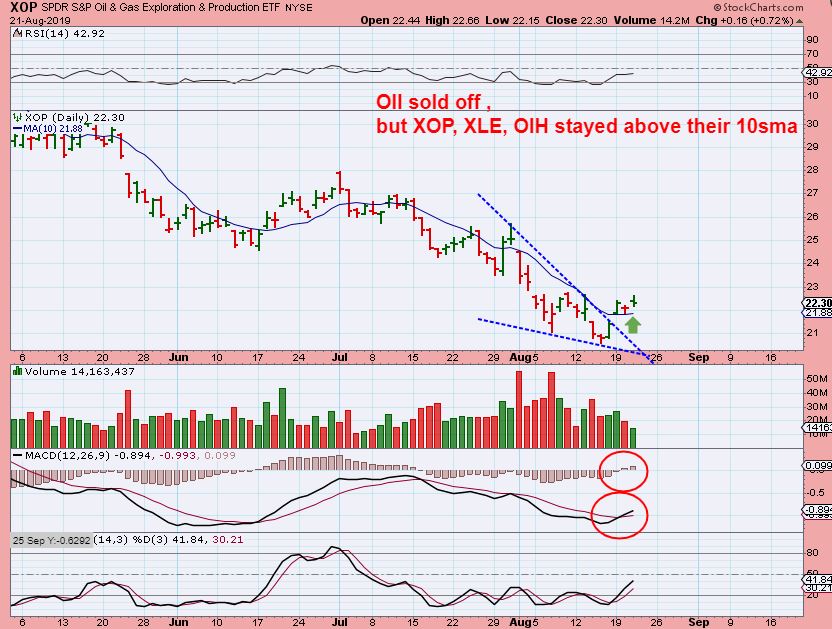
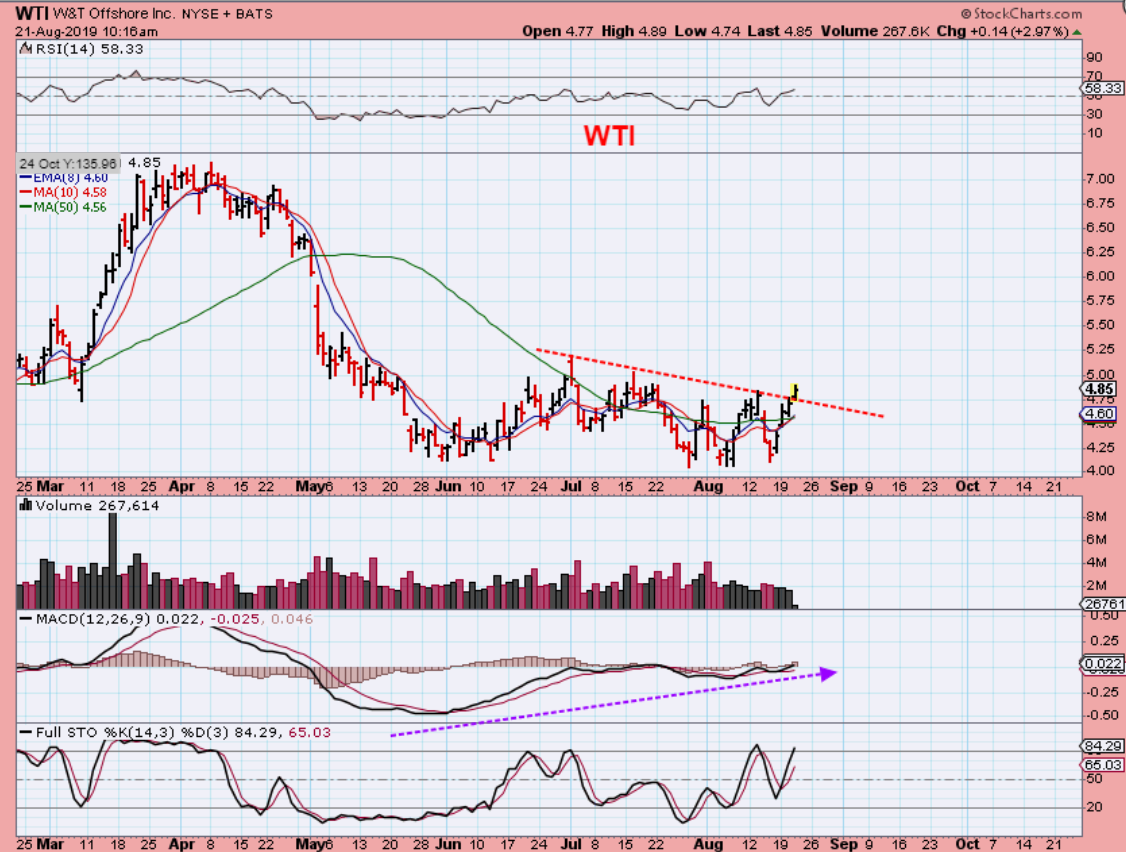
WTIC – The Oil inventory came out and Oil didn’t overreact to the downside, but it did not break out higher either. With this slight drop in Oil, the XLE, XOP, and OIH did not really drop…
.
XOP -The XOP is still above the 10sma, so I added a bit more to my GUSH trade, but that 10sma has to be where my stop is ( maybe loosely under the 10).
.
WTI – I posted this chart before the Oil inventory meeting. It dropped just a bit with Oil later, closing at $4.70. So I am still just watching these stocks along with Oil.
.
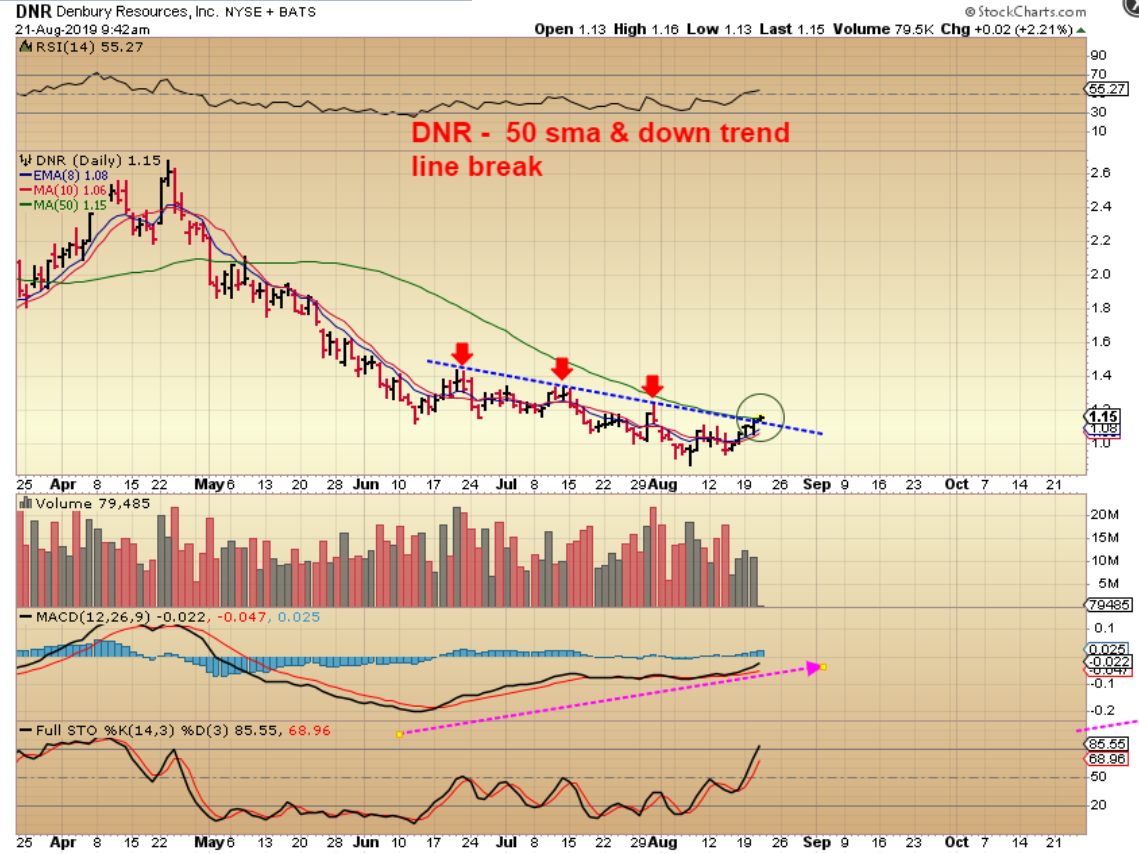
DNR -I also liked that DNR was breaking out, and since it closed a penny higher than where it was here, it seems to be breaking out. It broke out, ran higher, and dipped back to $1.16- so I am watching our energy stocks like WTI, DNR, LPI, OAS, AXAS, AREX, etc etc . They are very oversold. In fact…
.
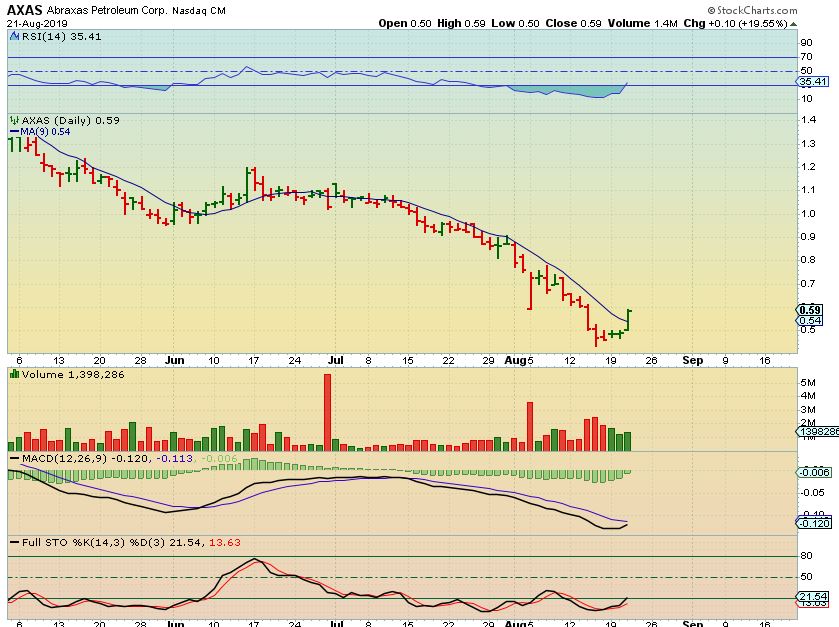
AXAS & AREX closed green, and AXAS was up almost 20%, AREX was up 8%. The Oil Energy Sector does seem to want to move higher- it may be just waiting on Oil.
.
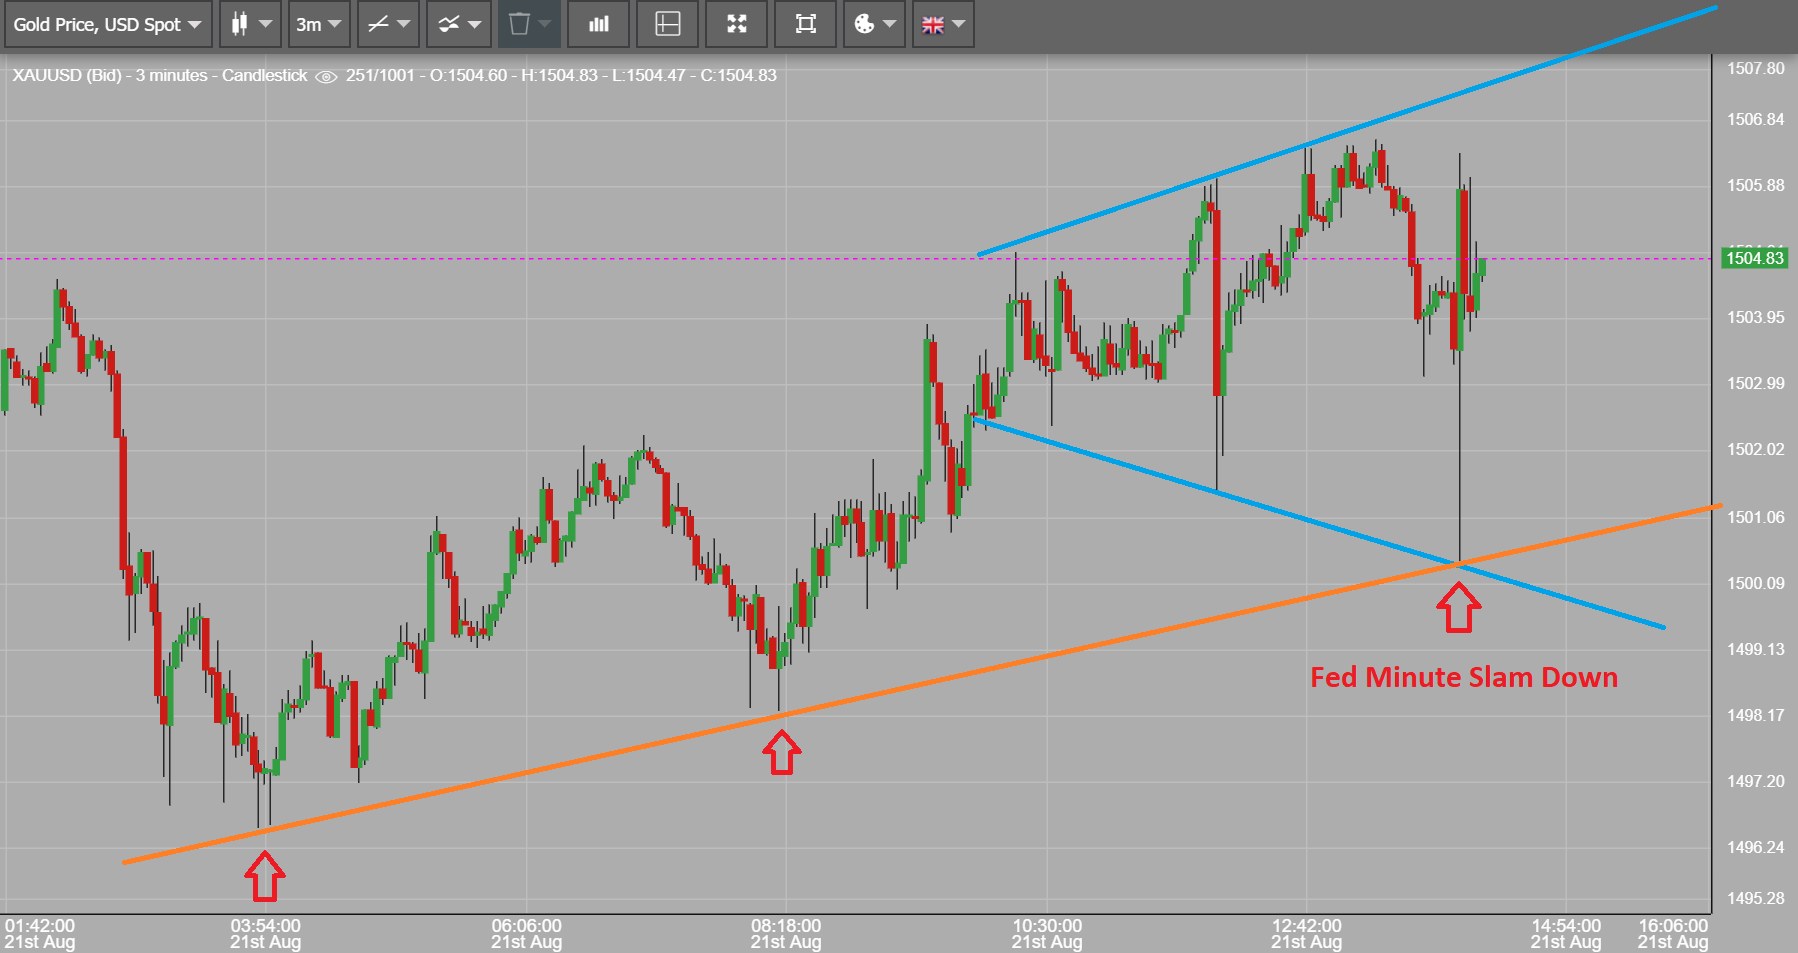
GOLDs intraday chart – I was watching Precious metals when the FED Minutes were released. Isn’t it Amazing how Gold sold off with that Fed Minutes release, but landed exactly at the intersection of 2 different trend lines. An uptrend held price, and a Bull Horn held price. What about the daily chart?
.
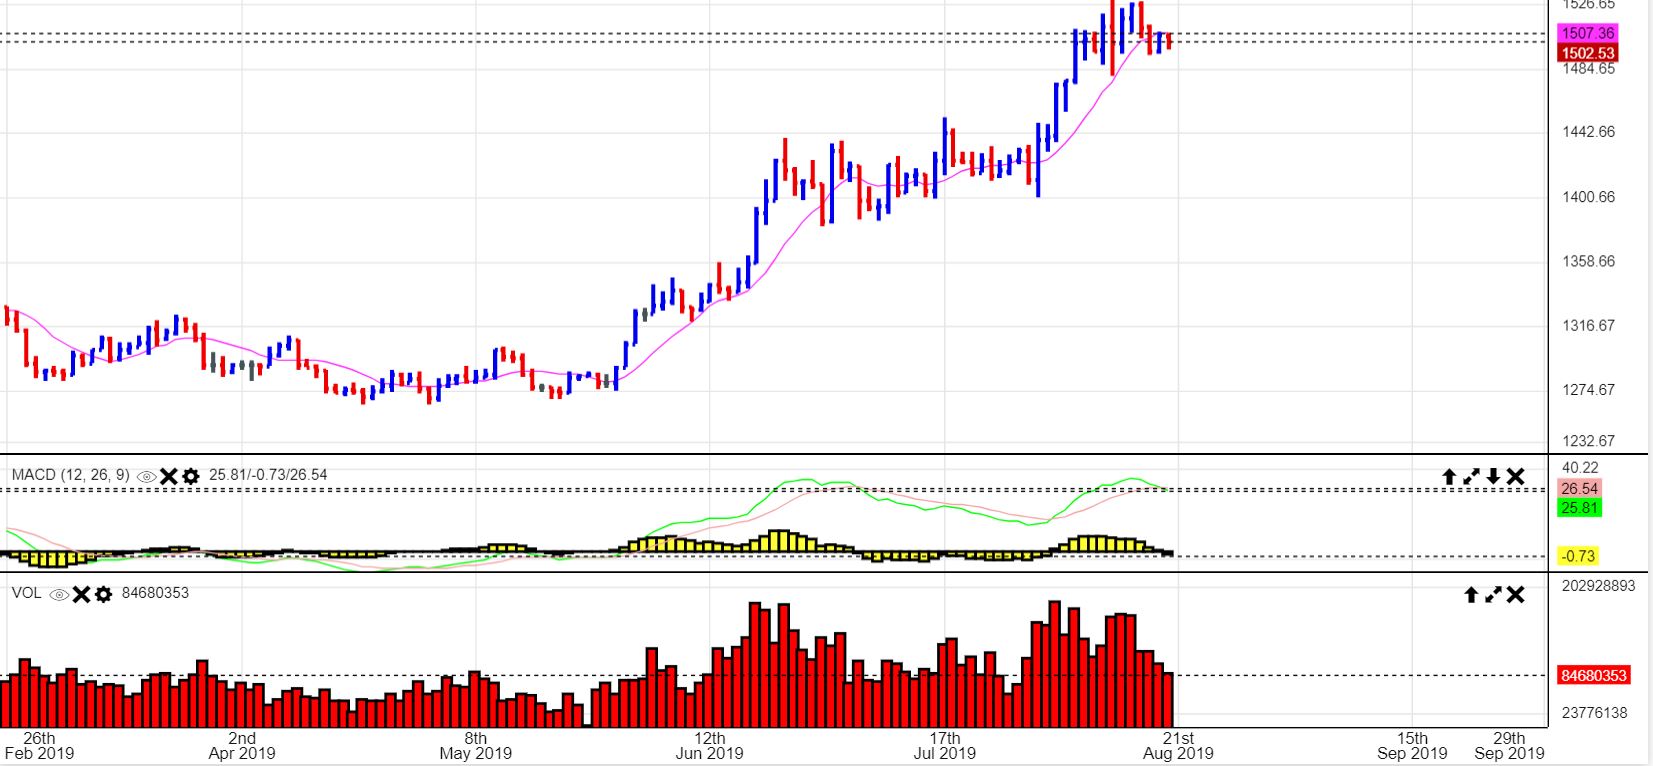
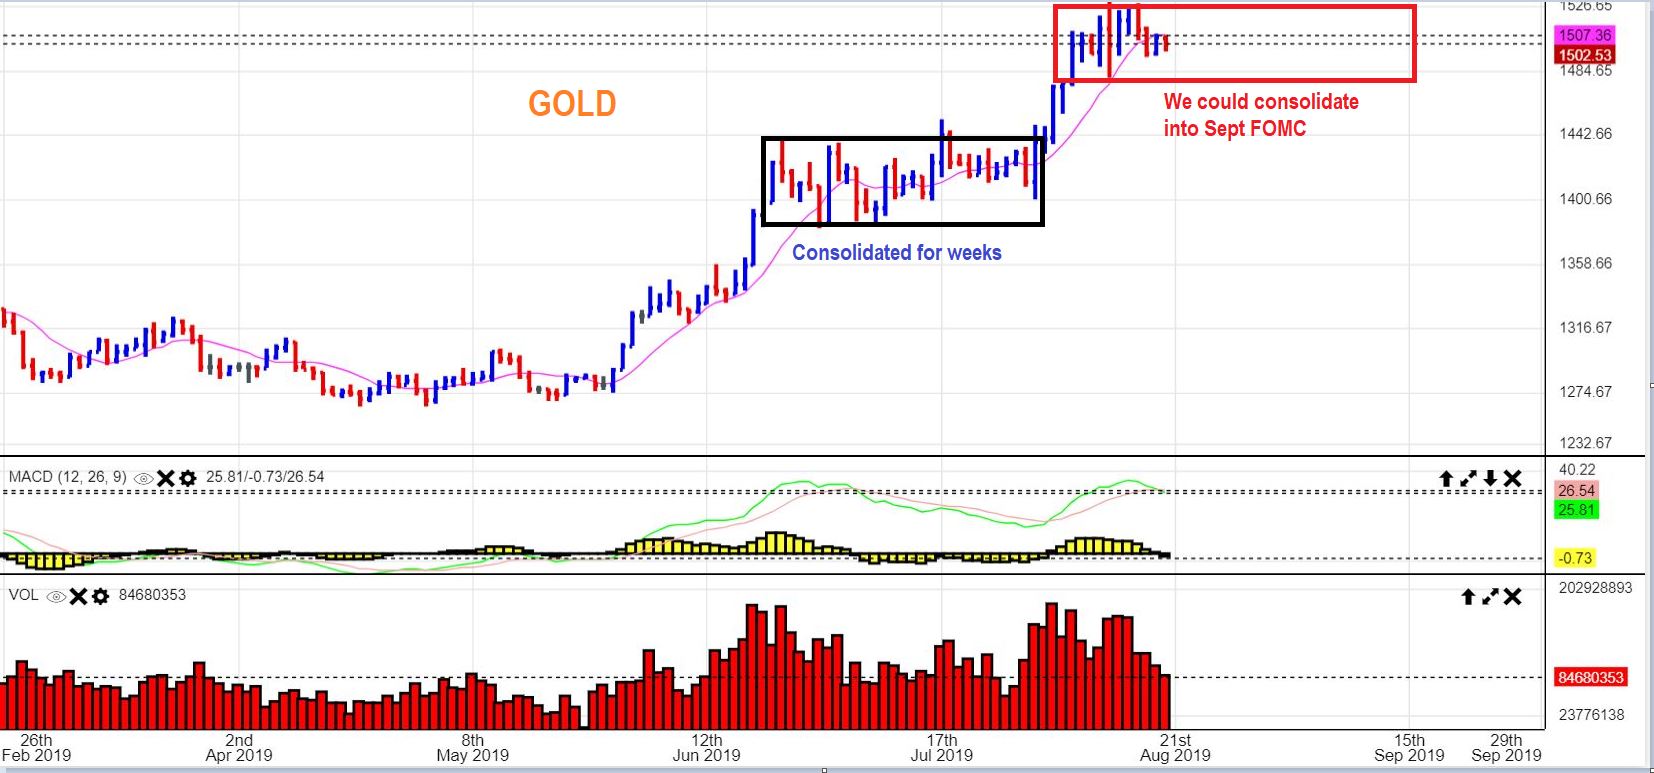
GOLD DAILY – So far it just looks like the sideways consolidation continues.
.
GOLD – And that consolidation can break out Higher / Drop Lower / or just keep chopping as time rolls on. Gold is choppy and is currently trading UNDER the 10sma.
.
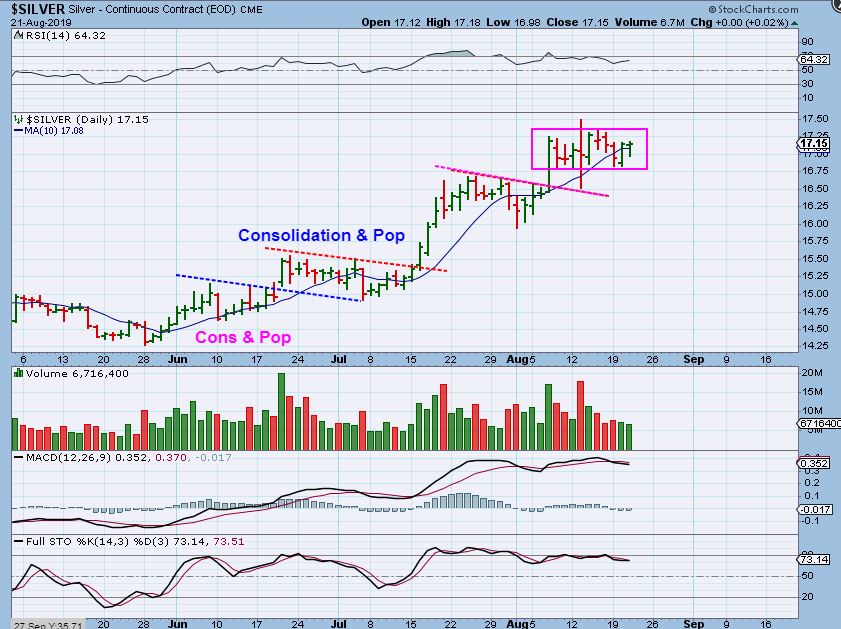
SILVER – Silver often consolidates and then Pops, and right now it is consolidating too.
.
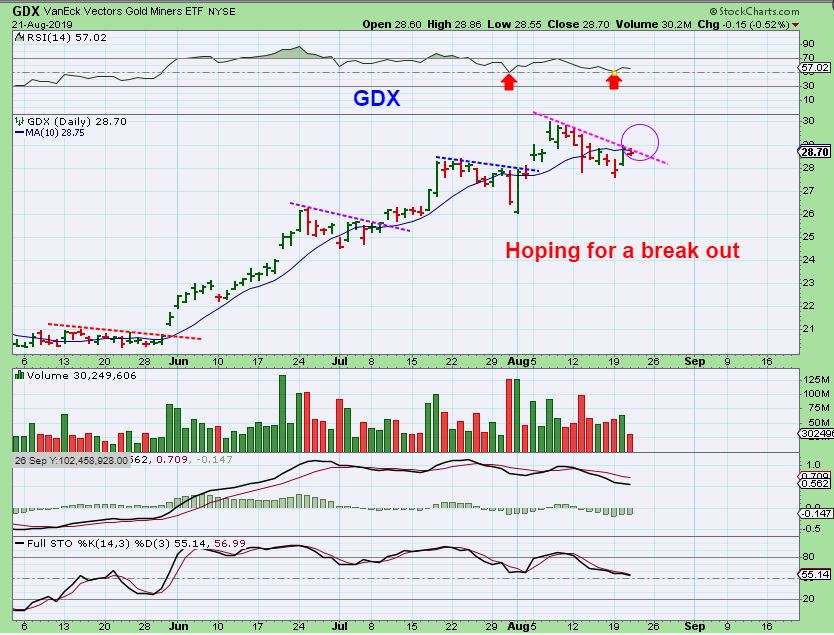
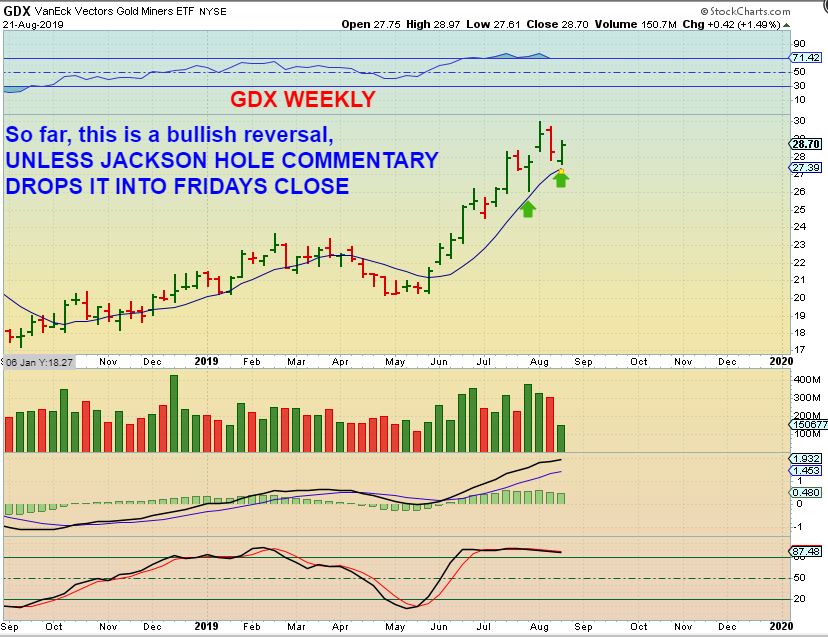
GDX – The Miners also follow that consolidation type pattern. This is normal in a bull run. At this point, we want to see GDX break above the 10sma & down trend line. If it starts to sell down instead, we could be dipping into a larger pullback than we have seen in past consolidations. ( possibly a deeper dcl). I will say this: It is often useless looking at a ‘Weekly’ chart on Wednesday, since we could sell off fast Thursday & Friday and change that candle in a big way, but…
.
GDX WEEKLY – So far, this is a Bullish set up. Obviously a sell off Thursday & Friday would ruin this candle, but right now reversing at the 10 week ma is very bullish. We need Thursday or especially Friday to continue higher. So let me review where we are…
.
So let me review where we are: This will help us to see things as they currently appear to be
1. We bought very heavily ( With leverage like JNUG) at the May ICL, and added early in that run.
2. I constantly pleaded with my readers daily &weekly not to sell early – I said this for weeks coming out of that kind of a low. We rode Miners for months.
3. Finally about 2 weeks ago I mentioned that sold my leverage JNUG, since my price targets in GOLD & GDX were finally being hit ( Gold $1500-$1550, GDX $28, and then $30-$31.). A choppy topping area seemed too close for Leverage (temporary top).
4. I also lightened up just a bit on some of my baskets of Miners ( USAS, SBGL, HMY, CDE, EXK, etc) , hoping to buy lower. I cut some positions in 1/2 but stayed invested enough to catch any upside. I actually sold all USAS & SBGL, but have repurchased those again on the dip.
5. NOW, AFTER A BIT OF A PULLBACK & CONSOLIDATION, ( GDX has dropped for over 8 days), it is possible that we could make 1 more run higher before the intermediate cycle tops. Maybe we do see that GDX $31+? GOLD $1550-$1600?
6. So in recent reports, I have pointed out some Miners that barely pulled back ( HMY, RGLD, EGO, NG, etc etc) as stronger ones that could benefit from a push higher , or be bought at the next icl. Then we have a chart that looks like this GDX chart, Possibly ready to break higher. And that is where we are currently, it is choppy but we may break higher, so …
7. It is too early for a weekly chart, but our weekly GDX chart does currently looks like a Bullish reversal, so we can add if we wish, with stops under the recent weekly candle low. I will again discuss Miners a bit more at the bottom of the report.
.
The ‘Minutes’ from the July meeting seems to have already been figured into the markets. What is going to happen going forward though? What about that 1/4% cut in September? Could it become a 1/2% Cut? So it would seem that what Fed Chairman Powell has to say on Friday is going to be more important to investors. THAT could affect market direction.
.
We would expect that the Fed’s speech on Friday would shed a bit more light on what the next steps policymakers will take to support economic growth. We’ll see if the action tomorrow & Friday give us any more clues.
.
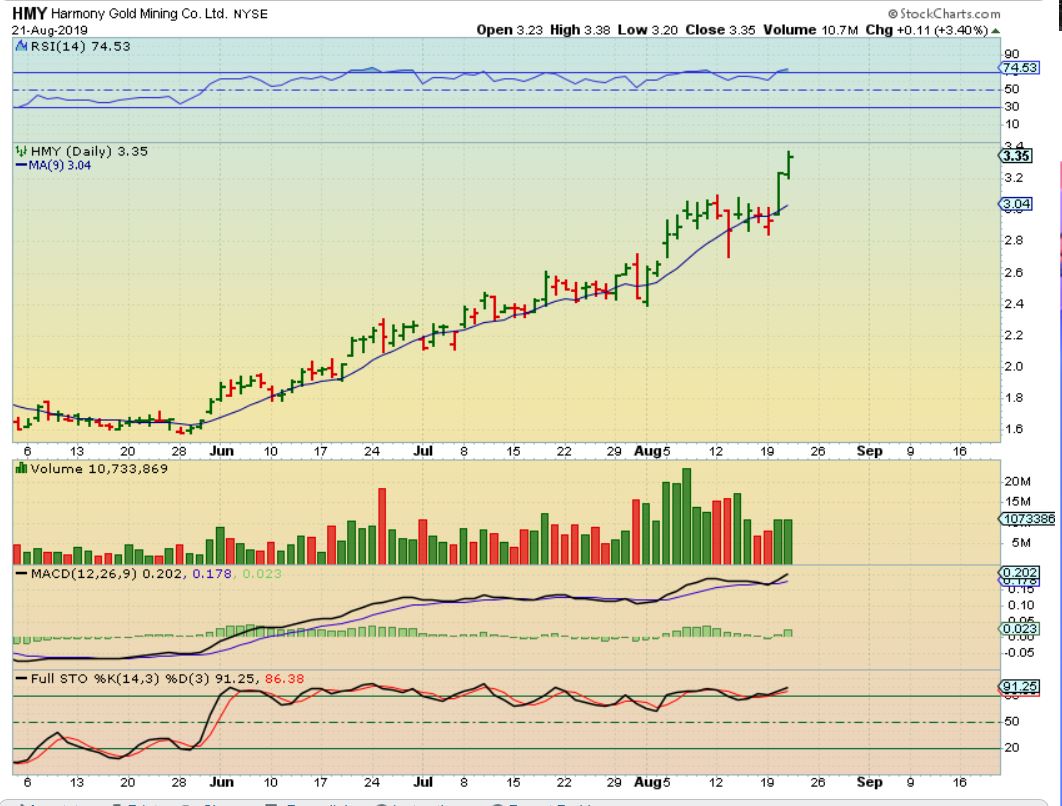
For now, unfortunately, it seems that the choppiness continues in most areas, but some Miners are hitting new highs and remain very bullish. This run in HMY reminds me of the 2016 run for some of these Miners. They ignored GDX & GDXJ pullbacks and carved a path of their own. This is the ‘bullish surprise to the upside’ that I’ve also discussed a lot. THIS IS WHY WE HOLD OUR BASKET OF INDIVIDUAL MINERS.
.
See also NG, RGLD, EGO, DRD, etc & again, That is why we are holding a basket of Miners through out the run.
Enjoy your Thursday trading!
.
~ALEX
.
Let’s discuss this a bit further
HMY – This runaway move is beautiful, and we bought and held it from near that $1.60 area. Is this run totally unexpected? Not exactly . Why do I say that and what can we learn from this?…
.
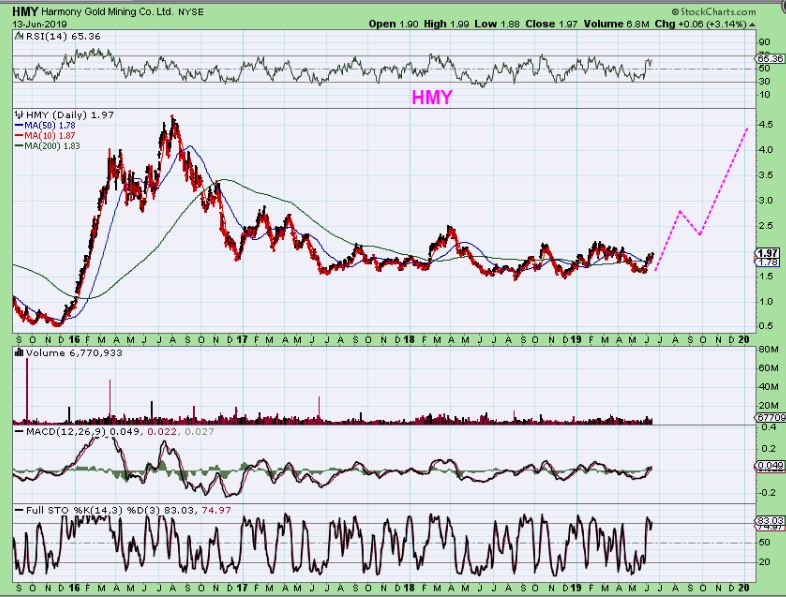
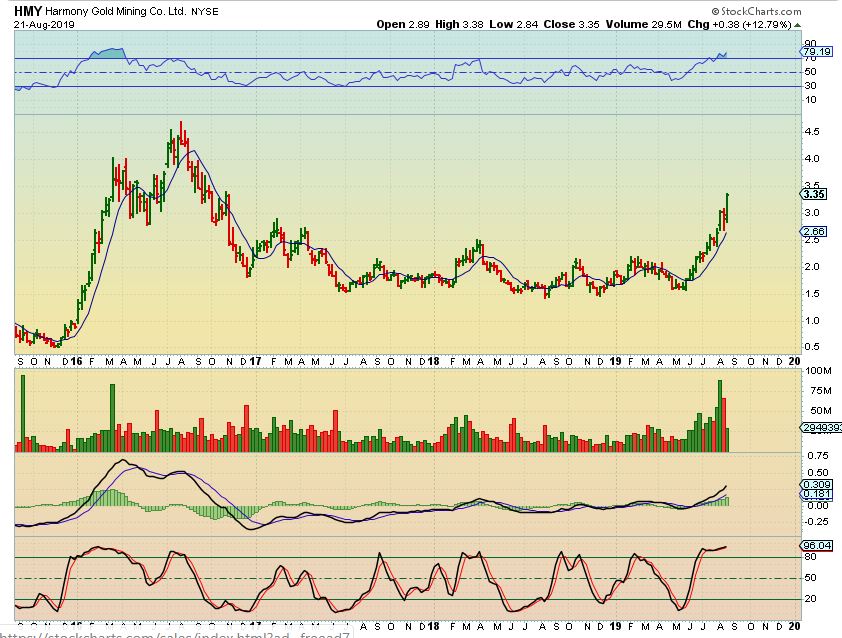
HMY BIG PICTURE – You may recall many charts that I posted in May & June showing large bases that formed in various Miners. I said ” If this sector remains bullish, and I expect it to, these moves out of these bases can run strongly back to former highs. This is why you want to at least own a basket of Miners that do well after earnings.” I posted this June 13th HMY Chart. We bought this near $1.60 area are looking for $4.50 over time.
HMY BIG PICTURE – And it is playing out as expected. In the Bull Run, surprises come to the upside. GDX sold off for 8 days, but HMY released a positive report and took off without permission from the rest of the group 🙂
.
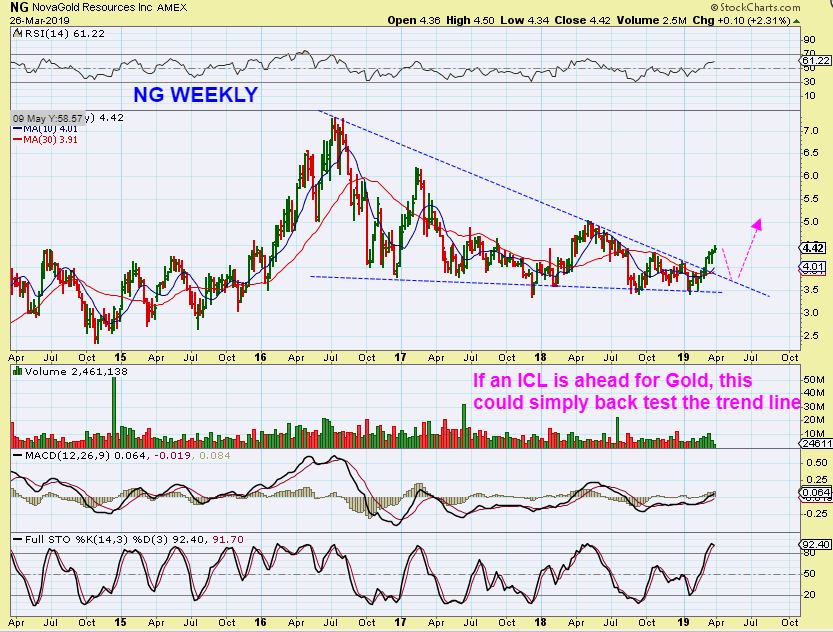
NG BIG PICTURE – So now we look at NG, breaking upward early, this was late March. This was another base that was mentioned and we had an ICL ahead of us ( May), so I mentioned that an ICL could give us a ‘back test’ to buy- see the chart. Would that then run up to former highs at $7 though??
.
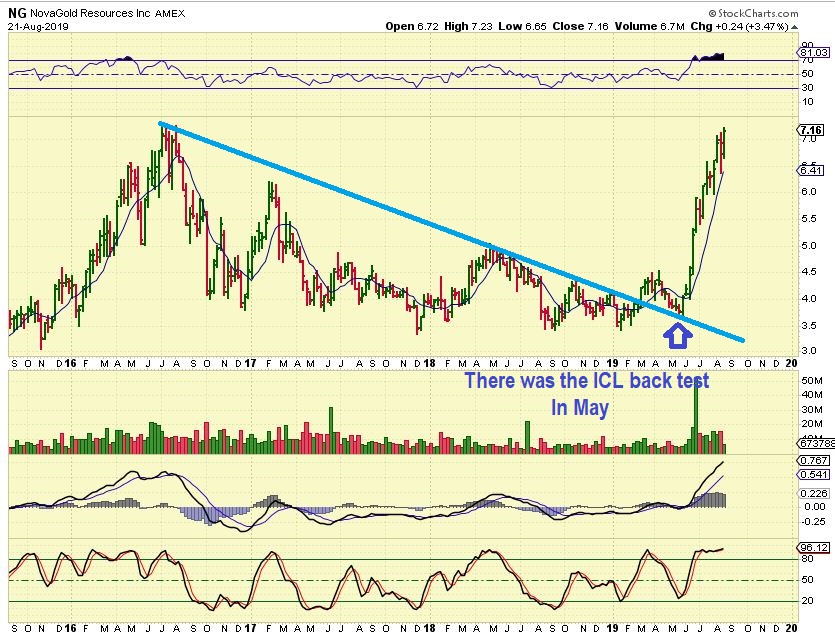
NG BIG PICTURE – That May ICL was the back test & buy. Yes, it ran back to $7 already! So we need to be aware of the surprises to the upside in this kind of a bull. There WILL BE PULLBACKS, but holding a basket is prudent.
.
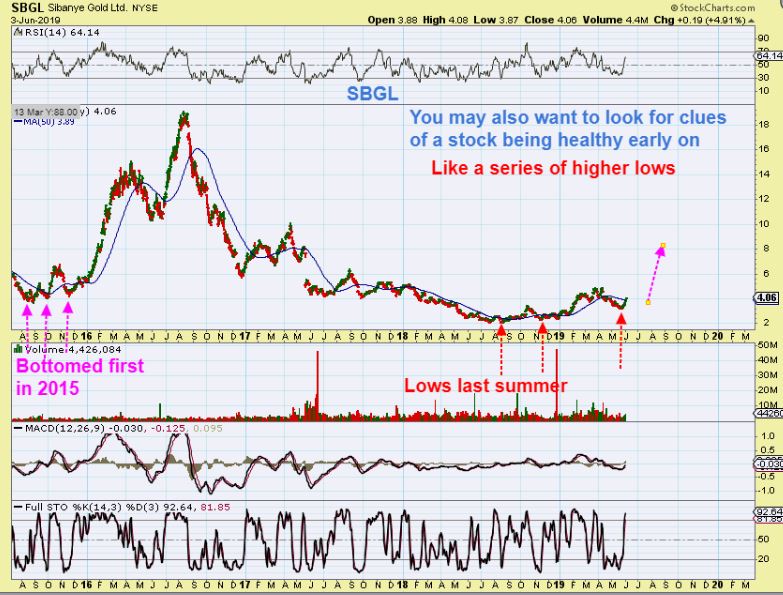
SBGL BIG PICTURE – I also mentioned that I love the potential here, from $2 at the lows to possibly $18 in time? That is a lot if this company can remain Bullish & healthy.
.
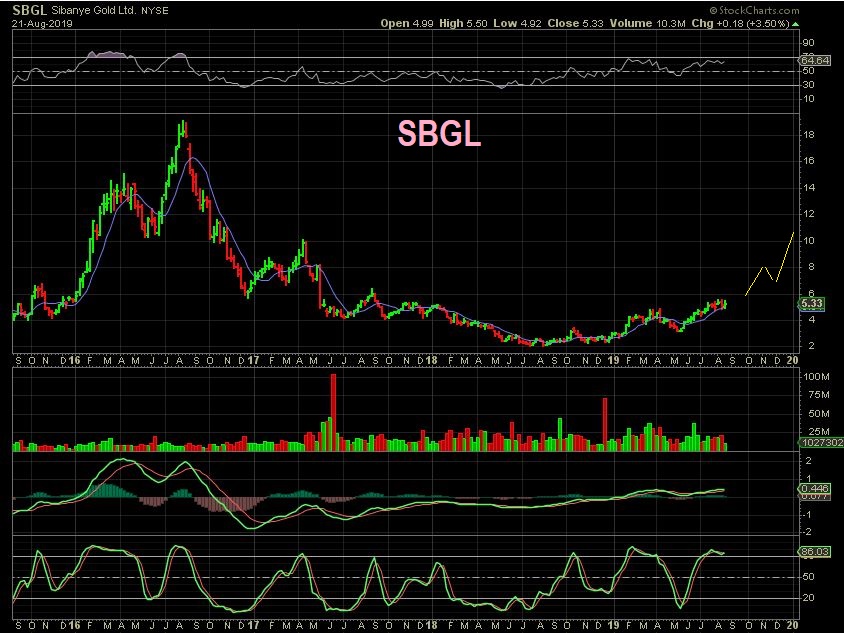
SBGL BIG PICTURE – And it is rising from that base, now above $5. This one has big upside potential if they can perform well during this bull market.
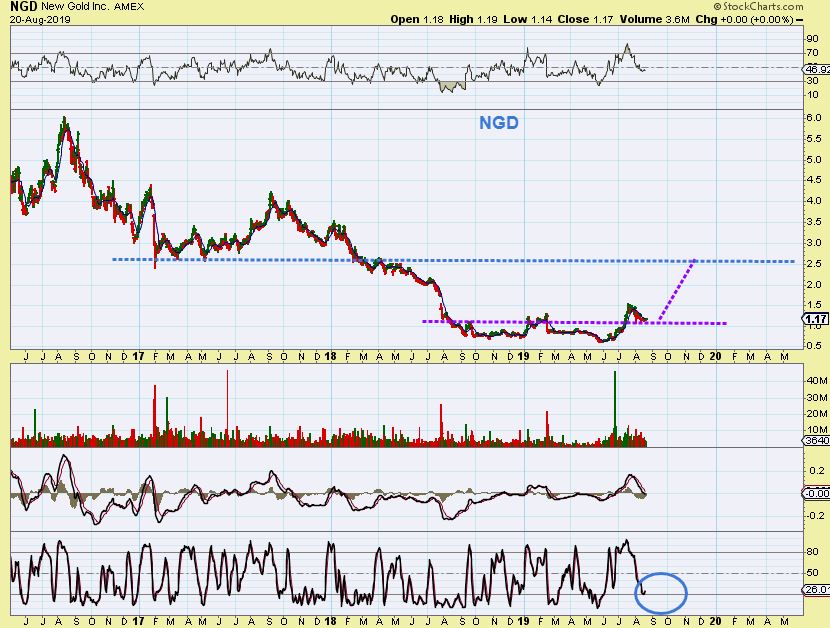
Earlier this week I also pointed out the upside potential in our NGD chart. This looks like a base break out & back test. Read their earnings reports and if they remain bullish, this could surprise to the upside again too.
.
Sooner or later all intermediate cycles ‘peak’ & pull back into an ICL, which is a deeper more meaningful low. That is obviously the best place to buy low and ride the next wave higher, so when that time comes again, I am going to be searching for & finding the best Miners & set ups to buy. For now, we have a choppy sideways movement, and it is harder to pick Miners to buy this late in the run. We cannot tell how much more upside is available in this run- but we can be prepared to buy these dips & reversals, and then USE STOPS, and see how it plays out. Recently I pointed out HMY, AUY, NG , EGO as bullishly set up- now we just need to get past Jackson Hole to hopefully end the choppy consolidation and get moving ( Higher hopefully). Even if we started a drop into an ICL, it will lead to an excellent buying opportunity.
.
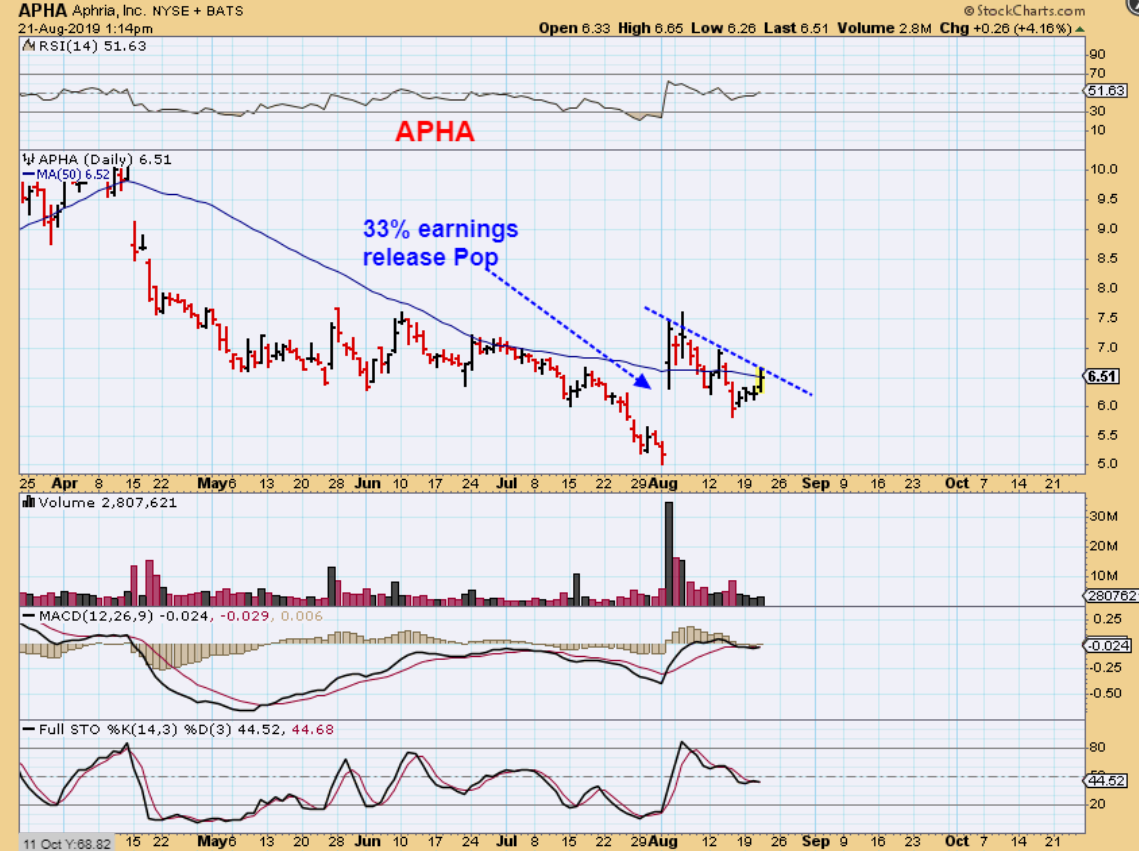
APHA – I am still seeing signs of life starting to present themselves in the MJ Sector, but many are not quite ready yet. I pointed out SPRWF this week, that paid off well. Now APHA may be ready. It Popped 33% on earnings and has since pulled back. When this breaks higher, it is a buy, but you must use a stop on MJ Stocks when they sector is not running strong.
,
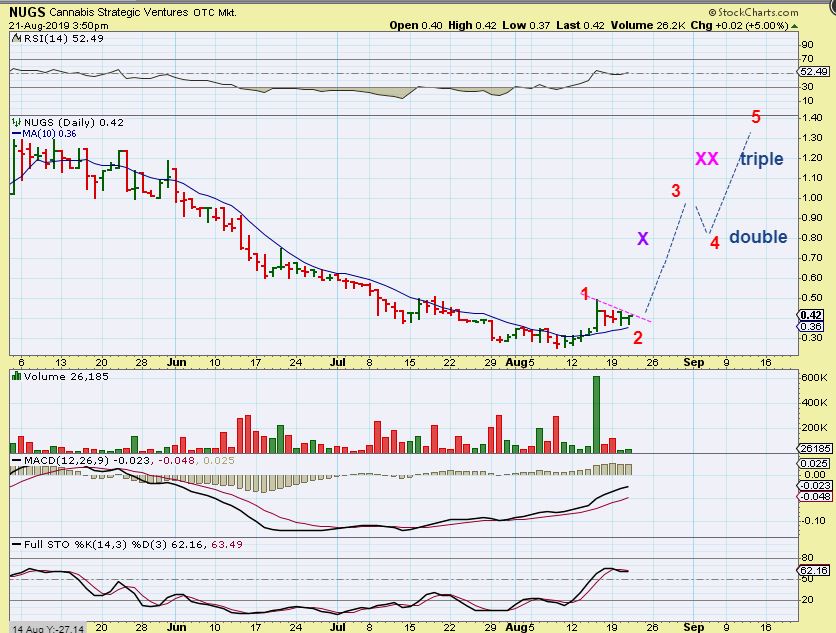
NUGS – I mentioned SPRWF & NUGS recently too. SPRWF took off higher, but NUGS was in this pinched formation. Has it improved?
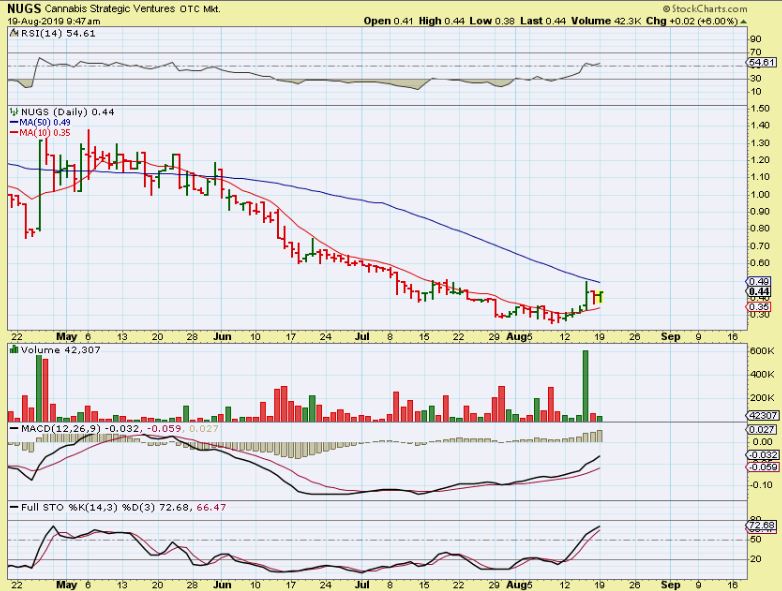
NUGS – It is actually going sideways, but this looks like a bull flag. It is hard to recommend this one, since it only has 30,000 volume some days, but I do like the base & set up above the 10 sma. These MJ Stocks can run, and this could actually double or triple over time. The sector is not in Bull mode yet though.
A TRADING TRICK OR LEARNING LESSON FOR SHORT TERM TRADERS
I want to quickly show you an old trick that I have developed & used often. It works well quite often, especially on “Shake outs’. I will show you how I have used it, and also another way that it can be used…
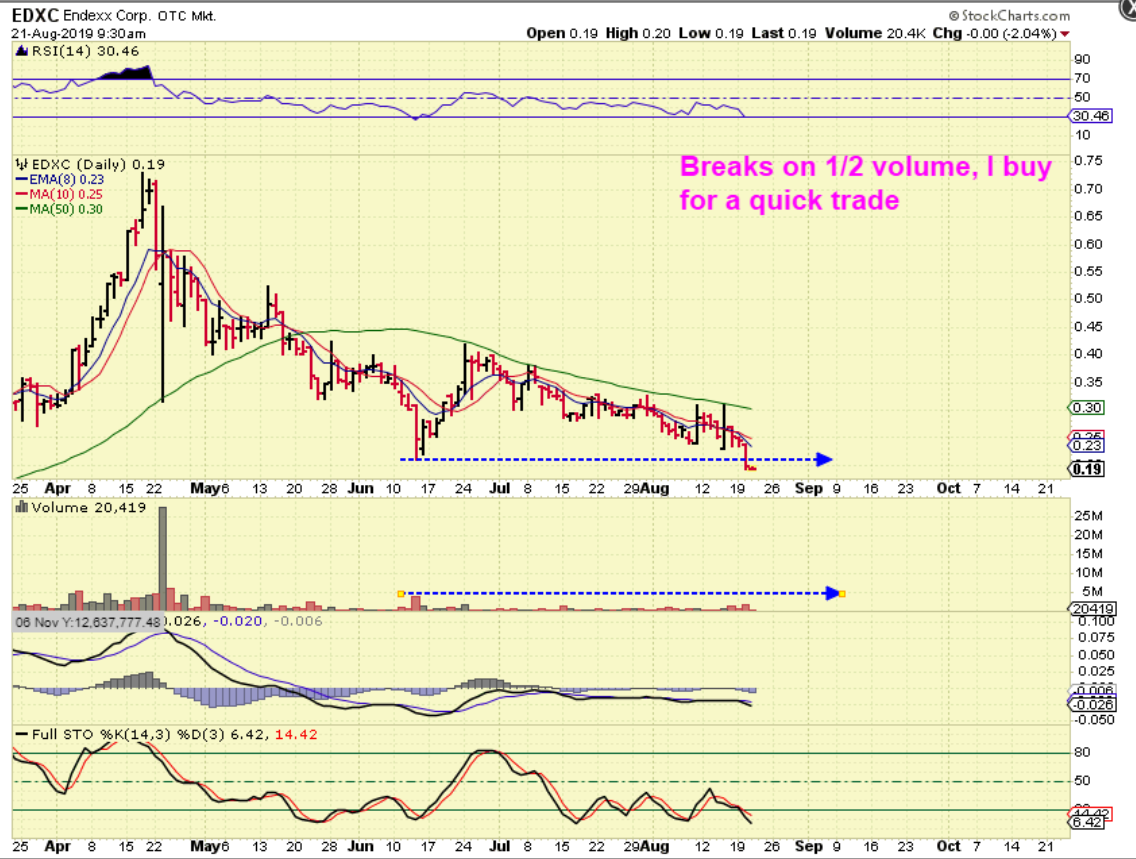
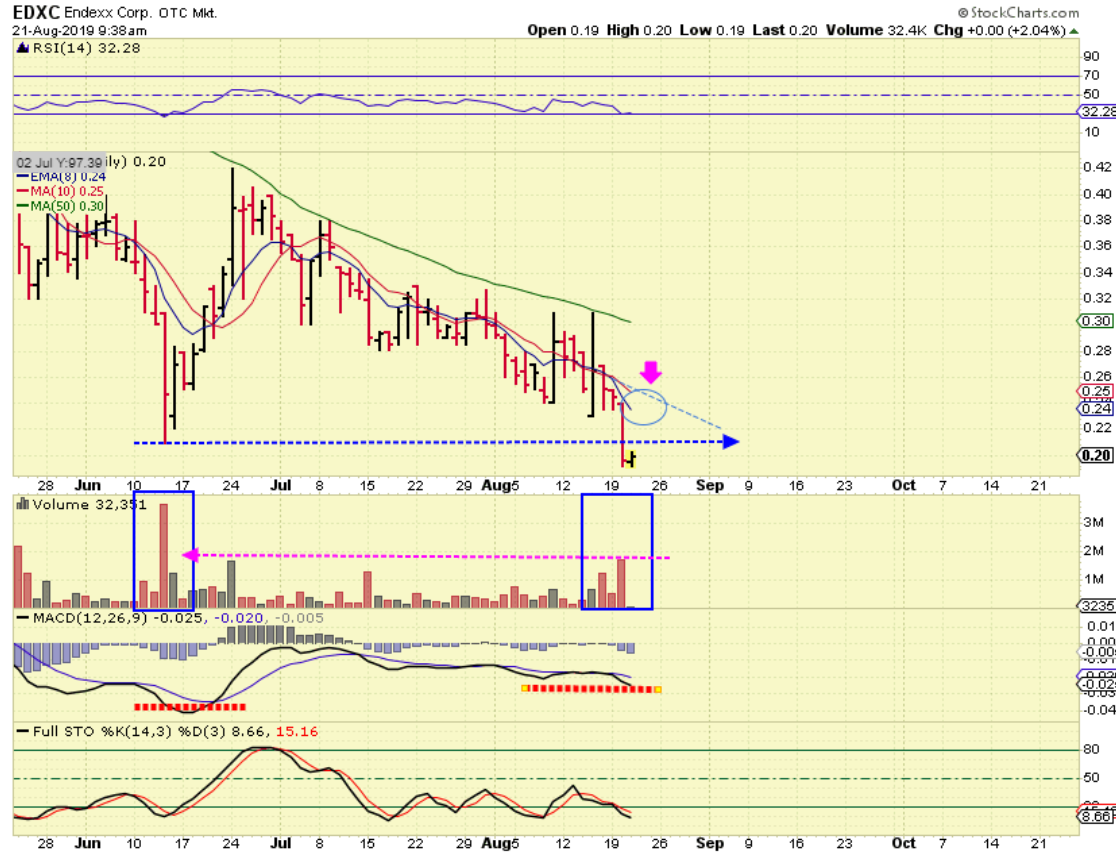
EDXC – I have mentioned over the years that when a stock breaks prior lows on 1/2 the volume, IT WILL OFTEN SNAP BACK as a shake out or false break down. IT CAN then drop again, but for now it shouldn’t just keep selling with light volume. I Will often look for & Buy a reversal, so I posted this live yesterday as one that I Bought . View it as an experiment…
EDXC – The reversal started to move higher
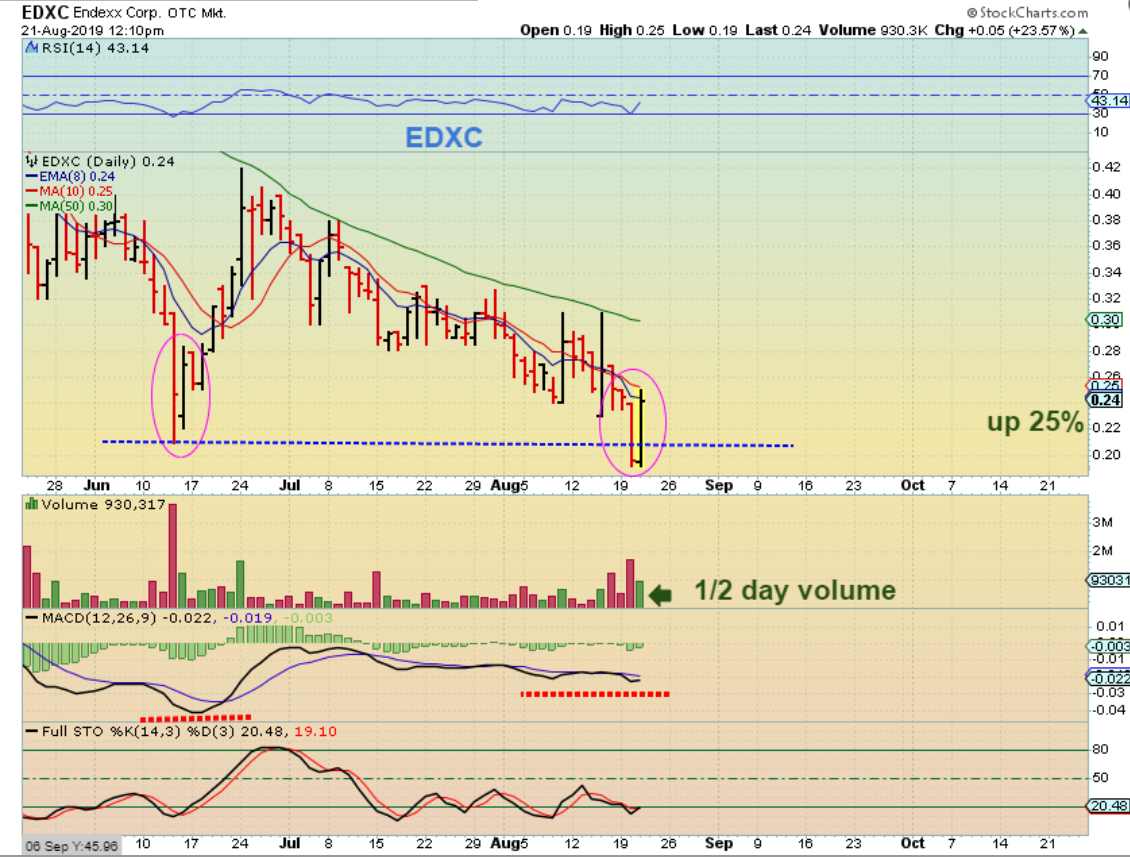
EDXC – Suddenly it was up 25% from the lows.
EDXC – And closed the day as a shake out ( So far) . I sold 1/2 of my position & want to see if it can tag that 50 sma. SO HOW MAY THIS BE USEFUL TO YOU?
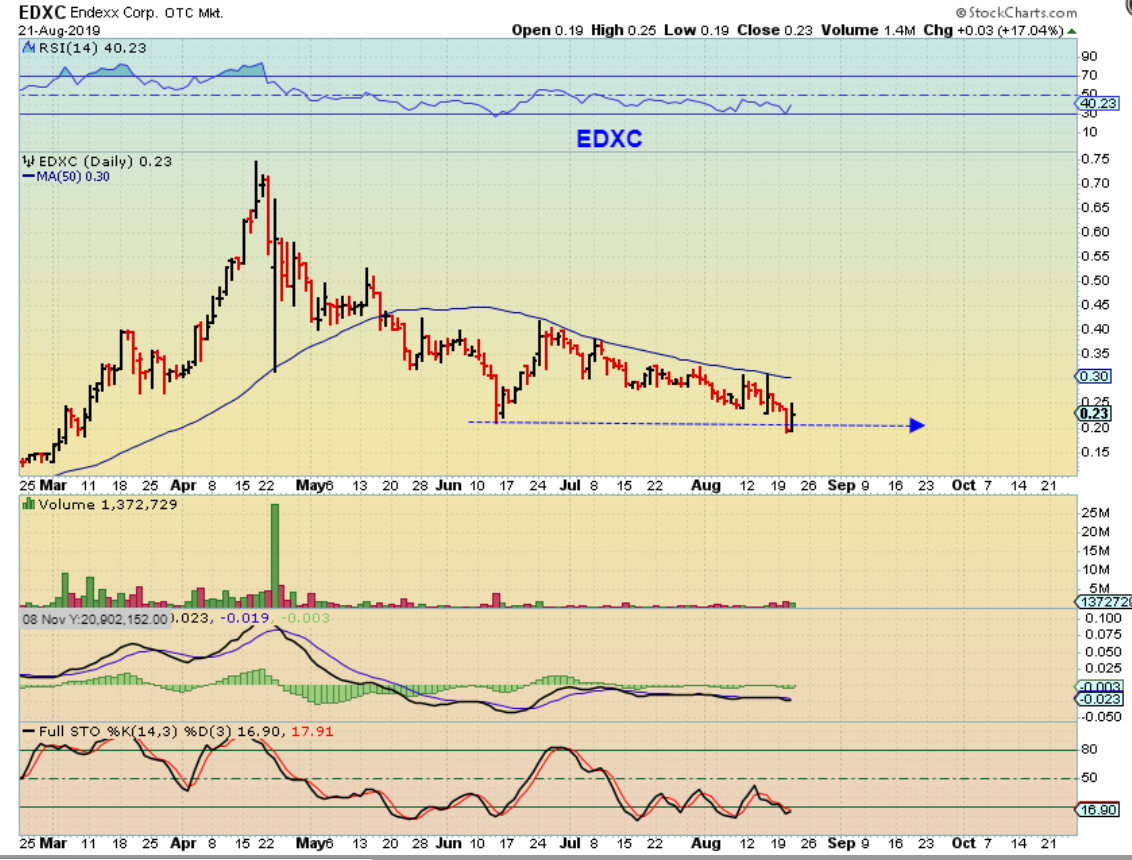
SO HOW MAY THIS BE USEFUL TO YOU? This works VERY WELL when you have ( Let’s just say) a $12 stock that drops to $10, bounces, and then drops below $10 on 1/2 that volume. If you see it drop to $9 & reverses higher, You can then buy it and hope for that bounce to at least that $10 area, BUT ALSO, if you went short and the break of the prior low was less than 1/2 the volume of that low? THAT IS YOUR WARNING. I would close that short expecting a snap back. This works VERY OFTEN, I’ve used it in short term trading Very Often, so it is something that you as a trader can watch for too. I don’t usually recommend using it on a penny stock, but I am familiar with EDXC & took the trade real time.
.
BITCOIN CONSOLIDATION
.
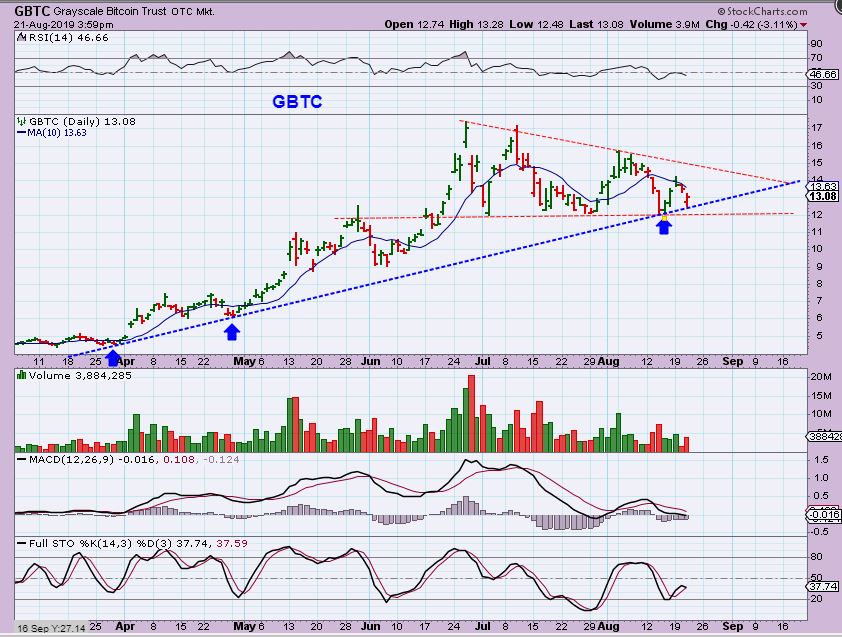
GBTC – Bitcoin is still in a long sideways choppy period too, but I feel that GBTC has support in that $12 area . It bounces here each time it tags the $12 area. If that breaks down, obviously this could sell off. If it holds, this may trade higher, so this is an area that I would consider a lower risk buy, IF I WANTED TO TRADE BITCOIN. This has bounced from $12 to $17, $12 to 17, $12 to $16, and then $12 to $14, so it is also forming a triangle or wedge. A break above the RED DOTTED LINE is also a good place to add to position, if you buy in this $12-$13 area.