August 17th Weekend Report – Perspectives
.
When stocks run steadily higher, they can get a bit extended or maybe sentiment even gets a bit euphoric. A healthy market then starts to enter a period of consolidation or begins to pull back and digest those gains. I think that is what we are seeing currently in the Precious Metals Sector, but is that also what we are seeing in the General Markets? Let’s discuss our current Market set up…
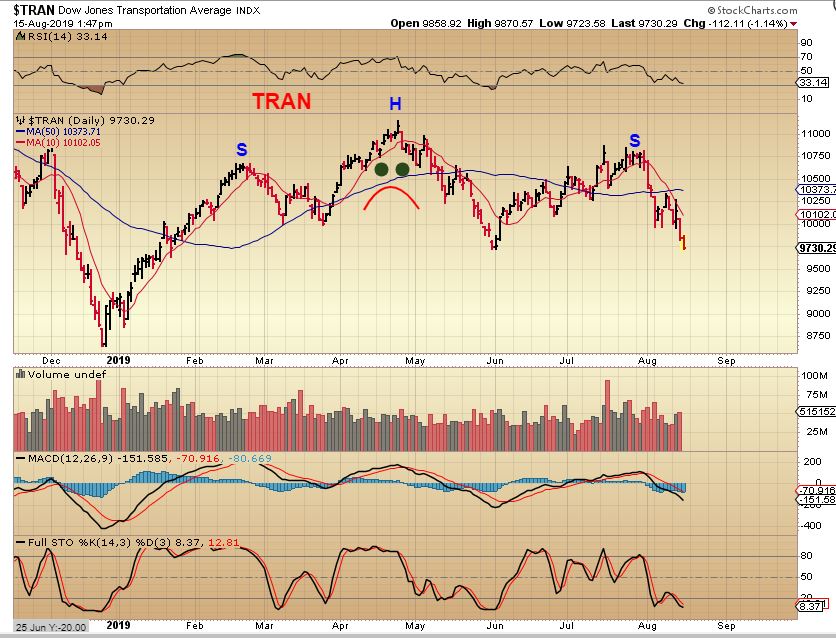
TRAN – I used this in my Friday report and it is worth watching. A drop from here could easily test those high volume lows in December 2018, and then we would have a year of sloppy choppiness.
.
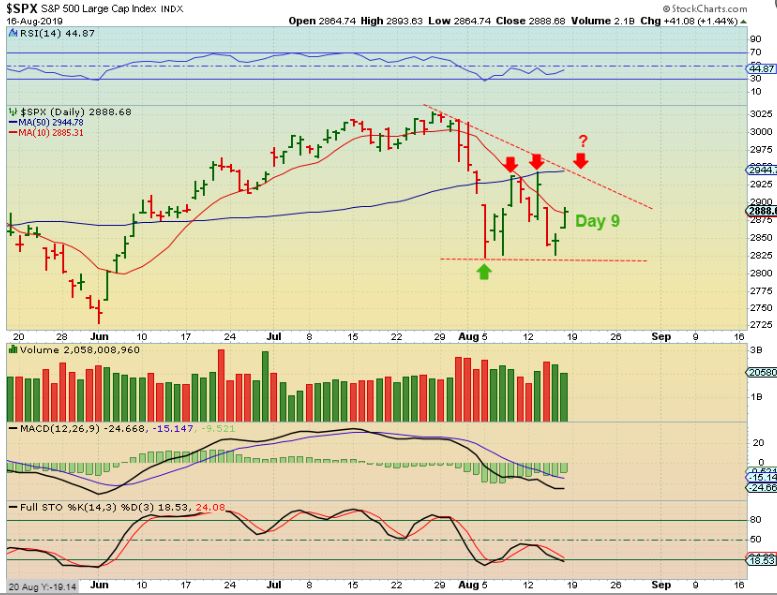
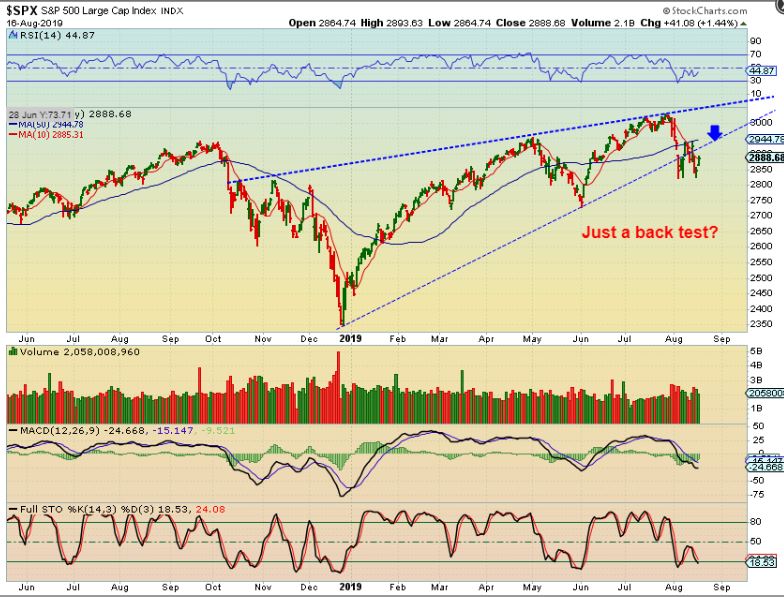
SPX DAILY – I’ve discussed the daily market moves as large swings that look bearish for 2 days, then bullish for 2 days. We are currently on day 9 with a day 6 peak and the 50sma is acting as resistance. I DO a slight see improvement in some areas like the RSI & a few other indicators that I use, however…
.
SPX WEEKLY – This big picture view shows the bearish wedge that I had been pointing out weeks ago, and this might be a break down, back test, and then? Usually that is followed by a drop. The 50sma & the wedges lower trend line intersect where price seems to be heading next week.
.
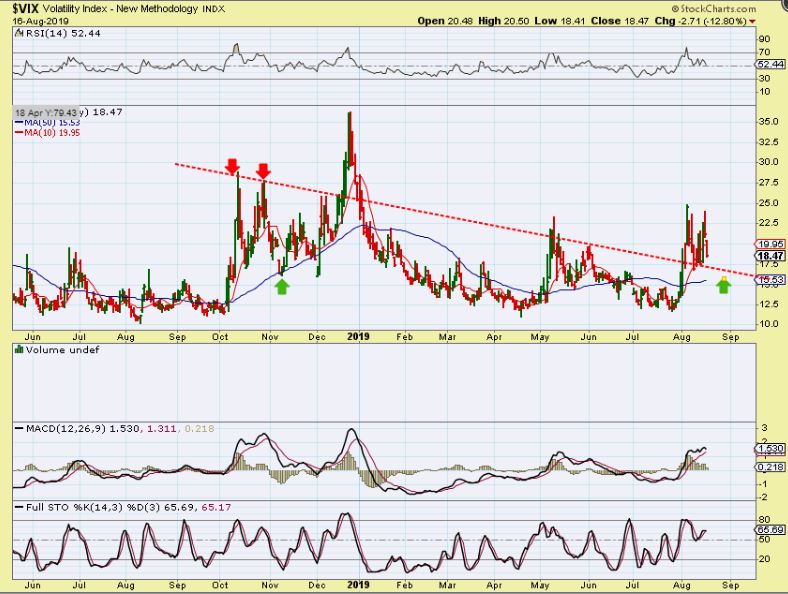
VIX – If the SPX is just back testing a break down, the Vix also could be back testing a break out. This would be bearish for the markets in the bigger picture, even if next week becomes short term bullish. These are areas that I will be watching. ( 50sma support for the vix?).
.
INVERTED YIELD CURVE: I have not discussed the inverted yield curve in my weekday reports, because I figured that you would here it on CNBC, Bloomberg, and then on the evening News first. Of course then people in the Market place will be mentioning it, suddenly your hairdresser will be warning of it, and finally the 13 year old paperboy will warn people about it too. 🙂 When big news comes out, everyone usually hears ‘something’ about it and then they start to talk about it, but often what is mentioned is not completely accurate. Many think that ‘an inverted yield curve’ means that we are in or entering into a recession right now. Based on what I have seen historically, when it inverts, there is a likelihood of a recession roughly within 22 months. Some say 18 months, other say ‘within 2 years’, but basically it takes a while for the effects to take hold.
An inverted yield curve is when you compare the 2 yr treasury yields vs 10 yr treasury yields, and the 10 yr yields less than 2 yr. That means that the short term pays off more than a 10 yr. That condition is bearish over time and a Recession often comes 22 months later. IT SHOWS UP IN THE CHARTS LONG BEFORE THAT. THAT IS WHY I FIND CHARTS EXTREMELY HELPFUL. It is hard to hide what is going on behind the scenes over time.
Also if you look at past market tops you see that Markets do not V-Top, they can take a while to top. Distribution takes place, where big money unloads to the general masses . They lock in their gains from the Bull Market, while your 401K and other unknowing Buyers just keep buying . I was taught that the stock market is 6 months ahead of whats coming, and you can see it in the charts if you know what to look for, so you will see signs of a bottom ( like Precious metals) and signs of a top well before the real moves hit. I have been pointing out what looks to be signs of both for a year now, and will continue to do so as things unfold.
.
.
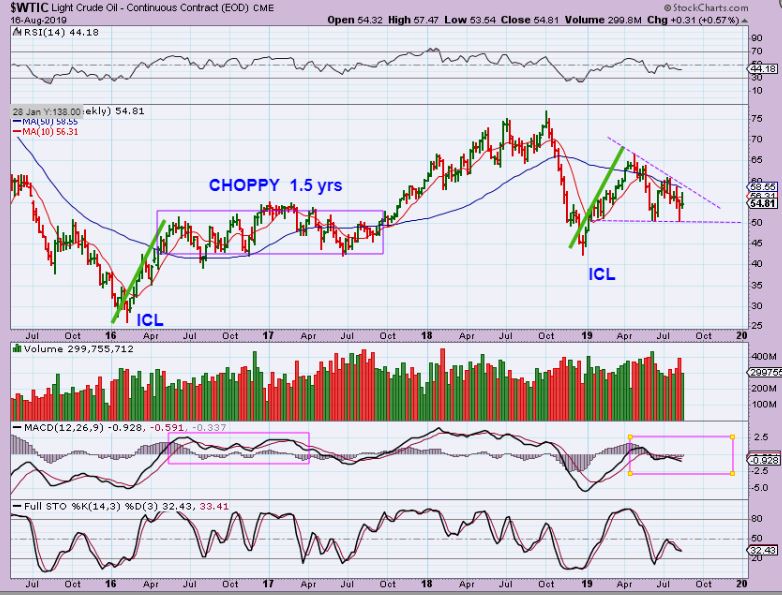
WTIC – The big picture for Oil is that after the initial strong rally out of the ICL, we are seeing a lot of price chop. This may continue until we start seeing higher highs & higher lows.
.
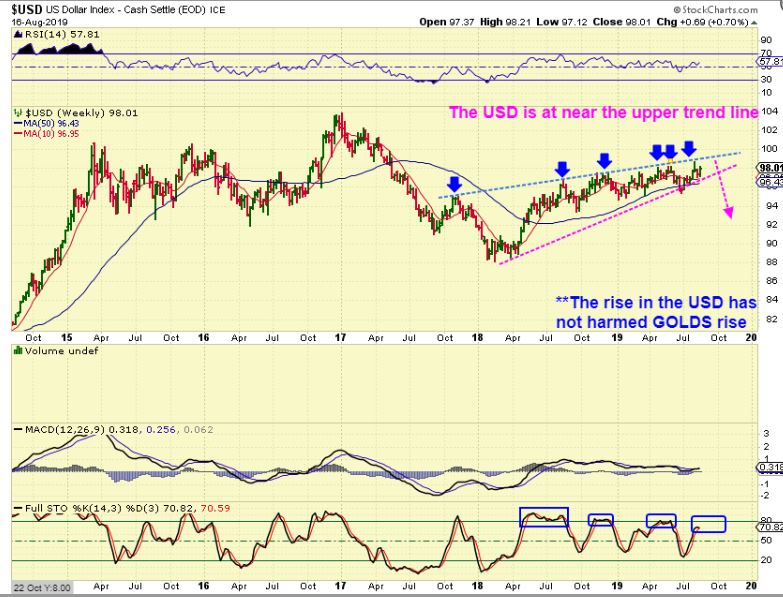
USD – I am still looking at the USD as a bearish rising wedge, and when this breaks down from this top over time, Gold should continue higher out of its base over time.
.
.
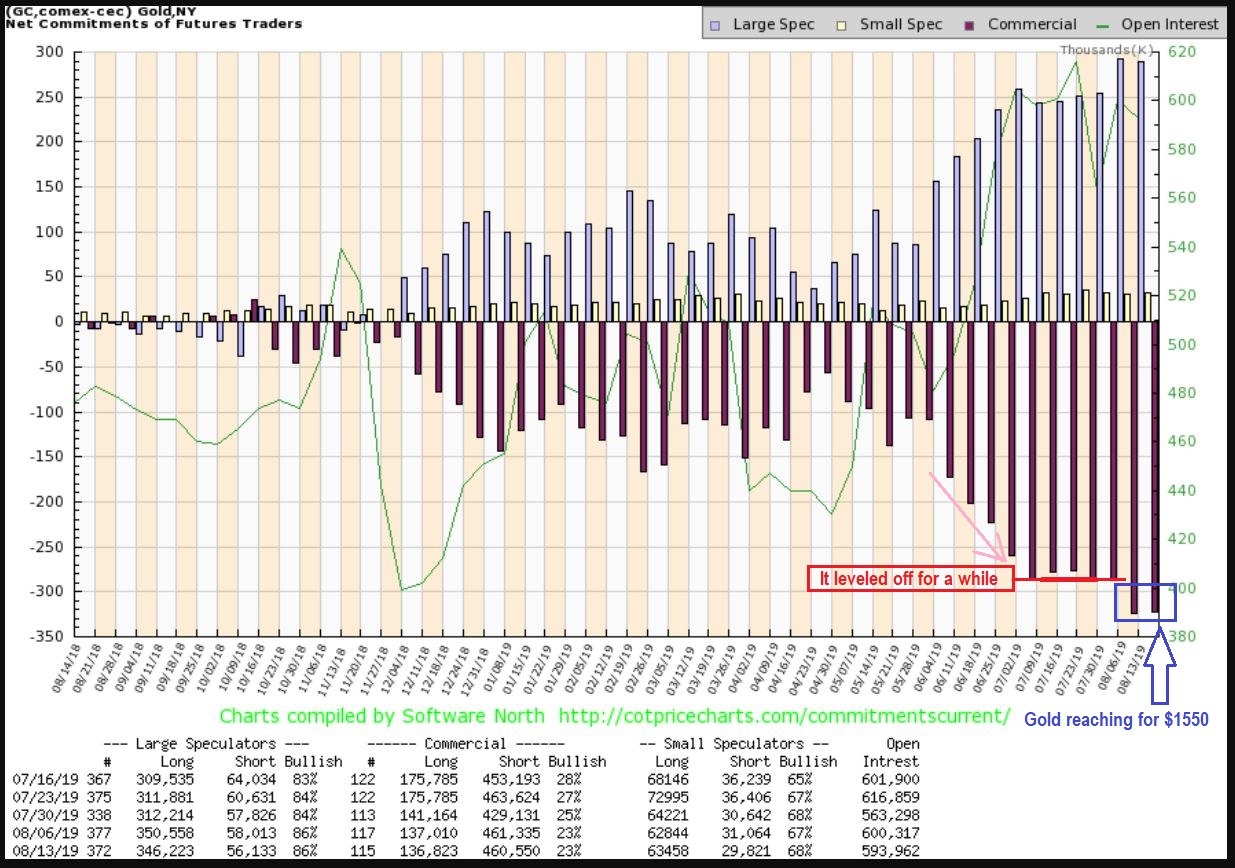
GOLD COT – The COT for Gold has increased over the last 2 weeks as Gold broke from the consolidation and reached upward for $1520-$1550. That is a high level of smart money shorts hedging Golds price rise. I mentioned back in June that I expected the COT to keep rising, and that this rising COT should not be alarming in this type of bull Run, and that has proven to be the case so far. THIS LEVEL IS NOW QUITE HIGH THOUGH, AS GOLD REACHES RESISTANCE. It WILL draw back when Gold dips into an ICL.
.
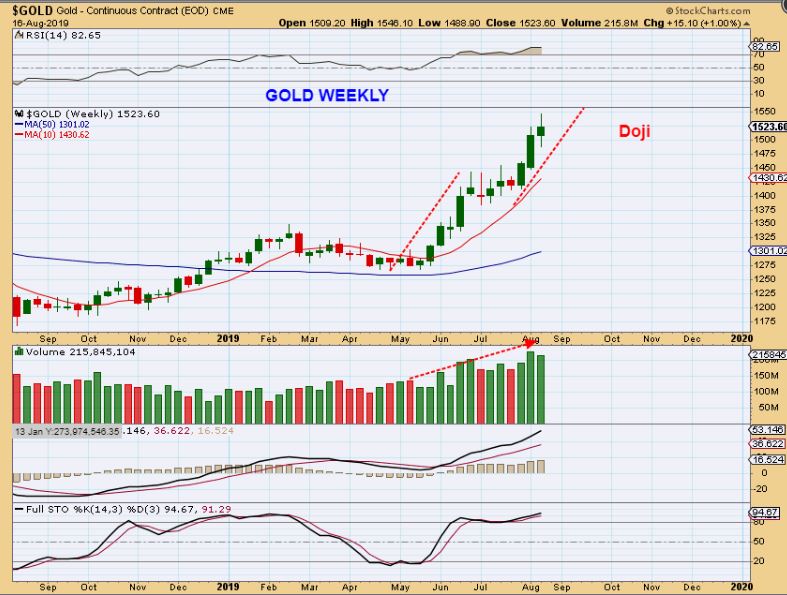
GOLD – A weekly Doji is a sign of indecision ( somewhat equal buying & selling). I have been expecting price to stall here, and maybe even pull back because…
.
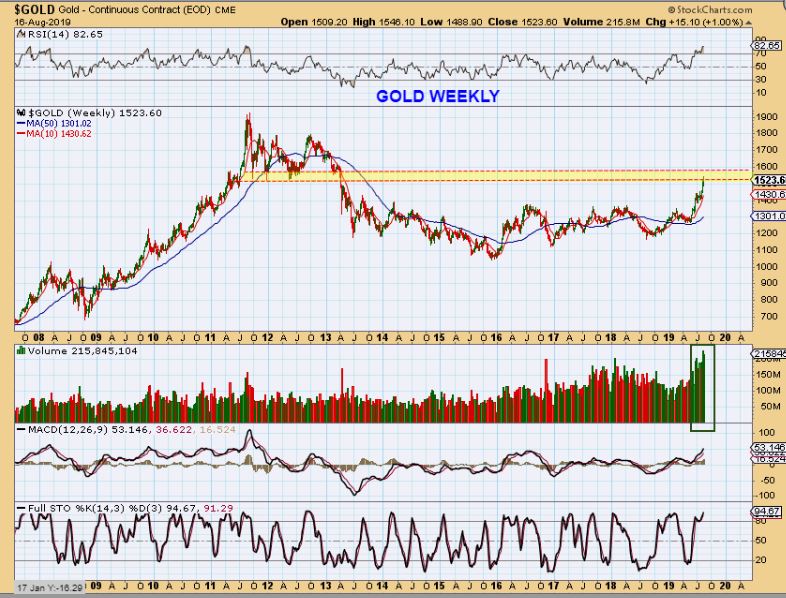
GOLD – We are in the zone that I pointed out as resistance. I do want to point out that I DO expect Gold to overcome resistance and get back to prior highs ($1900+) over time, forming a giant Pan or cup. For now I am taking it one step at a time.
.
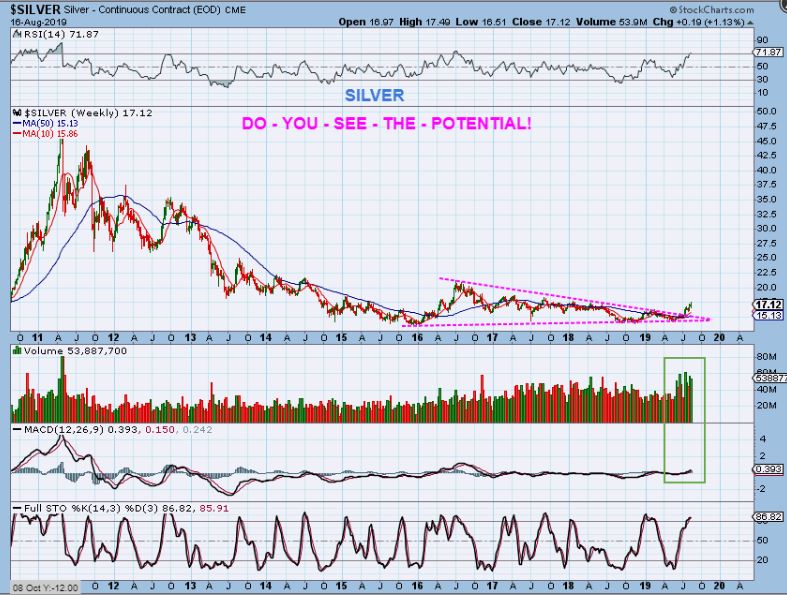
SILVER – The potential for Silver is incredible, so if you can handle the pull back in your basket of Silver stocks, maybe even adding on the dip AT THE RIGHT TIME ( DCL / ICL), this can pay off in a big way over time. You can see that Silver has just barley started to get moving, right? Yet many Silver stocks have doubled. Where will those stocks be when Silver is trading at $30 / oz & those companies are making twice the profit?
.
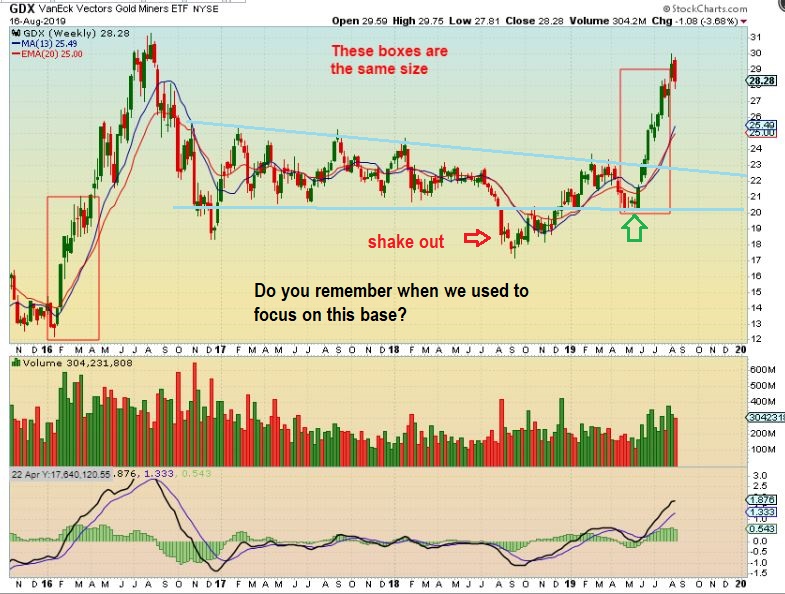
I KNOW THAT MOST, IF NOT ALL OF YOU, REMEMBER THIS CHART. 🙂
Well this time it is back with some really good news attached to it. When GDX & GDXJ formed this base, I was constantly saying that a break out from this base could shoot us up the the 2016 highs (Forming a cup or pan ). That would be that GDX $30 ( I thought maybe $31) price area. Well, I have some great news…

.
GDX –
1. We broke from that base & we have formed our large PAN, so …
2. That should give you confidence that what I was seeing played out, and better yet…
.
GDX – We now step back and that PAN from this rally is really part of an even LARGER BASE!. In hindsight that big run from our other base looks very small, but it has raised our account values very nicely. Well, there is more to come.

.
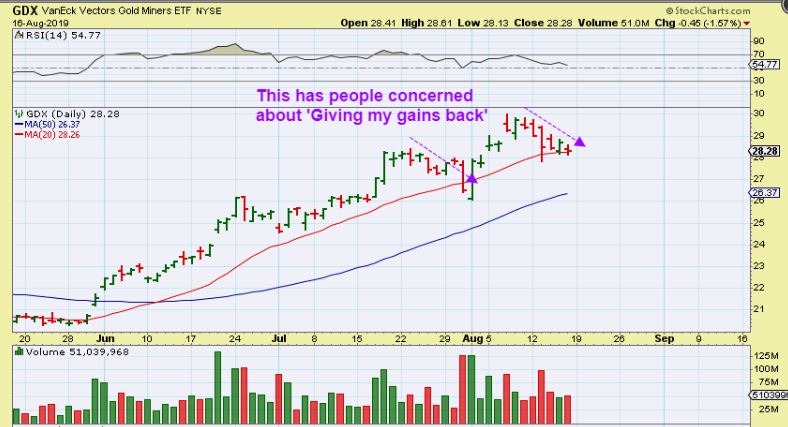
I do want to say this: It looks like all blue skies and sunshine, right? That run from May to August now looks easy in hindsight, right? It really wasn’t for many. It helps to remember all of the concerns about the bull, the ‘Bearish Rumors’ and occasional choppiness, etc that we dealt with as this played out. I honestly had people writing to me and saying that they sold everything early to lock in gains. Other wrote & said that they sold everything 1/2 way through this run, and they couldn’t find a way to get back in. Some are quite nervous now, writing, ” I just don’t want to lose these gains!’. Moving higher from here could be the same or even more choppy & difficult. Riding a Bull is not as easy as it looks in hindsight…
.
Even right now, GDX is just slightly pulling back, and many find that very uncomfortable. Were you bothered this week by the pull back in Miners? Look at that dip on this chart. This is a small pull back, but I can tell you that we will see much deeper drops than this. My job will be to try to keep us on the bull, and keep the gains coming.
.
– The General Markets are volatile and the Vix has been breaking higher too. These markets will need to be monitored closely, since big money may be unloading their positions little by little, forming a top here.
– Oil is choppy and could stay that way, without forming a trend higher or lower. We saw 1.5 yrs of sideways chop after rallying from an ICL in the past, and so far that is what we have here too. It has been a bit too frustrating to trade.
– The USD looks to be slowly topping & that should help precious Metals in the long run.
– Precious Metals: I mentioned that I sold my leverage a week ago, feeling that we were close enough to a top. I also lightened up on my Mining positions, but kept a basket of Miners in case we do get that final Pop to GDX $31 and Gold $1550. In addition to that, I pointed out that JDST looked to have bottomed at $12, so that could be used by some as a hedge, but that also would mute gains as well as losses. Most would probably just ride their Miners during the dip.
Surprises to the upside can occur, so in a bull run, I recommend holding that basket of miners. That can be a bit difficult during a pull back, but it helps us to stay invested. You can also think about it this way, if you don’t need to take the money out today, your account will ebb and flow with the tide, but the tide is gradually rising in a bull market. Even though some gains are given back on a week like last week, it is short term and we have seen a 1 day blast higher in Miners make 4 days of losses back instantly. In a bull market, funds can continue to compound or build up over time. And as you’ve seen with these charts today, it may not always be easy to just hold through some pull backs, but the potential going forward is very exciting!
.
Enjoy the rest of your weekend!
.
~ALEX
.
.
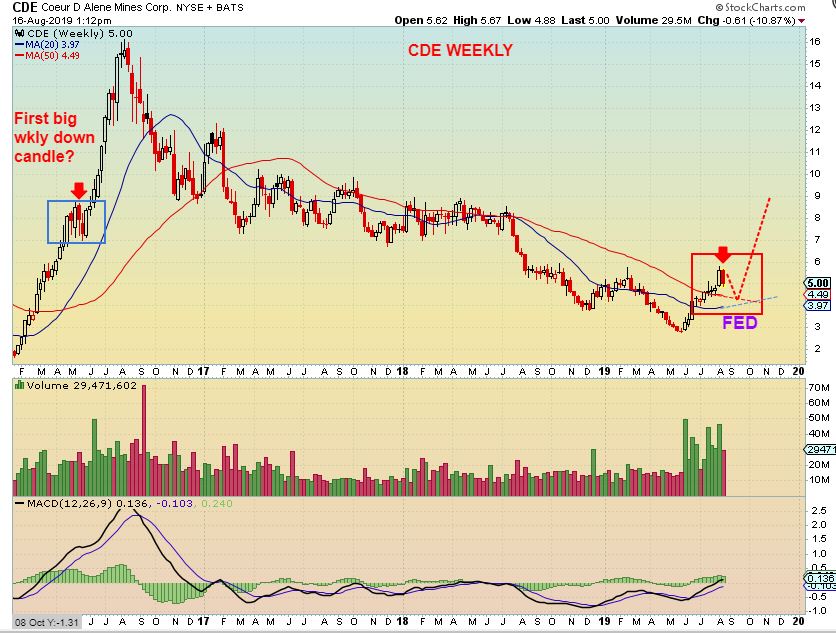
CDE WEEKLY – by request, “Am I concerned about the weekly candles on some of these miners?” Not really, I do expect pull backs along the way. Just like anyone else, I do hate to see a 1 week candle that practically takes back all of the prior weeks gains, but in the bigger picture, I expect higher prices.
For example CDE; This doesn’t look very different from 2016, because back then I saw deep 1,2,& even 3 week drops that were erased quickly.
.
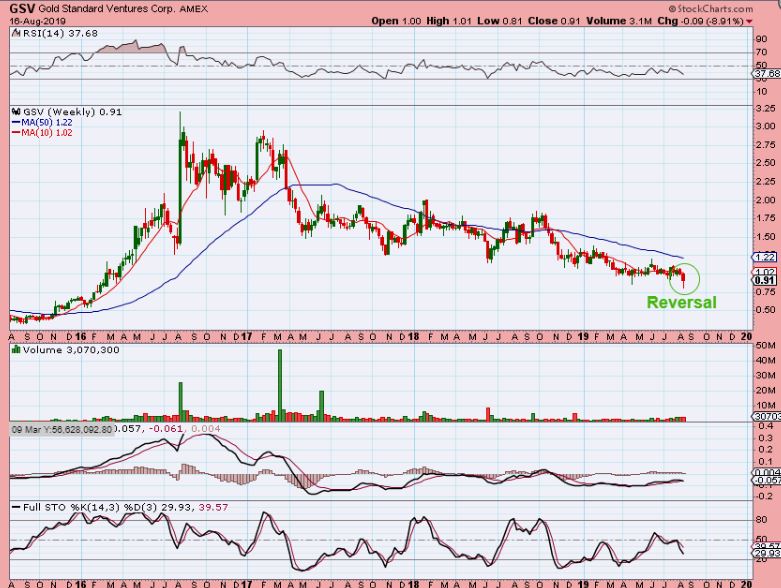
GSV WEEKLY – Robert mentioned buying GSV in our live chat area, so I took a look at it. We certainly have a laggard here, since it is at the lows, but that is a weekly reversal candle. You can buy this with a stop under recent lows and your risk / reward is very favorable. Even just as a ‘trade’, a run to the 50 week ma from right here is 35%.