Is It Time Yet?
.
In this report, we will discuss what time it is …
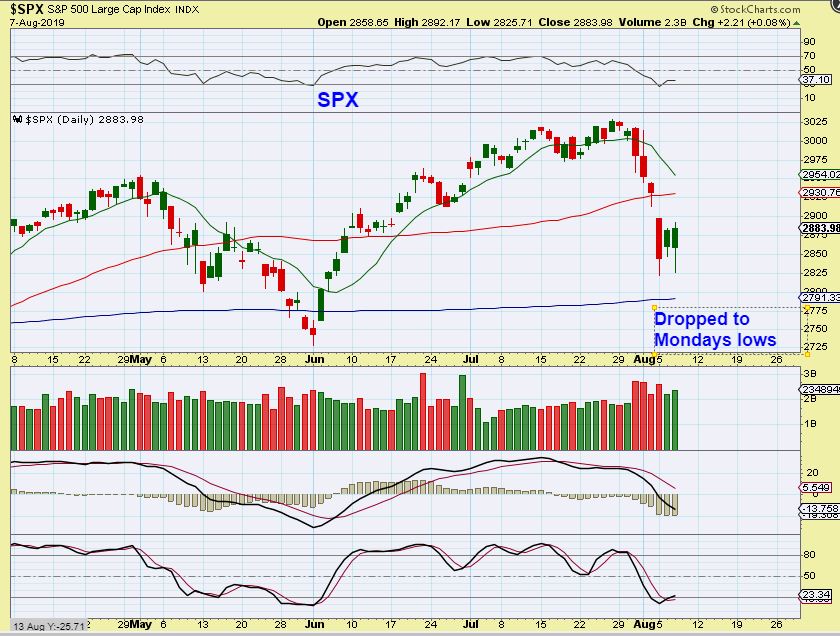
SPX – This reversal set up is a buy signal, but is it time to buy? Some traders may want to, but remember that this also could simply remain choppy or volatile. Let me show you a reminder from yesterdays report…
.
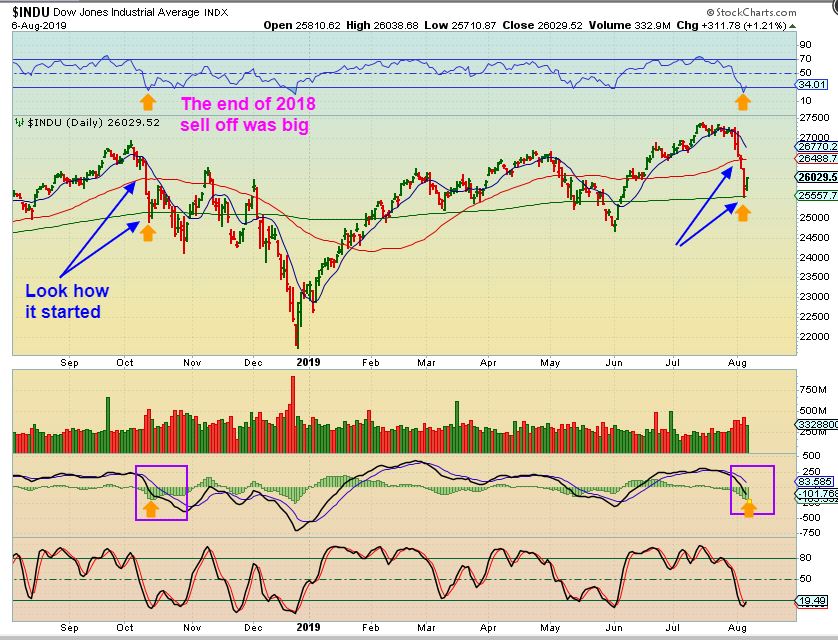
YESTERDAYS DJIA REMINDER – Take a good look at the drop of Oct 2018, and compare it to the drop that we just saw AFTER THE FED CUT RATES. That OCT bounce was not strong, this became volatile & choppy. Anyone that wants to risk it & go long, this is a buy with a tight stop & raise it as the bounce unfolds. It could fail quickly though, or back test that 200sma.
.
VIX – And the VIX looks similar to last October too.
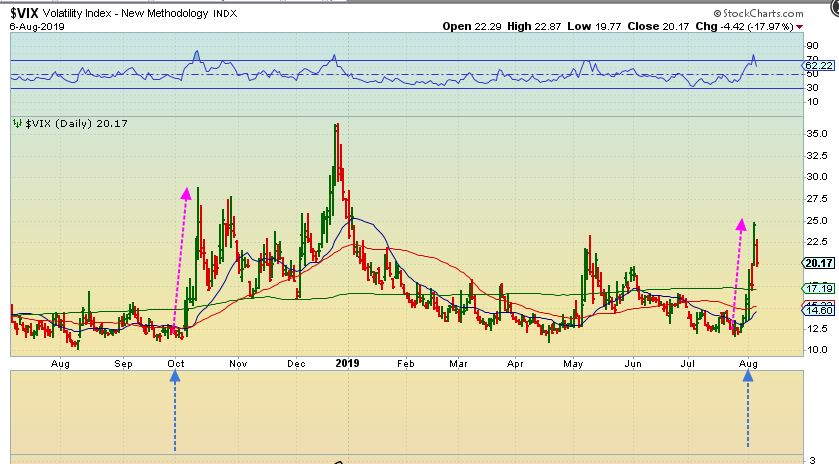
So the General Markets may bounce or put in a short cover rally from here, but I’m watching it closely for clues as to whether we are topping out here. The Fed rate Cut caused the markets to POP, and then they crashed. That could be a warning sign going forward.
.
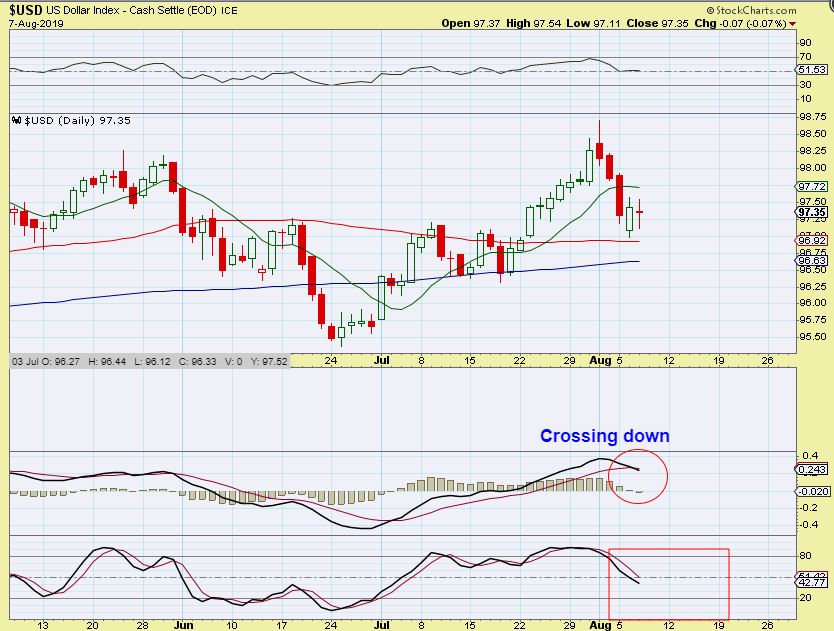
USD – The USD paused on the support line of the 50sma. I think that it can drop a bit further, but it may just pause here.
.
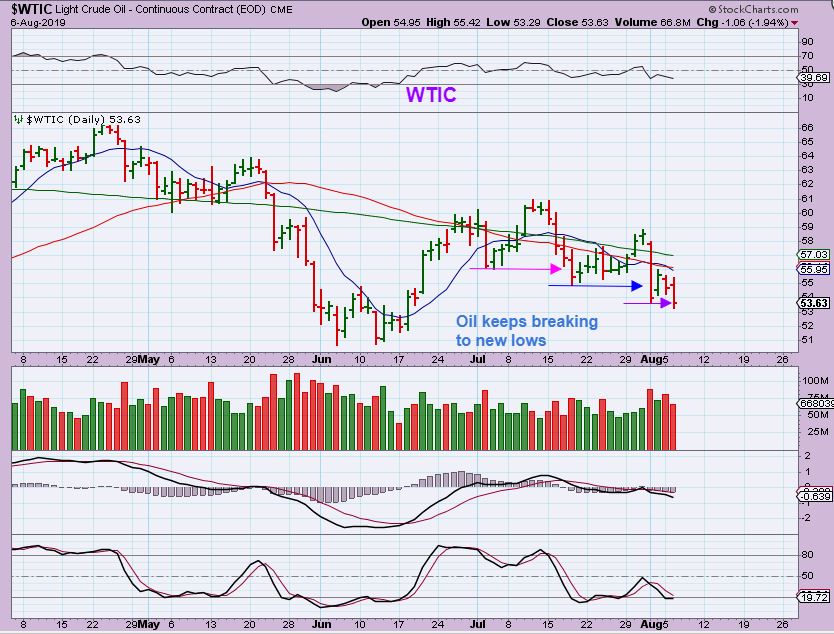
WTIC FROM YESTERDAYS REPORT – Oil keeps taking out prior lows. Wednesday is Oil inventory, but Oil looks weak and really struggles at the 50 & 200sma, now sloping down.
.
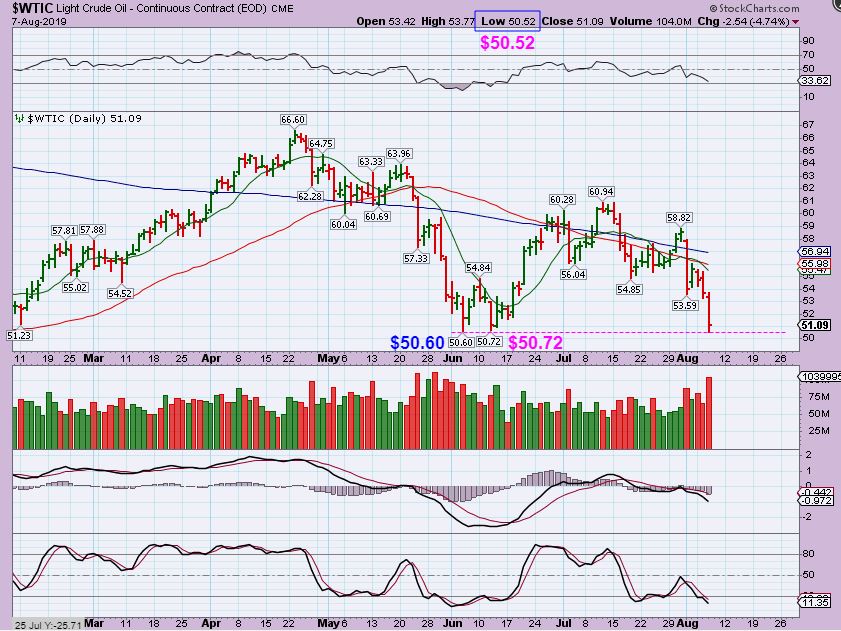
WTIC – WOW, another big drop of almost 5% on the Wednesdays Oil inventory report. This also broke the June lows slightly, which is a warning sign that even if this bounces, it is failing as a failed daily cycle and should drop even further.
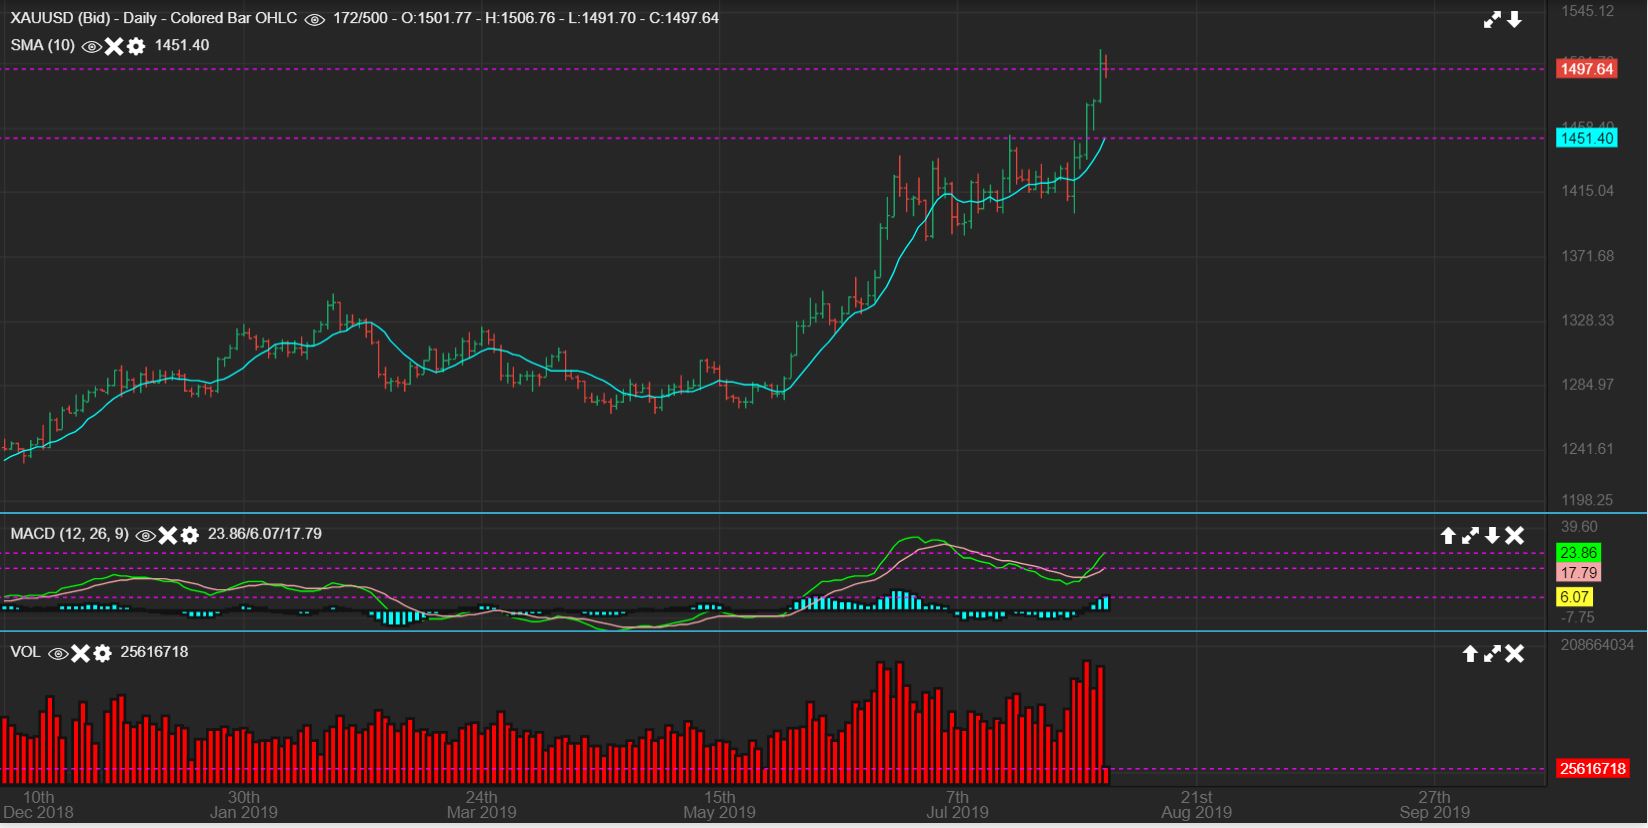
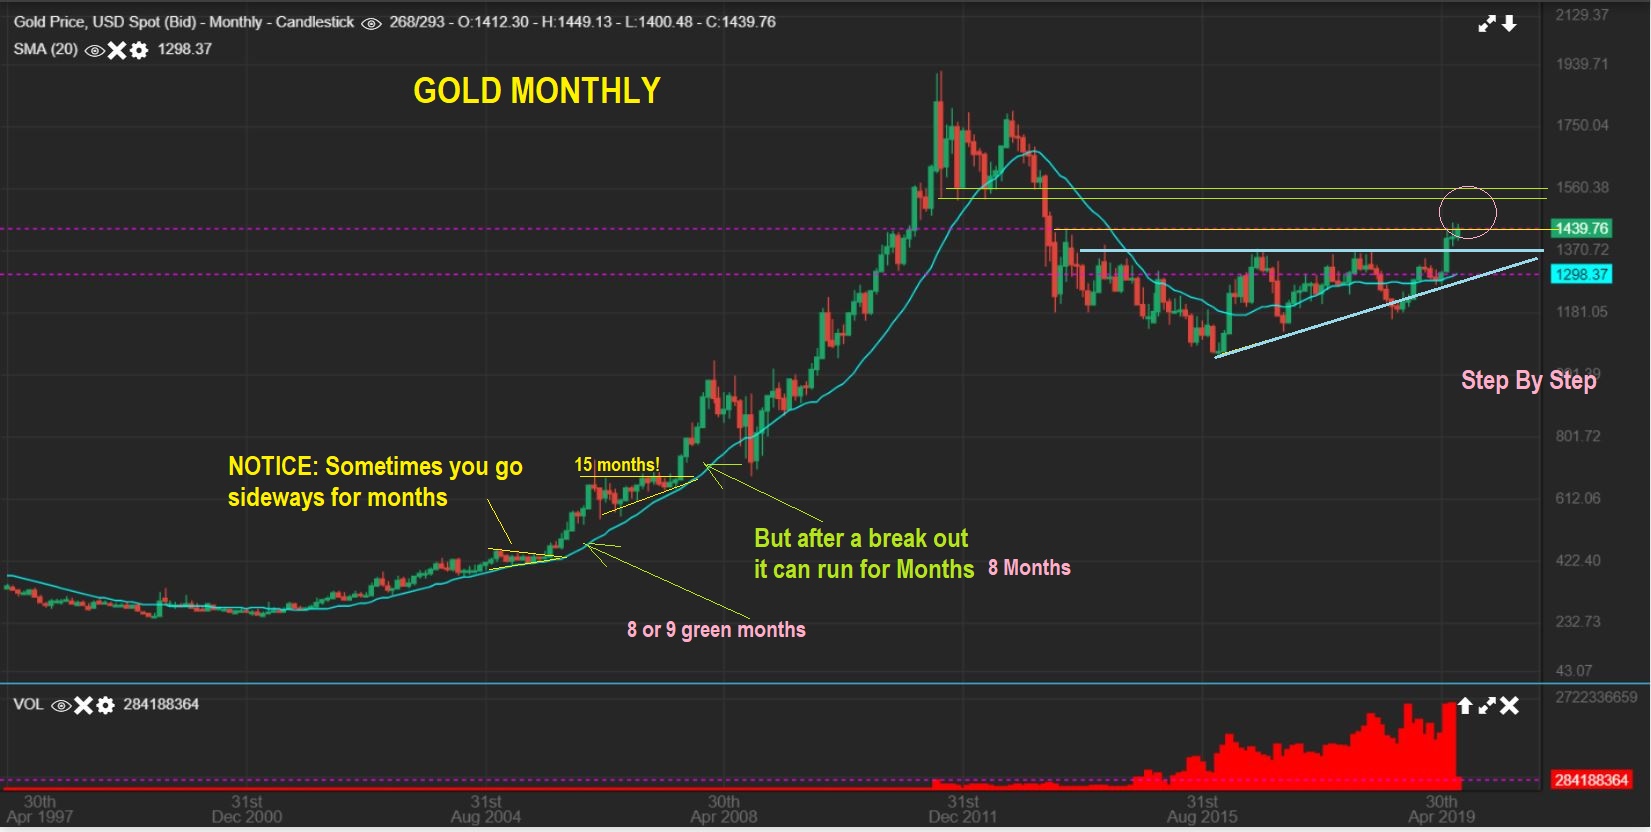
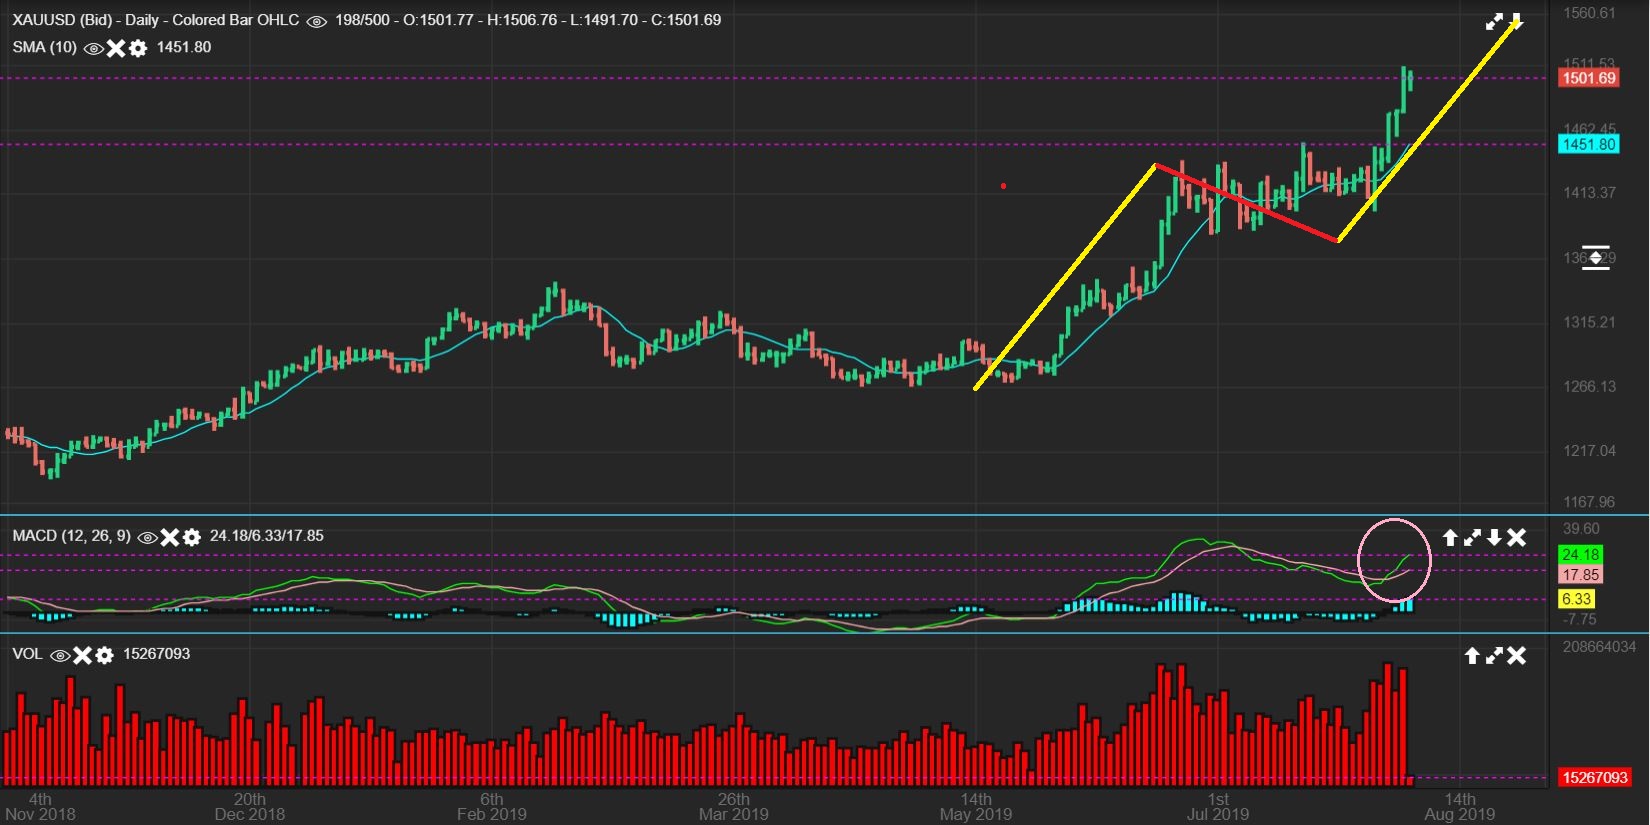
GOLD FROM THE WEEKEND REPORT – Resistance comes in around $1500-$1550. I’ve been expecting Gold to run to $1550, but…
.
GOLD – Gold did move above $1500 Wednesday, so the first target is met and Gold is at a resistance area. It closed near the highs, but Miners sold off into the close. This wants higher price over time though, in my opinion, it looks very bullish. The YELLOW LINES are a measured over to $1550+.
.
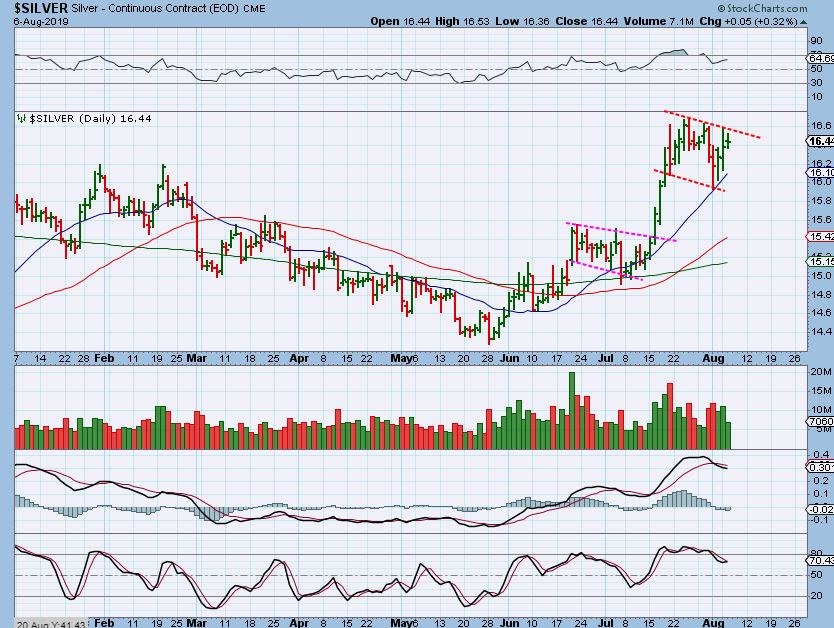
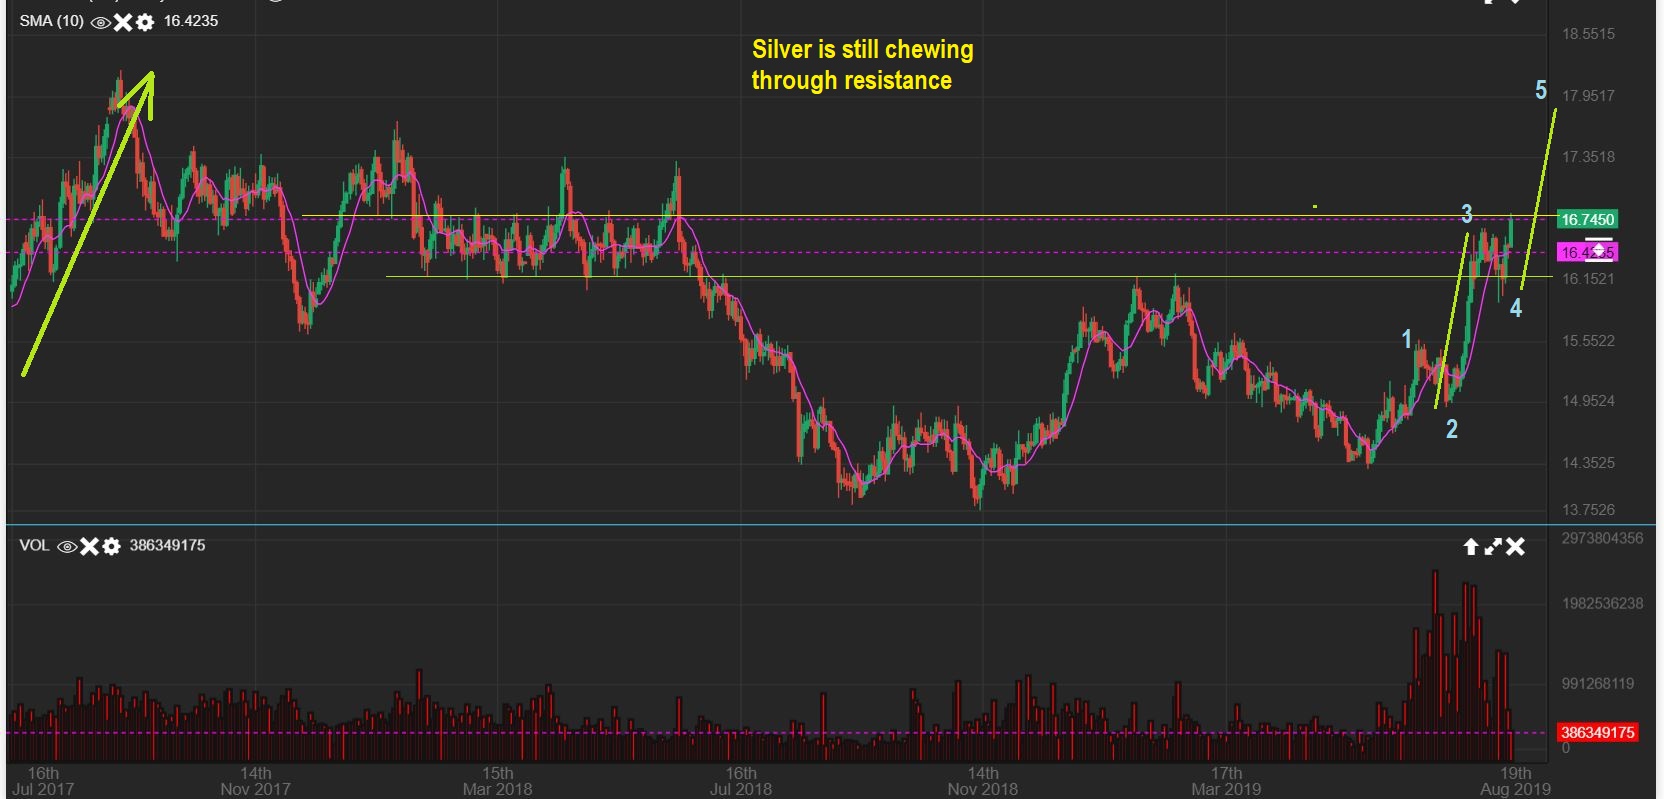
FROM YESTERDAYS REPORT : The 2 charts below were in yesterdays report. “Silver could attack $17 quickly”
SILVER – This is a bullish set up. A break above the red line can cause a fast move to $17+, similar to the break of the Magenta Line.
.
I then added as I wrote the report late at night:
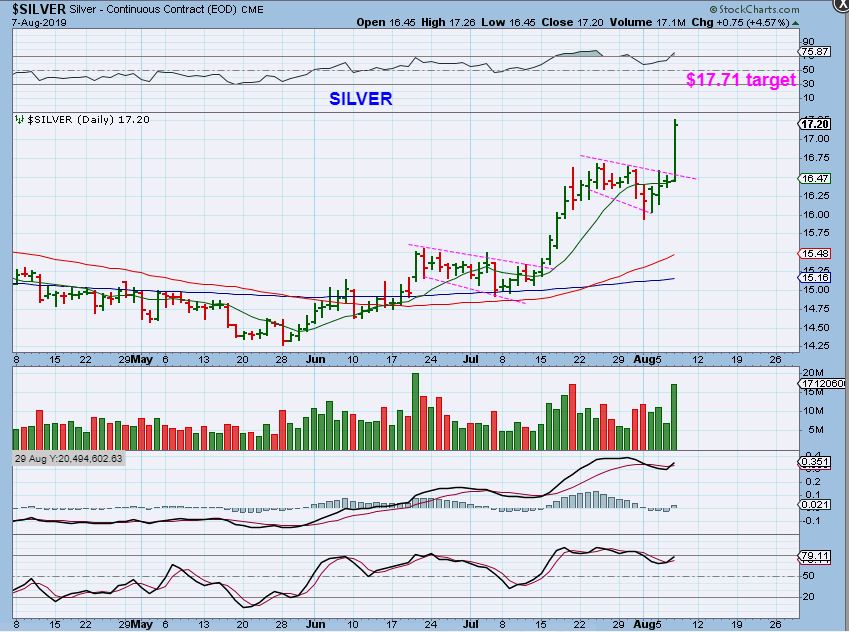
SILVER EDIT AT ROUGHLY 11 P.M. EASTERN TIME: SILVER BROKE OUT OVERNIGHT AND HAS WORKED THROUGH THAT RESISTANCE THAT I’VE BEEN POINTING OUT. A RUN TO $17+ CAN HAPPEN QUICKLY.
.
SILVER – Silver ran past $17, and yes, it was very quickly. Silver closed near the highs, but Miners did not.
.
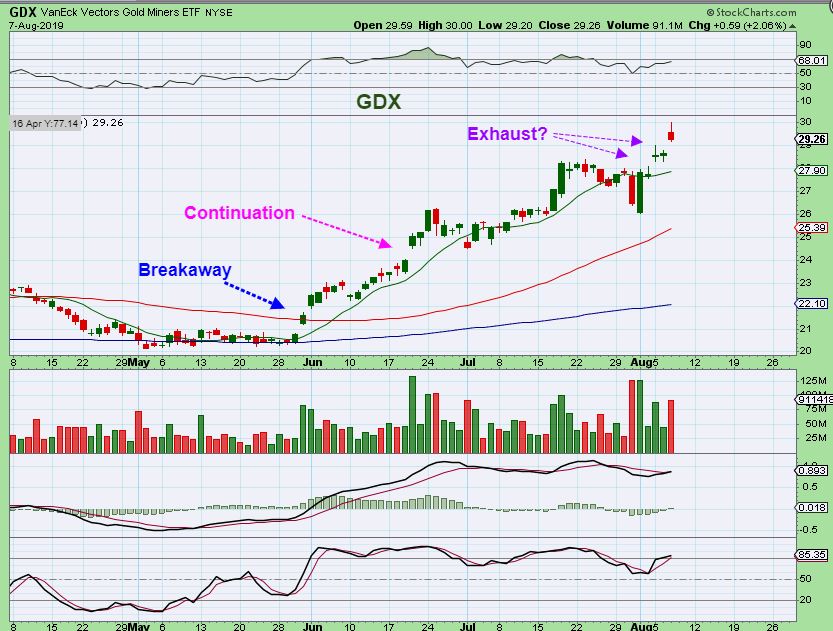
GDX – This does look like a reversal candle, and we did see selling with GOLD & SILVER still at their highs. Is that an exhaustion Gap type of formation? Maybe.
.
GDX – If you are holding GDX, GDXJ, or various Miners, I mentioned that I usually cut my leverage when I see an exhaustion gap, so I did cut it in 1/2 . As for my basket of Miners? For some, they may want to ride this out, and see if it is mild as a dip. Others like to sell partial positions ( You have 10,000 shares of XYZ, you sell 5000 XYZ & let some ride), etc . When we near a top though, it can get volatile and pull back, so your account balance will vary. 🙂 SOme people do not like that, and do not like to ride positions, but I still recommend holding some Miners. Holding leverage on a drop from here may be very uncomfortable, but let me show you something…
.
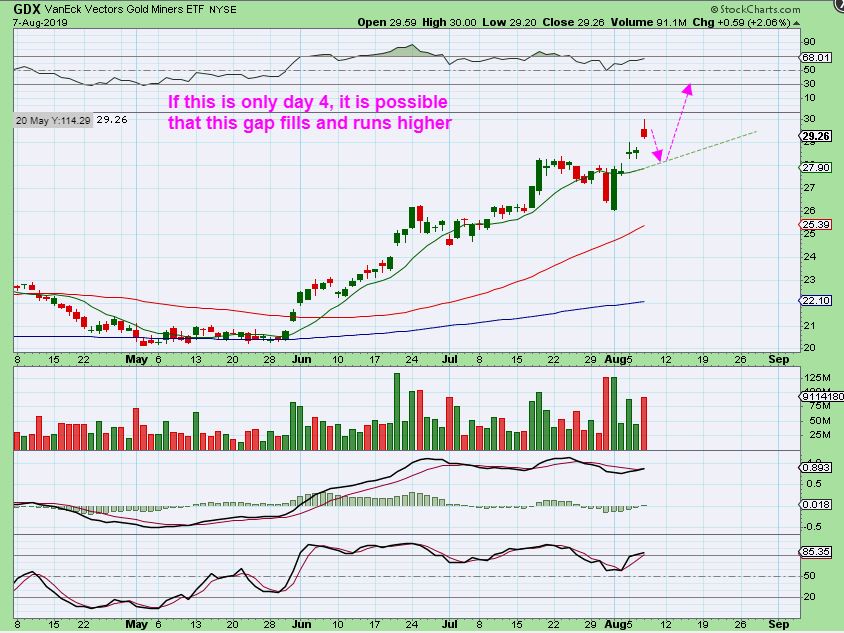
Is this day 4 of a new daily cycle? It is hard to tell. I was thinking that the FED DIP was a dcl, but honestly that doesn’t matter a lot right now. Why? Because if this was going to form as a 3rd Left Translated Daily Cycle, it could still peak any day now. A L.T. Daily can peak on day 4, day 7, day 11- so it could peak , it may not. Let me show you…
.
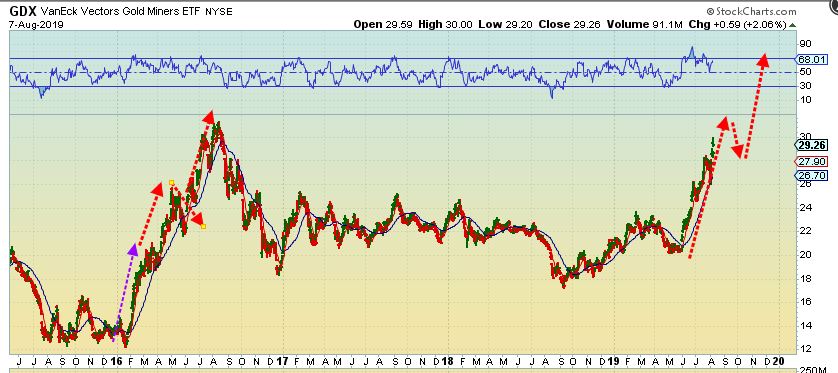
GDX – This Could drop to the 10sma and then bounce to a new high as shown too, if the run is not done. GDX reached $30 and that could be all we get until this pulls back & recharges, or this could bounce to $31 & higher. How you play that is up to you, but I still recommend holding a small basket at least…
.
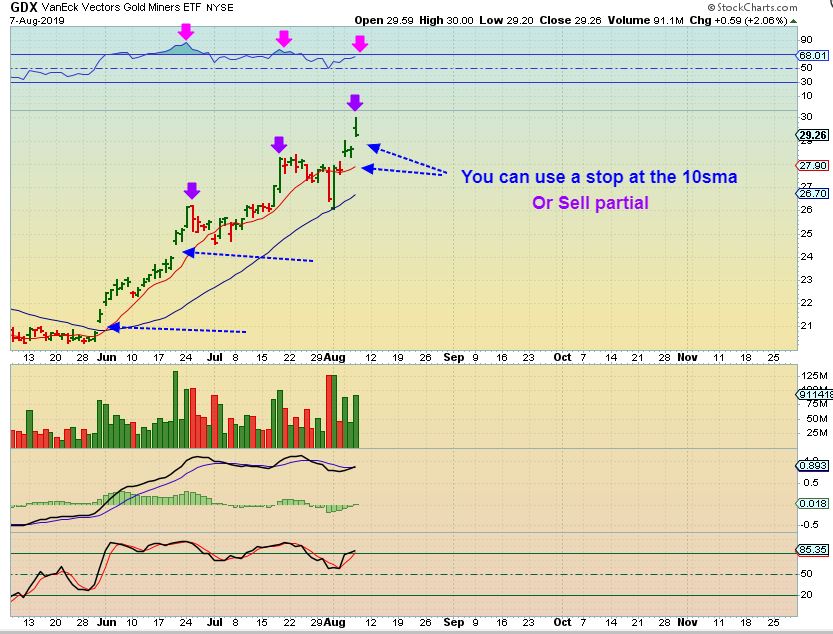
GDX – Someone might have even sold all of their leverage yesterday, and they buy some again at the 10 sma if Price reverses for a short trade ( a daytrade? a 3 day trade? 5 day,etc depending on how it looks going forward), but I wont recommend that- you must decide if it looks like what I have drawn below is happening. MOST will probably play it safe with no leverage until the next ICL.
.
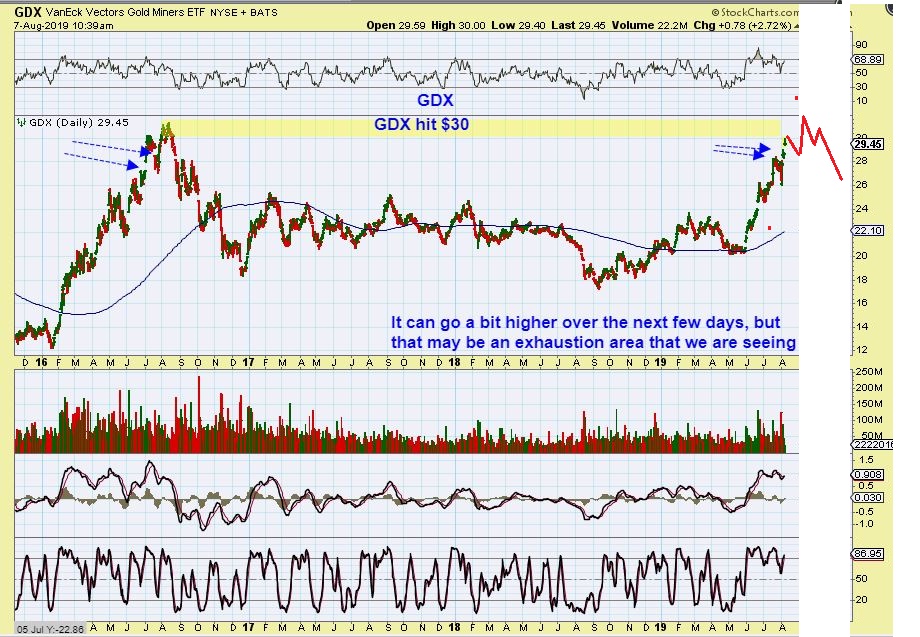
GDX – do you see how GDX topped in 2016? A gappy run higher (blue arrows) like we have now, a 2 day pull back, and a final surge to $31ish. That can happen here too, we can get one more push higher as drawn, but we just don’t know at this point. We also can get 1 more daily cycle low that rallies pretty good and go to new highs of GDX $36. My advice is to always Use stops or maybe even sell a partial on your leverage, etc.
.
So as a visual, I am talking about this. I do NOT think that this run is done, just that we may be finished until we get a bit of a bigger dip , as shown. I expect Much higher price over time, as I have shown in the Bigger Big Picture view. That is why you can ride a basket of Miners ( surprises to the upside), but leverage is another story.
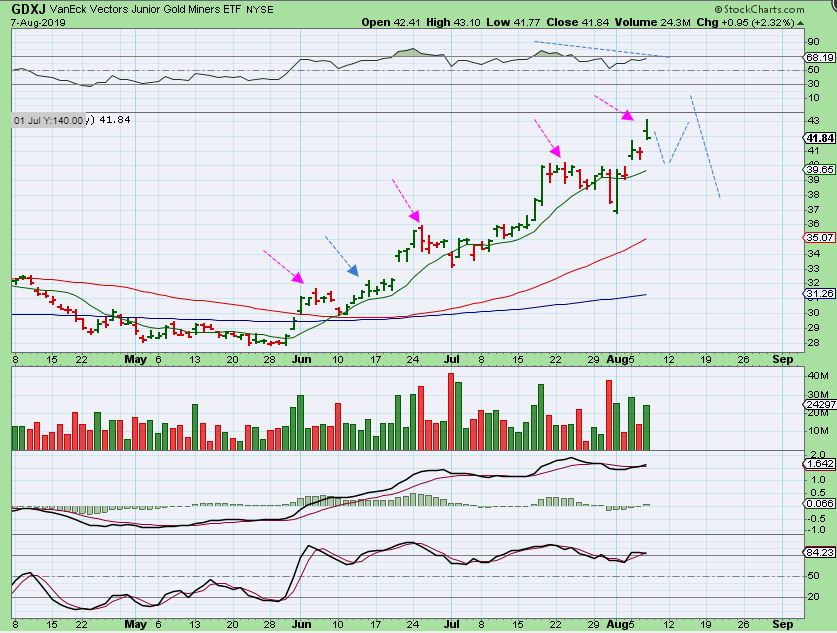
GDXJ – So GDXJ is very similar, with a reversal in Price at the highs Wednesday, while GOLD & SILVER were at the highs. I am pointing to other reversal candles that look similar, and notice that Only the blue one continued higher. It got choppy at those reversal candles.
.
GDXJ- Notice that the run for GDX & GDXJ does not look all that steep, so it does look like it can just dip to the 10sma & continue higher. That may happen, however…
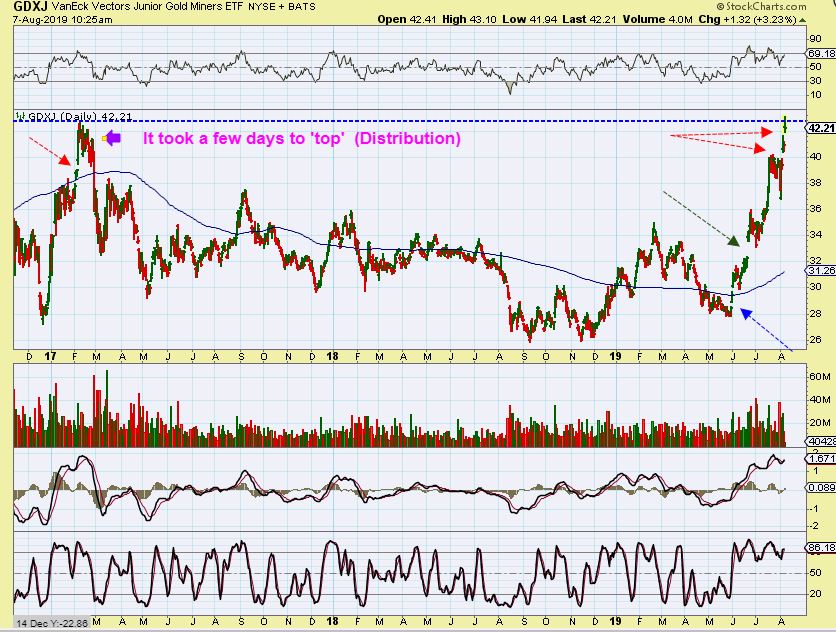
GDXJ Big Picture – It does look very steep when I step back in this chart & compare it with 2016 in the picture. Notice that price can get choppy at Daily Cycle lows and the top too. We saw that in 2016, we actually see that chop in this run. We now have 2 gaps at the top here, so it should be a time that Leverage is managed differently. Caution.
.
HUI BULL RUN – And then there is this reminder. 3 months after the ICL in Nov 2001, there was a pause, but the Big Picture run was far from over. I LOVE THIS CHART & HOPE WE SEE THIS. This Peaked 6 months from the ICL, see the chart. If we do that now, we wouldn’t peak until November, so that means that you should hold at least a small basket of Miners just in case we do see surprises to the upside in this sector. Leverage during that sideways chop would have been uncomfortable for many.
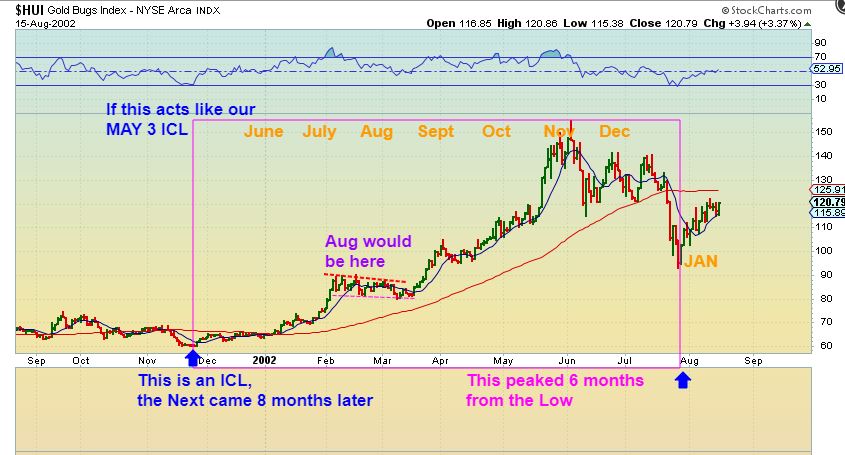
If we do this kind of a run now, we’d peak in November. So that means that you probably want to avoid just selling everything, and continue to at least hold a small basket of Miners. Bull markets often have surprises to the upside in this sector.
.
What time is it? Well, when it comes to the precious metals sector, it depends on a few things. Are you talking about Leverage? It may be safer to sell leverage (All or partial, the choice is yours) and lock in gains. Are you talking about short term or longer term plays? Some Miners are now ‘Buy & Hold” if you don’t mind the choppiness, because we should see higher prices over time.
‘Extended Miners’ can be cut & re-bought on a dip, but surprises to the upside could also cause one to lose position. Let me show you this…
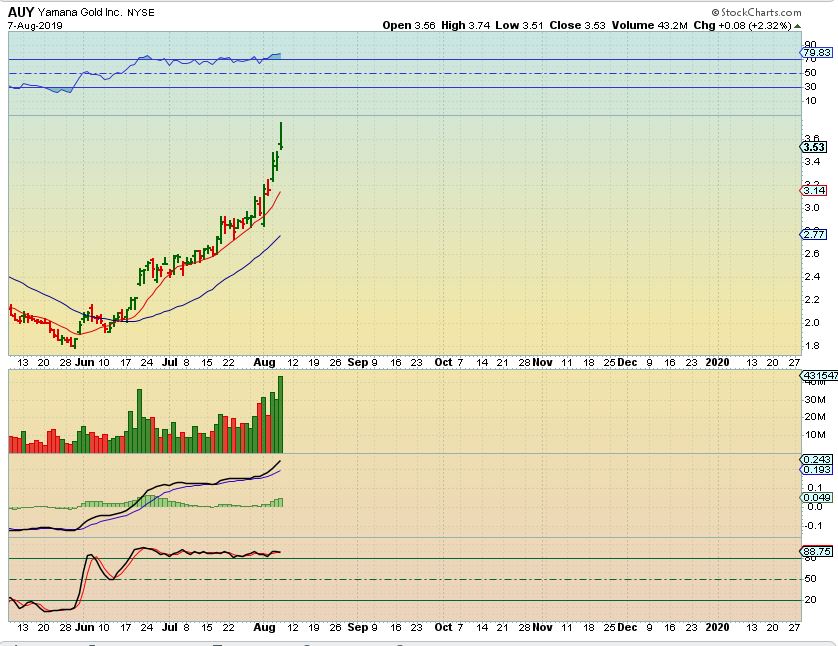
AUY – This looks straight up & extended. Selling and re-entering could work out for AUY, DRD, NG, RGLD, and other straight up runners, and that is a reversal candle. Odds are good that this will pull back, but …
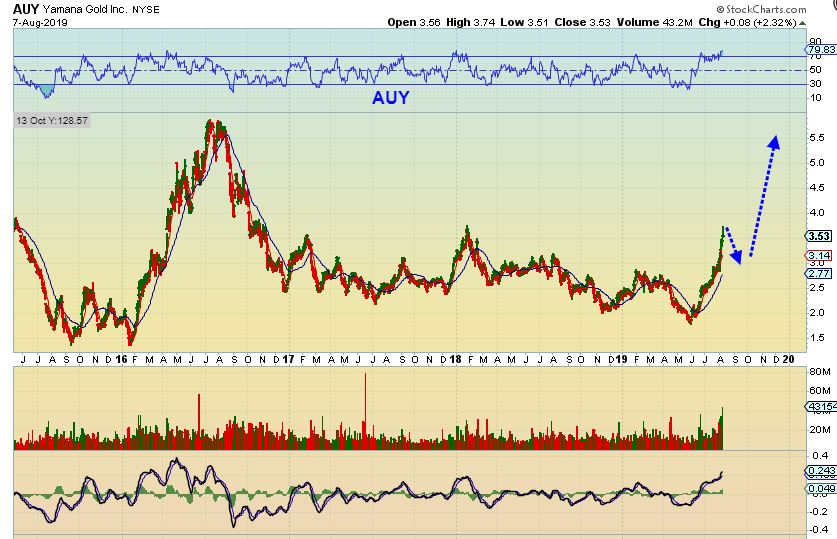
AUY – I do not think that the run in Miners is completely over. We may be near a temporary top, but this is a bull market now and I see AUY like this. It doesn’t look AS EXTENDED this way, so a pull back can be bought ( Buy the dip).
.
.
We are at some of my original price targets, GDX hit $28 & $30 now, $Gold is at $1500, though I expected $1550 too . In a bull market, these runs can do a brief dip or chop sideways, and run again. Targets can extend. Surprises are upside surprises. So while we may be due for a dip, choppiness, and less of a straight up run, I would not completely sell out. This Bull may just be starting a multiyear run!
.
Enjoy your Thursday trading!
.
~ALEX
.
This is GOLD LIVE 7 A.M. Eastern Time– Honestly, when I see a chart with a beautiful 4 or 5 week sideways consolidation, the run out of that move does NOT Look to be finished here. That last candle is red, but this can just push higher and dips may be shallow, even very shallow. Gold & Silver both look like they still want higher prices.