
Tuesday August 6th –
There were many smiling faces on Monday when Gold, Silver, and the Miners took off again ( maybe only until they looked at their IRA, though). On Monday, the SPX, DOW, and NASDAQ took a dive. The DOW was down almost 1000 points at one point, The NASDAQ was almost down 350 at one point, and the 50 sma, which I though might at least hold as a short term support, was sliced through rather easily.
.
The first 2 charts below are from this past weekends report, highlighting internal weakness, and then we’ll cover the markets with a special section about the Miners.
.
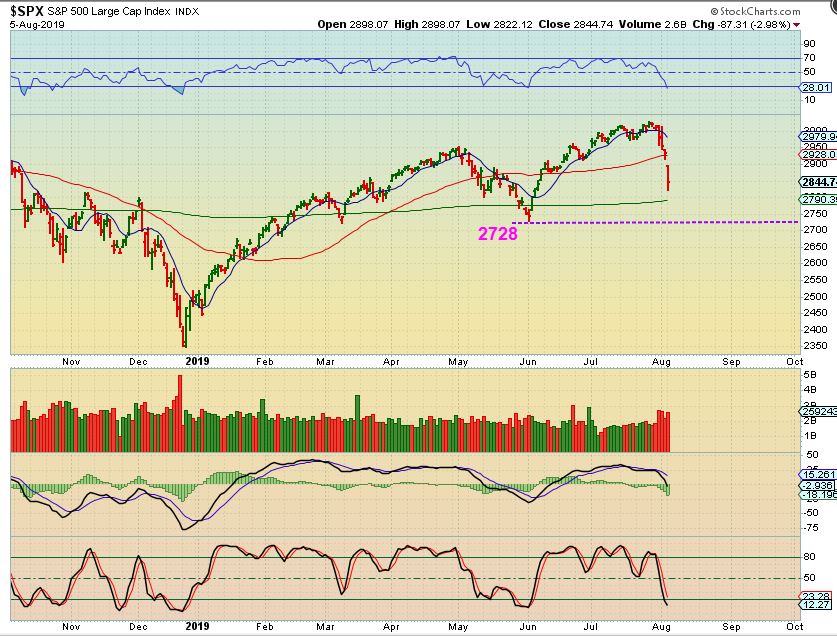
SPX WEEKLY – This chart is a sign of weakness at the top. The Markets dropped Post Fed and remained near the lows Friday, the Miners recovered. This may be the start of the big picture trend going forward for the end of 2019. Markets lower / Miners higher.

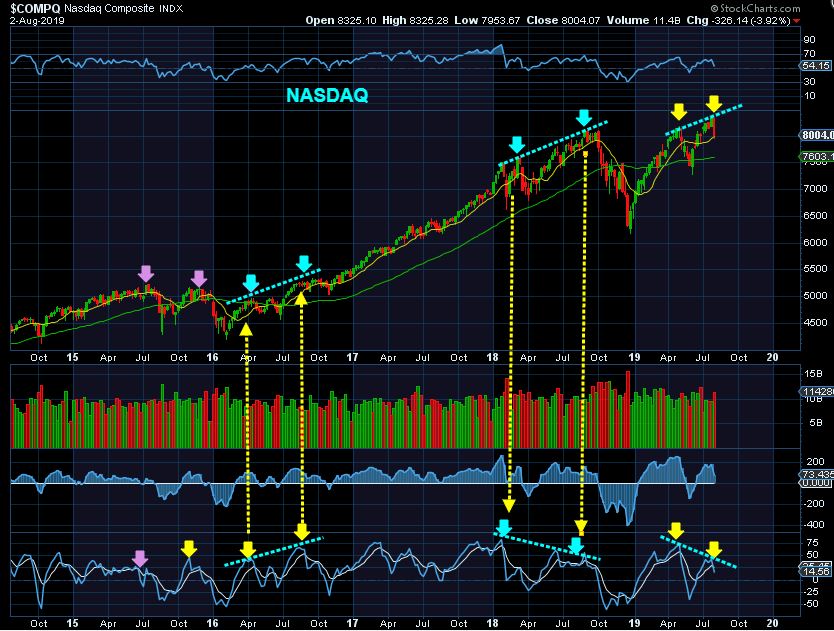
NASDAQ WEEKLY – The NASDAQ has the same weakness showing up now.
SPX – That is a big drop on Monday. If 2728 is broken , this cycle will see some real downside over time. At this point, there is no trade to offer unless you are a short term day-trader and you play the bounce that should happen sooner or later. We should bounce soon, and …
.
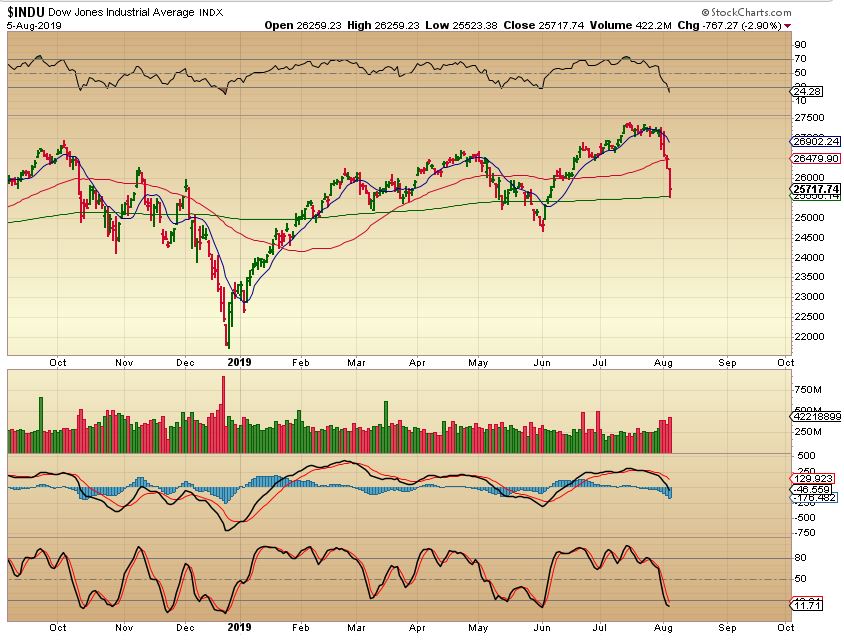
DJIA – The DOW stopped & bounced right at the 200sma, but will it hold? This could offer a ‘scalp type trade’ for the day trader. Buying a reversal gives you low risk with a tight stop. For now, all I am personally doing is watching this play out, because a bounce may just lead to a break down later. Compare this drop with the one in October that started the bigger sell off. It bounced at the 200sma, but not for long.
.
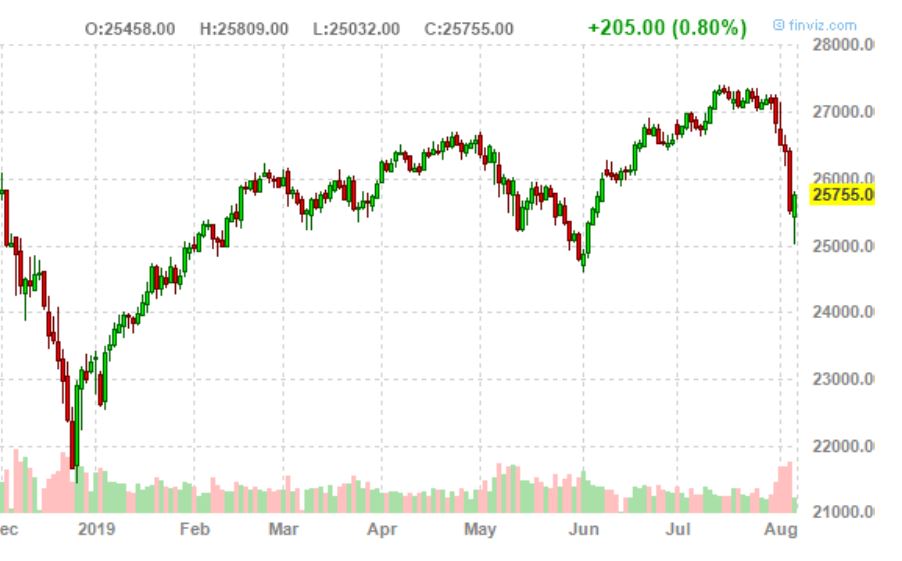
Pre-Market DJIA: DJIA looks like that reversal / bounce is taking place in Pre-Market.
.
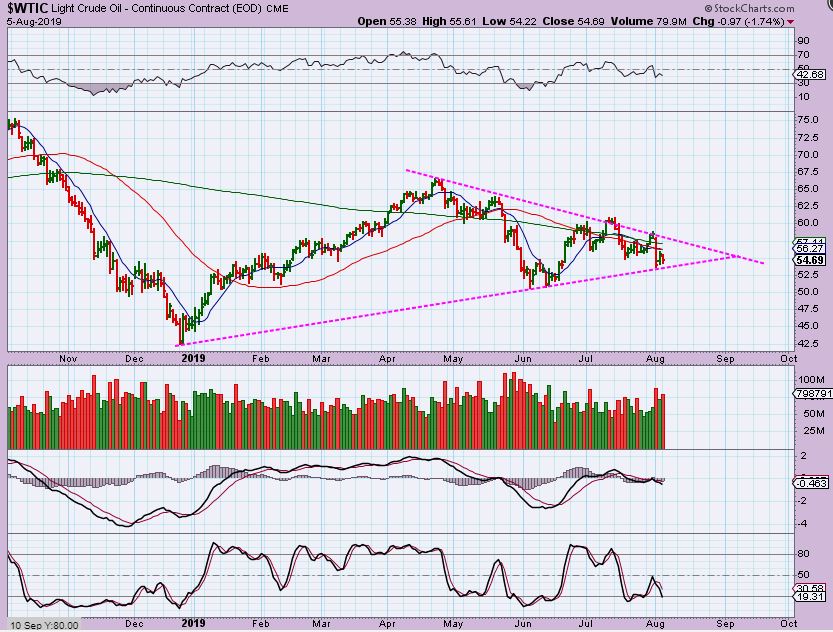
WTIC – Oil didn’t follow the Market Crash and so far has put in a higher low.
.
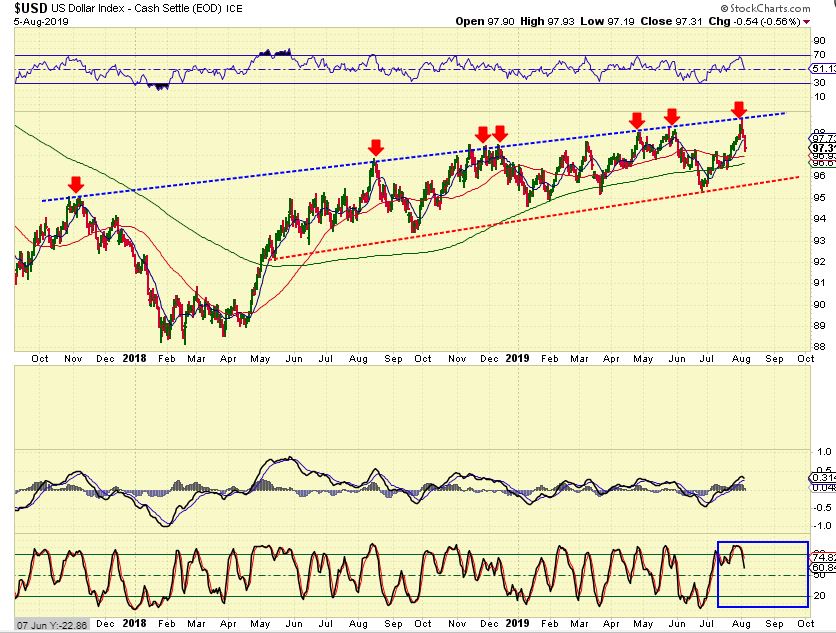
USD – The USD tagged the upper trend line & rolled over. This is helping Gold, and it DOES look like the USD can drop further, even though short term support at the 50 & 200sma is close by.
.
PRECIOUS METALS
.
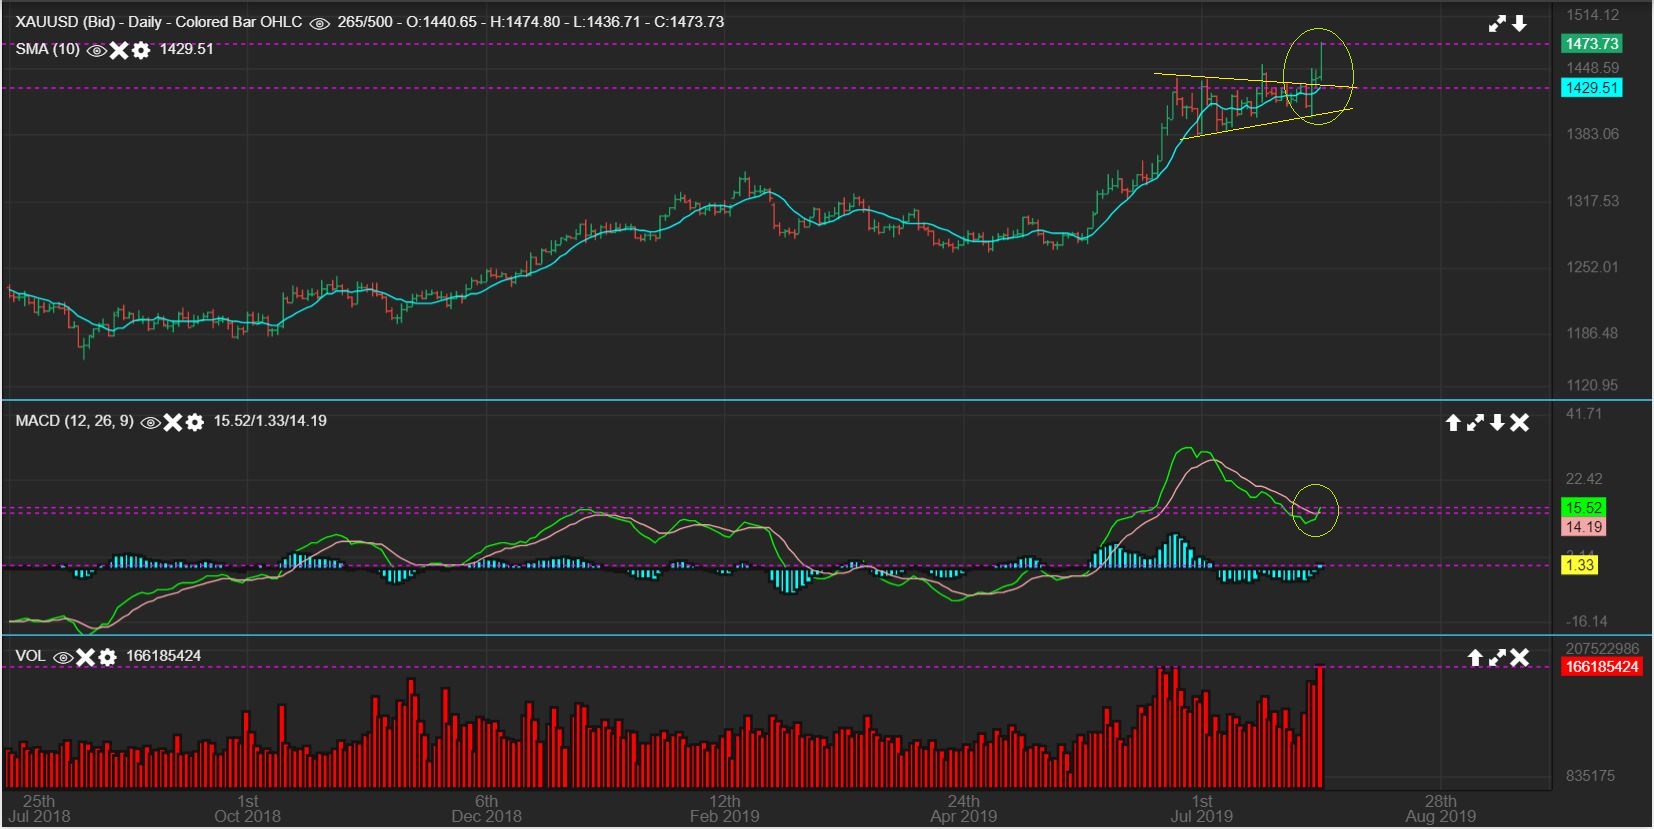
GOLD – Gold broke out, the MACD crossed up, and this looks very good. After a nice 3-4 week consolidation, we could get a nice run higher this week.
.
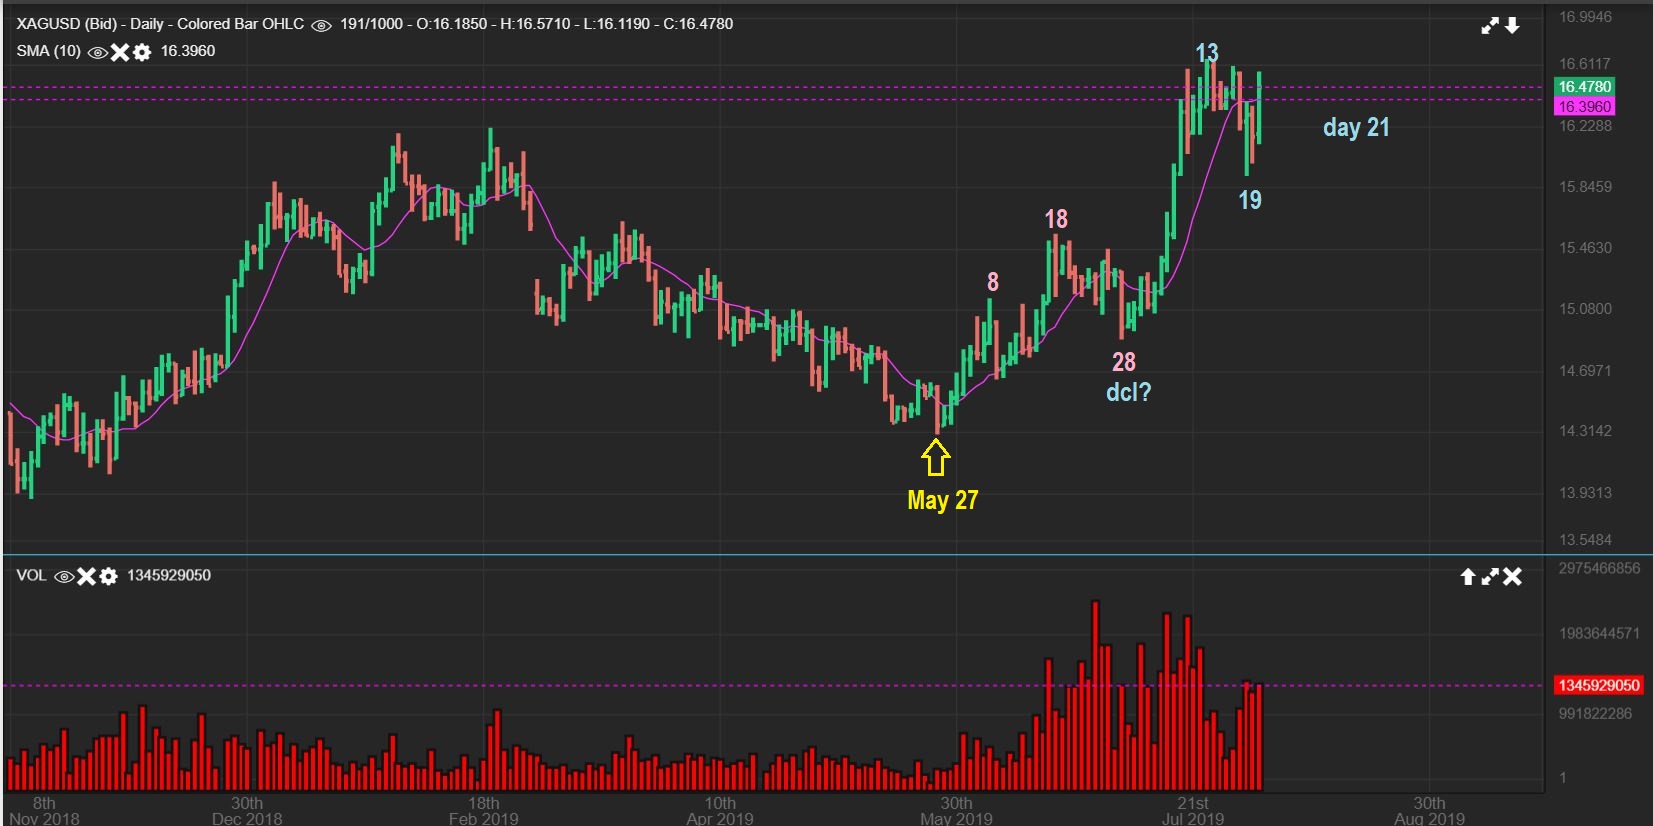
SILVER – Silvers cycle count seems to be clear, since it clearly Bottomed at the end of May. It is worth noting that it doesn’t match Gold, which bottomed in Early May, so I just keep that in the back of my mind.
.
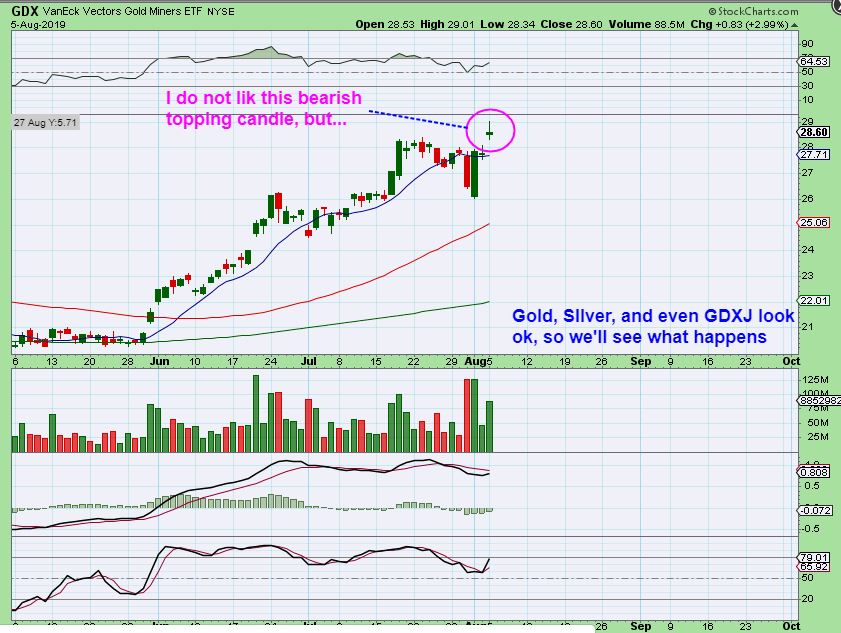
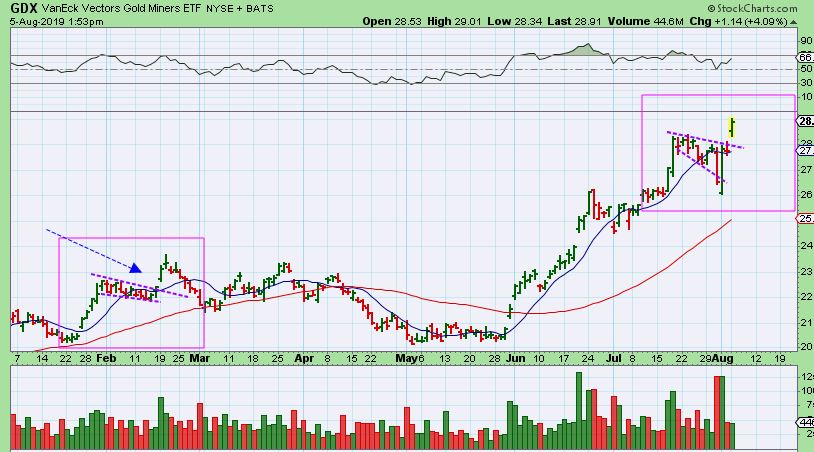
GDX – I don’t LOVE this candle, it is often a topping candle, but since GOLD & SILVER do not look over extended, I am ignoring this. I would think that if Gold & Silver run higher, GDX will likely follow. A Doji in midair is not a pretty sight to me though. The good news would be that this may actually be day 2 of a new daily cycle after that deep drop & reversal.
.
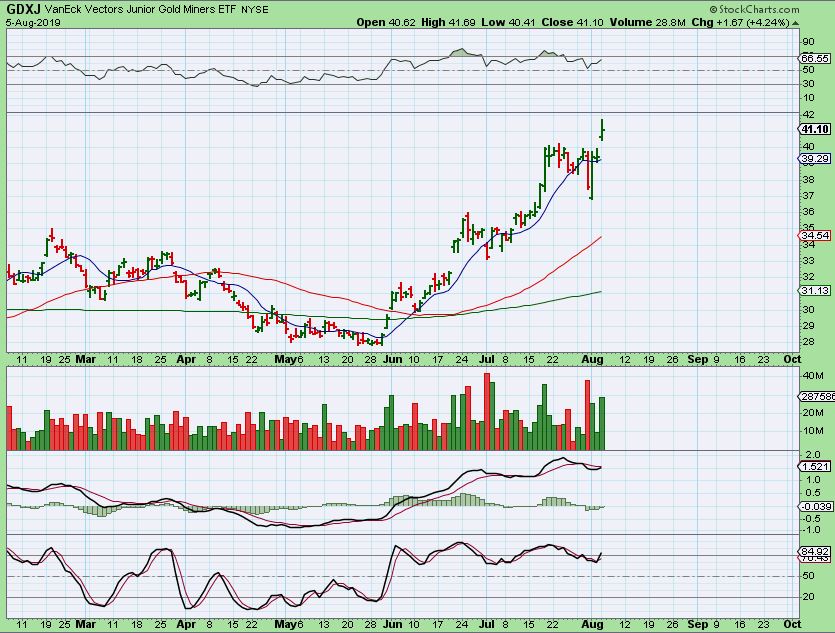
GDXJ – The GDXJ Candle is a little better looking. I’ve been asked, “Is this the exhaustion candle that you’ve been looking for?“. I have to say that it actually COULD BE, but I’m doubting it a bit, mostly because many Miners still look like they want to go higher. Gold also looks set up to run higher. NOTE: IF THIS GAPS DOWN (WELL BELOW THIS CANDLE) TUESDAY, THAT IS USUALLY CONSIDERED A SELL SIGNAL.
.
I’ll explain more about an exhaustion gap at the end of the report too. For now, I would raise stops on Leverage to the 10sma under that Gap, or in the gap.
.
.
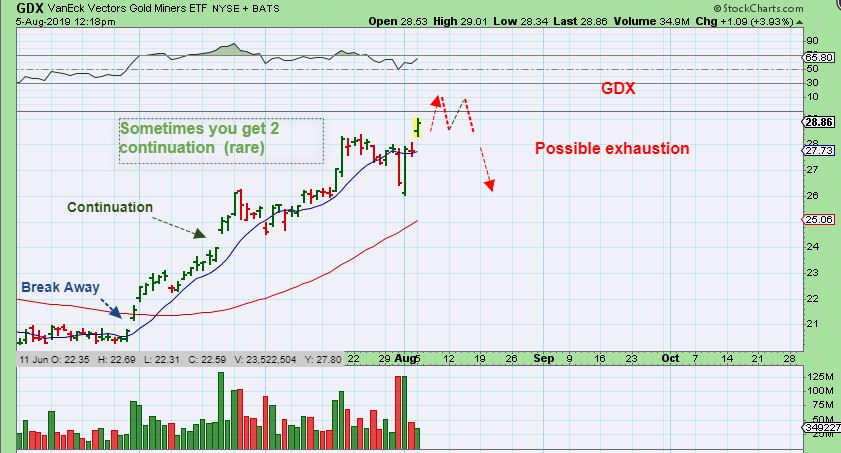
GDX – If this is an exhaustion gap, it may drop quickly or it may just trade here for a day or a few days, struggle to gain ground, but then begin a dip toward a Daily Cycle low. However, this also may be day 2 of a new daily cycle.
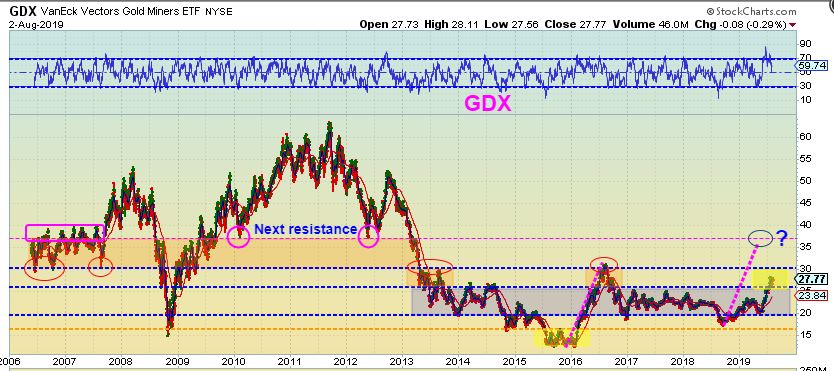
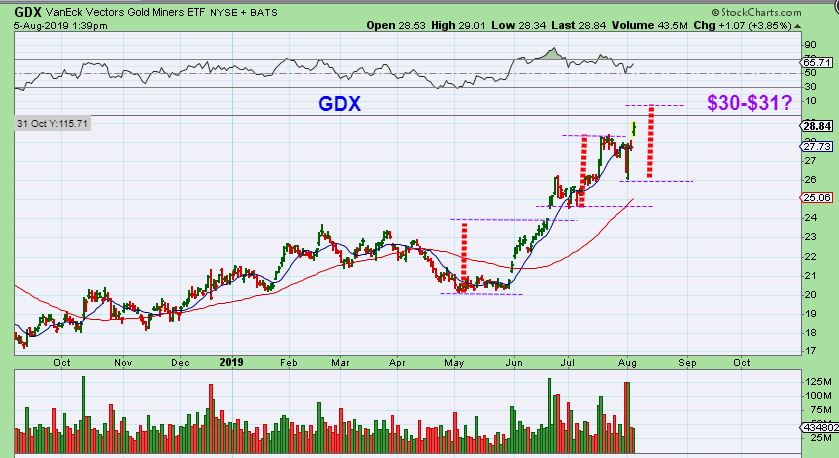
GDX – I had this for the weekend report and forgot to include it. Basically, we have some resistance at the $30 area, and I expected that as our next target. After that (maybe after a dcl) we see above that the $36-7 area as resistance.
.
Monday was a great day for those holding Precious Metals, and there is a chance that Gold & Silver will continue higher with a drop in the USD. That should mean that Miners can continue higher too. As for the General Markets? It doesn’t look very good right now. We’ll see what happens after a bounce.
.
Let’s see what Tuesday brings our way, and I do have more to discuss below. Happy Trading!
.
~ALEX
.
I just want to discuss the ‘Exhaustion Gap’ that I had mentioned in past reports. I said that it usually signals that buyers are “all in” and then the profit taking can begin, so that is when I cut leverage. There is no guarantee that we’ll see an exhaustion gap, but it’s good to look at a few examples so that we can be ready if one does arise.
.’
The Gaps – So this is another chart that I have prepared to show you how this run can end. Once you get to the exhaustion gap, it can still trade for a few days at the top, but when price does not continue higher after a strong gap? It may be a sign that the buying needed to push it even higher is drying up.
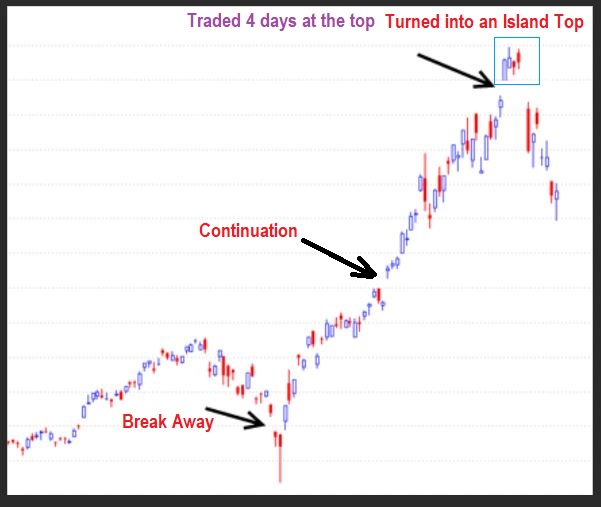
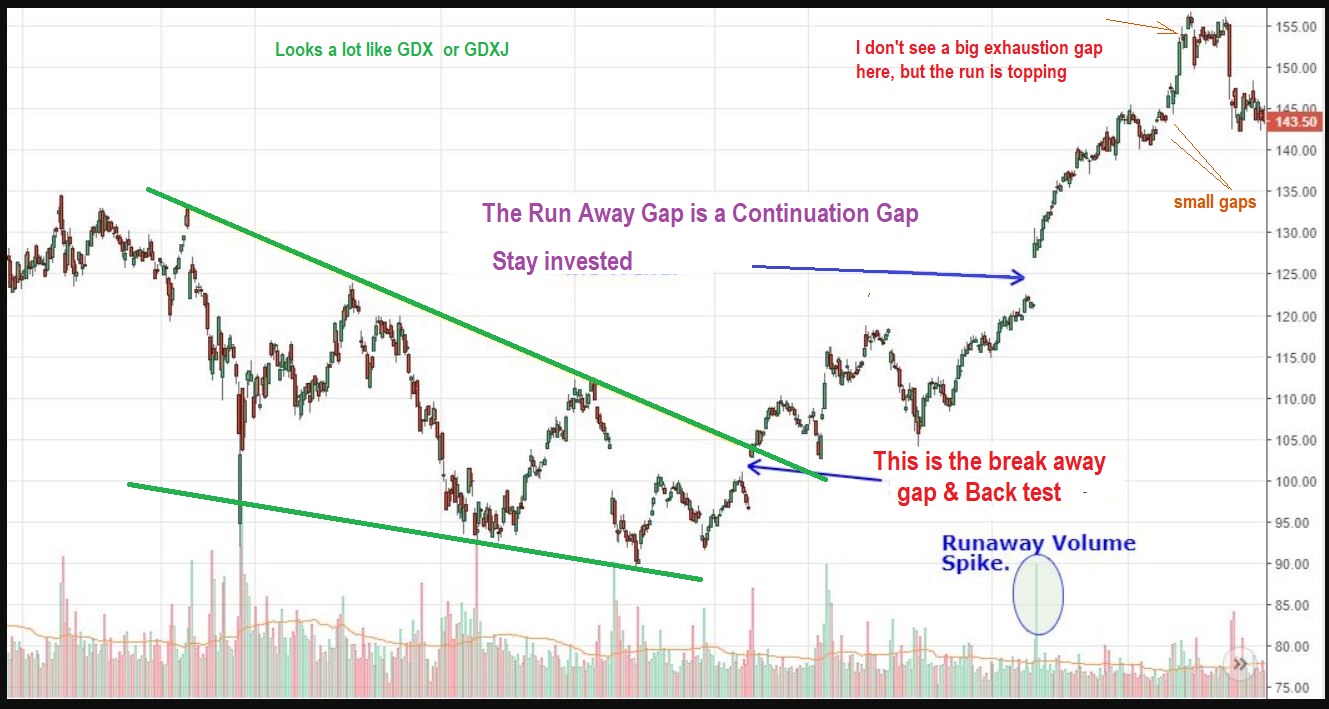
The Run – On this stock, it is very similar to Gold or Miners breaking from the large green wedge. Notice the continuation or runaway gap. After some follow through, it paused, consolidated, and then I wrote “Small Gaps”. Those small gaps are not exhaustion, and THAT could be what we have right now. That would mean that we can still move higher from here.
.
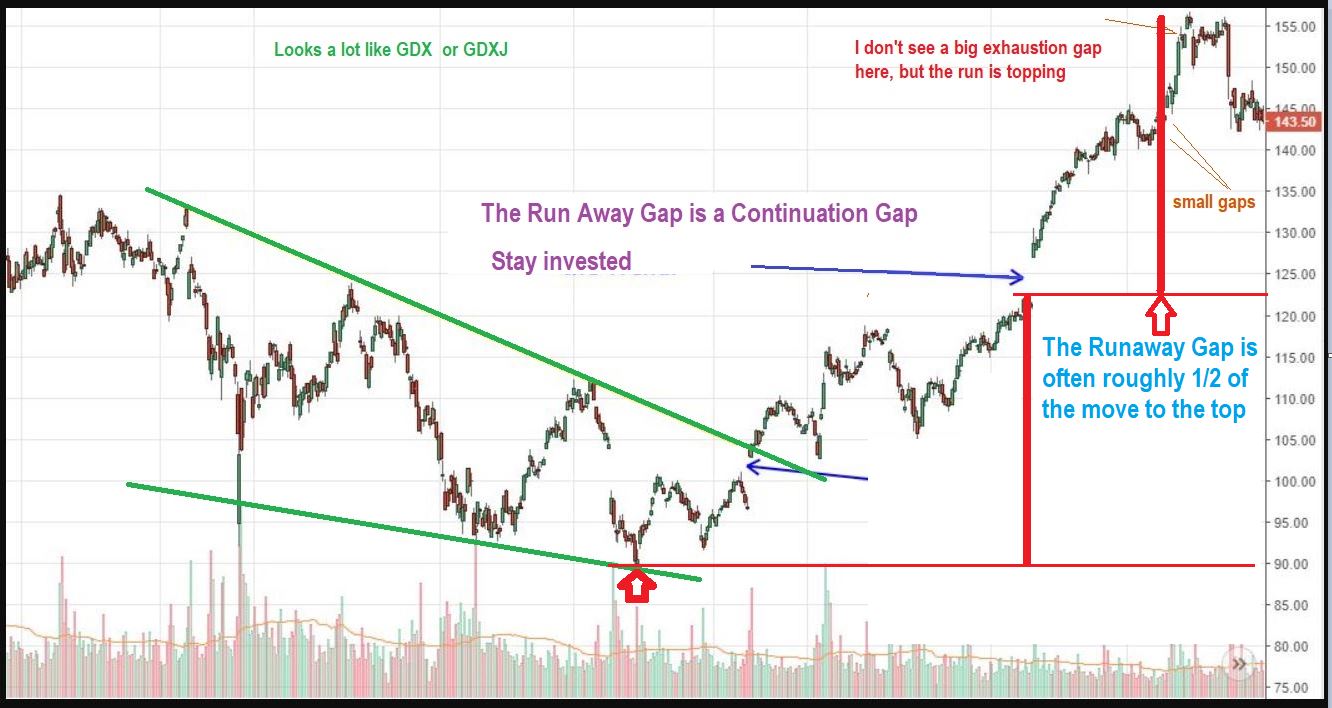
Often the runaway gap is a 1/2 way point. On GDX, that 1/2 way point was roughly $28, but they can extend higher and we did move higher than $28 Monday.
.
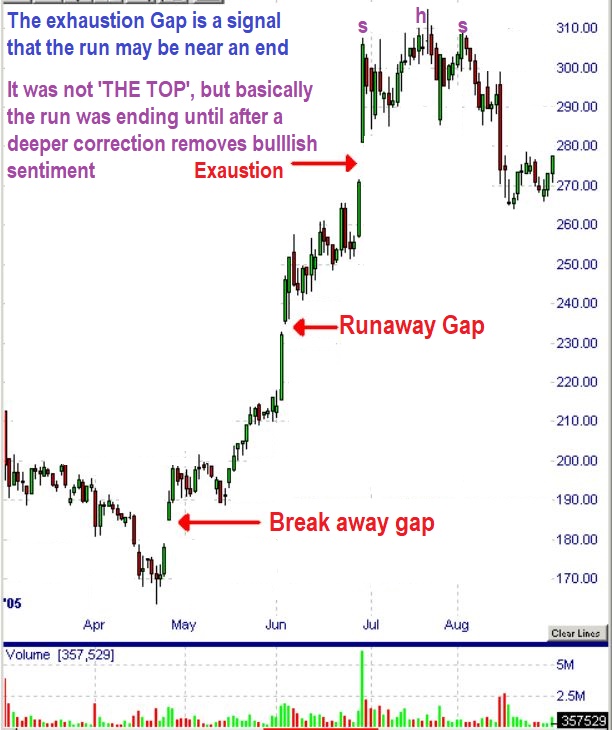
This is another example of an actual Exhaustion gap – This one is obvious, and a trader can then lock in profits and move on after this large 3rd Gap. The stock will then top immediately, top 2 or 3 days later, or even put in a choppy top as seen here. Please read the chart.
GDX – So again, we had a gap open Monday, can this be an exhaustion gap? It could act like one. They look very bullish, but look at the Feb top (which technically isn’t an exhaustion gap, but it looked bullish. ) It was just a Pop & drop. That looks bullish, but anything can happen and change things from Bullish to a pull back, so let’s just remain alert ( Stay Frosty).
GDX – If this was an exhaustion gap, it may just trade here for a day or 2, struggle to gain ground, and then begin a dip to a Daily Cycle low. If this is day 3 of a new daily cycle, they can top on day 5,8,11 and become Left Translated.
GDX – The measured move using the runaway gap has been fulfilled. Another leg of the same length gets us to the $30-$31 area, so we’ll just have to see if we have the buying power to continue pushing price higher.
People are starting to wonder about this run topping out. The ICL was back in May, are we at the top? With the HUI chart below, I want to point something out…
.
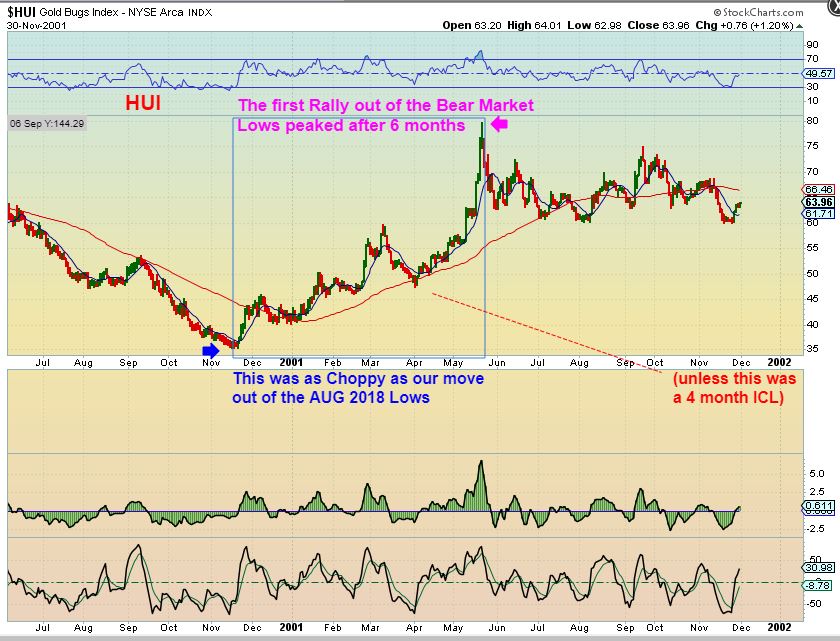
HUI BULL RUN – Look at the run in the Blue Box Nov 2000- May 2001 . That run was 6 months long from ICL to ‘Peak‘. Yes, a 6 month strong run to the peak. Our current ICL was in May, and we are only 2 months forward from the Silver & GDXJ lows, so we certainly may have more upside left, but there was choppiness here too. Next chart…
.
HUI same chart – This chart did have a deep drop on the 4th month . About that deep drop into April. That looked like an ICL on month 4, but it only tagged the 50sma, and then it shot straight up. My Point? Surprises to the upside in a bull Market, so I’d still hold on to a basket of Miners over time (maybe smaller at times, larger at ICLs).
.
Wednesday I am going to discuss that above chart a bit further along with 3 other charts related to it. I want to prepare us for the drops and the chop that can & does occur, even in a Bull Market Run.

