
Friday – How Will We Get There?
.
Nobody ever said it would be easy, so we just have to try to stay on the path that unfolds before us. Let’s review our markets…
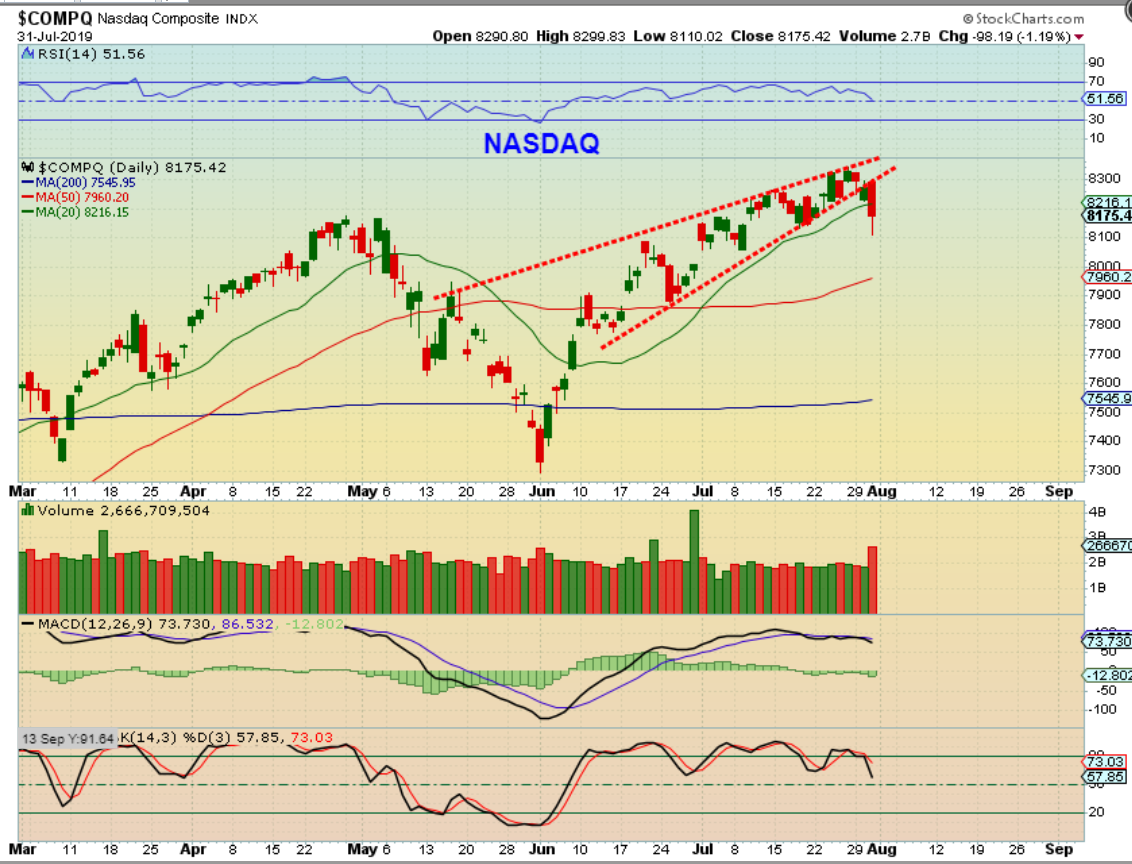
I’ve been showing this wedge in the NASDAQ for a while now, expecting a drop to a dcl.
.
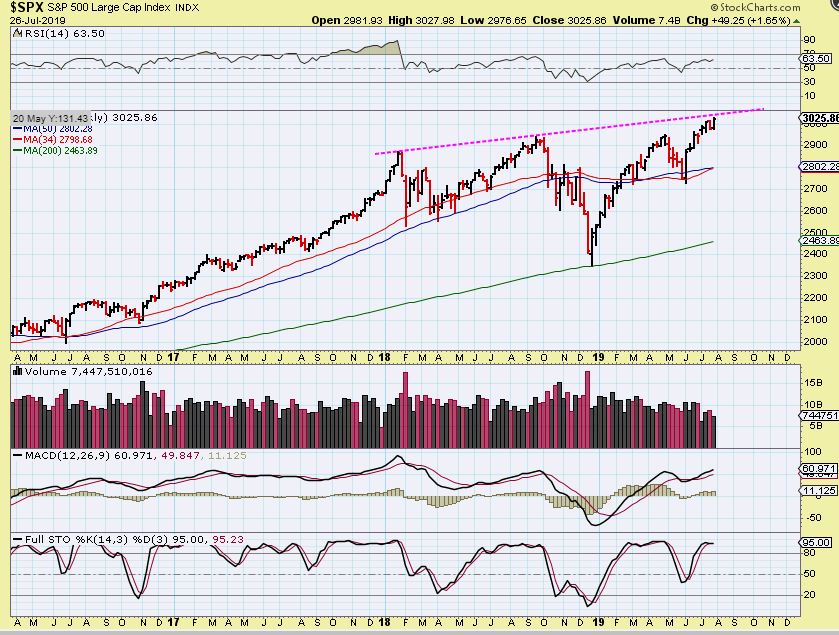
And the SPX as tagging an upper trend line here on June 26. I thought maybe a drop to the 50sma as a dcl.
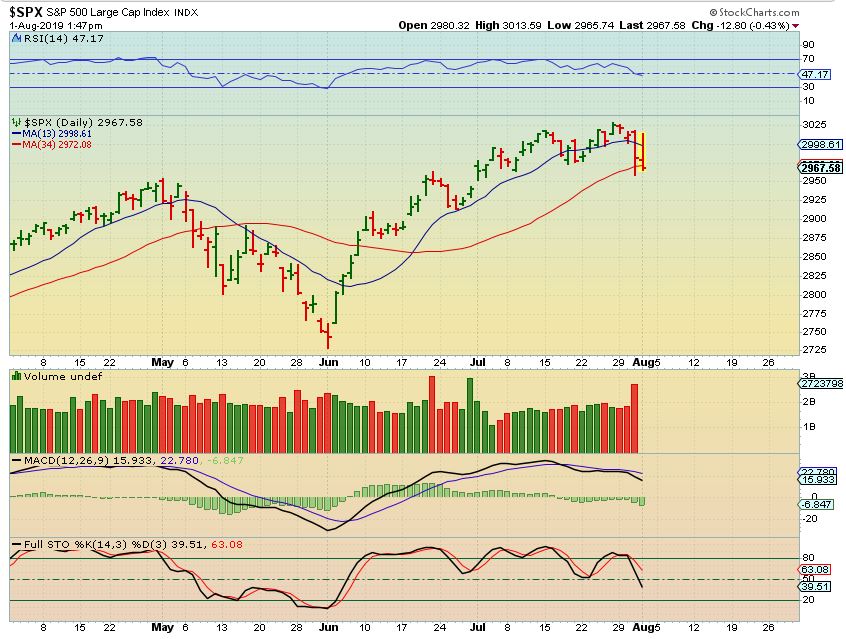
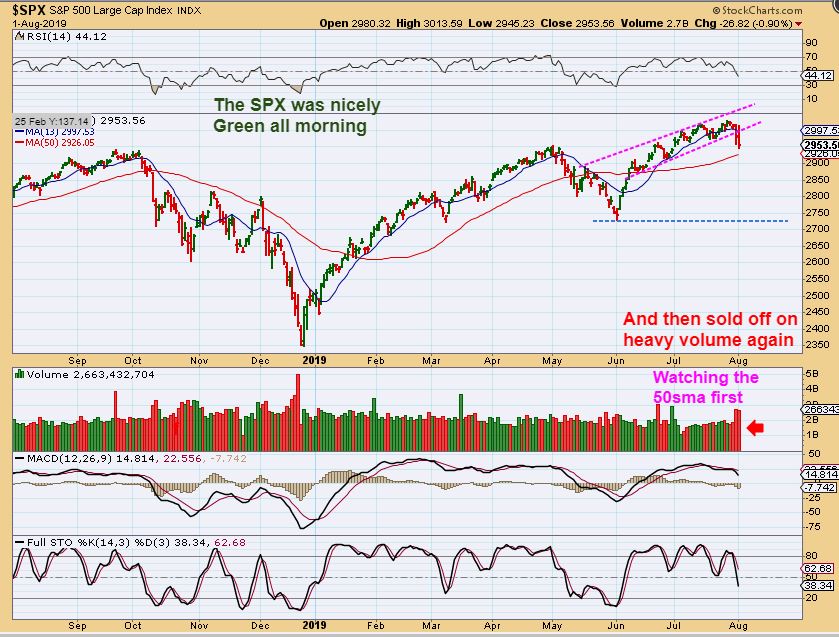
SPX – The General Markets were Green at the open and climbed nicely in the morning, but crashed down Mid afternoon , so I grabbed this chart at 1:47 p.m. That was a high volume drop on Wednesday.
.
SPX – These Markets are losing relative strength (RSI) & MACD stability, so now we’ll watch as this drop plays out. This actually looks like it could break that 50 sma now ( read the chart).
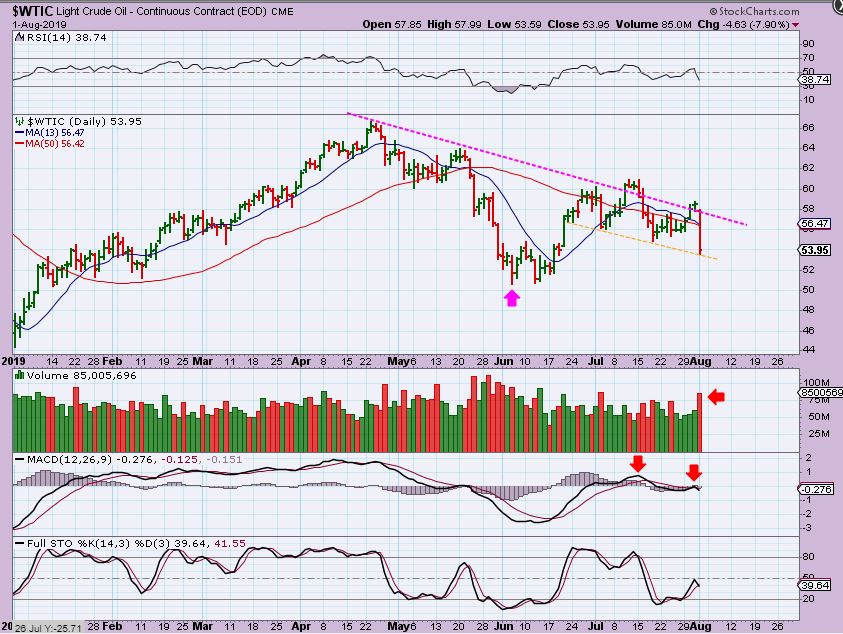
WTIC – That 2nd break out above the 50 & 200sma was a fake out too? Oil is not stable or a reliable trade right now. An 8% drop in Oil? On heavy volume after bullishly breaking out? This looks like a mini head & shoulders now. These markets are all over the place.
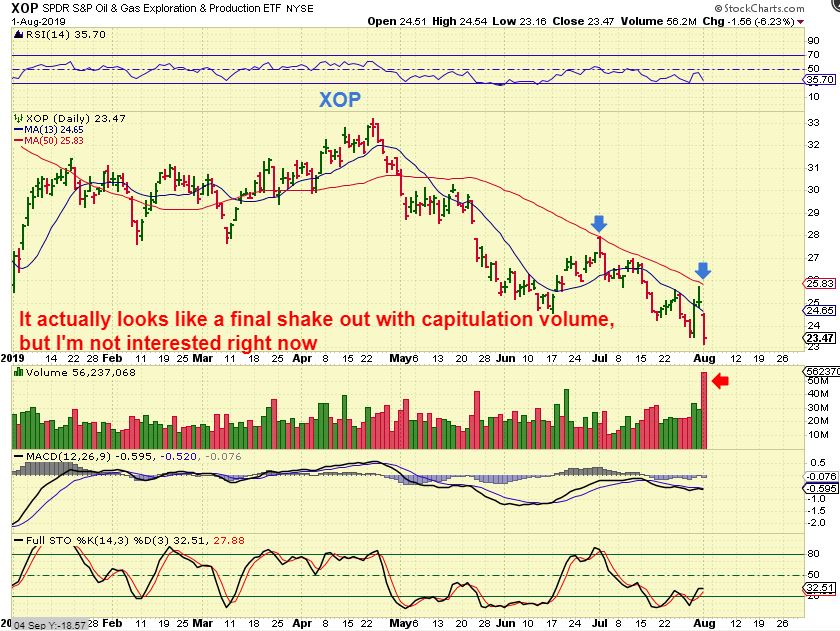
XOP – This was setting up to break out above the 50 sma too, and it just crashed back down too. The MACD makes this look like it is possibly a final capitulation low, but I am staying away for now.
.
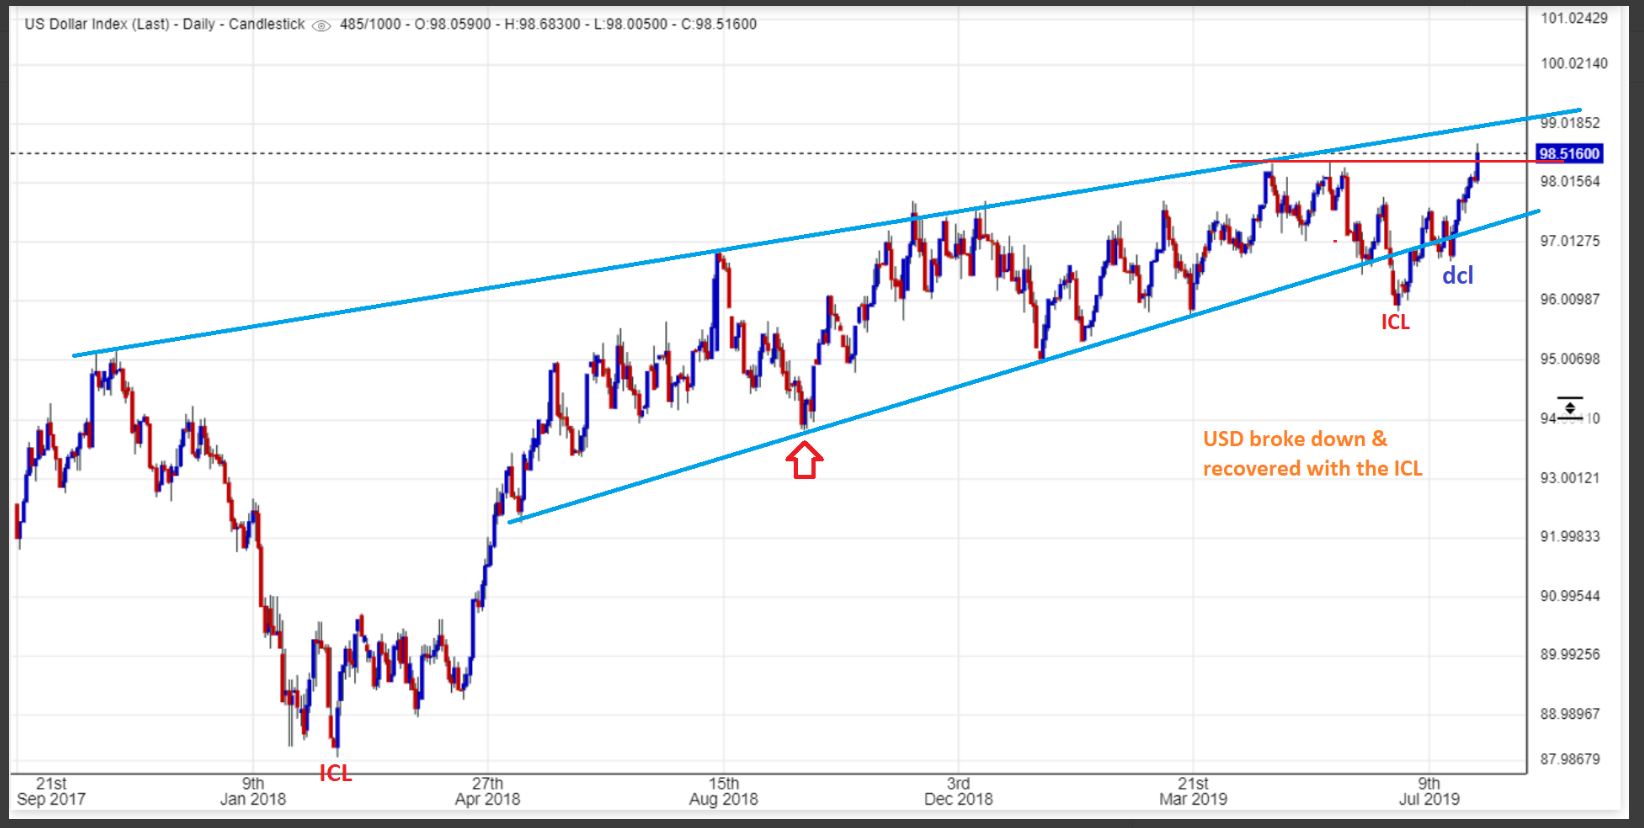
USD WEDNESDAY – I posted this Thursday and showed that the USD still had room to climb higher. See the blue line…
.
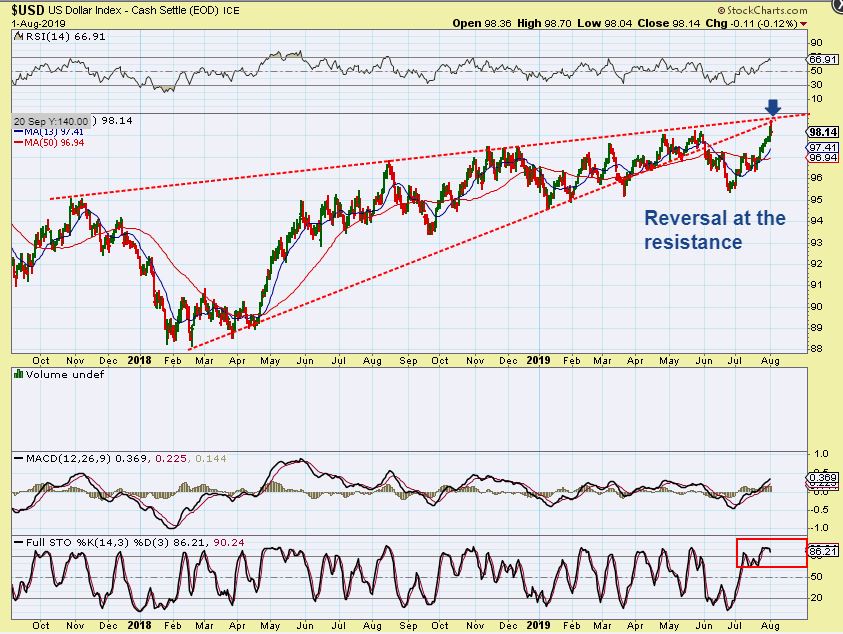
USD – The USD tagged that blue line ( red here) it and reversed sharply. That final push higher had Precious Metals dropping at the open, but everything reversed Midday. The USD is overbought.
.
GOLD – GOLD has formed a triangle ( Forget about cycle counts for now). As the USD pushed higher to that upper blue line, GOLD dropped. Then at 11 A.M. I posted this in the live trading area. Gold reversed off of support and was looking bullish again. I have expected a run to $1550 as a possibility, so…
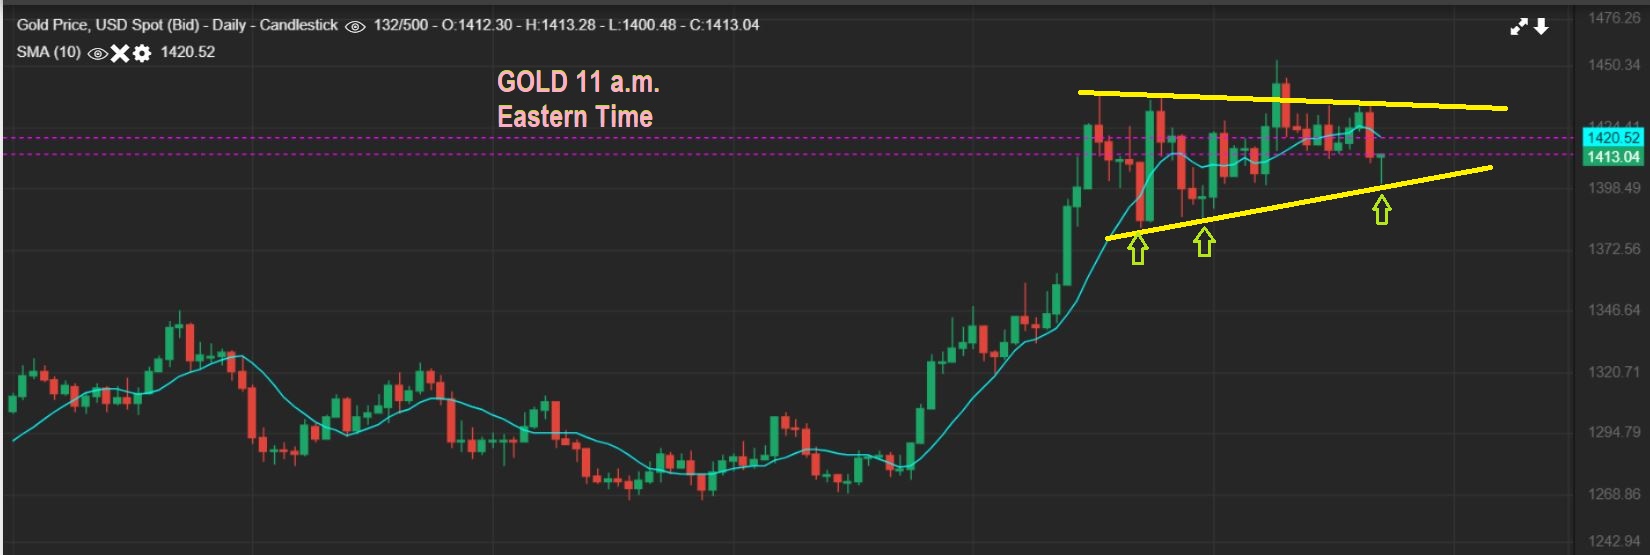
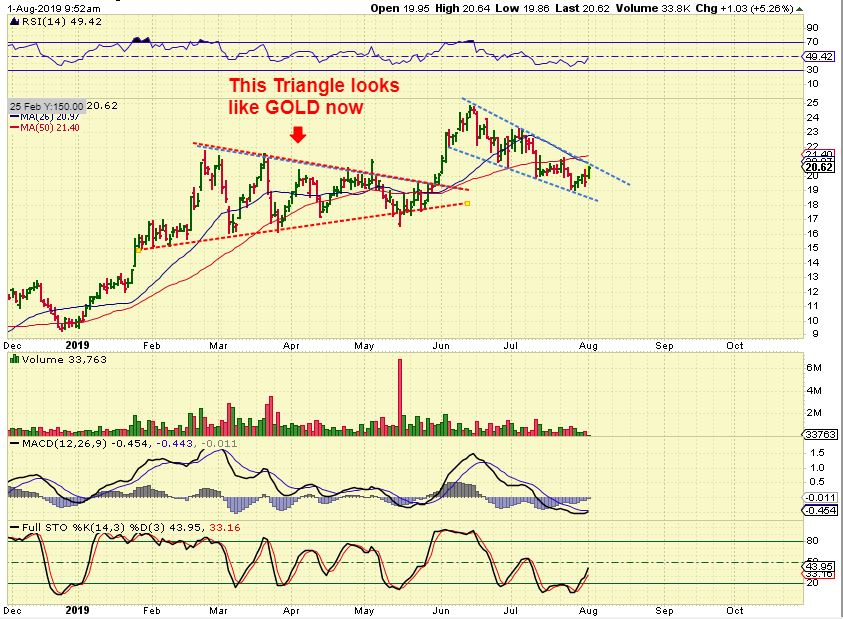
I found a triangle similar to GOLD right now. They usually break out higher, so I am using this as a visual idea only.
Notice that this one didn’t break out & just run higher non-stop. It broke out &did run and then dropped . So with Gold this might represent a final high for this intermediate Cycle at $1550, and then it would drop to a dcl, and then another dcl as our next ICL.
NOTE: THIS IS JUST A VISUAL AIDE, IT MAY NOT PLAY OUT JUST LIKE THIS.
.
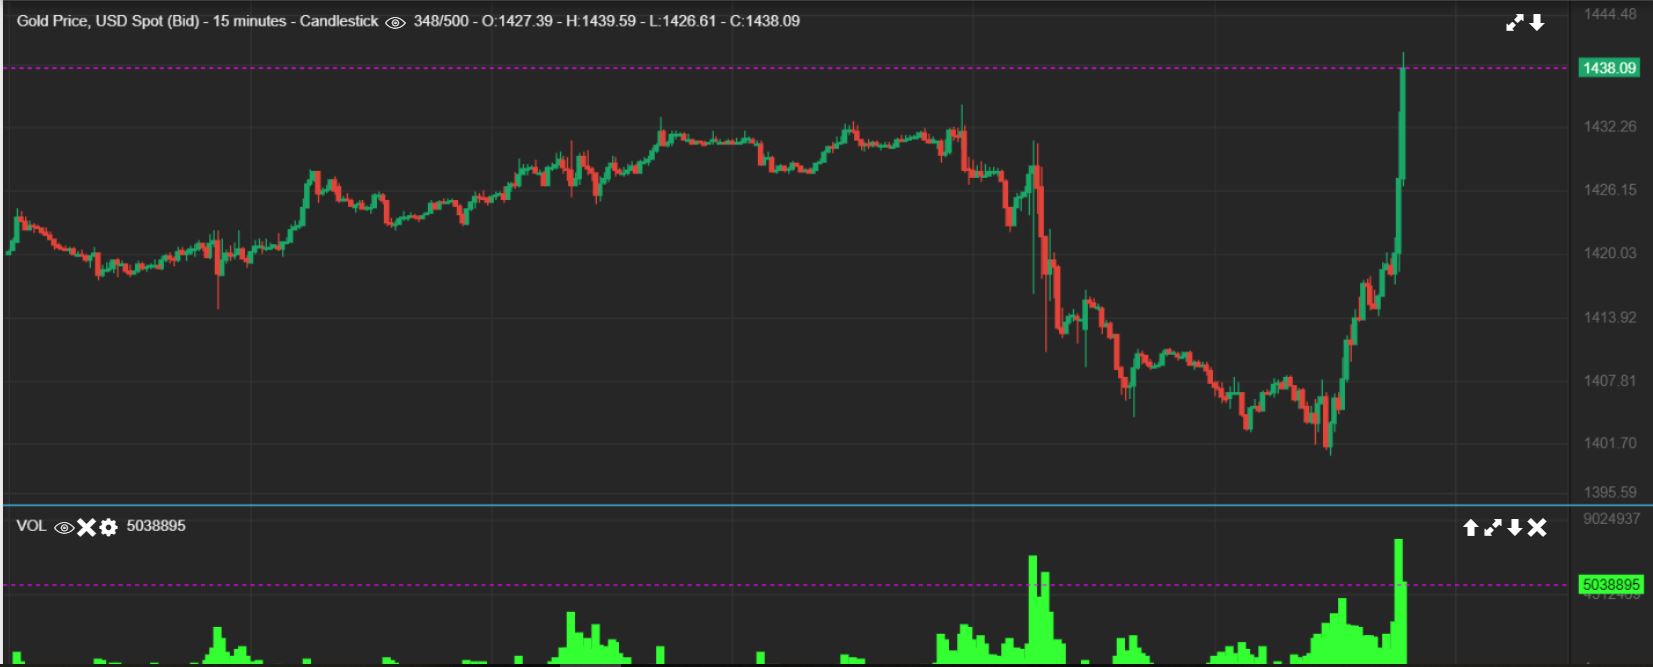
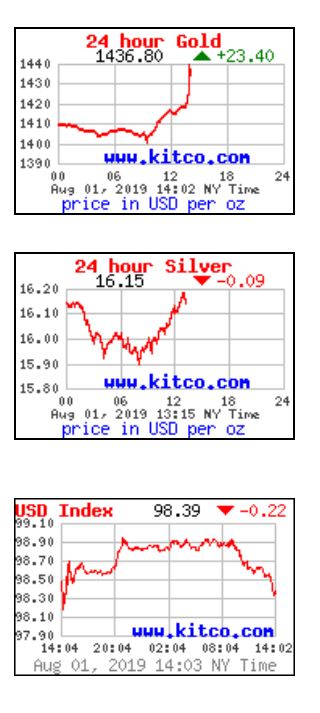
GOLD – Surprises to the upside , Gold really took off higher after selling off in the opening hours…
.
GOLD – $1400 to $1436 and then it continued higher to $1449. That is roughly a $50 move, a very large move after the Bull kicked everyone around. The Big Picture for GOLD is Bullish, but the short term was a bit confusing after the FED RATE CUT & SPEECH.
.
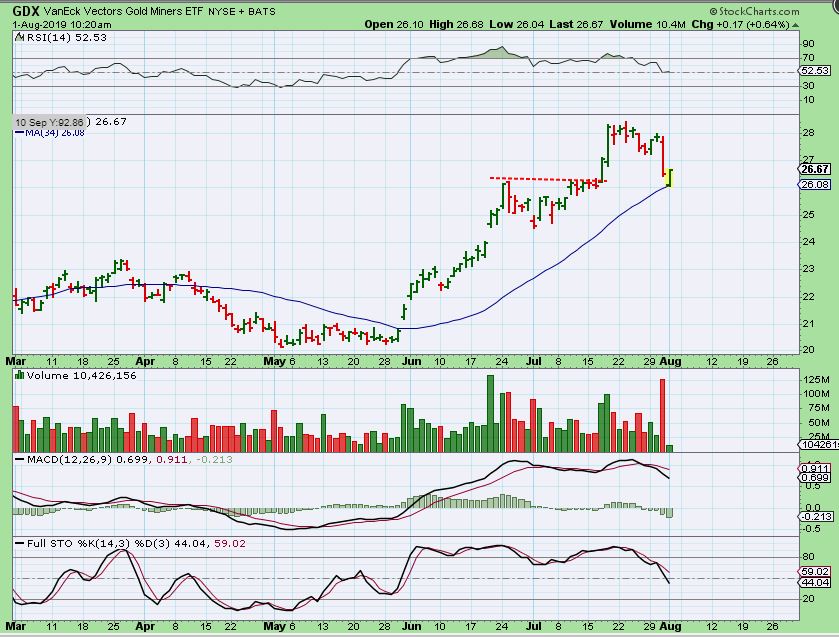
GDX – After Wednesdays sharp drop lower and closing at the lows, GDX gapped down to the 34 sma and then reversed higher. Before the end of the first hour, I captured this chart. It looked like a promising reversal.
.
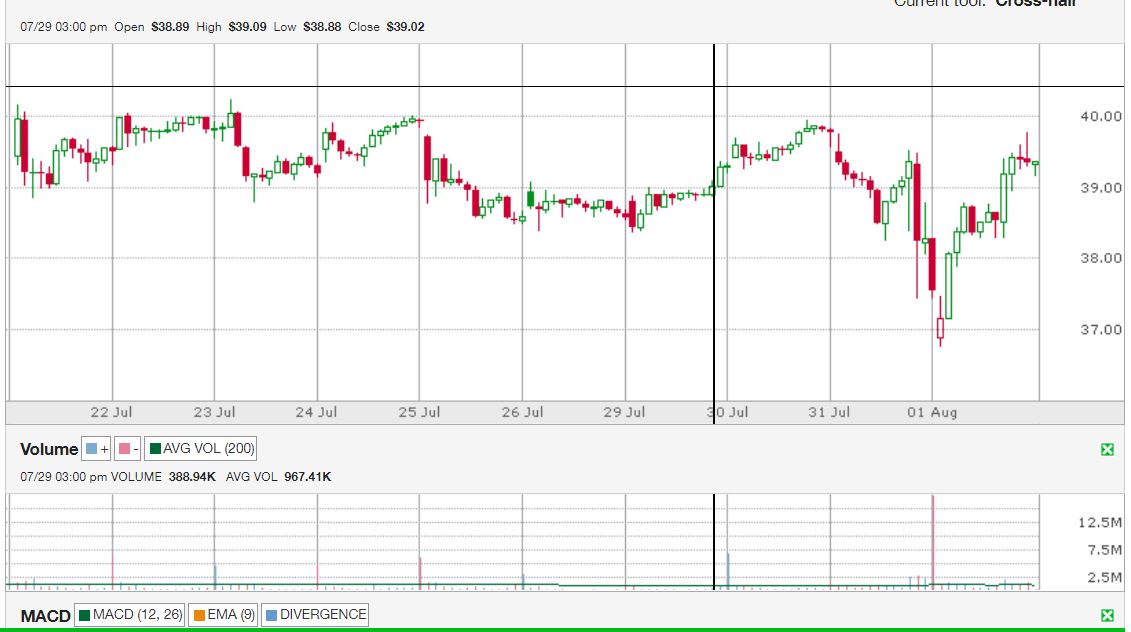
During times of volatility, I like to look at intra-day charts and see if anything interesting is taking place. GDX & GDXJ looked as though a bullish pattern was forming, and by 3 p.m. we had this…
.
GDXJ INTRADAY – An inverse Head & Shoulders looks to have formed. This is a 10 day chart, so in reality, we are looking at 7 choppy sideways days leading into the Fed Meeting, a sharp crash after the Rate Cut Wednesday, and a recovery on Thursday. Let’s hope that this bullish set up continues upside. It should if Gold does.
.
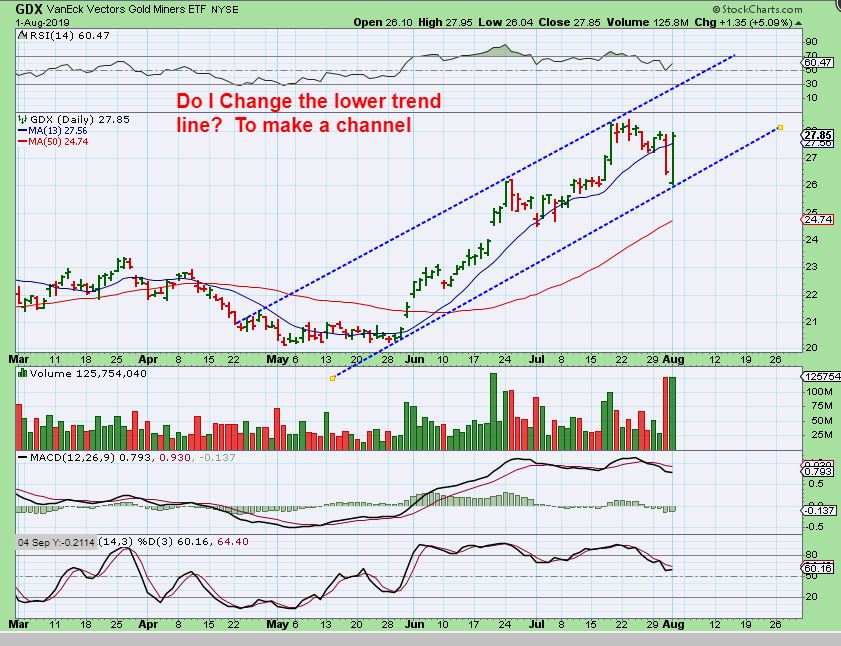
GDX – GDX sold of sharply and broke down through the up trend line Wednesday ( a slight wedge). On Thursday GDX then reversed very strongly, practically completely engulfing that Fed drop. Is this a dcl? That’s a possibility, but in Technical analysis, this is a BUY with a tight stop under Thursdays lows. And…
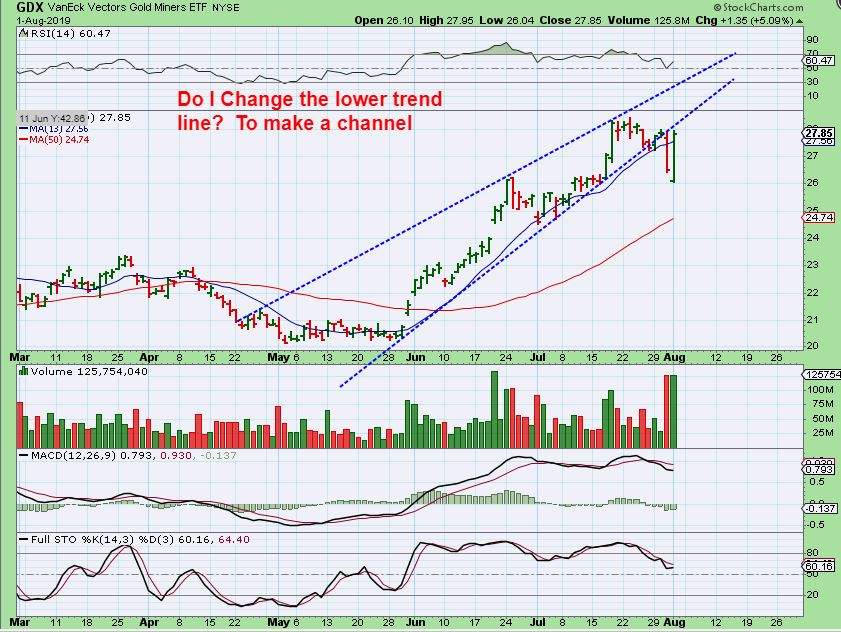
GDX – We could then draw the parallel line and have a channel that formed. We could still get to my target of the $31 area, before our next pull back. This could also just get VERY CHOPPY Going forward. Interestingly, the RSI turned up right on the 50% line.
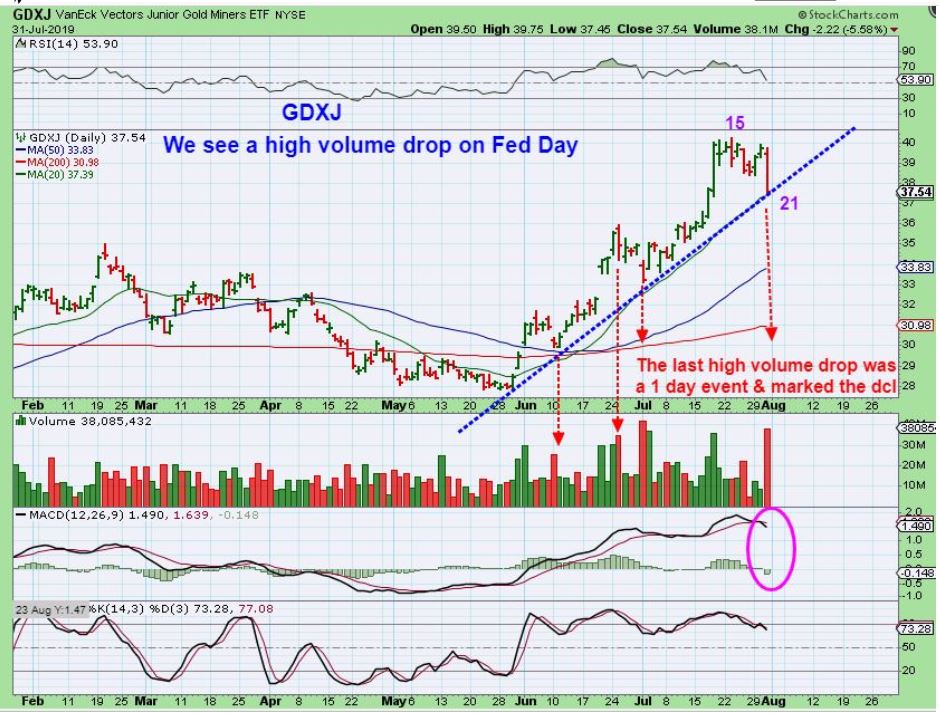
GDXJ – Yesterday I was pointing out that in the past (and in 2016) a high volume drop out of nowhere in a bull run could become a 1 day hit or a fake out, as seen on this chart…
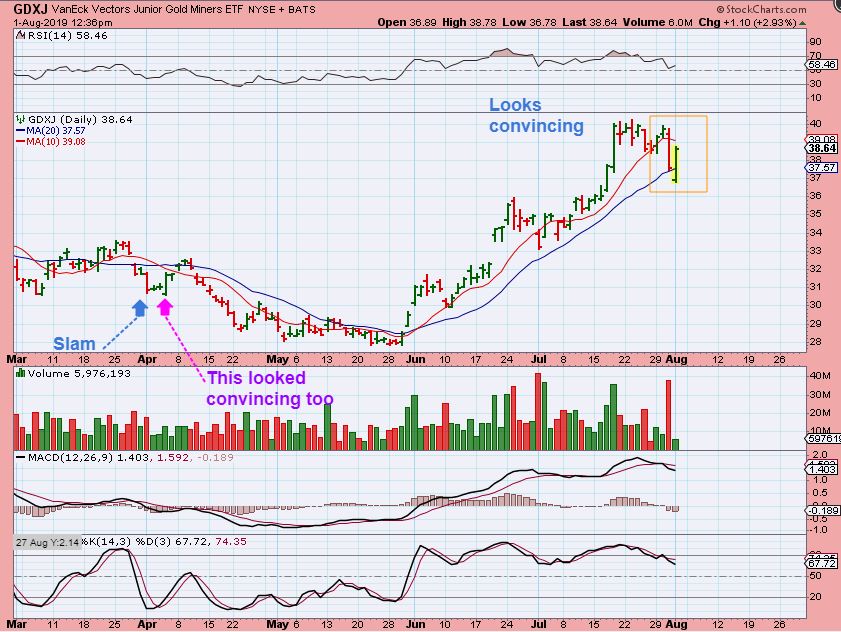
GDXJ – So it appears, at least for Thursday, that the drop was a one day Kick from the bull to try to shake off riders. This 1 day drop, which showed up in MANY miners, was a ‘change of character’, so I discussed that too using RGLD as an example…
,
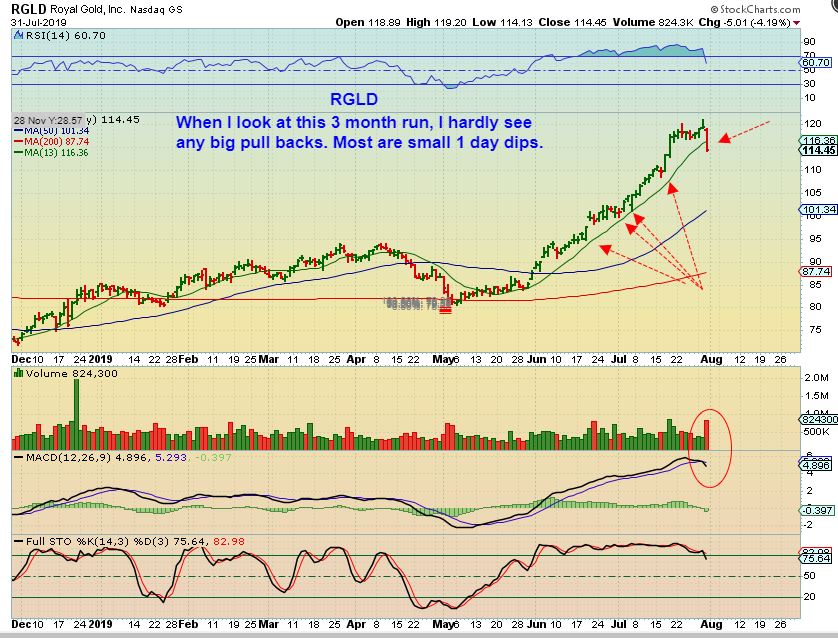
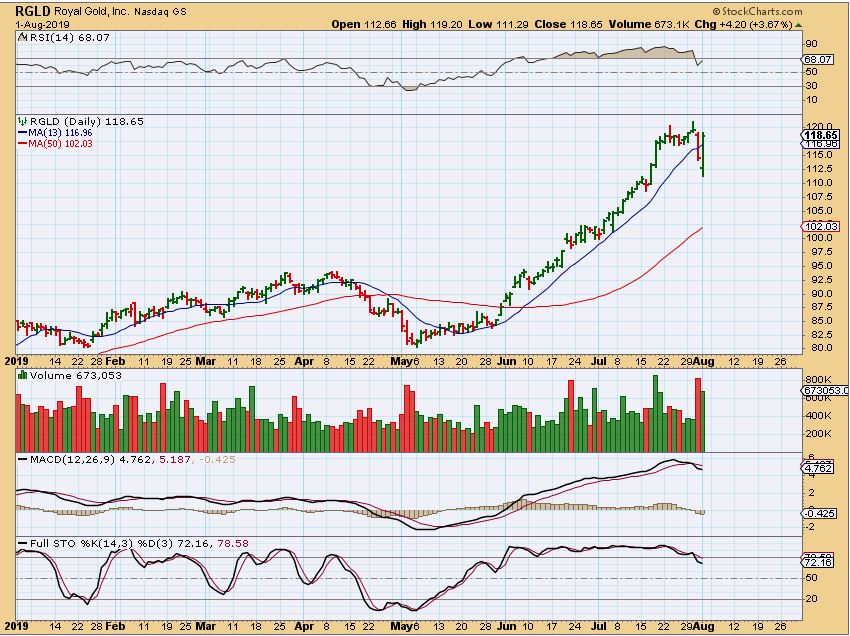
RGLD – I pointed out that this dip was different, so to me it was a ‘change in character’. We went from small tiny pull backs that left people behind, to a large drop out of nowhere, and THAT can lead to more volatility or choppiness, so I…
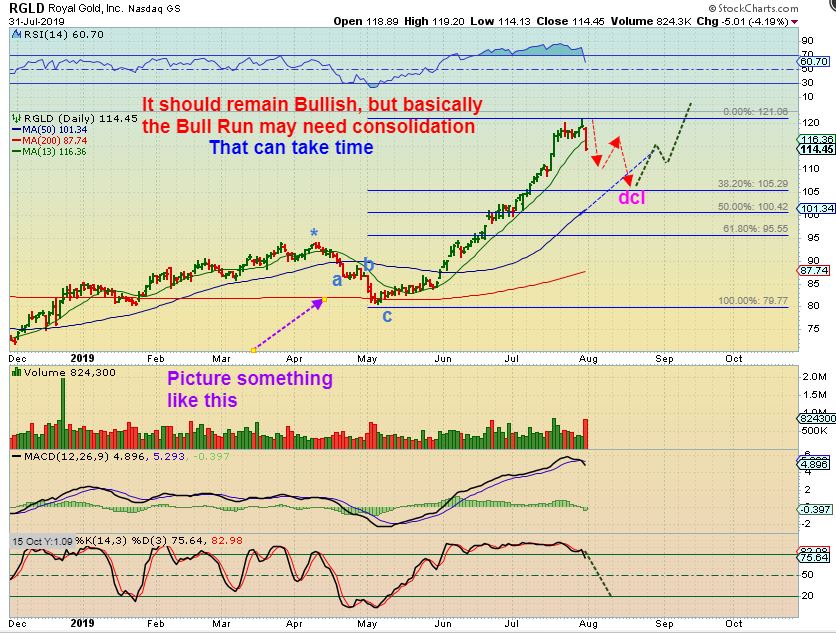
RGLD – So I even started to show possible targets if we get a prolonged drop into a dcl.
RGLD – Instead, RGLD reversed almost completely engulfed Wednesdays candle and regained the 13 sma. It could continue higher or it could just get choppy, but it is still a buy in technical analysis.
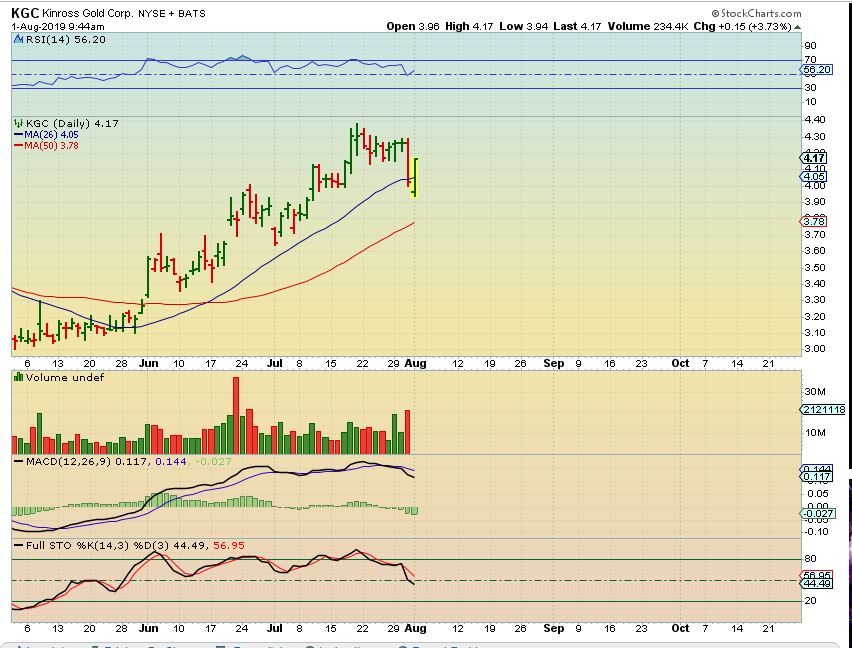
KGC – At 9:44 a.m., I saw this quick reversal and mentioned that it was impressive (only 15 minutes into trading).
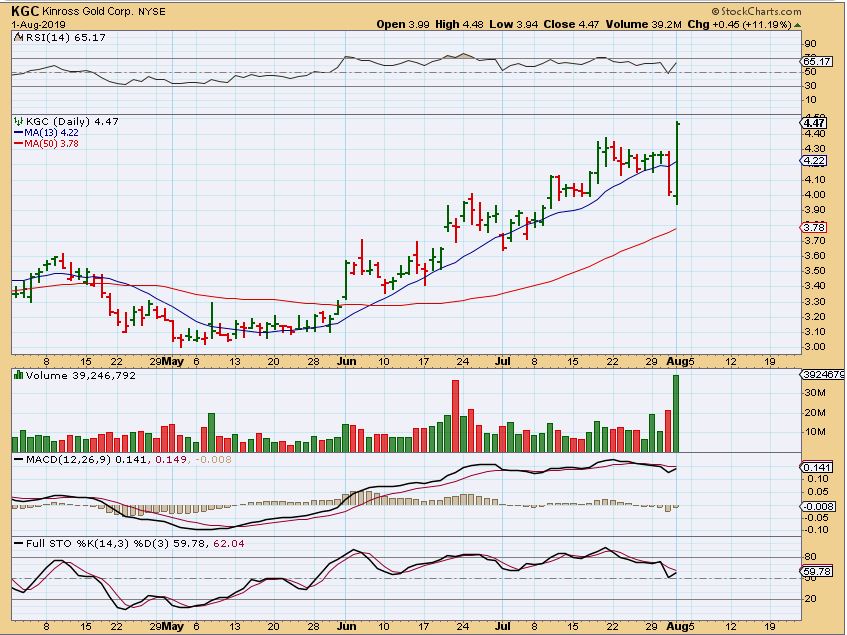
KGC – This is how KGC closed. WOW!
This looks Extremely bullish ( as long as it is not a ‘last engulfing candle’).
.
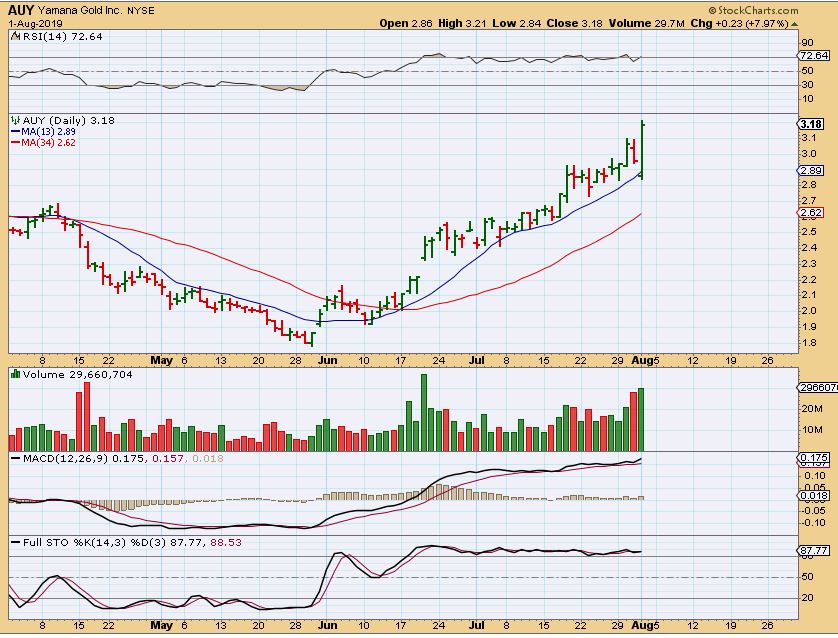
AUY – This is also a strong looking miner, because notice that even before Thursday, AUY hardly dropped on fed Wed. This looks great, as long as it isn’t a ‘last engulfing candle’. A ‘last engulfing candle’ is known to end a run higher, but they don’t always play out that way.
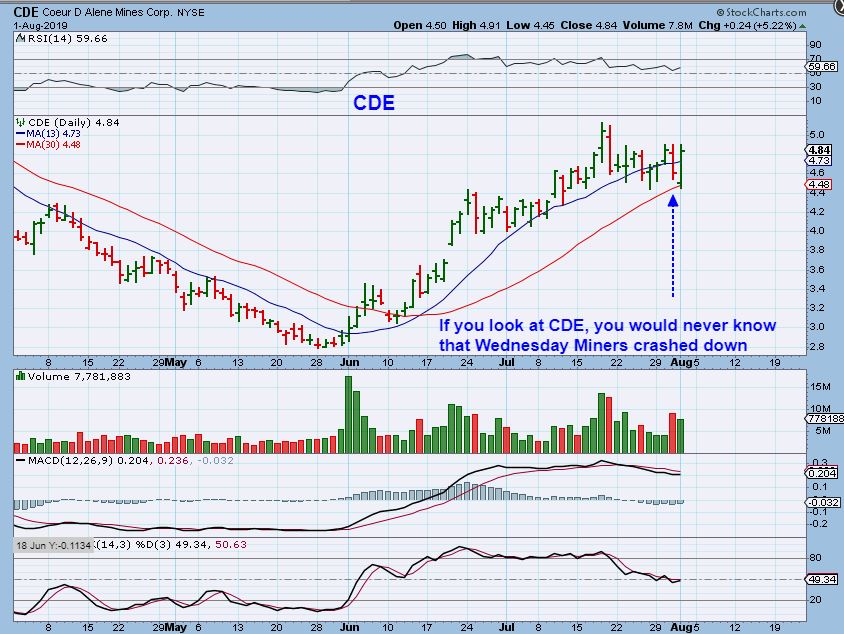
CDE – Some Miners hardly flinched on Fed Wednesday, and CDE was one of those miners. It seems that this would be a good one to add to, since it ignored the Fed sell off, so I added to this midday.
.
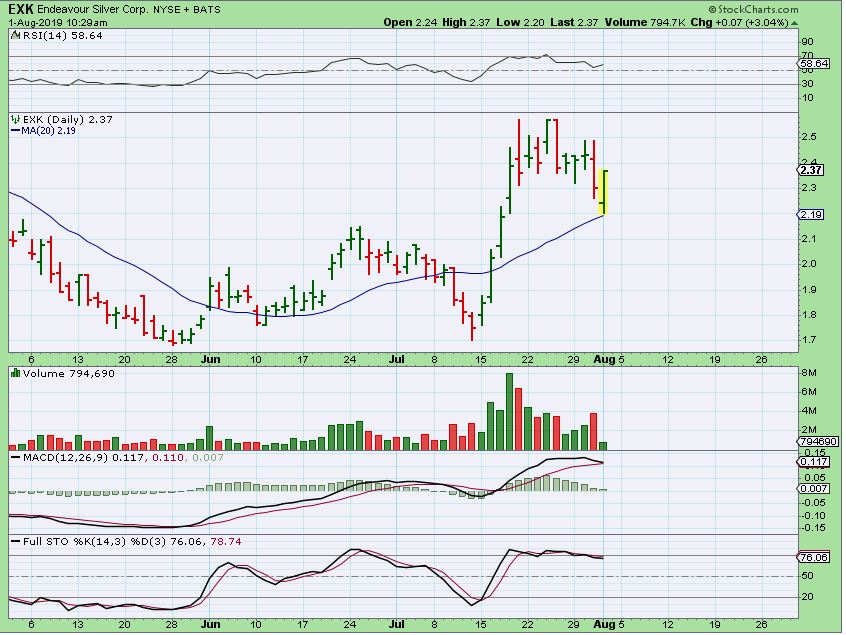
EXK – EXK and several other Silver stocks reversed higher off of the 20sma. I posted this 1 hr into trading, but it closed even higher at $2.43 with volume equal to Wednesdays.
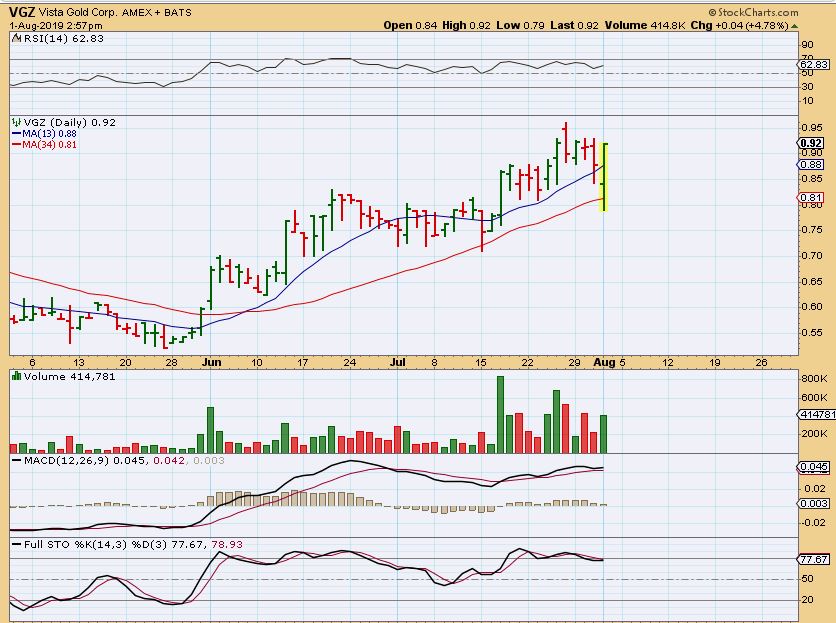
VGZ – Notice that VGZ fell on light volume Wednesday Fed Day, and price closed above the 13 sma. It dropped Friday and reversed strongly into the close too. This was captured before 3 pm, it actually closed with over 500,000 volume.
.
ANOTHER EXAMPLE OF A BULL RUN FOR YOU
.
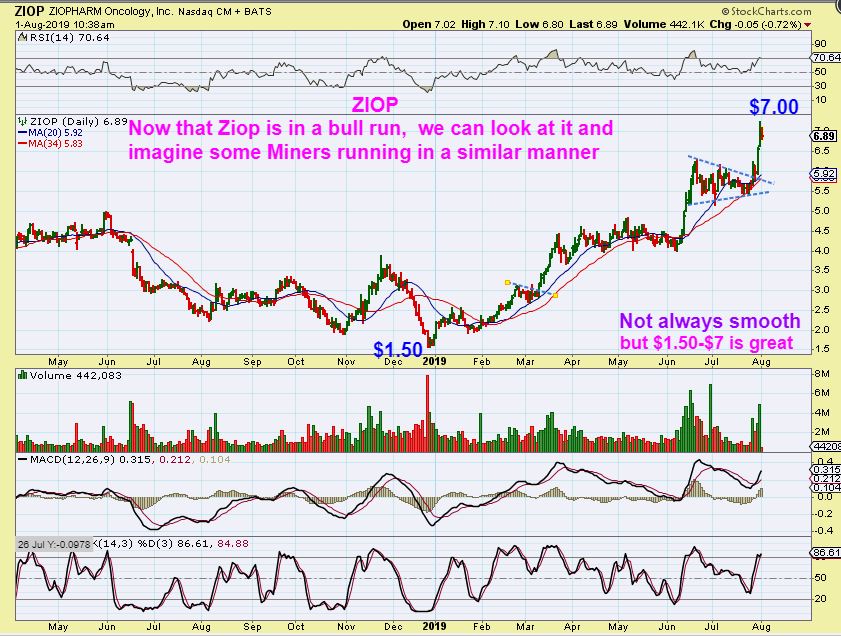
ZIOP – We have traded ZIOP a lot in the past, but when I looked at it recently I see a bull run unfolding. I just wanted to post this as ANOTHER EXAMPLE of how Bulls can run. It can become volatile and choppy, with lots of choppy sideways action. We see that with ZIOP, but in this Big Picture we see $1.50 to $7.00 as a great run for 2019. Our Miners could do the same, but the path that they take may not always be a comfortable one.
.
So we have very volatile markets after the Fed Rate Cut. Everyone knew that cut was coming, and it became one of those ‘sell the news’ events. I had been expecting a drop to a dcl in the general markets, Higher Oil, and a run to possibly $1550 Gold & $31 for GDX .
.
– The General Markets dropped sharply and need to be monitored.
– Oil broke out & crashed down, and I thought that XOP, XLE, and other Energy stocks looked to be setting up as low risk buys near the bottom. After the drop yesterday, the volatility in Oil has made it too difficult to enjoy, so I’m just staying away from the sector for now. ( I almost bought DNR & Gush as a trade, but thankfully they gapped down & dropped quickly. They looked bad from the open Thursday).
– Gold, Silver, and Miners dropped and reversed with 2 very large daily candles. I am hoping that that was some sort of sharp DCL Reversal and this can just rocket higher to my final targets for this intermediate cycle, but it may be signaling ‘ a change in character’. The character of this run was a smoother run with very small shallow dips. The change could be volatility which leads to more choppiness. THAT would make this a more difficult ride going forward for a while. I will discuss that below, and for now we’ll see how Friday closes out the week.
.
Enjoy your trading & your weekend!
.
~ALEX
.
A SAD REALITY THAT NO ONE REALLY WANTS TO HEAR 🙁
THIS COVERS THE POSSIBLE CHANGE OF CHARACTER TURNING THE MOVE TO A VOLATILE CHOPPY SIDEWAYS MOVE
.
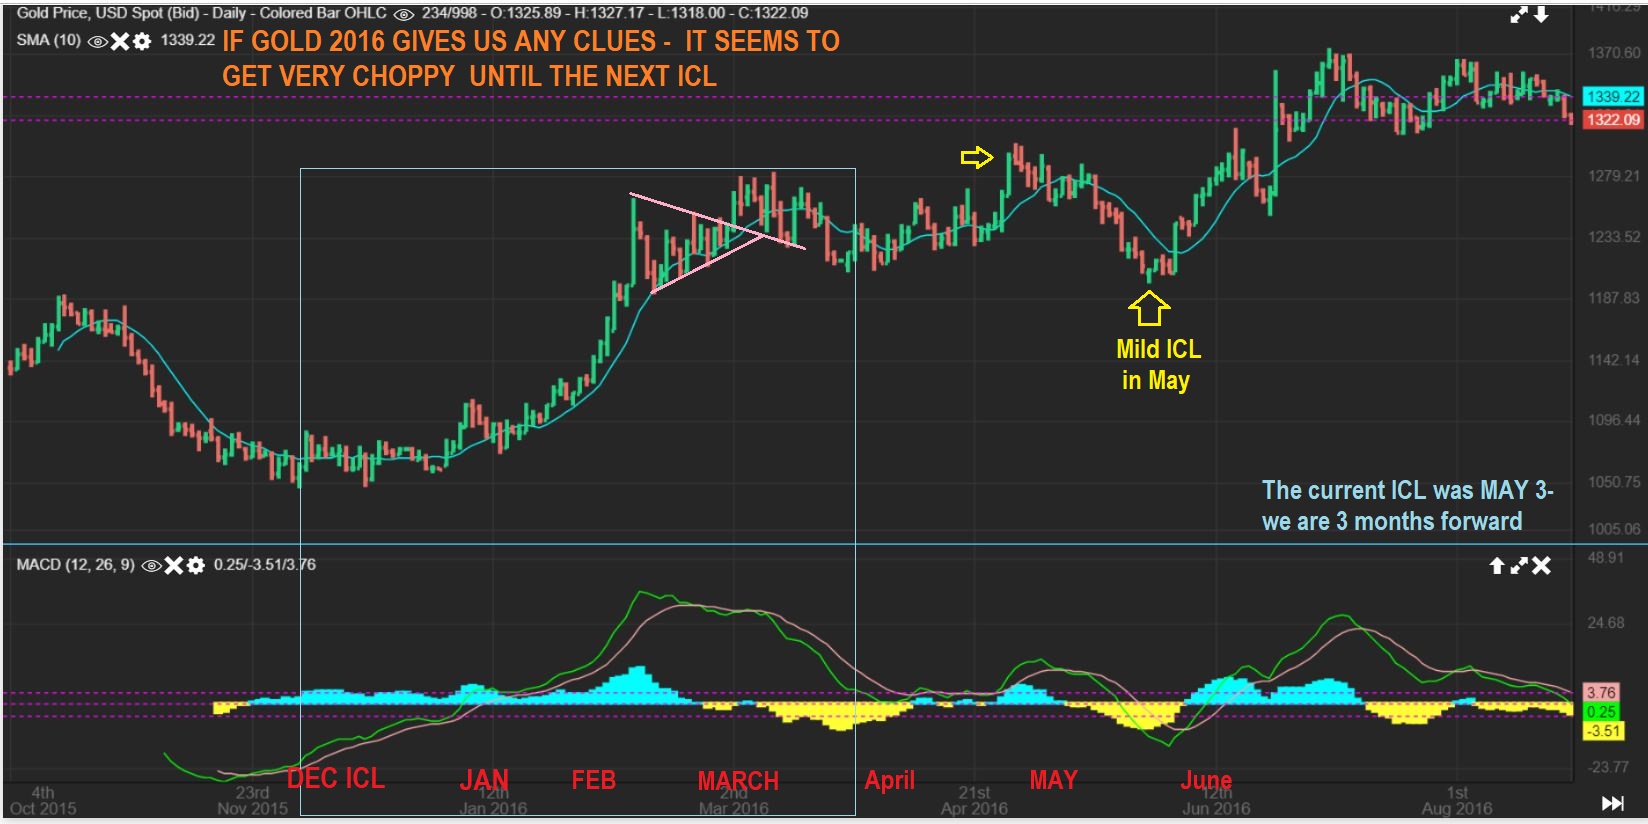
GOLD 2016 – I just want you to see that in 2016, the first 3 months were more of the straight up bull run move out of the lows into a Triangle (I have boxed 3 months in). Does that sound familiar? We have a 3 month run higher into a triangle now too. See the Box on this chart, and then the next chart…
.
SAME CHART: So after a triangle was formed, it broke higher, then dropped & chopped. That is a false break out & dcl. Next it ran to a slightly new high ( Yellow arrow) and then dropped again, this time to a deeper ICL in May. So 3 months after the Dec ICL, it just changed character & got choppy. It eventually found that ICL 6 months later, and Then took off higher again .
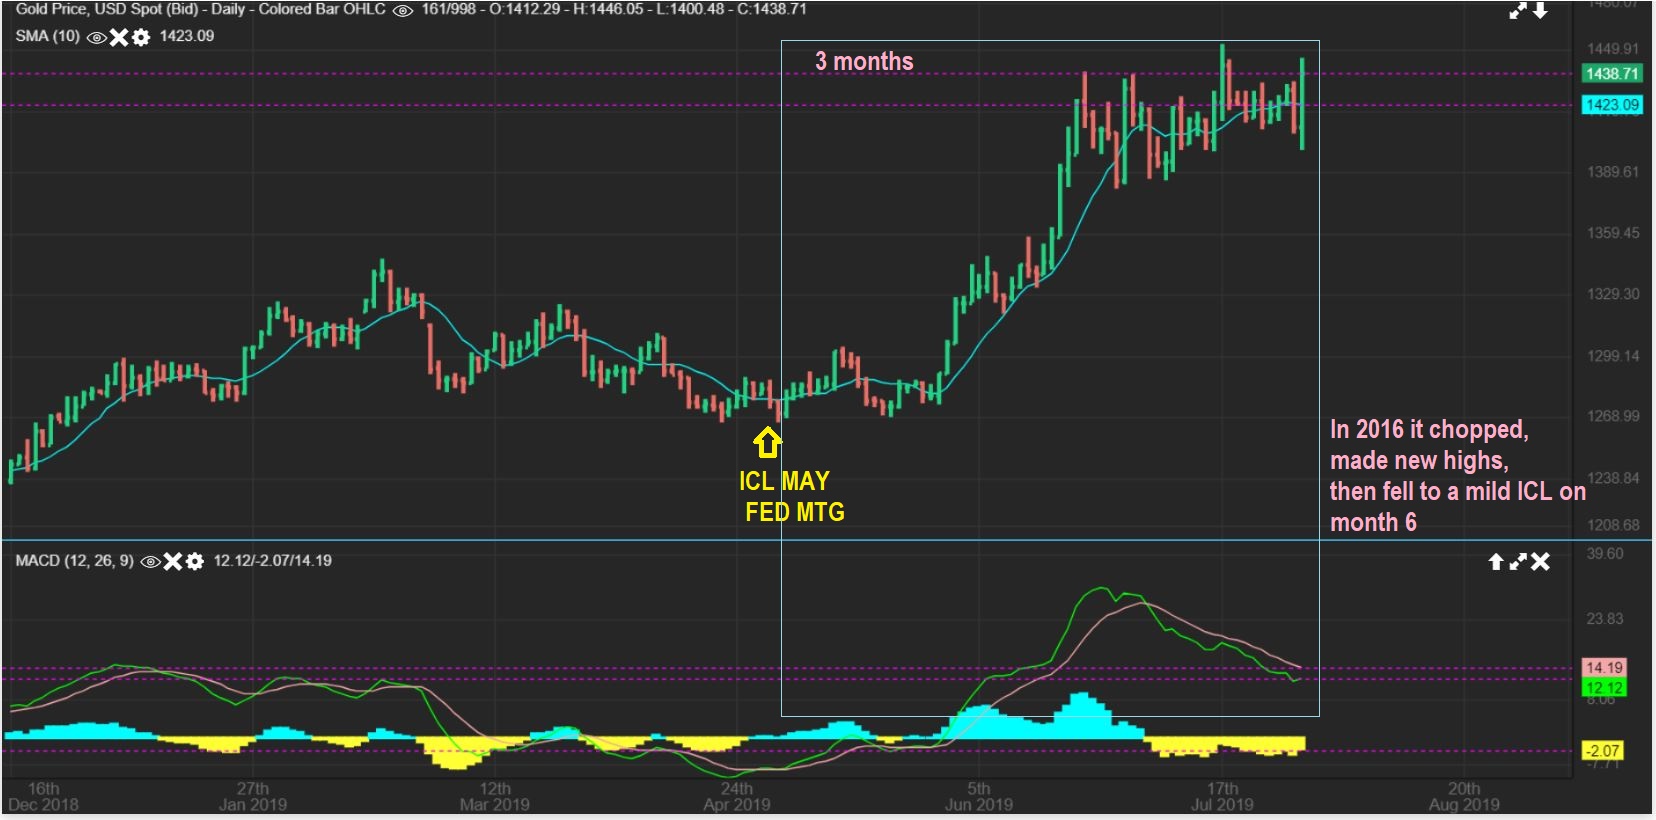
GOLD NOW VS 2016 – MAY 3 was Golds ICL, so 3 months later is August 3 and I put it in a box similar to 2016. Scroll up & look at 2016 box again, and compare to now. Do you see what I am thinking? THIS WILL NOT BE EASY IF WE GO FORWARD LIKE THIS.
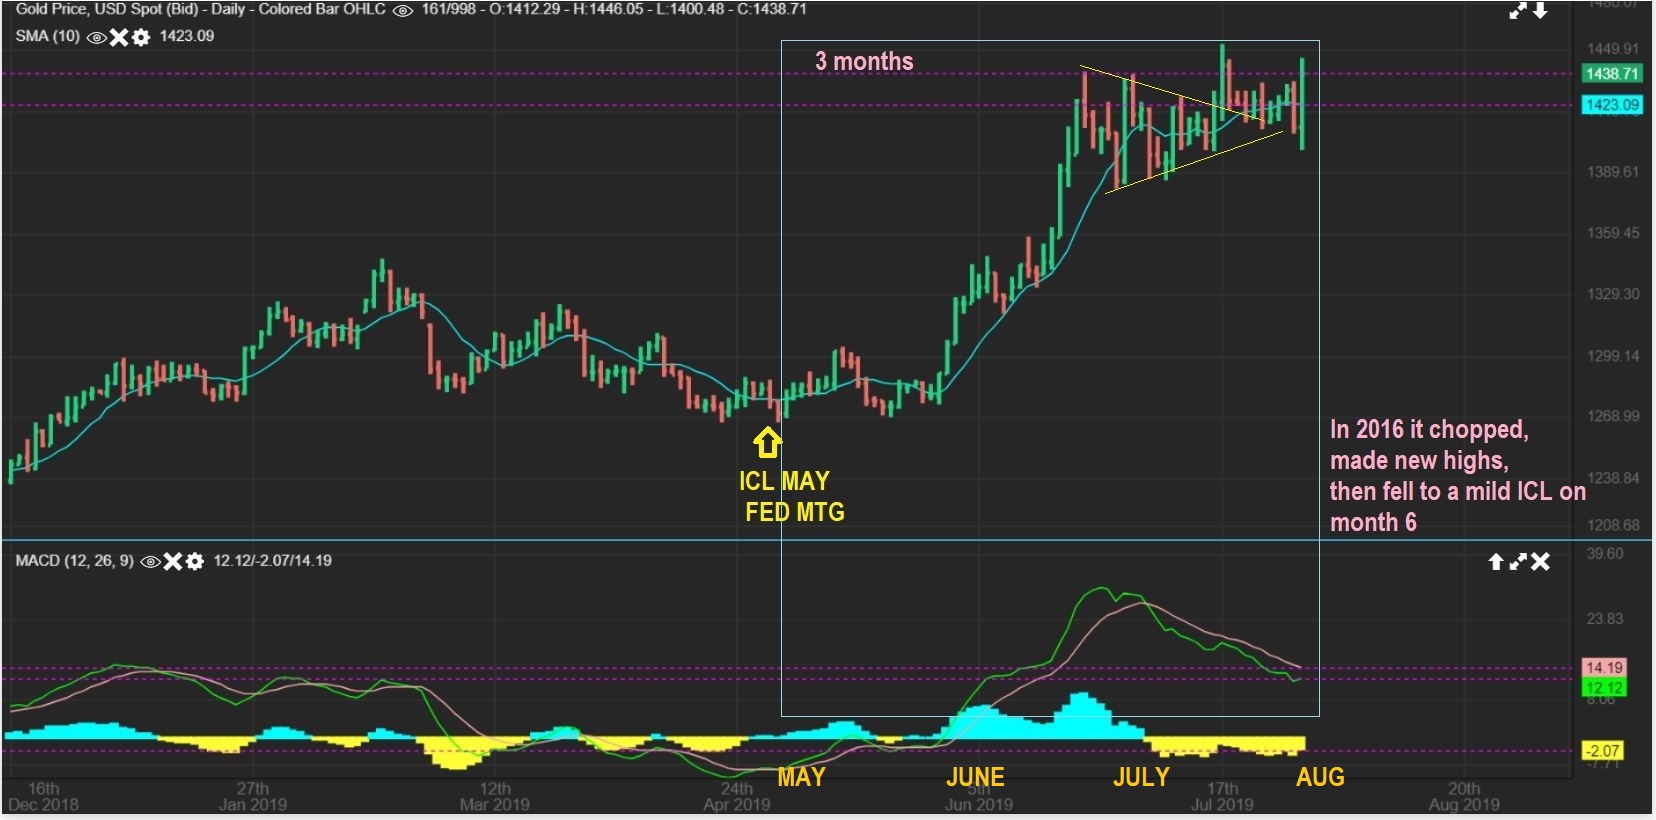
The Choppiness that you see here for the month of July would continue making highs & lows for 2 daily cycles into the next ICL. So Gold would possibly be breaking higher, but dropping back down to a dcl. I AM NOT SAYING THAT THIS IS WHAT WILL HAPPEN, but…
.
I AM NOT SAYING THAT THIS IS WHAT WILL HAPPEN, but yesterday I had several people asking me a few different questions like, “Is this a real reversal? Will we go to new highs? Is this a head fake? Have you seen this before? “
.
My answer is that there is no set path that it has to follow. I think the probability is higher price from here, and the rate Cut could be helpful for that, but now that we have a change in the way it is running? How we get there could be a bit choppier. I saw it and I rode through it in 2016, and that April through May chop was not fun. It becomes a bit unpredictable between DCLs.
.
At this point in time, I would say that it seems likely to me that Gold would still make that run to $1550 now, and GDX would run to $31 and then we start dropping to the next dcl, but just remember that in a Bull Market, the path that the bull runs down is not always easy to ride.
Even that 2016 run that we all hoped to get again was a difficult ride during the choppier times.

