
O-B-I-F! — Oh Bummer, It’s Friday!
.
You don’t hear that often, but the sad fact is that this is the last trading day of the week. What a fun week this has been! By necessity, Todays report is going to basically focus on one subject…
.
” When should I sell?” I will discuss that later, but please know this:
1. Some investors that caught the lows in Miners do not want to sell for several more weeks. That may be your style. Can you ride the ups & downs as long as the trend is up? Sure, it might be best to trade out of any extremely ‘extended’ Miners to buy laggers, but Buy & Hold investors want to stay in for the Bull Run ‘Buy & hold’ style. I’ll explain this in the report.
2. Others want to sell at the top and re-buy at ICLs. Trust me, You will NOT sell the exact top often, if ever. Just know that. We usually get the lions share of the chunk of these moves in Miners though, by buying low and selling high.
3. I am often very good at getting in at the ICL (lows), re-buying Pull back lows at support, buying reversal lows, etc , but selling the exact top is RARE. When I have managed to sell at the top of a run, it was either an ‘obvious top’ & I bailed out, a reversal candle formed, or it was accidental timing.
So I will discuss some selling thoughts later in this report. This has been an extraordinary week in the Precious metals sector, and a very Bullish run from the Fed lows.
.
.
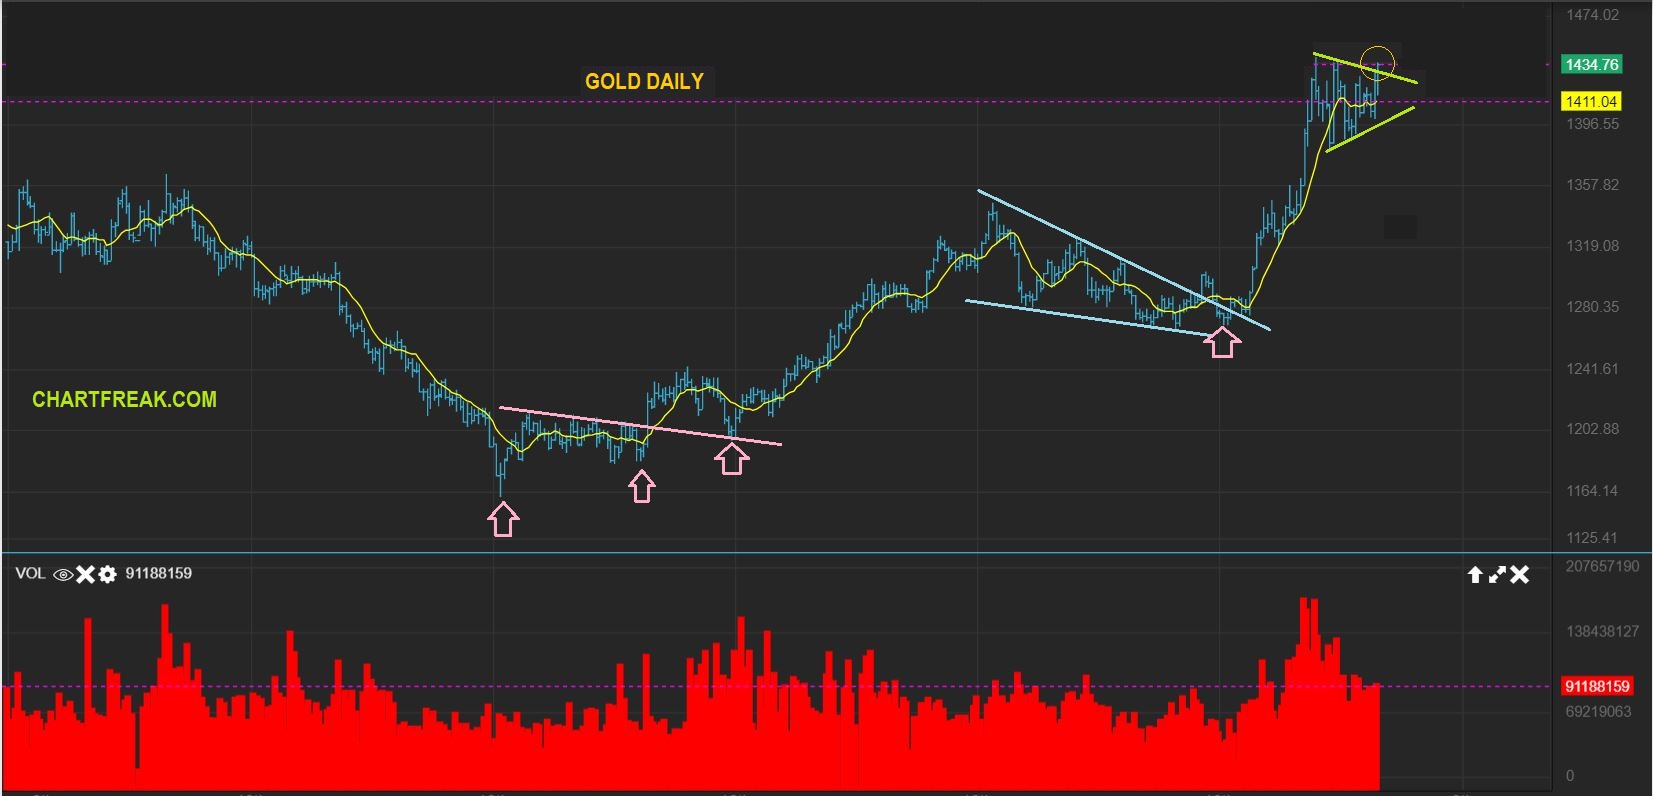
GOLD – Thursday Gold started to break out from that Bull Flag, so I posted this in our live discussion area below the report.
.
GOLD – Approaching the close, GOLD was at $1446 and the break out looked real. We will see if it has the follow through to confirm a break out. Some break outs fall back as ‘fake outs’ until later, but if it is real, I have an upside target…
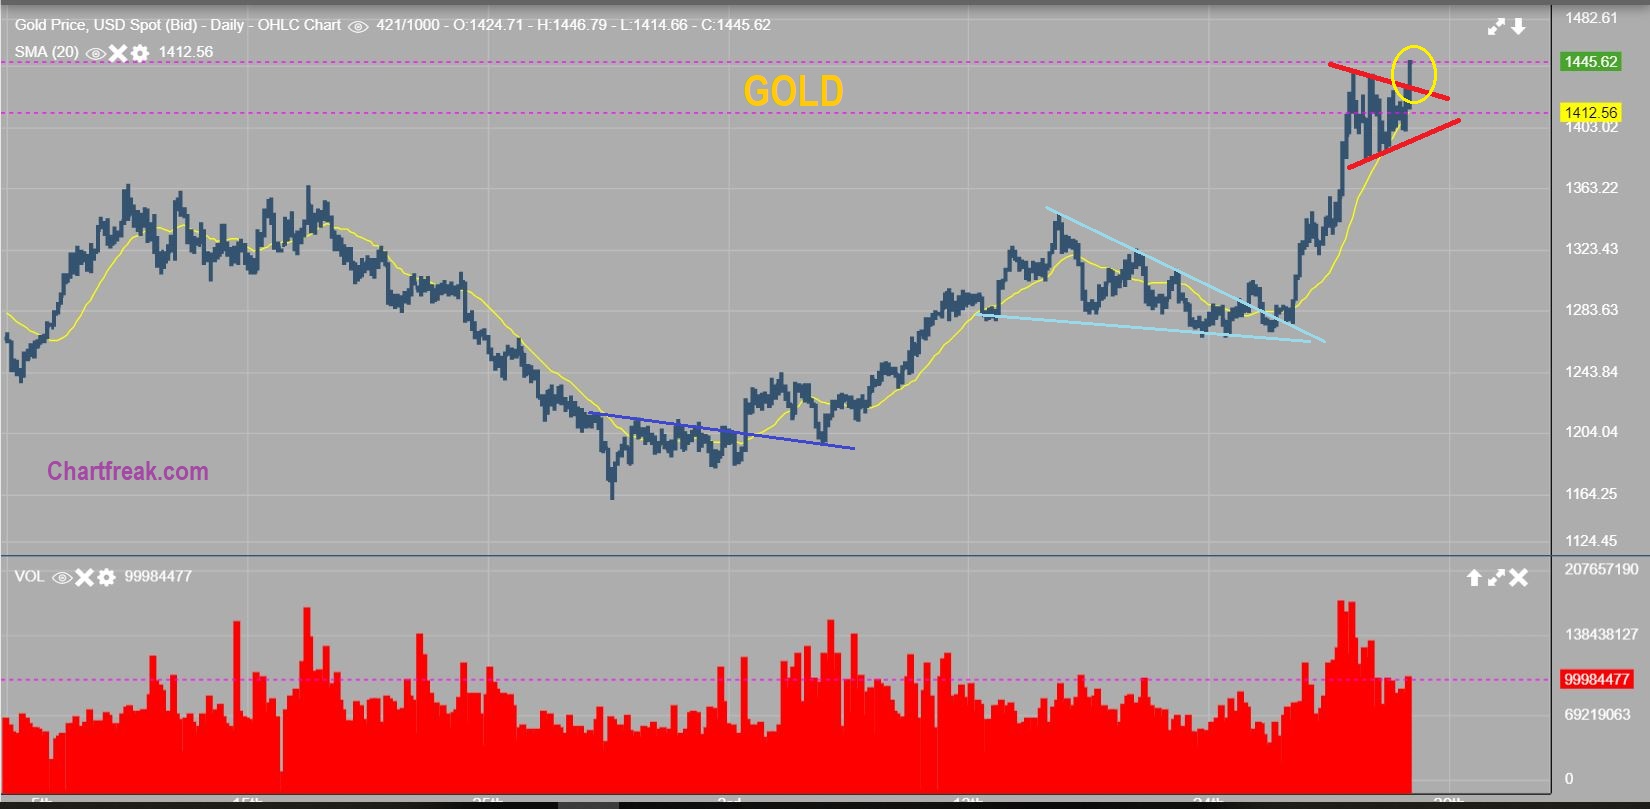
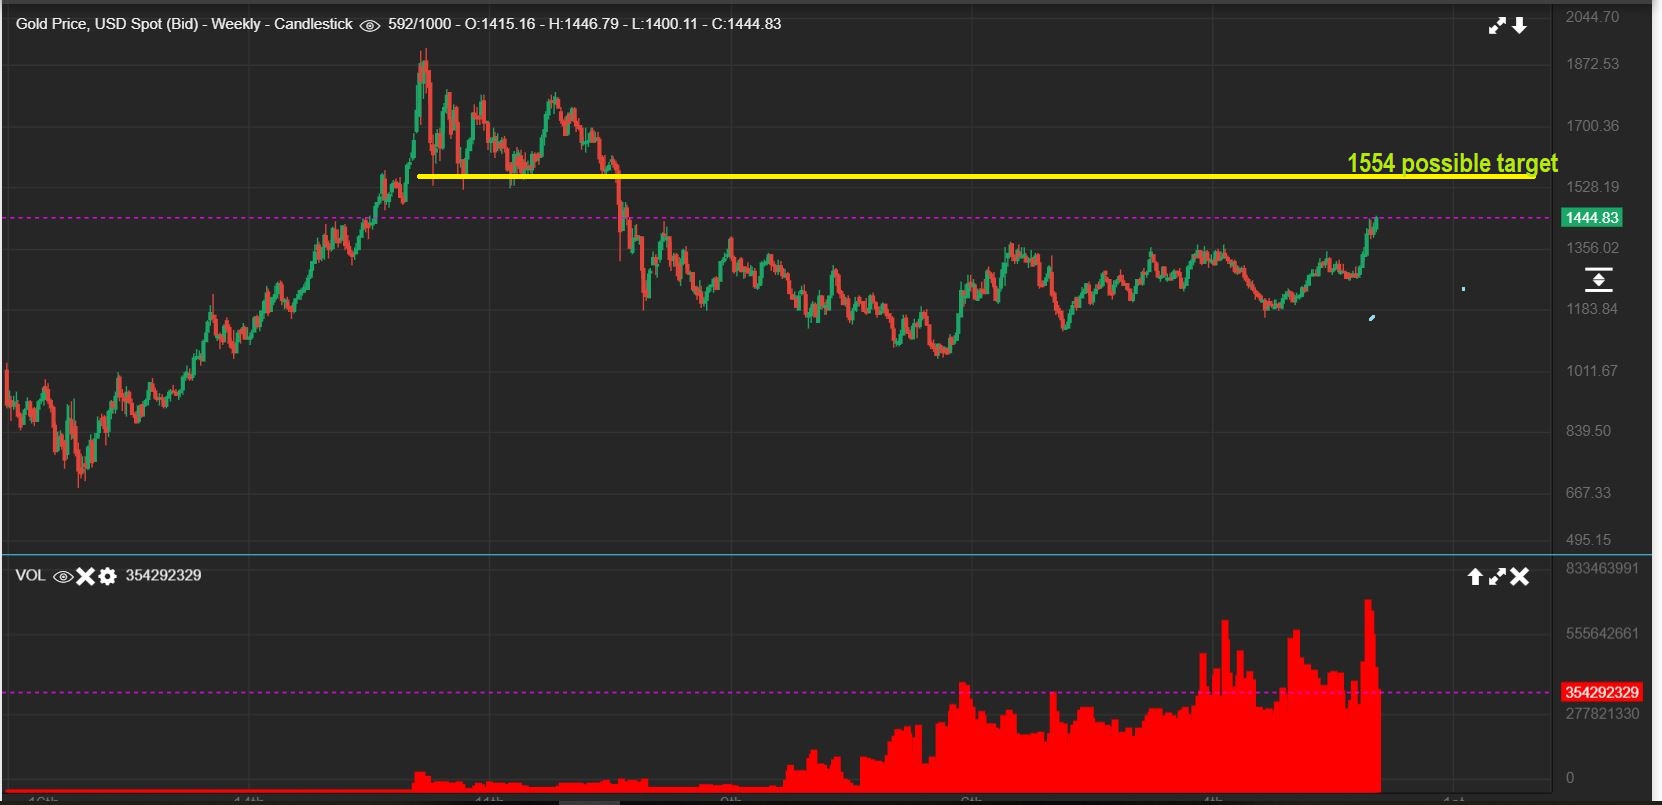
GOLD – My initial Target out of the Bull Flag would be a run to $1554. That is a measured move and the resistance area that I pointed out in the past when I mentioned $1550-$1600 as a price targets in that resistance zone. This should also eventually reach the 2011 highs.
.
THIS IS JUST 1 IDEA OF A FEW THAT I AM MULLING OVER:
.
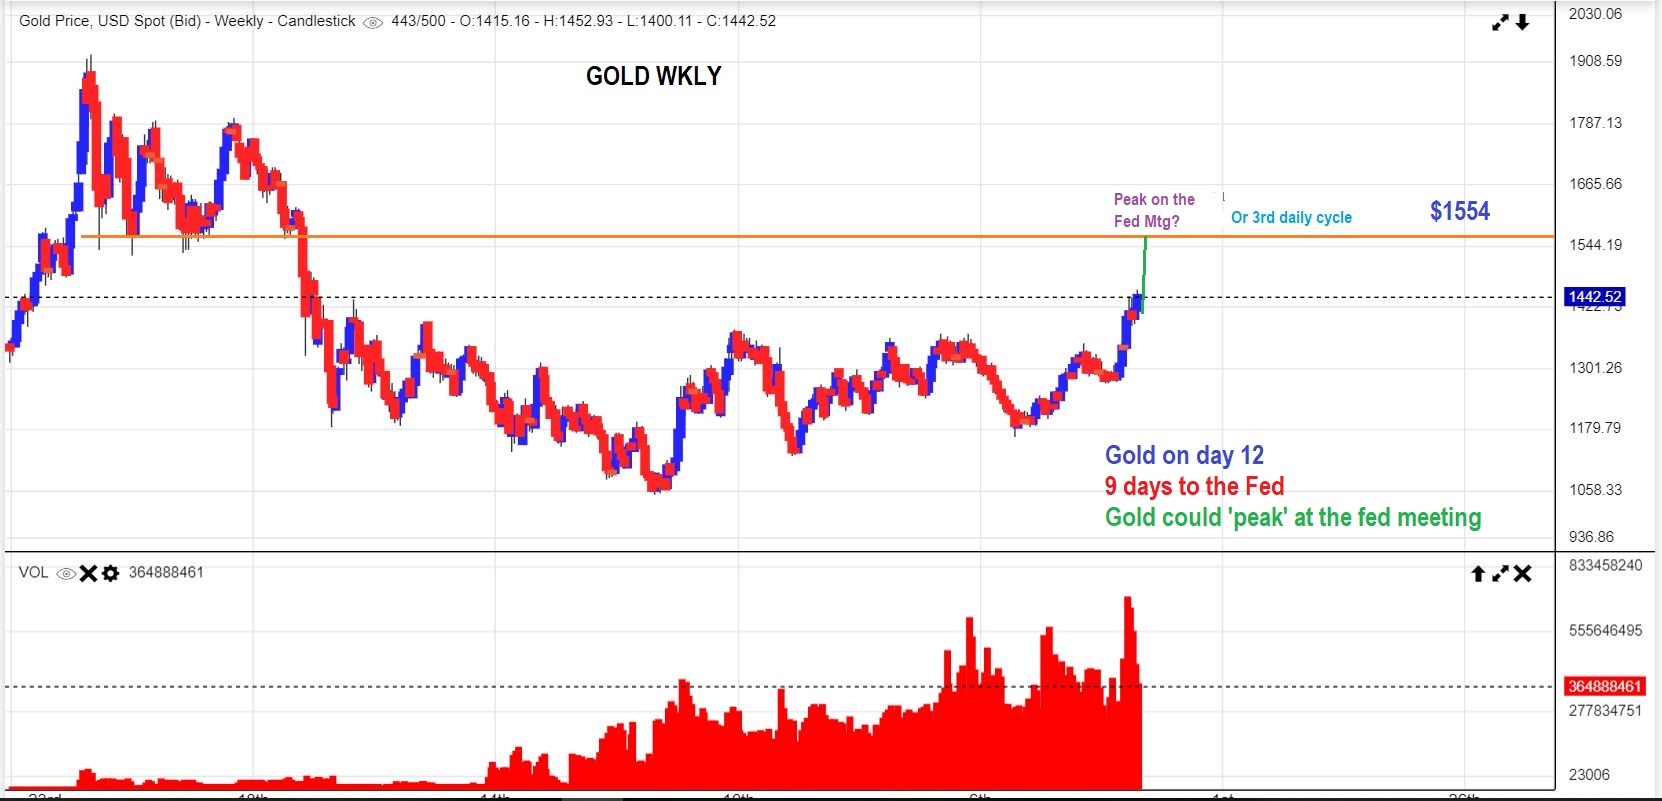
GOLD WKLY – CYCLE-WISE, Gold is on day 12 of the 2nd daily cycle, but a Triangle does often throw off cycle counts. That in mind, We know that we are 9 trading days from the fed mtg. I’d say that if we run to the peak over the next 9 days before that mtg, we could peak around day 21 – Fed day. It could be a ‘sell the news event if that happens, because that rate cut would then be baked into the cake. THIS IS ALL JUST GUESS WORK NOW, TO FORM A VISUAL IDEA OF ‘POSSIBILITIES’. USING CYCLE COUNTS AND THE FED MTG, THIS IDEA FITS THE PICTURE, BUT WE WILL KNOW MORE AS TIME GOES FORWARD.
.
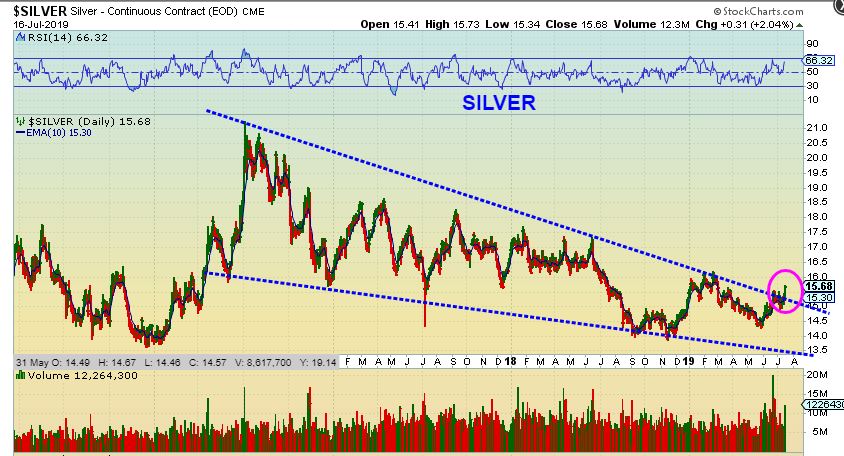
SILVER – I posted this 2 days ago, it has even improved, but I’m re-posting this chart as a reminder that SILVER has broken out. This is quite Bullish and Silver Miners are flying.
.
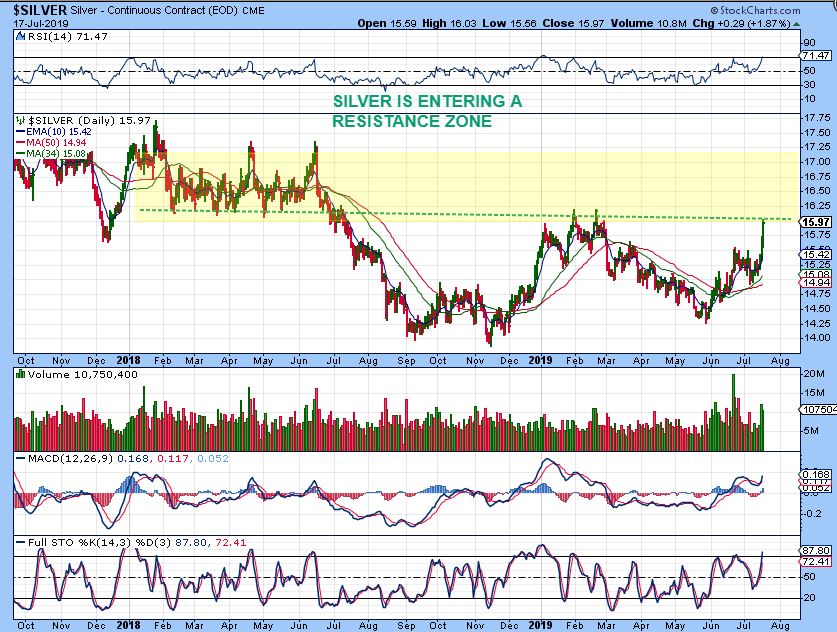
SILVER – Silver continued higher and I drew the resistance in, just in case SILVER stalls here. Know that it COULD just keep running, because SILVER runs very swiftly when it starts moving. With Silver, shorts cover, Buyers chase, things get extreme, etc. SILVER CAN RUN TO $17.25 in this intermediate cycle to form a giant CUP as it leaves this multiyear base.
.
GUESS WHAT? IN A STRAIGHT UP RUN LIKE WE ARE SEEING, I MAY NOT BE ABLE TO TELL YOU EXACTLY WHEN TO SELL YOUR POSITIONS ‘AT THE TOP’. IN FACT, NO ONE CAN PROMISE THAT, BUT I WILL AT LEAST TRY TO GUIDE YOU.
We have seen in the past that all miners run at different strengths, rates, etc. Remember KL & MAG in a prior run? KL would NOT pull back even at some DCLs. KL just dipped to the 50sma at an ICL, but ran strong even when GOLD dropped into a dcl. What does that show? That alone shows you why if you own a basket of Miners, each may act differently, and selling will be tricky. YOU WILL NOT SELL AT THE TOP in most cases, but you can lock in good gains if you AT LEAST use a trailing stop under the 10sma. Other methods of selling are also possible, and again, some may want to just continue to own a basket of Miners from here forward, because we caught the lows and this looks like it may be the start of another longer term Bull Run in Precious metals. A Multi year run.
.
Let’s discuss miners, and you will understand better.
.
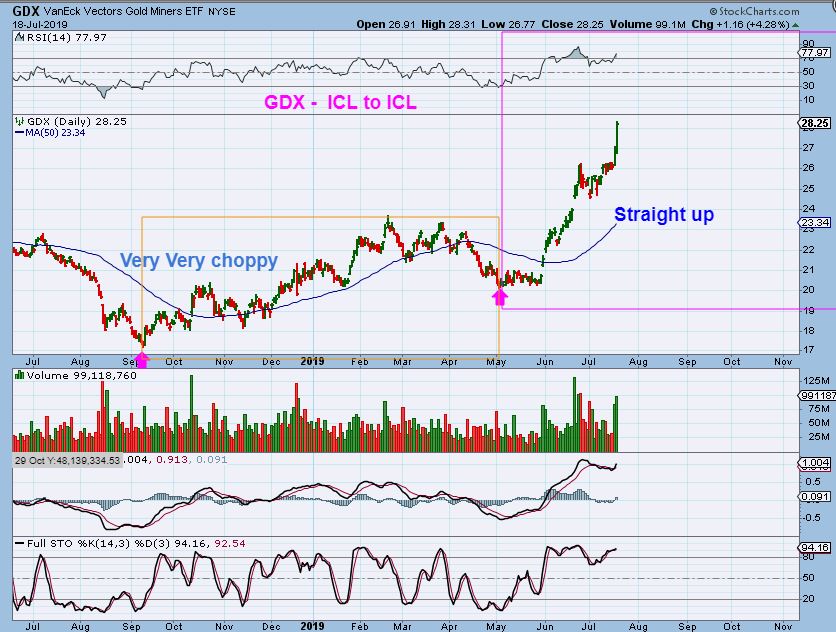
GDX #1 – Here I just want to point out the difference between our Last ICL to ICL run vs this run so far.
1. The last one was VERY CHOPPY, and that last Intermediate Cycle was 7-8 months long ( many of them are near 6 months).
2. We are now only on Month 2, with rapid gains in a straight up move.
I now have a few emails asking me, “Where do I sell, I don’t want to lose my gains“, yet 2 Other emails are saying, “ I sold last week to lock in gains, where do I get back in?“
So it’s funny: If you are in, you want out. If you are out, you want in 🙂 Let’s discuss this further…
.
GDX #2 – So some told me that they actually sold Most of their Miners last week, and wanted to buy lower, thinking of that gap fill. I understand locking in some gains, but that was not my recommendation. I said do not sell due to that gap, and I was pointed out that as a ‘Continuation Gap’ for 2 weeks. Continuation Gaps often do not fill. Now we are taking off higher this week. So THAT was not the top …
.
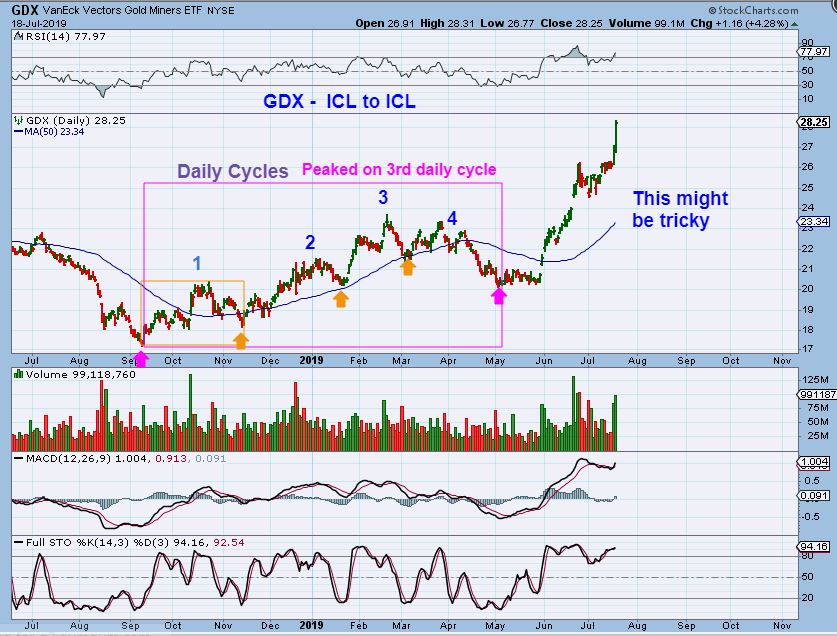
GDX #3 – Let’s examine that last Intermediate Run: I see 4 daily cycles in the last run. THE ENTIRE INTERMEDIATE CYCLE Peaked on the 3rd daily cycle, 5+ months from the ICL. We are currently only on the 2nd Month of this Intermediate Cycle. Should you sell now? Or will we ‘peak’ months from now? If you sell, where will you get back in? Those are unknowns at this time…
.
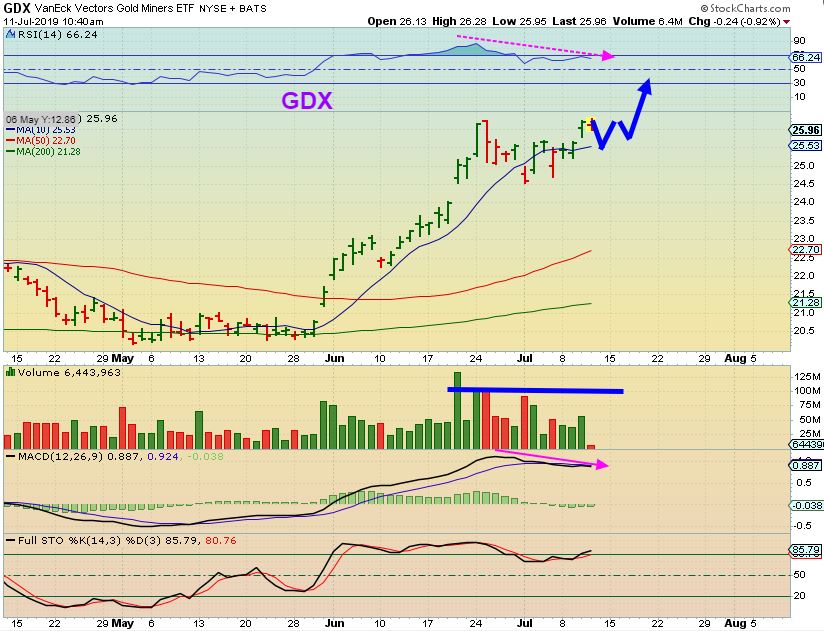
GDX #4 – Many of my readers want to sell on this 2nd daily cycle. Is this the top? My big picture reports have been projecting higher price, but this could be ‘close to the top’ of this daily cycle. I have been saying that I expect GDX to run to $28 as an initial target, yet it may extend since this is only day 12. After watching this unfold, I now think this can extend. I will discuss other logical targets…
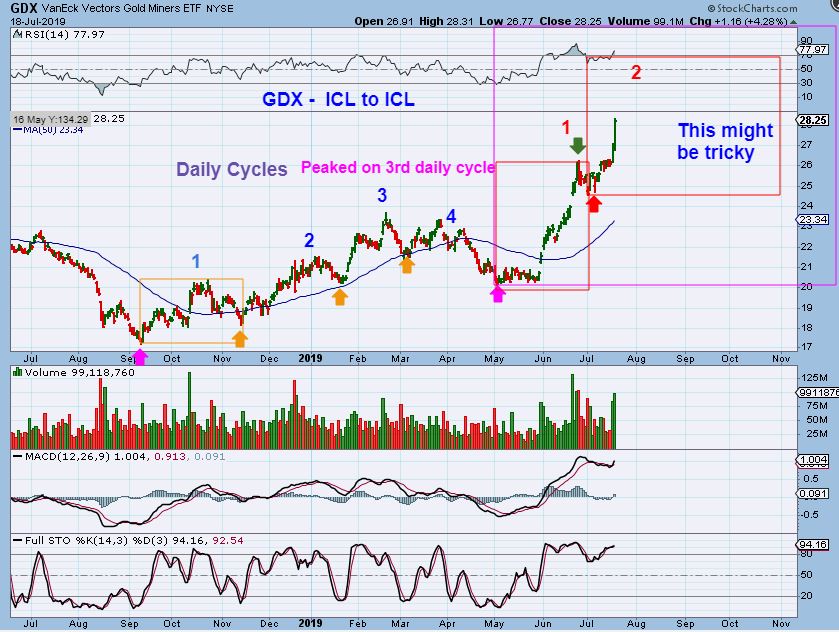
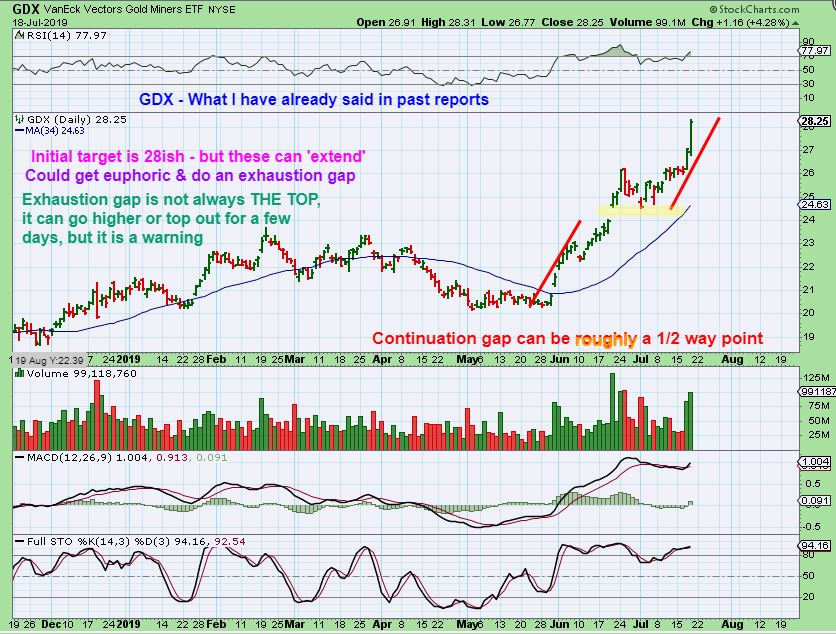
GDX – I have been saying that I had $28 ish as my initial basic target using this 1 method of measure. A continuation Gap can be 1/2 way through the run. Currently we are at $28.25 with slight divergence, so we may be near the top of this daily cycle . However, I also said that under Bullish conditions, those price targets can extend a bit higher. Please read the chart.
.
YOU DO REMEMBER ME TALKING ABOUT THE ‘BREAK AWAY GAP’, AND A ‘CONTINUATION GAP’, AND A POSSIBLE ‘EXHAUSTION GAP’, RIGHT? I USED THE FOLLOWING CHART WITH A FEW OTHERS, SO LET’S REVIEW THAT…
.
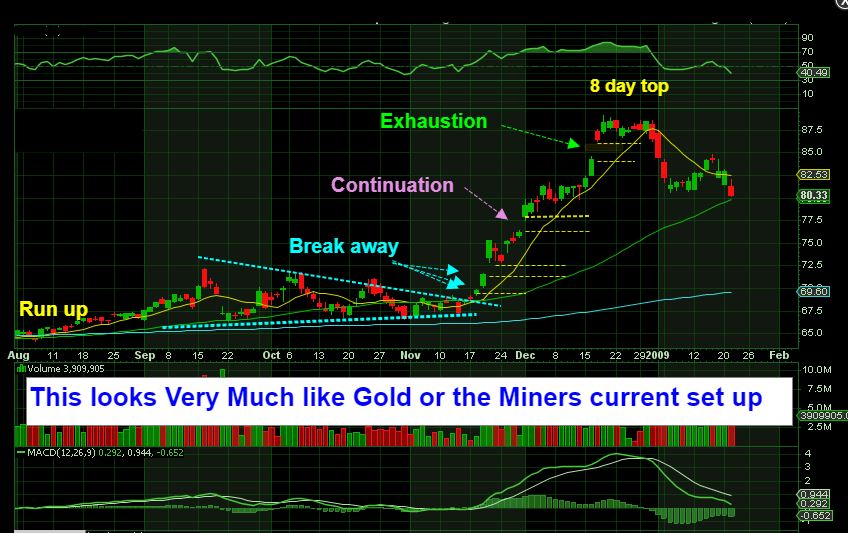
MY EXHAUSTION GAP CHART – Notice the final Gap higher. Price then moved a bit higher for the next 3 days, but then formed an 8 day top. So the Exhaustion Gap was not ‘THE TOP’, but it can signal that the run may have everyone jumping in at once. They Fear Missing the move. If you see an exhaustion gap in one of your stocks? RAISE YOUR STOP or sell some.
.
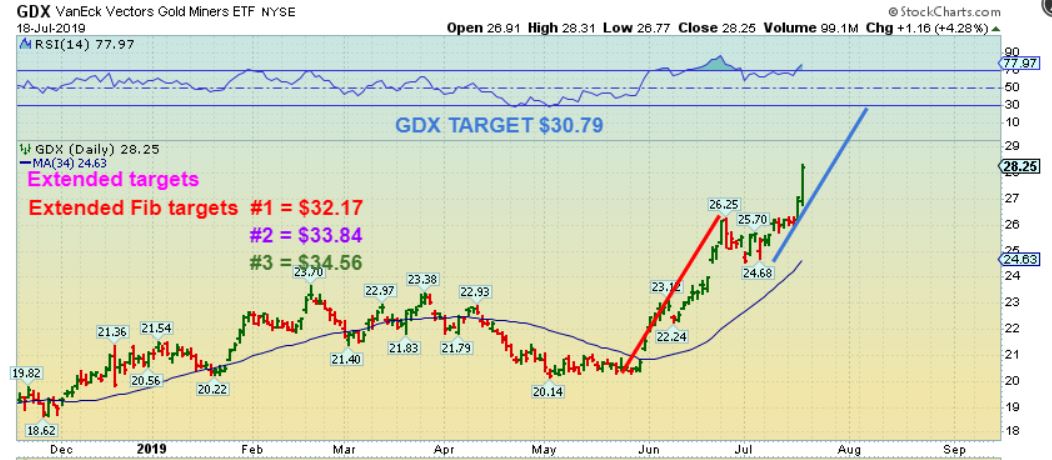
Next I will discuss those Fibonacci extension targets
.
GDX – Though it seems that GDX is extended now, it can run higher. These are my next realistic price targets. $30.79 would be next and that is about $2 away.
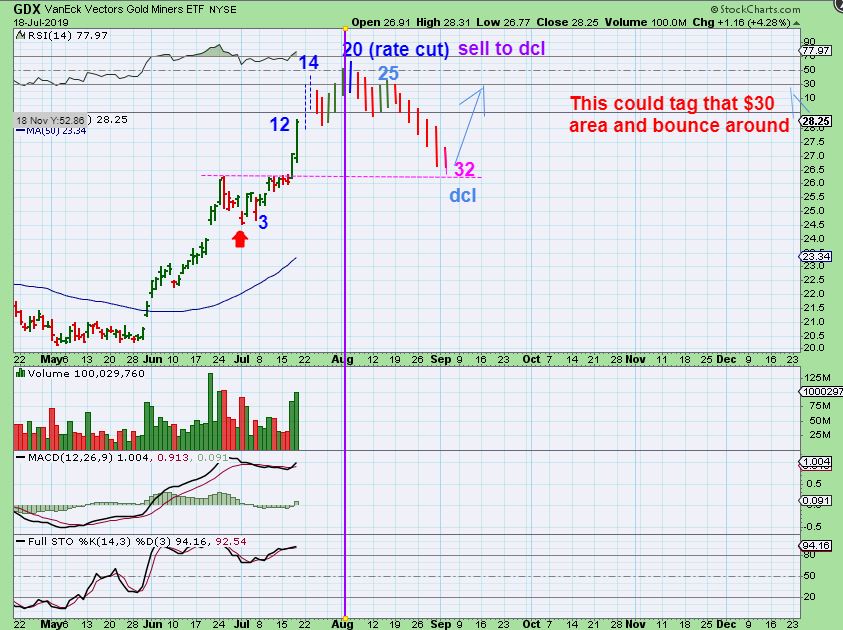
.
GDX – ( This is just 1 of many Guesses). At day 12, we could run to that $30 area soon, dip down, run back up by day 20 or 21 ( FED DAY), and though a rate cut is bullish, it is already figured in. “Sell the news” into a dcl. NOTE: This is drawn for price targets, NOT TIME. This will not drop into September as drawn.
.
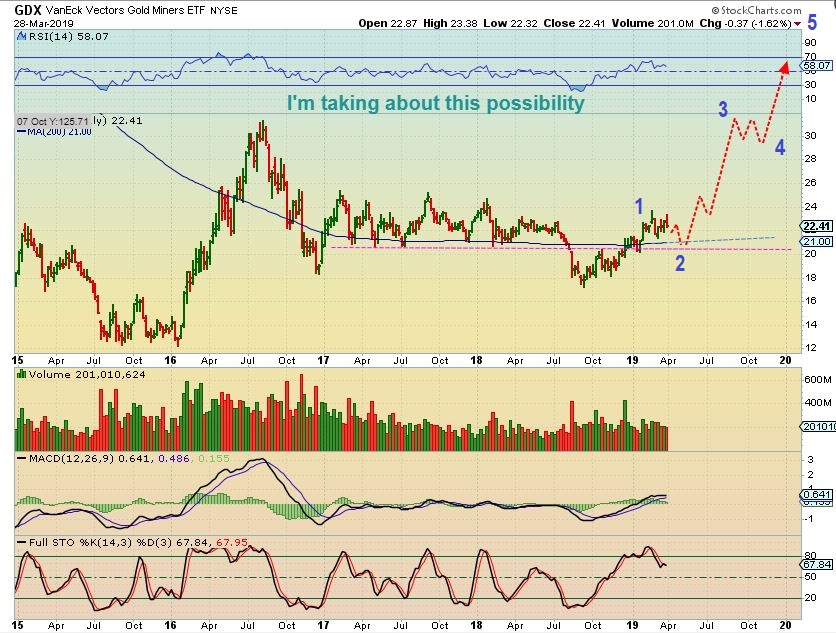
GDX STEP BACK – How many times did I post this chart that I drew in March 🙂 and I would say , ” This is what I expect.”? MANY MANY times. I even added, ” People look at the 2016 run and think it was so easy to ride, but it got choppy at times, and many couldn’t ride it.” Well, this also looks easy to ride, but greed & fear do battle with human emotions. We haven’t even reached ‘3’ yet.
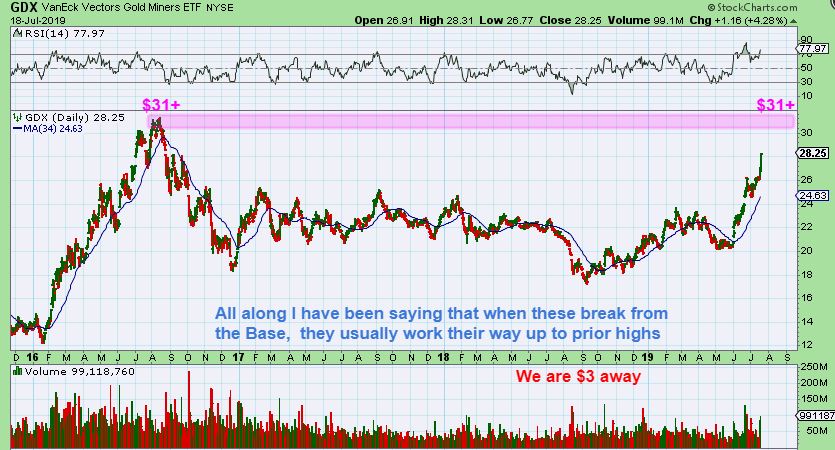
.
GDX STEP BACK – AND HERE WE ARE. 🙂 Does $31 now look possible to you? Yes, and we could hit that on the current daily cycle, or it could happen on the 3rd daily cycle, so I can’t tell you to sell now, but you can sell if you want to.
GDX SAME CHART – Did you notice that in 2016 GDX had an exhaustion gap, then moved a bit higher for a few days, dropped into a dcl, and then made a double top. If you see an exhaustion gap, we may be very close to a top.
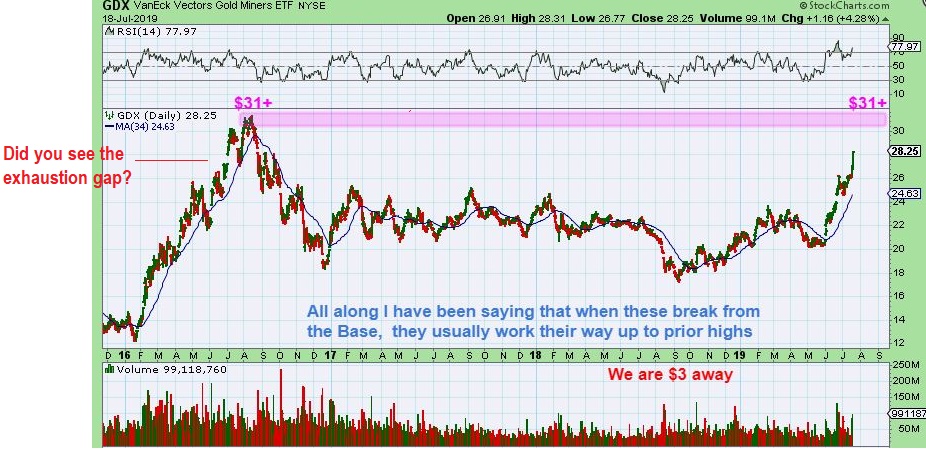
SO THAT SHOULD HELP SOME READERS WITH THERE OUTLOOK FOR SELLING. It looks like we are going higher, but when & how is tricky. THIS daily cycle or the 3rd daily cycle? Time will tell. I have now given you extended price targets, possible exhaustion gaps to look for in our ETFs and even in our Individual Miners, etc. You may see a strong reversal candle after a strong run, that could be a clue. Some here may decide to just ride their individual Miners through the next dcl dip and into the next daily cycle. Others may ‘sell some & hold some’, buying that dip later? The choice is yours. What helps you to sleep at night? Let’s look at individual Miners too, because they all may run differently…
.
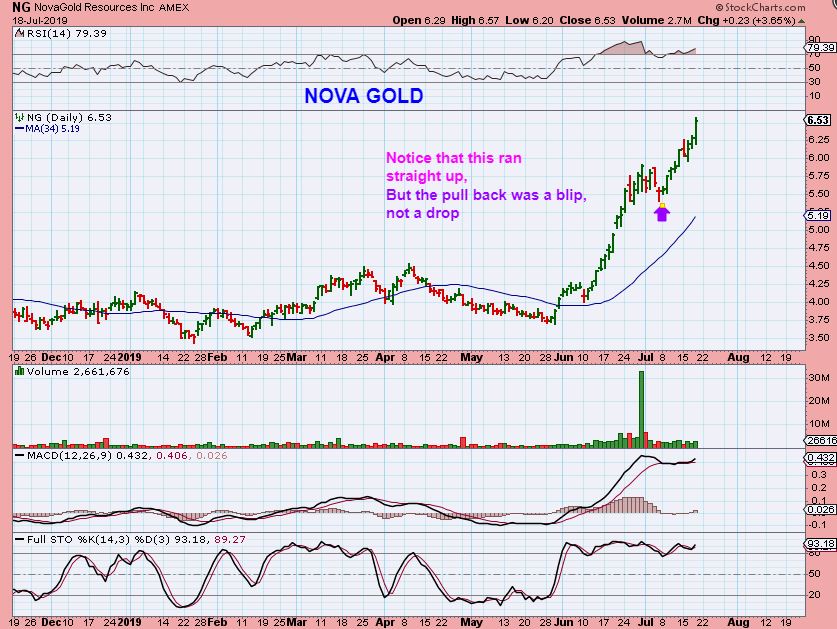
NG – NG, DRD, NGD, and a few others are showing us what Miners can do when they run. On June 27th, if you said, “ALEX, I OWN NG, ALMOST DOUBLED MY MONEY, SHOULD I SELL?”, I would have possibly said, ” It has gone straight up, you may want to sell 1/2.”. THEN IT TOOK OFF HIGHER AGAIN….Would you be happy with me? No. That wasn’t the top. That is why I leave it up to you to decide where you would be happy selling. You have these & other choices…
1. Let it ride with a trailing stop under the 10 sma?
2. Sell some on the way up & ride the rest for 3-4 months, add on dips?
3. Sell extended ones and buy ones just breaking higher?
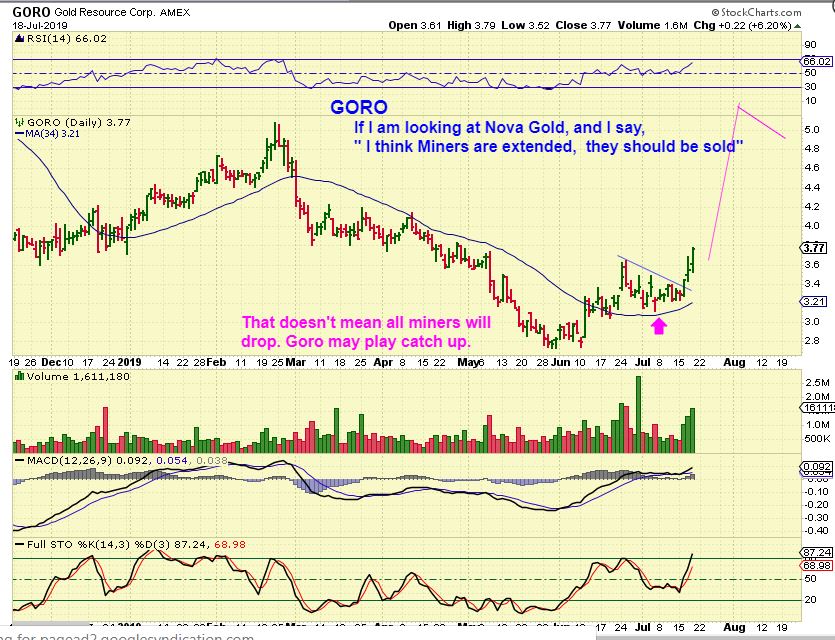
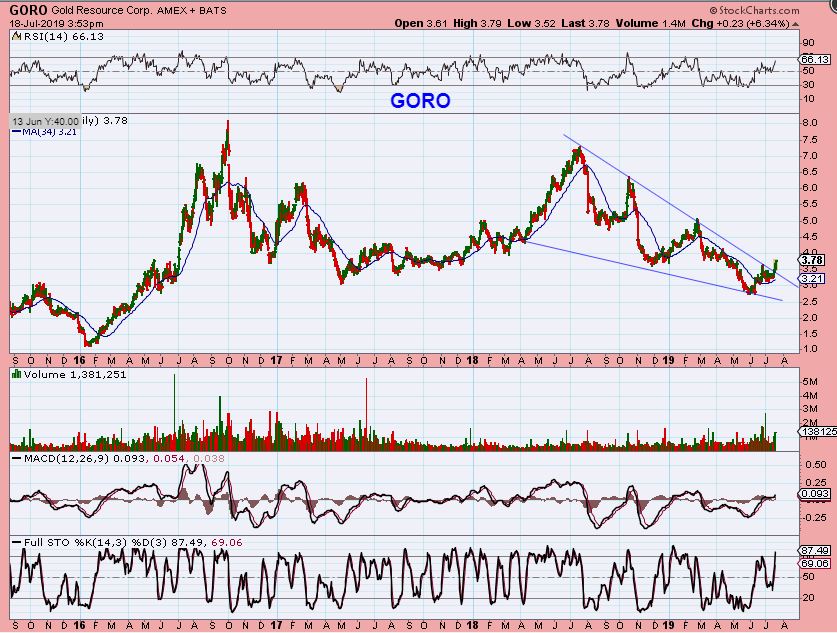
GORO – If you look at NG, it looks extended, but GORO looks like it is just getting going, right? A laggard. So my point is that each miner needs to be viewed individually. GORO may be just starting to run to build that large CUP now.
.
GORO – And for some, they may want to just BUY & HOLD through the first 3 daily cycles and see where this goes.
.
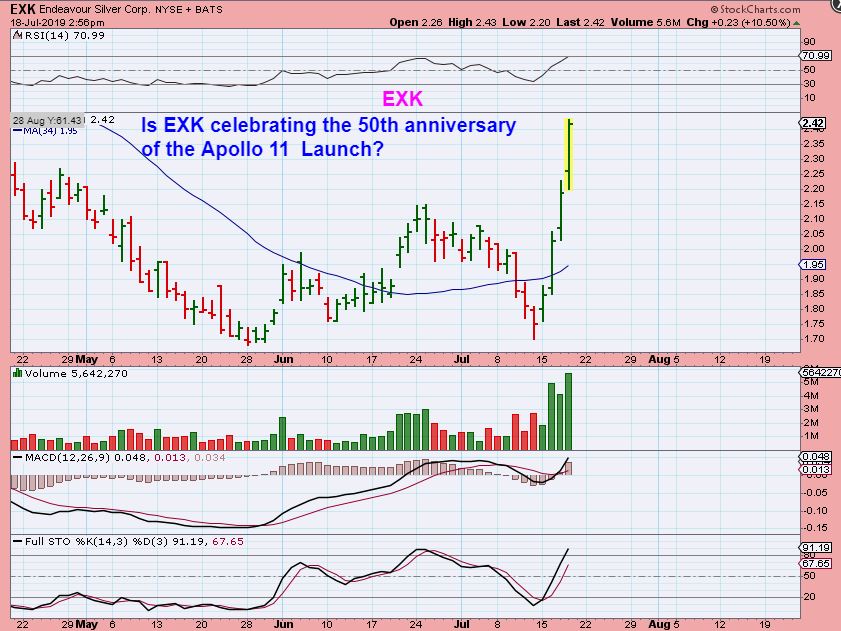
EXK – Just 5 days ago EXK looked UGLY, then I called it a buy with that reversal and it has exploded higher. It is still not extremely overbought, so sell here after 3 Strong days higher or not? I can’t tell you if this will end today or not, but …
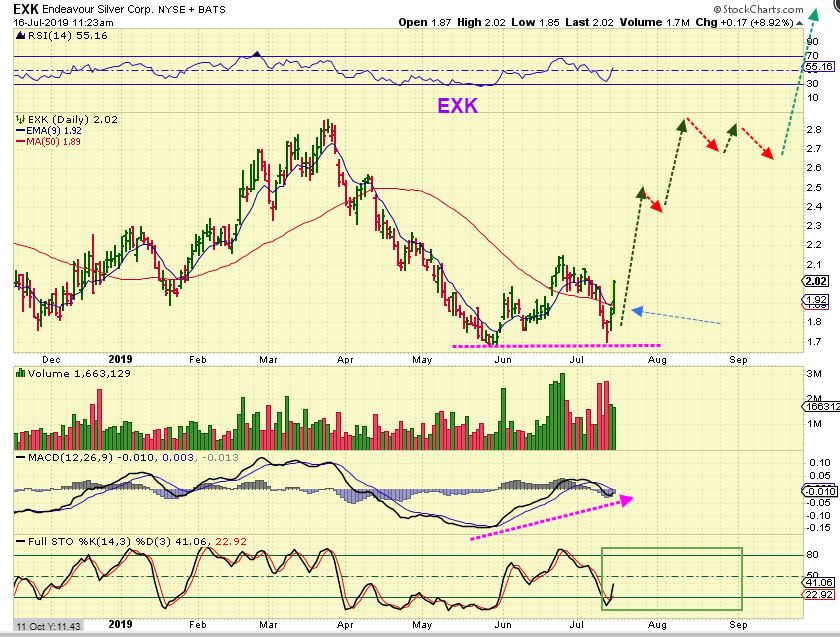
EXK – I posted this July 16 to encourage some buy & hold. You may just want to buy & hold some and see where it is when all is said and done. This was showing EXK running to prior highs at $2.80, and today it already hit $2.46.
.
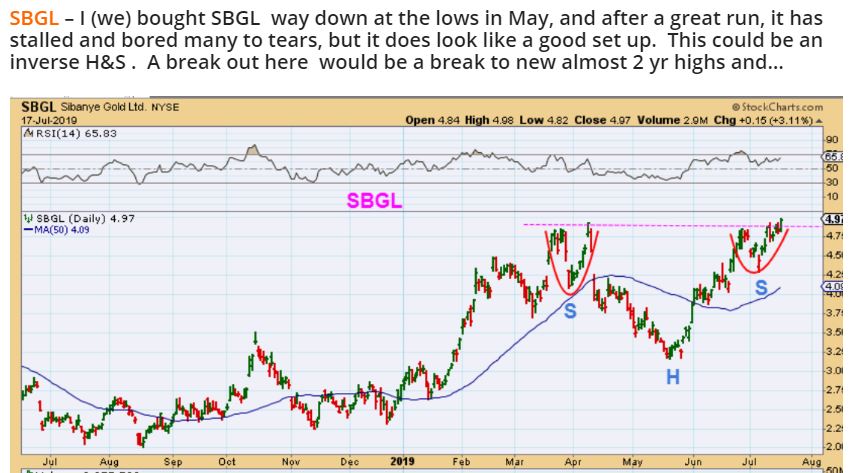
SBGL – Yesterday I posted that SBGL looks ready to break out from this inverse H&S. I posted this…
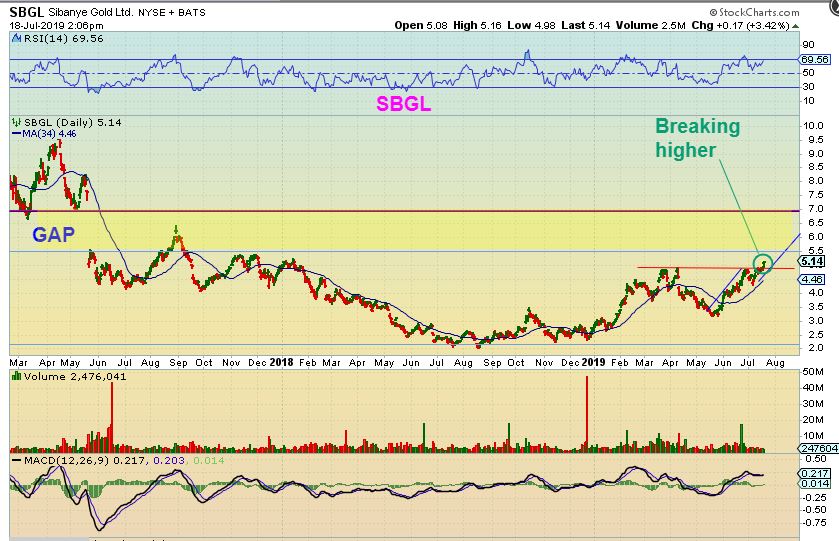
SBGL – It started to break out, so again, these seem to be running at their own pace and this looks like a buy & hold, not a sell.
.
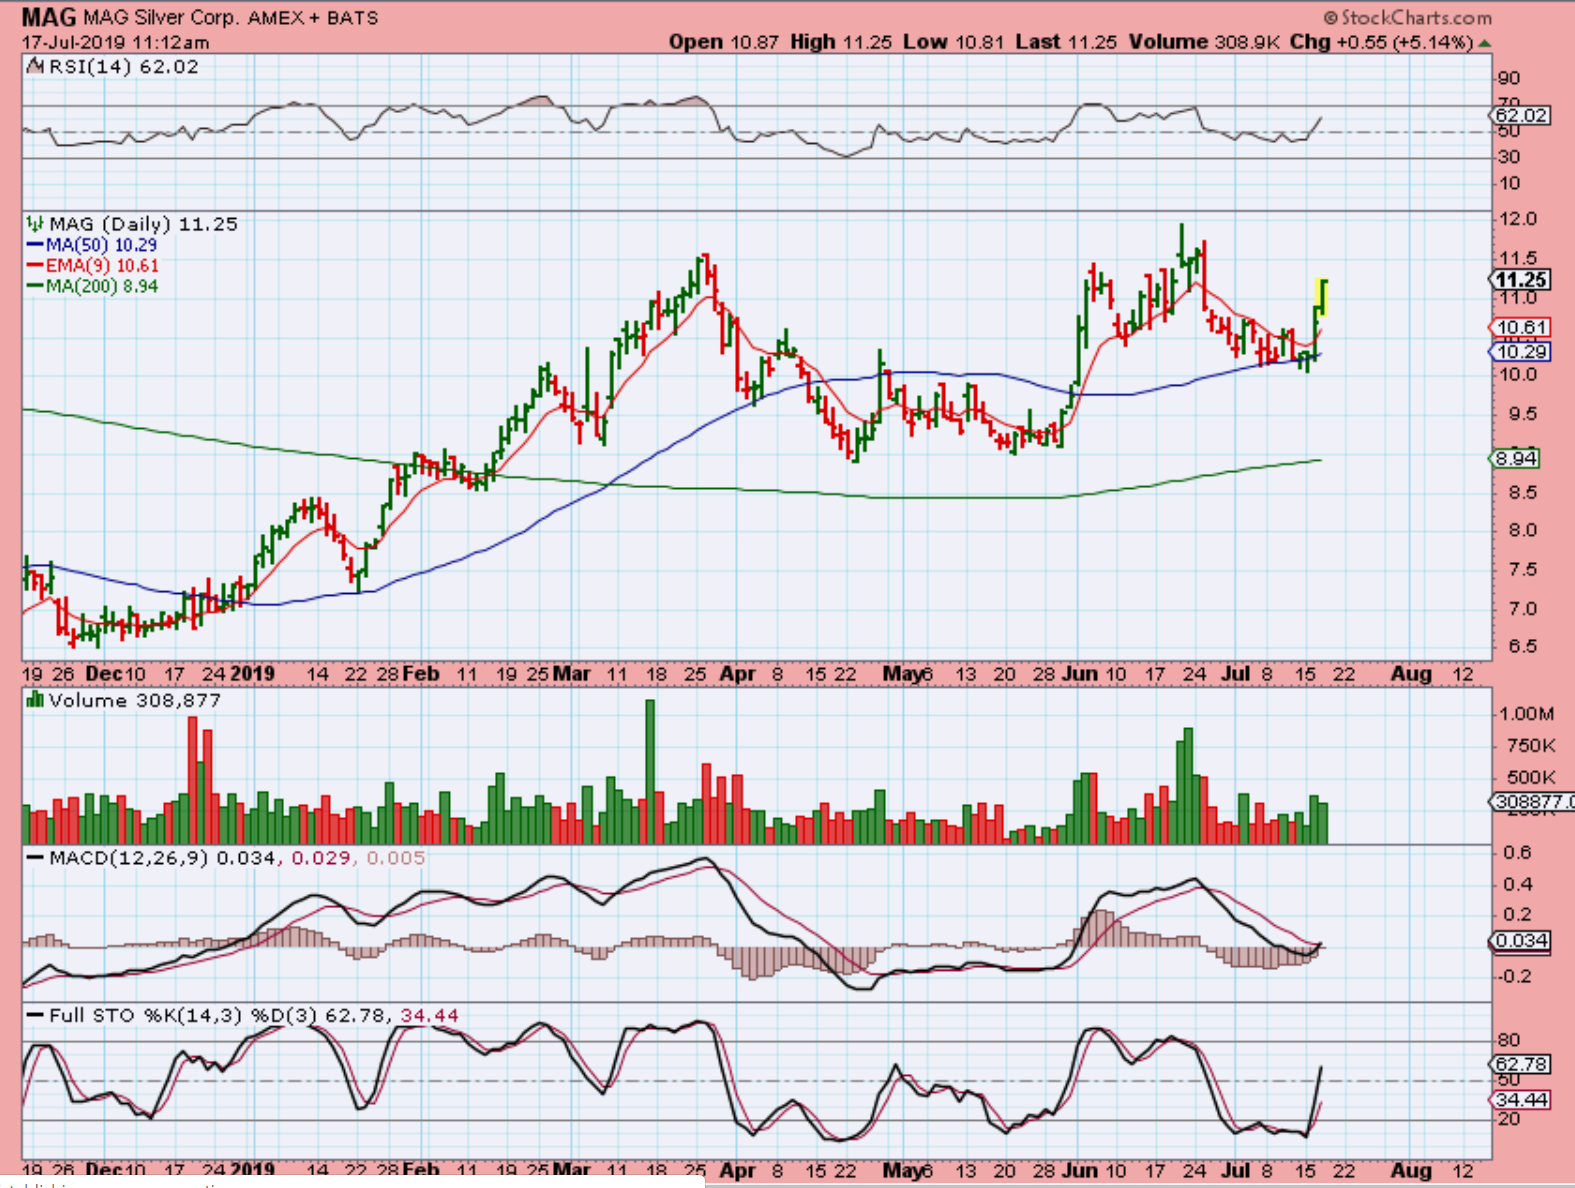
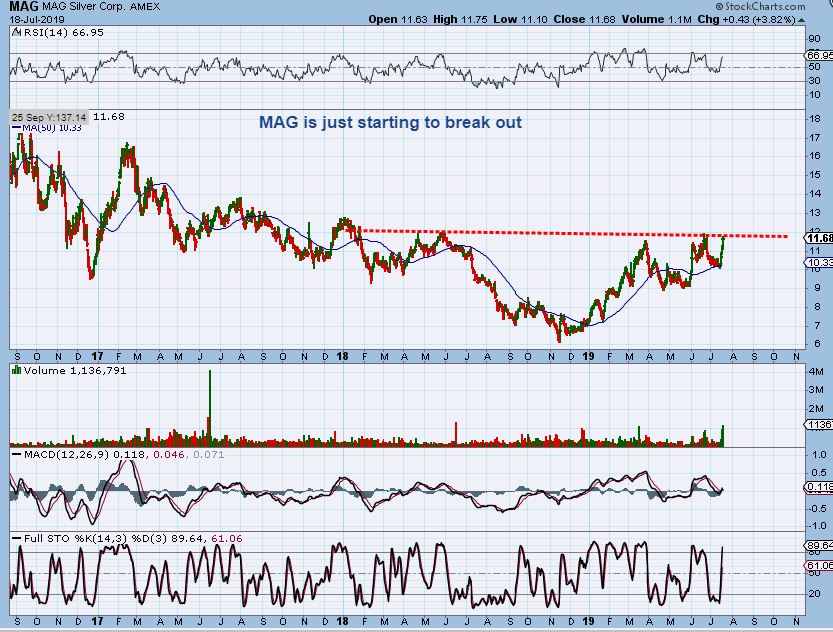
MAG- MAG was posted as a buy at the 50sma, and this chart was posted as an additional Buy. Why could it still be bought? It ran excellently on the prior run, but also…
.
MAG – It is also a large base that can break out & start trending higher. I could see where this could double into the end of the year.
.
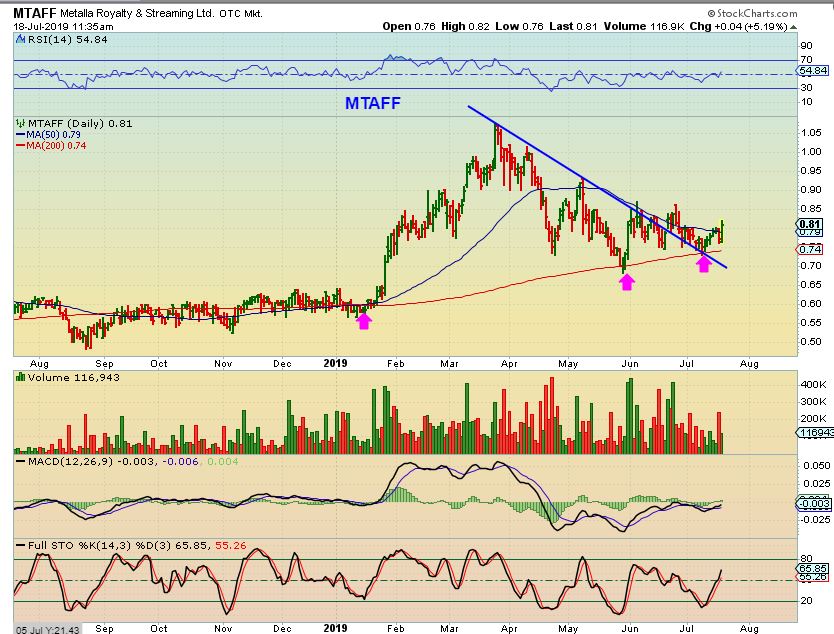
MTAFF – MARK mentioned this one in the live discussion area Thursday (Thx Mark) . It is a streaming & Royalty company, and I really liked that chart. It can be bought here with a stop at the 200sma. (This is a low priced OTC stock, some may not like that, but it trades in Canada too and could seek to be listed in the US later. You may want to put it on a watch list ).
.
I am going to discuss just a little more about Selling or BUY & HOLD in the weekend report, but today I wanted to give a few more price targets for GDX, to answer emails about selling and “Could this be the top?”. I also showed how individual Miners need to be analyzed on their own, since they are all moving differently. If you are not trying to buy & just hold through most of the intermediate Cycle, then You need to decide when to sell ‘a partial’ or all of each individual stock. You will not get the exact top, but clues mentioned here may get you out close to the top, and a TRAILING STOP will always protect a portion of your current gains.

