
Weekend Report July 13th
I loved what the Close on Friday did to our charts, so let’s get right into the weekend wrap up…
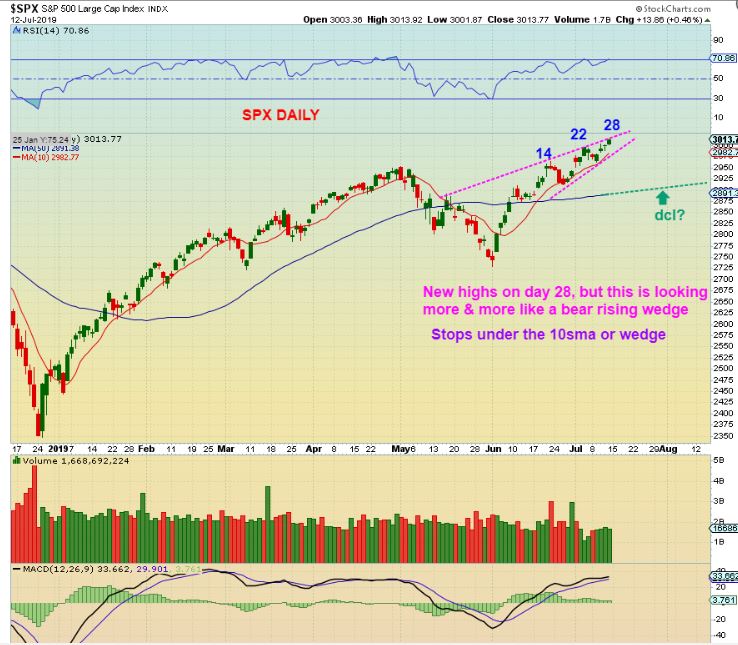
SPX – The SPX is hitting a new high, but I would raise / tighten my stops. This was day 28, a wedge continued to form, and a dcl will be coming due. That DCL can be bought with a stop, since this is the first daily cycle and right translated. In recent reports I expressed that I was concerned about the TRANS PORTS…
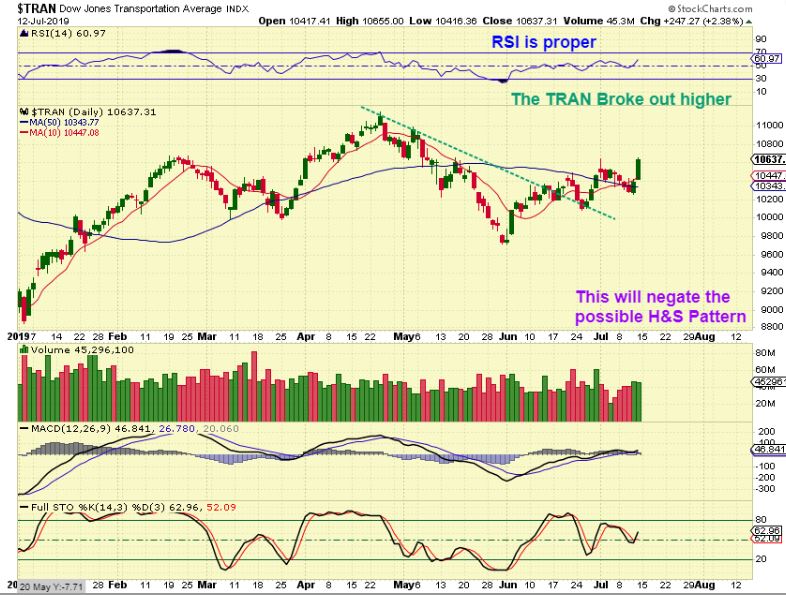
TRAN – looking like a H&S ready to break down, the Transports Popped 2.38% Friday. Now the transports look ready to move toward their former highs. When Transports move, I always tend to check airline stocks for clues…
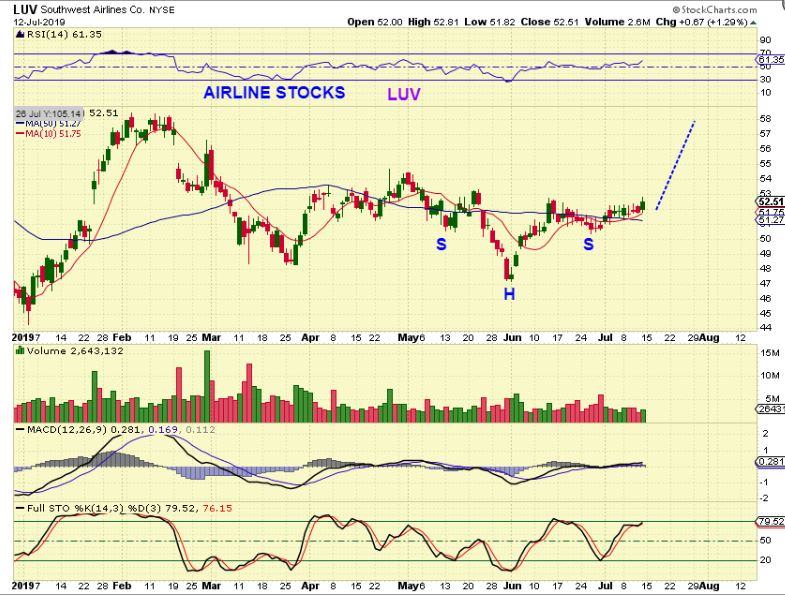
AIRLINES ( LUV) – Southwest Air does look like a potential Buy here with a stop under the 50sma.
.
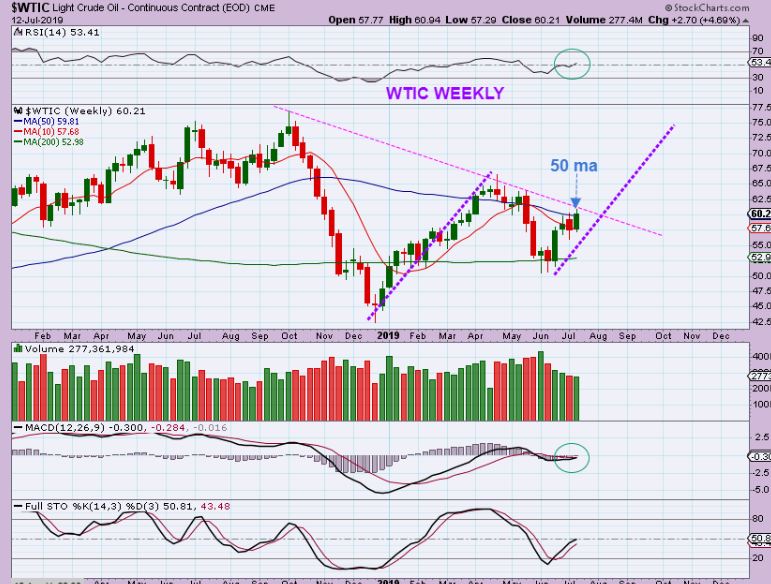
WTIC – Oils daily chart broke through resistance, but on this weekly chart, price is pushing on the 50 week ma. If it can break out, Oil does have the potential to put in a second leg higher that matches the first one. The weekly MACD & RSI and a few other indicators are improving.
.
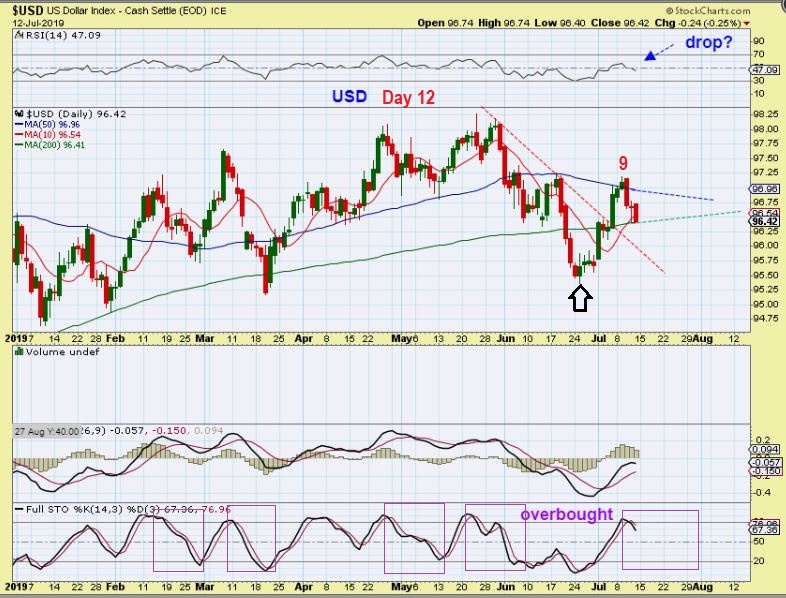
USD DAILY – I do not get solid clues in the daily or weekly USD chart. In other words, I find the USD CHART to be NEUTRAL in many ways. I’ll explain. Using Cycles, we are on day 9 and it looks like a ‘peak’. That would allow for days of lower prices and the stochastics agrees. There is downside potential and that would cause a Gold Break out of its flag. However…
.
We also broke a down trend line & that Could have been an ICL in June. If so, that low won’t be broken and we may just tag that trend line as a back test & then turn higher. If that was NOT an ICL, the USD can sell off for weeks and break those lows as Gold rallies upward. I need more time for the USD to play out. This looks neutral.
.
COT: If you don’t understand the COT readings or you don’t care, you can skip the next 2 charts. Basically all I am pointing out here is that during Bull Runs in Gold, I have found that the COT does act a bit differently than we see during Bear markets or sideways consolidations.
.
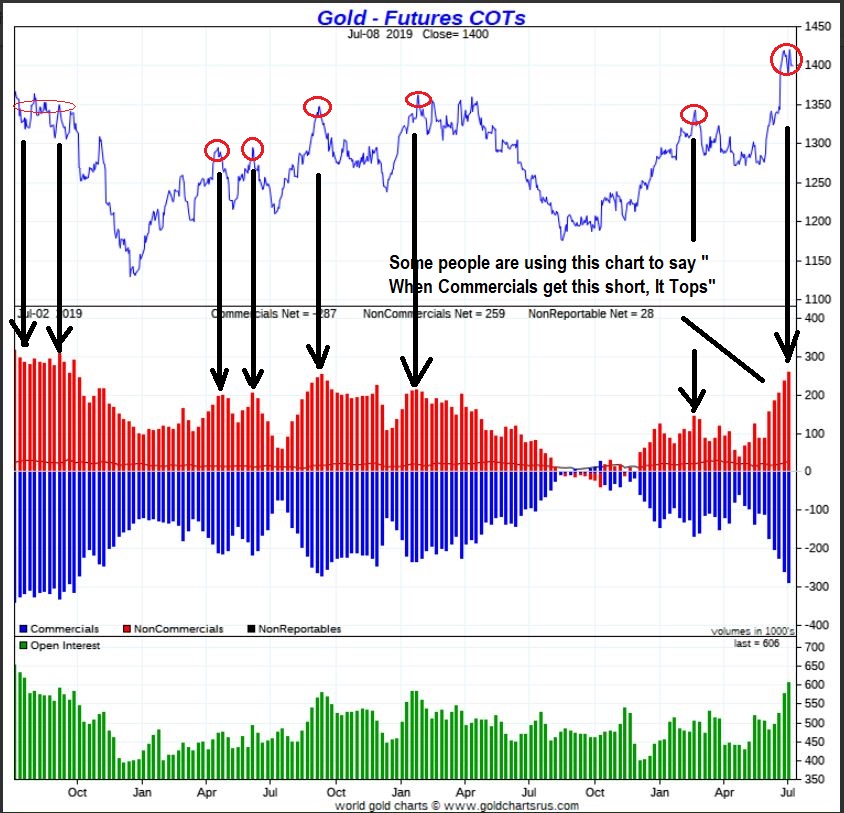
GOLD & THE COT – I have seen people use this chart and say that when the COT Large specs are this high, combined with the Commercial Short positions being this high, the top is in (see the chart) . I discussed this weeks ago, but I will address it 1 more time…
.
The Commercial Shorts can stay elevated under the right conditions and in the past they have during a Gold Bull Run. I DO NOT sell because of this elevated COT, I just use stops.
.
GOLD & THE COT – During the Bull rally, you can see that from especially from 2008-2011 the COT SHORTS & Large Spec Longs became elevated and stayed that way for long periods of time. During what could be considered MILD ICL DIPS, the COT changed slightly (See mainly the long purple arrows pointing out mild ICL dips in that multiyear run). The COT shorts were elevated & hardly changed.
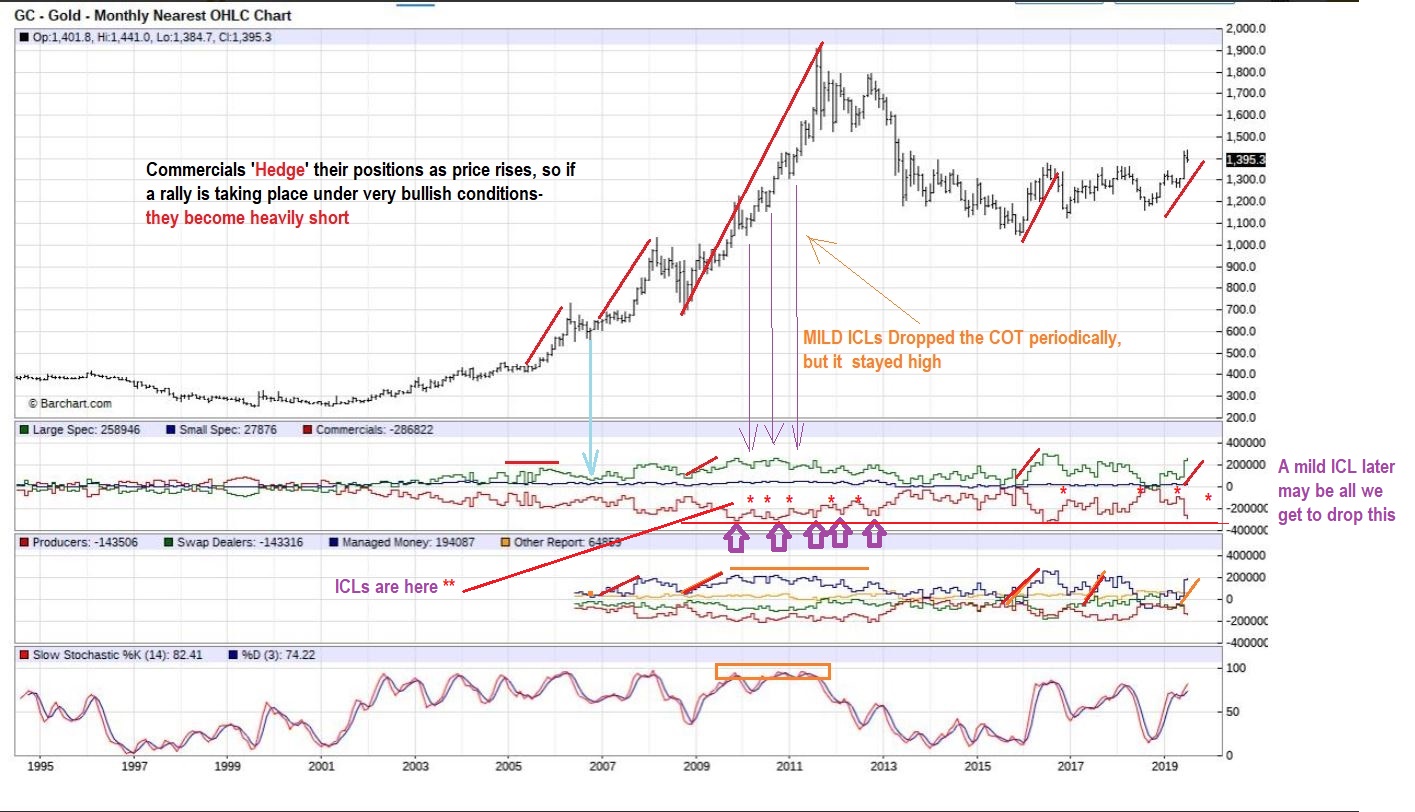
Conclusion: Basically, during Bull Runs, I have found that the COT does act a bit differently than we see in Bear markets or sideways consolidations.
.
GOLD, SILVER, AND THE MINERS
.
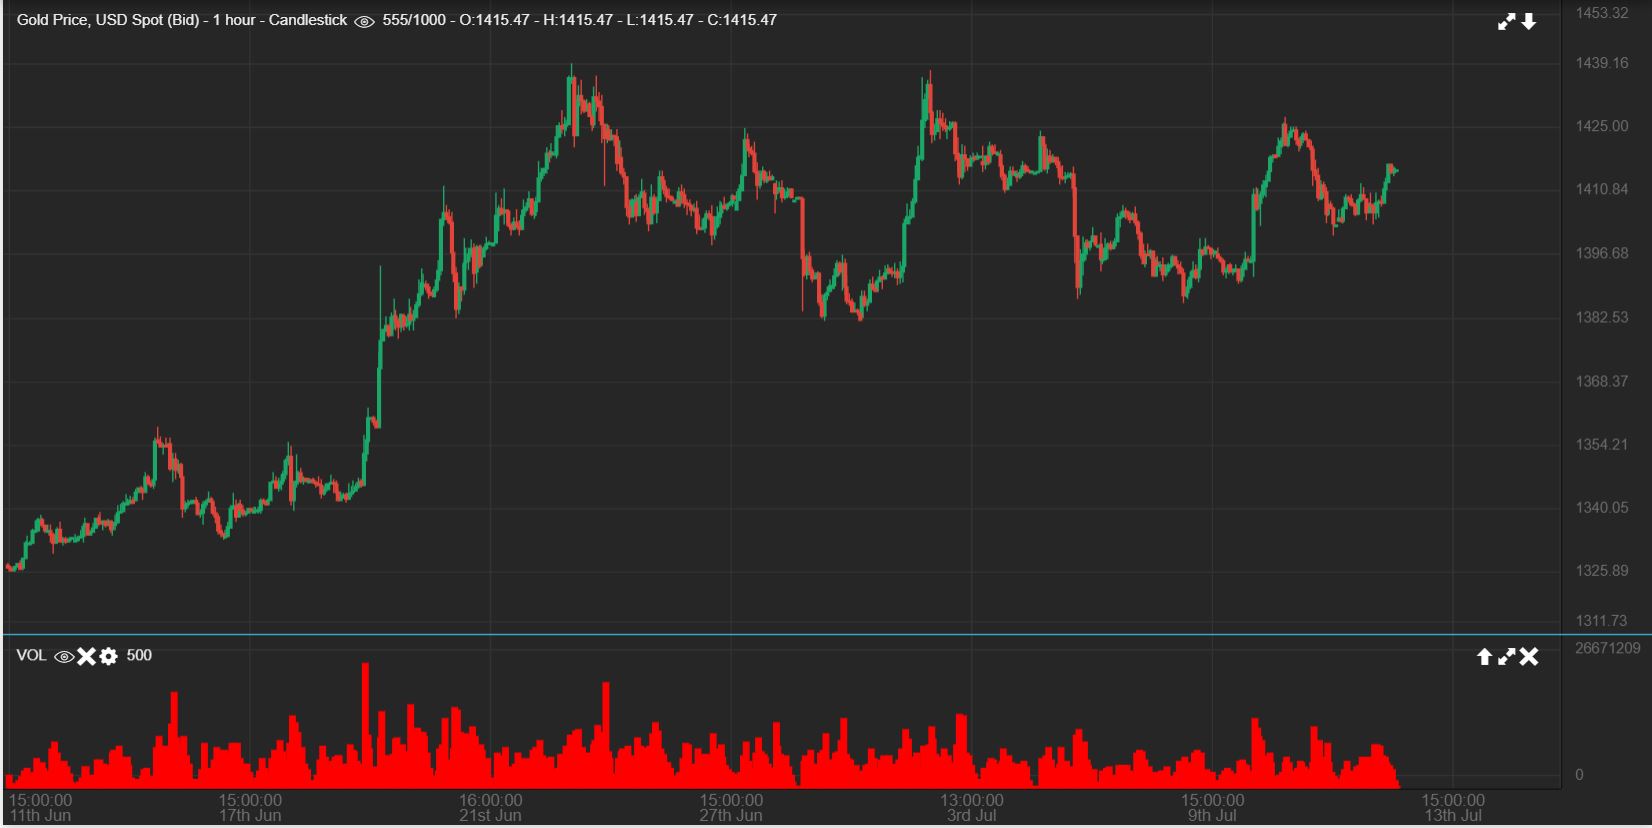
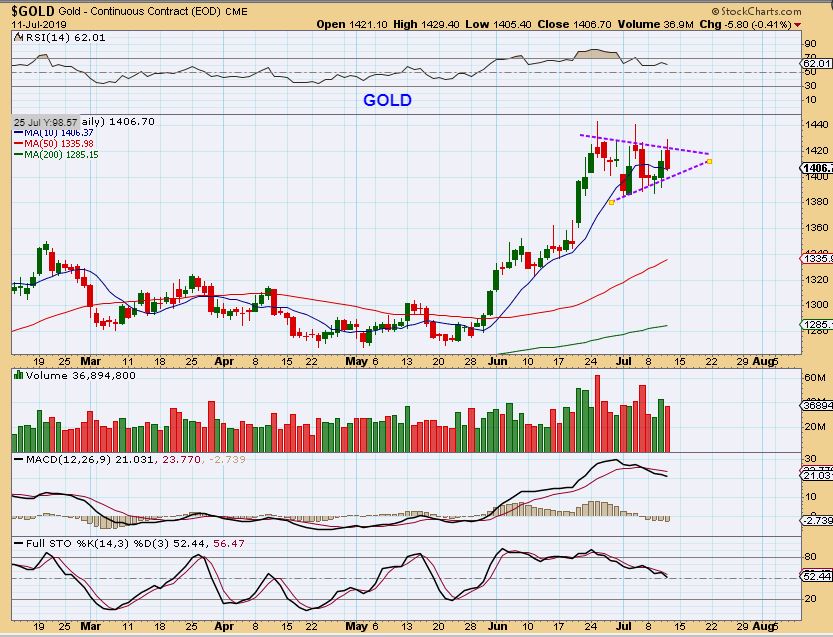
Daily Gold Consolidation looking like a Bull Flag – This can break out at anytime, and I am expecting a break higher.
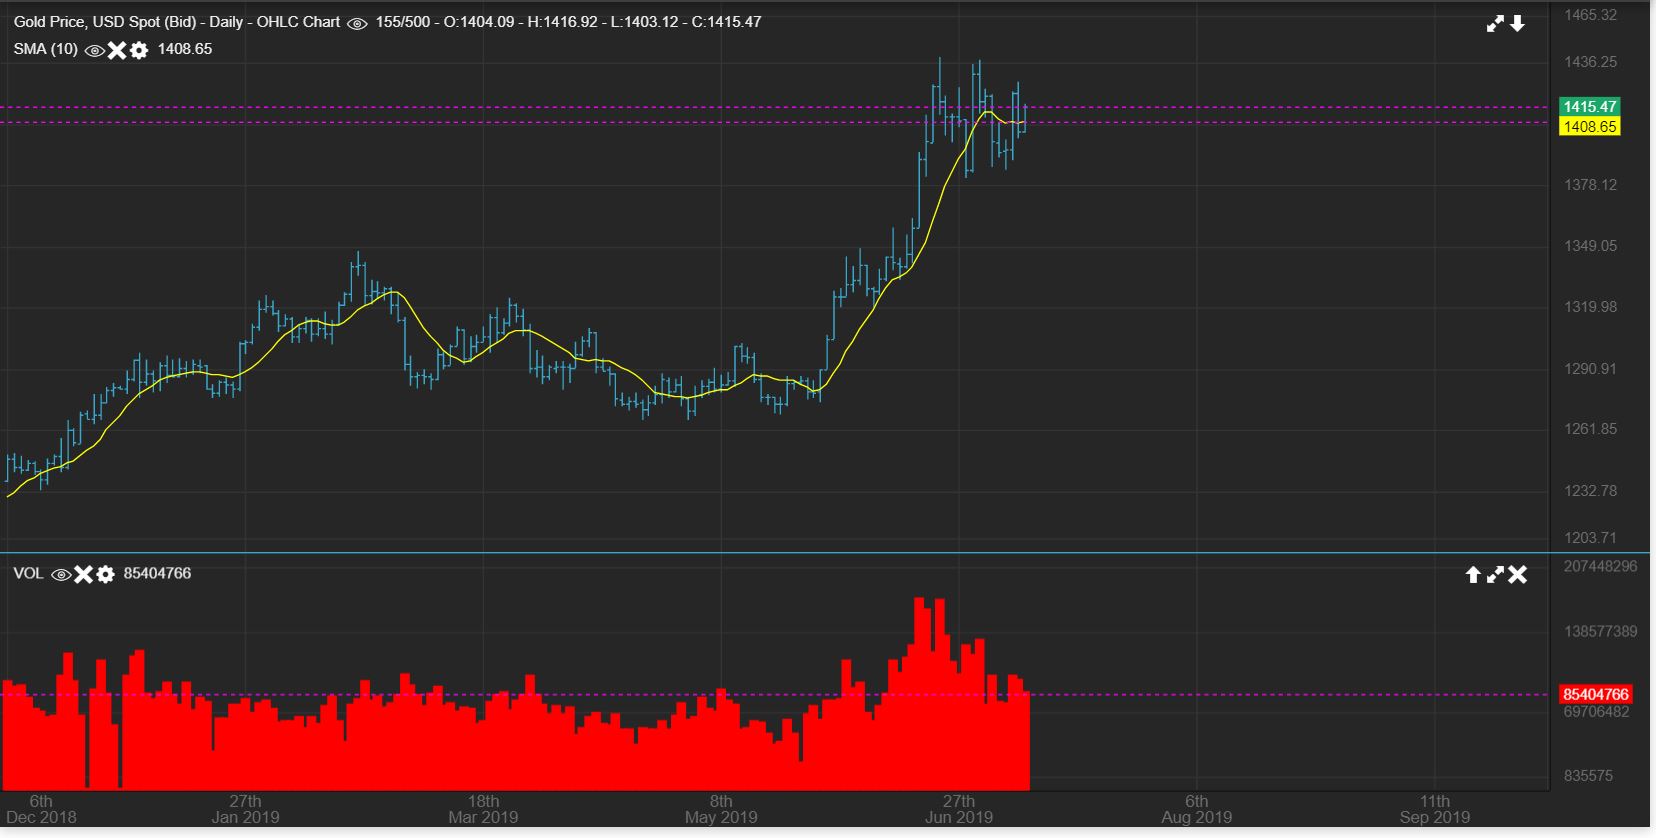
GOLD Consolidation close up looking like a Bull Flag (1 hr chart) – I see a repeating pattern that will eventually stop repeating, but I wanted to point it out at this point. There are 2 bigger RED DROPS on this chart…
What I noticed was that they came on a Monday & a Friday – The also came right after a convincing looking break out from a wedge. Follow along on the chart…
1. Descending wedge break out & POP. Then it dropped Monday
2. Descending wedge break out & POP. Then it dropped Friday
3. Currently we have a descending wedge break out & POP… Next comes Monday..
4. Read the chart
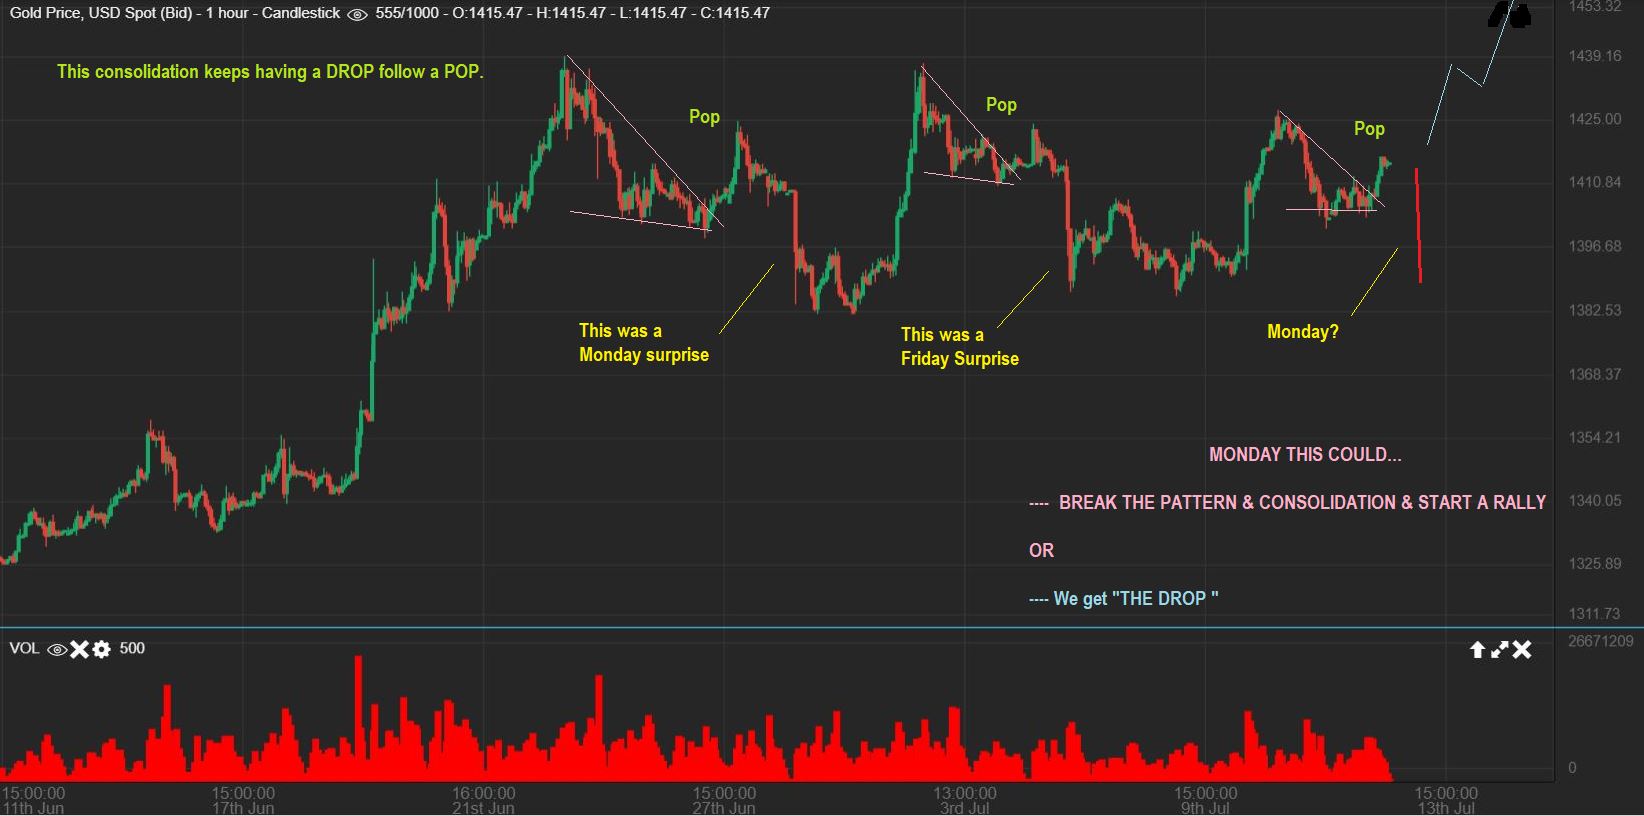
A break & run higher is possible, but if that pattern repeats?…
,
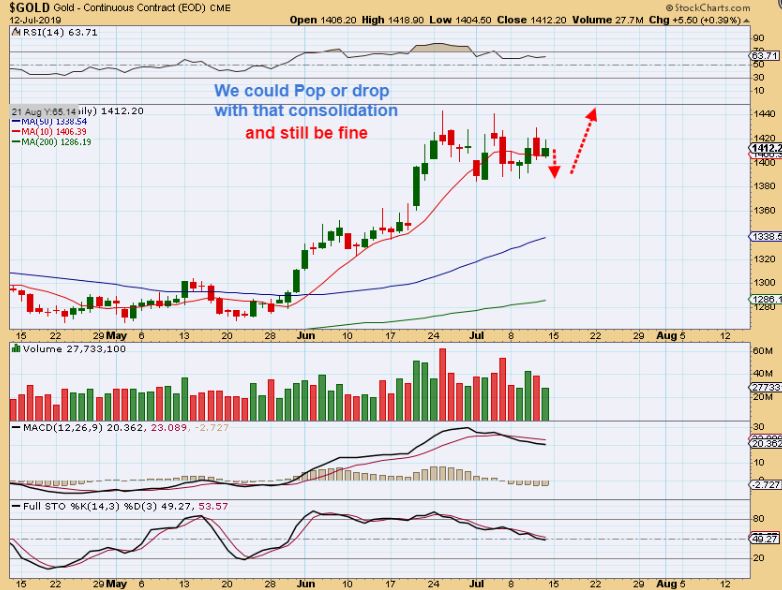
GOLD – So IF IF IF That consolidation did drop on Monday, I just wanted to show that it could still be fine. If it breaks higher instead, we party!
.
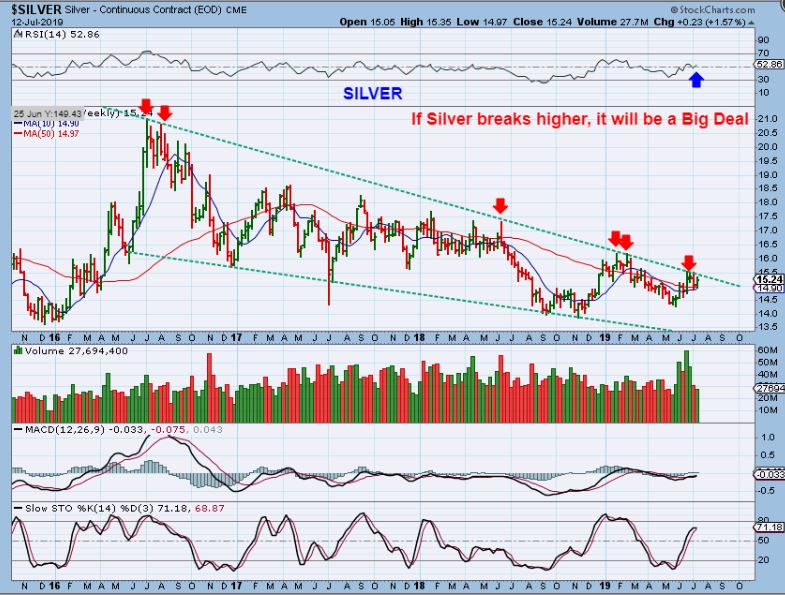
SILVER – Silver is so close to a major break out, it could happen next week. Volume is swelling, shorts may be piling in for a drop, and this could get very exciting next week. If Gold breaks higher Sunday night, Silver could break out.
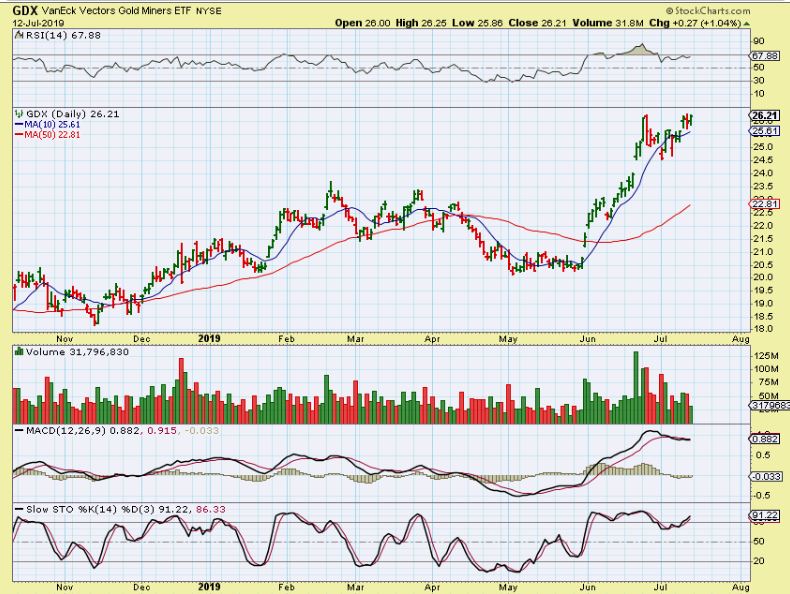
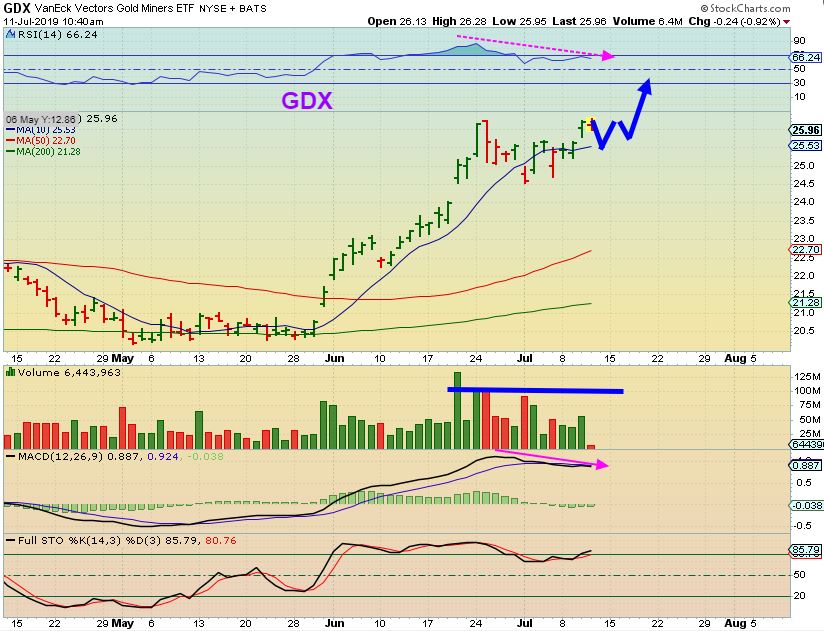
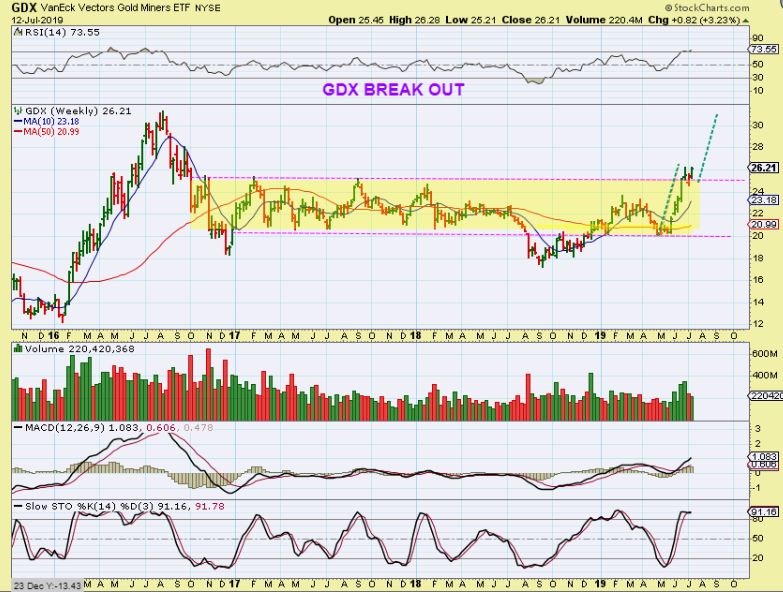
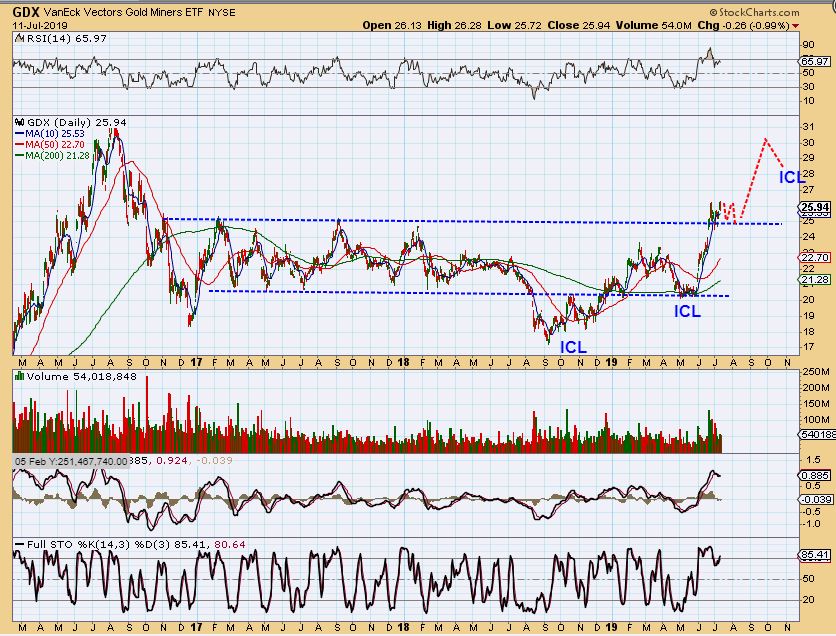
GDX – GDX ran slowly higher into the close Friday, and THAT IS EXCELLENT. I was really hoping for that, because…
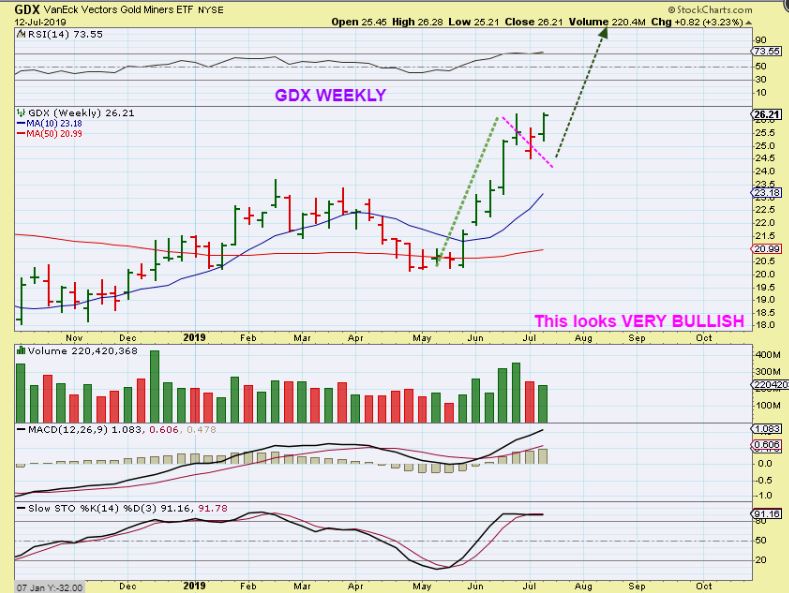
GDX – That close near the highs made the weekly charts look very bullish. It looks like a 1 week dip and possible continuation. I have called that a dcl, and this looks very good if that is the case.
GDX – We can still get this Chop, because the run up Friday was very light volume, but if Gold & Silver break higher, GDX would likely get a surge of volume too.
GDX – Even with a dip Monday & Tuesday, GDX could close higher next week. It would look something like this by the end of the week.
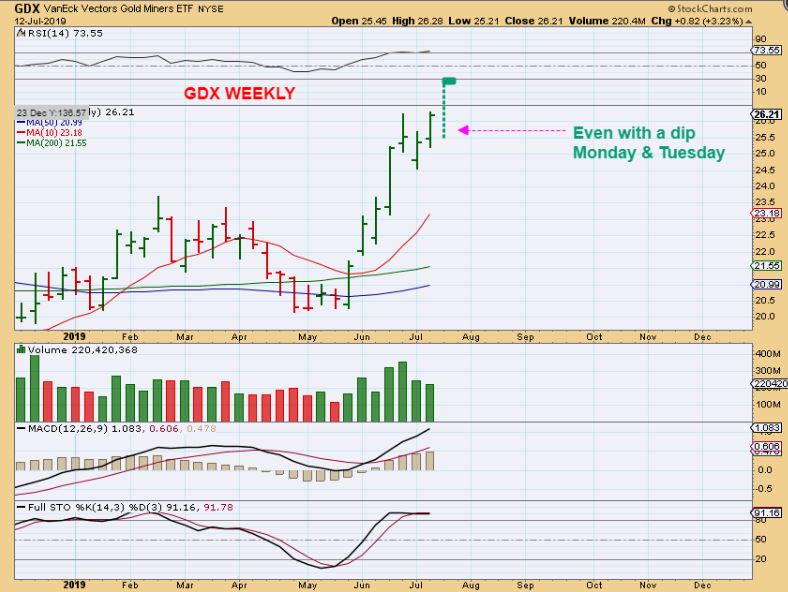
GDX – So in other words, The BIG PICTURE IS STILL A BEAUTIFUL CHART BREAKING OUT.
,
I love the set up and the way the Precious Metals are playing out. Believe it or not, I still see people wanting to sell, and buyers reluctant to buy. THAT IS WHAT YOU WANT TO SEE. I’m not saying that it can’t pull back, but what we are seeing is exactly what we wanted to see. That chart above is Beautiful, and some people still won’t buy it.
.
If Gold breaks out Next week, and Silver breaks out, we could have an excellent week of gains, because the Miners look ready to go too. Rest up, enjoy your weekend, and we’ll see what next weeks ride on the Bull brings our way. Whether it is bucking upward or downward then, it is still a Bull Run at this point.
.
Have a great weekend!
.
~ALEX
.
You may recall that in Fridays report I said that readers had written and asked, “Is there any way that you can see this failing?” I said that I give it a 5% chance, but there is always a way that things can fail in the markets. I will explain that here for everyone, but please understand that I am expecting higher prices with the current set up. Nothing has changed. IF IT CHANGES, we’ll react. We should have stops in place that would allow us to still lock in great gains from this past multi-week run.
.
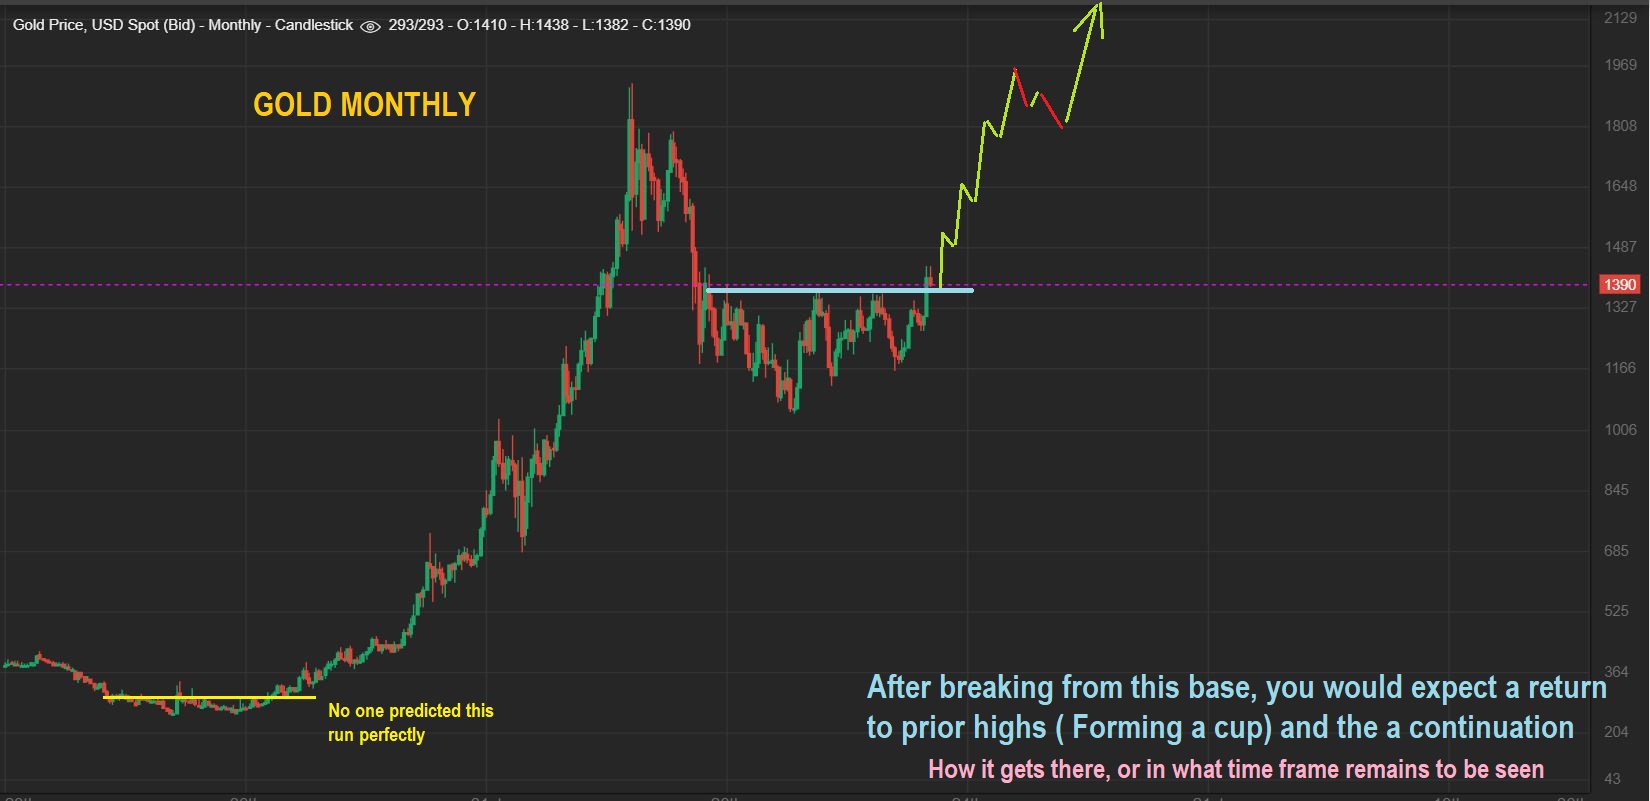
GOLD BIG PICTURE – I want to START this discussion with what I am expecting. It can be choppy, run from the break in the other base was very rewarding, but quite choppy over time.
Now for that question:
.
Question : ‘ This set up looks almost too perfect and I feel like everyone can see it. Is there any possible way that you can see this going south?’
.
Answer: I don’t think that any trade is 100% guaranteed, but this set up has MANY reasons to believe that it is BULLISH going forward. Since nothing is 100% guaranteed, I do look at both sides of things always. Yes, it could fail, but at this point, that would be at about a 5% chance that that happens. If the Bull Flag in Gold broke down and the USD rallied, that would increase the chances of failure. That is less likely, and if it happens, we’d lock in gains, But how could that happen? …
.
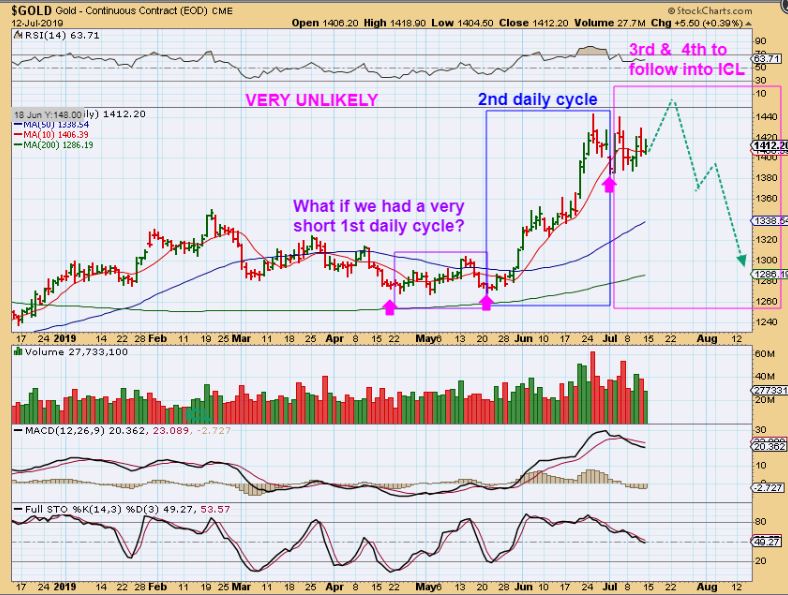
GOLD CYCLE COUNT: A cycle count like this in hindsight could cause us to peak on this daily cycle on light volume & then start selling down as the USD rallies out of an ICL. This is NOT LIKELY IN MY OPINION…
.
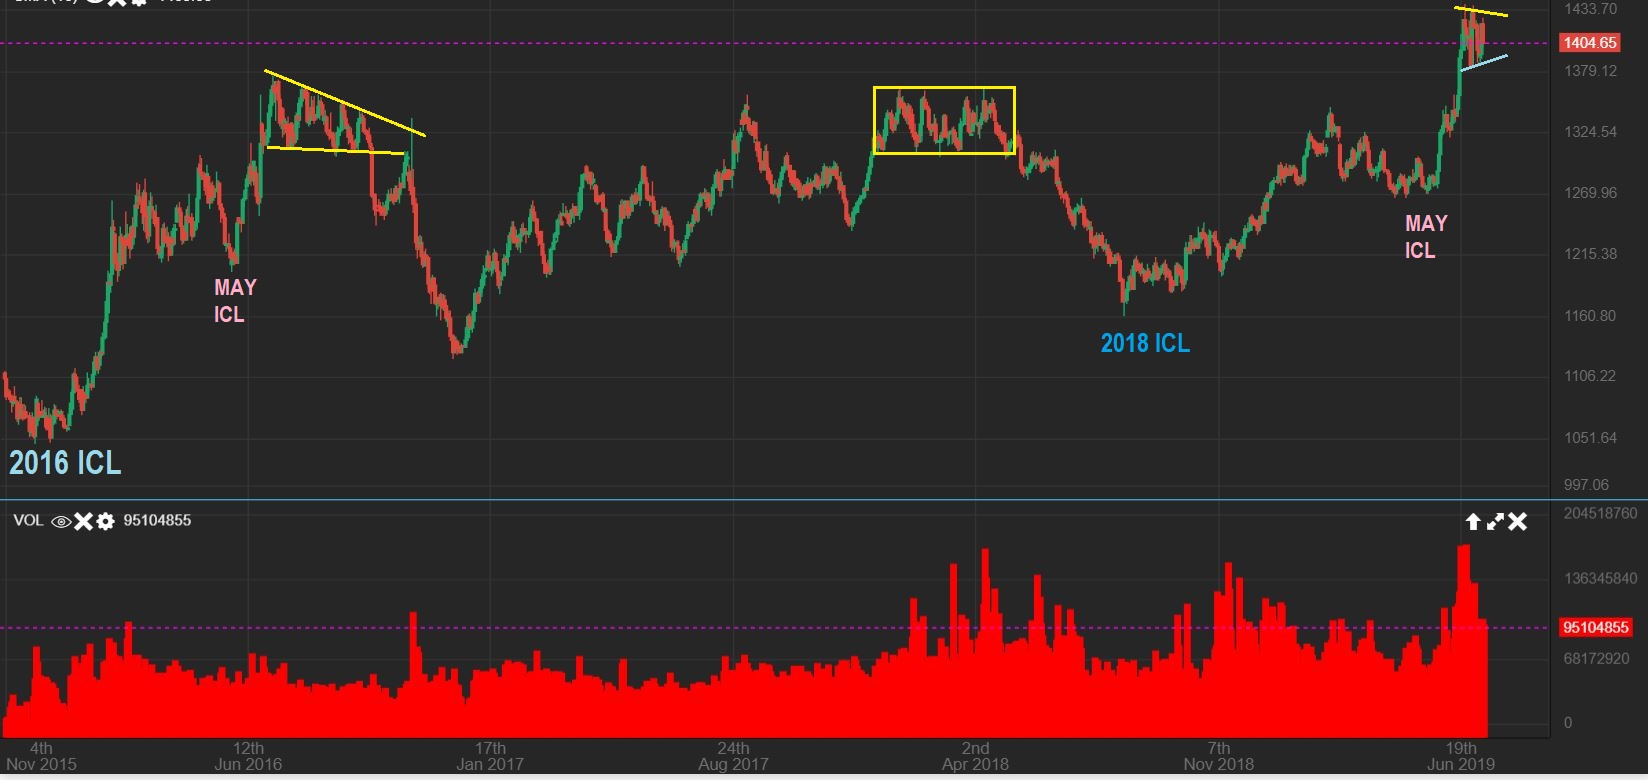
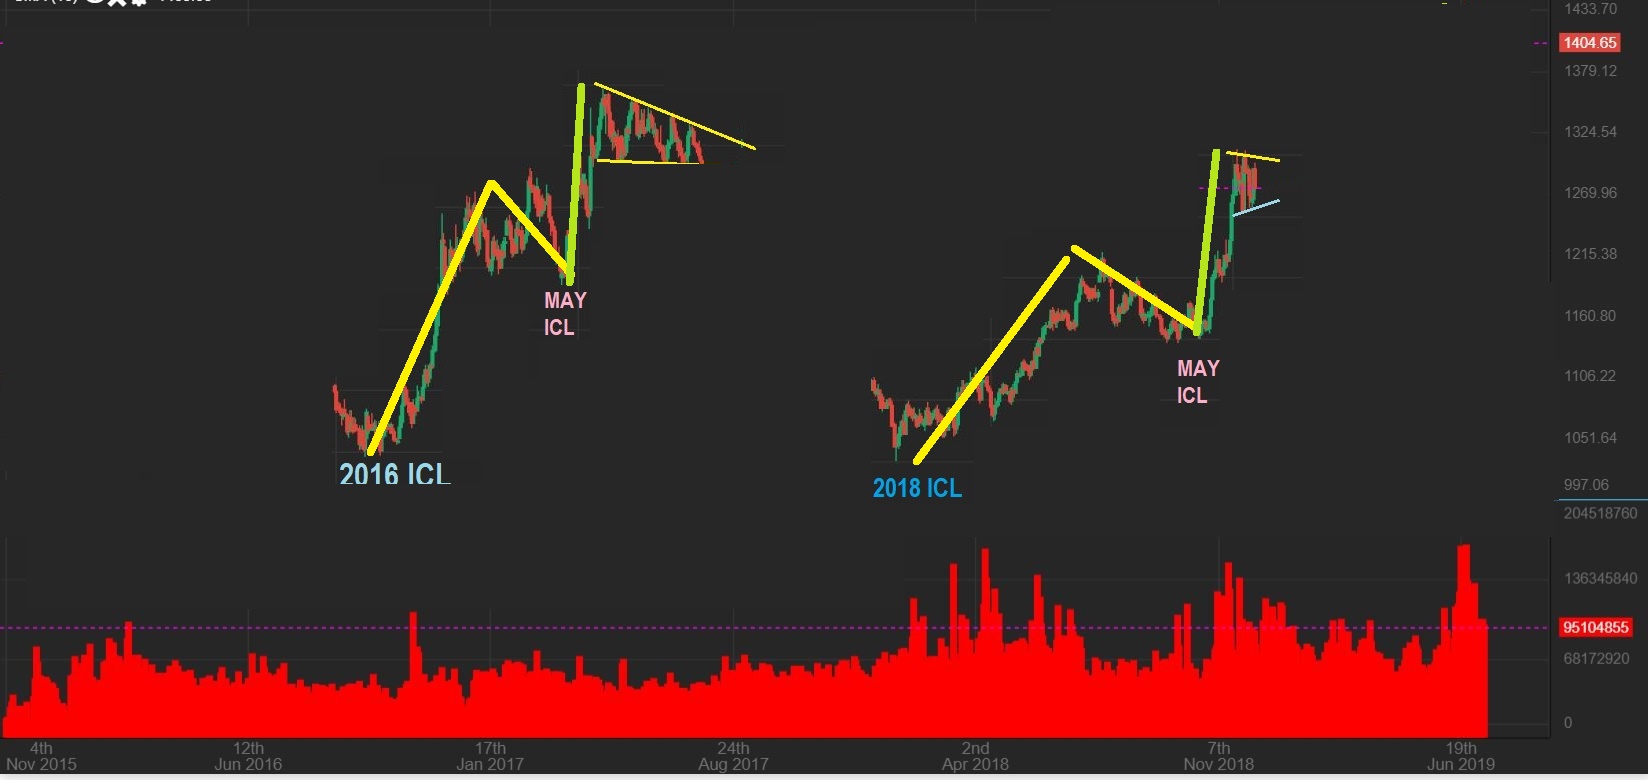
GOLD 2016 to now – This chart also shows how GOLD could fail from here. Not an absolute failure, just prolonging things as it drops to the next ICL. Do not let this discussion concern you, I find this unlikely.
1. In 2016 – I see the first ICL has a nice run higher and then a choppy move into the next higher May ICL. I see that now too.
2. Then notice the strong ramp up out of the May 2016 ICL peaked on the 2nd daily cycle, and then a choppy flag, I see that now too.
3. In 2016, that flag of the 2nd Intermediate cycle failed & broke down instead of up.
.
GOLD – Someone could argue the case that every time gold rallies to this point, it gets choppy and eventually gets worn out & drops into an ICL. We see 3 yellow examples here. Also the 2016 Rally looks very similar to the current one. IN FACT…
I Cut out the middle movement and this current run does look very similar to the 2016 Rally, we just need more chop for a longer flag. Obviously a Break Higher is what we need, and the sooner the better. ALEX, CAN YOU PLEASE TELL ME WHY I SHOULDN’T WORRY?
.
ALEX, CAN YOU PLEASE TELL ME WHY I SHOULDN’T WORRY?
.
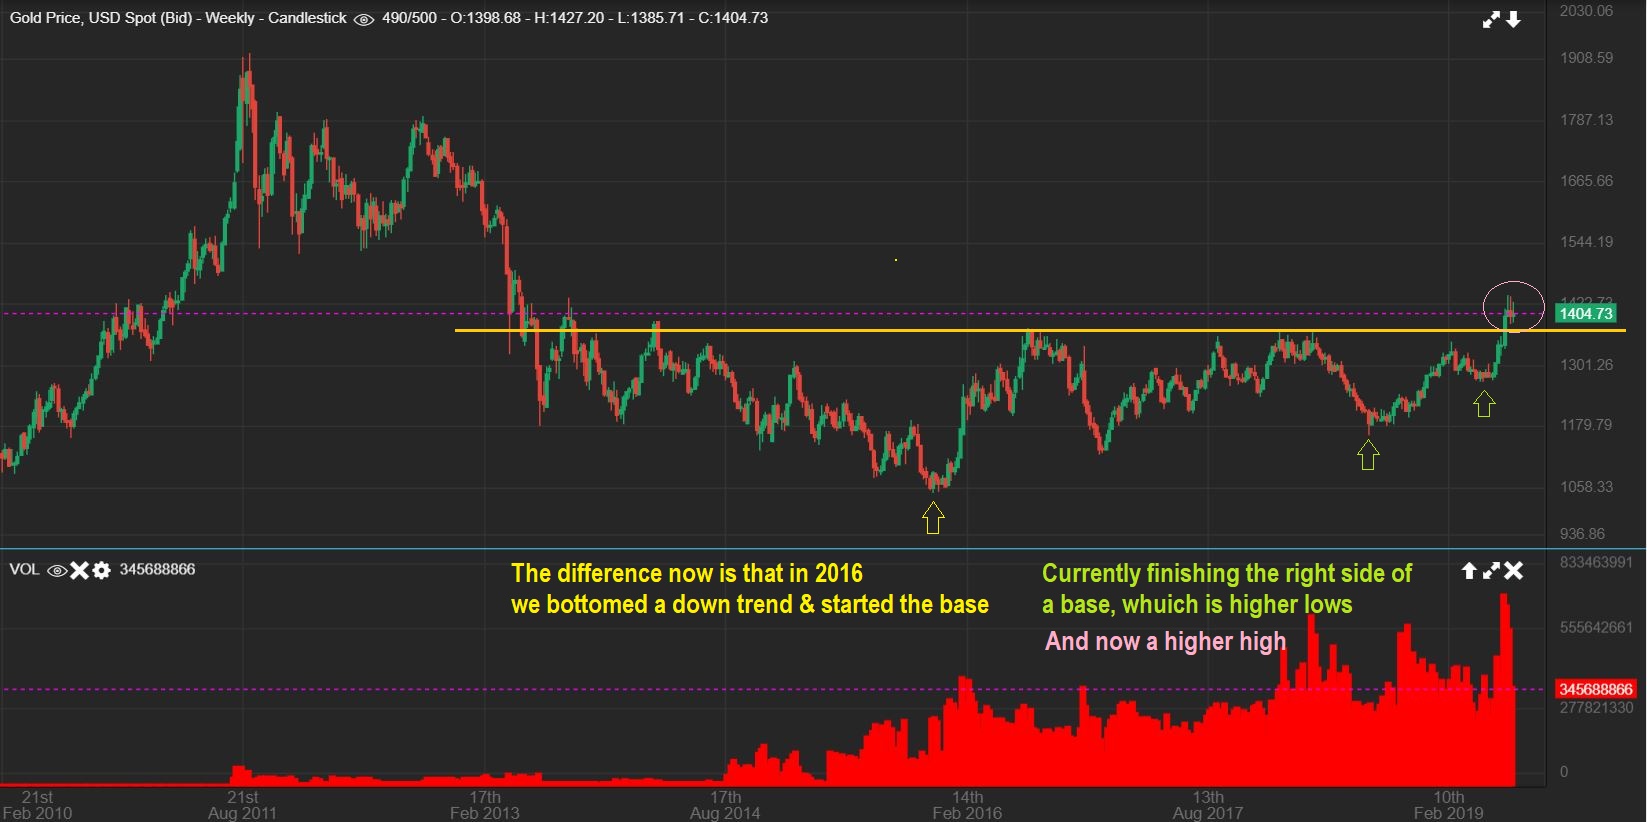
GOLD – It is not really the same ‘set up’ at this point.
1. This honestly was not ‘a run to resistance that stalled & chops’ like past runs were. This is a ‘Break out above resistance’ and possible back test. At this point, This is very bullish.
2. Also 2016 was a drop to a bear market low, and the Base had only formed its left side. We currently have put in Higher lows now with the ICLs, and formed the right side of that base . The last 2 ICLs are much higher than 2016 ICL.
3. IF our cycle count is correct, we are also only on day 8 of the 2nd daily cycle. That means that following a very Right Translated First Daily Cycle, we are waiting for this Bull Flag to break out higher in the 2nd daily cycle after consolidating the recent run up gains. Read the chart.
.
SO CLOSING ON A BULLISH NOT – THIS IS A BULLISH BULL FLAG.
.
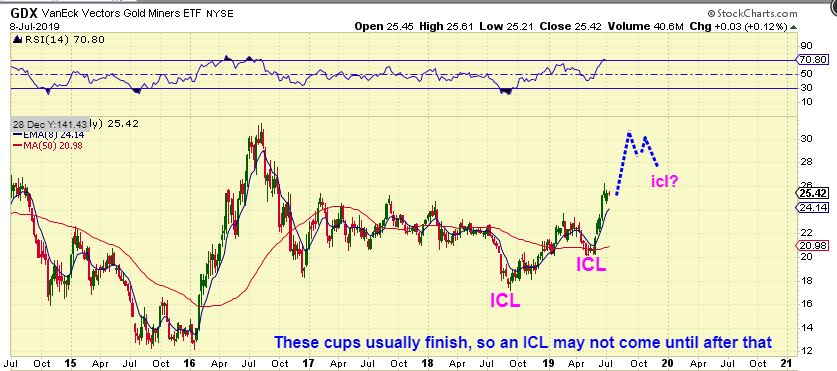
GDX & GDXJ are also breaking up above the prior highs from a multiyear base consolidation. This can get so bullish that your accounts will continue to reflect excellent gains, if you don’t bail out too early.
.
From a recent report:
GDX & GDXJ – At 2&1/2 yr highs, a choppy flag formation cannot be ruled out after breaking out of this base. This is boring, frustrating, and on a day to day basis, it concerns many traders. This remains bullish above this break out.
And the BIGGER PICTURE is one that has potential for all of us to make great gains over the coming Weeks, Months, and most likely even Years! Use stops, raise stops, and ….Try to enjoy the bumpy ride until we get to our destination.

