
July 2nd- No Major Surprises Yet
There were no Major Surprises as the Markets entered July, but I do have a few things to discuss with our current markets, so lets get to the charts…
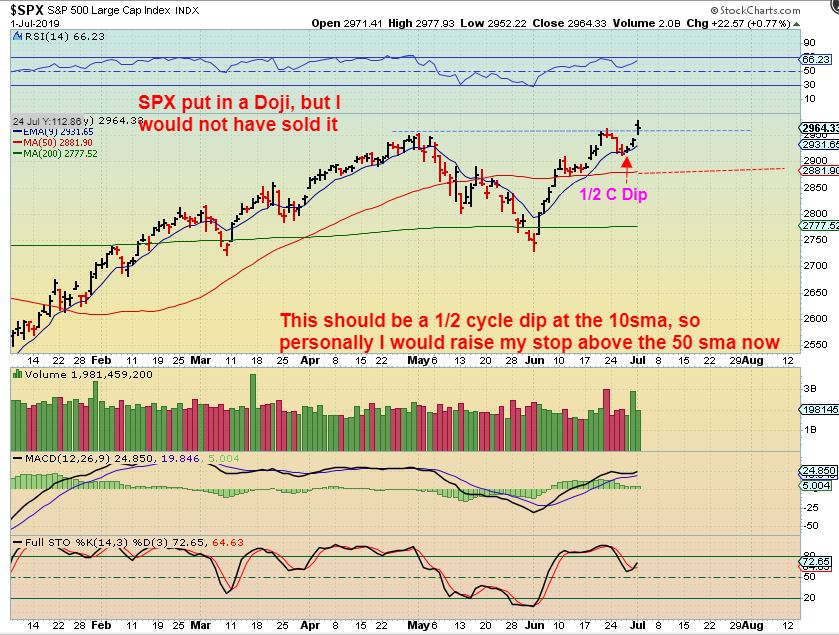
SPX – 4 things to discuss here :
1. That looks like we had a 1/2 cycle dip, the chart looks bullish
2. I like the MACD & RSI – also looking Bullish
3. The SPX broke to new highs (but it could not hold, and that Doji can be concerning ). Not really bullish.
4. I would have raised my stops from the 200 sma line to nder the 50 weeks ago, and now I’d actually put it ABOVE the 50sma, under the 1/2 cycle low. I’ll explain why I would play it that way…
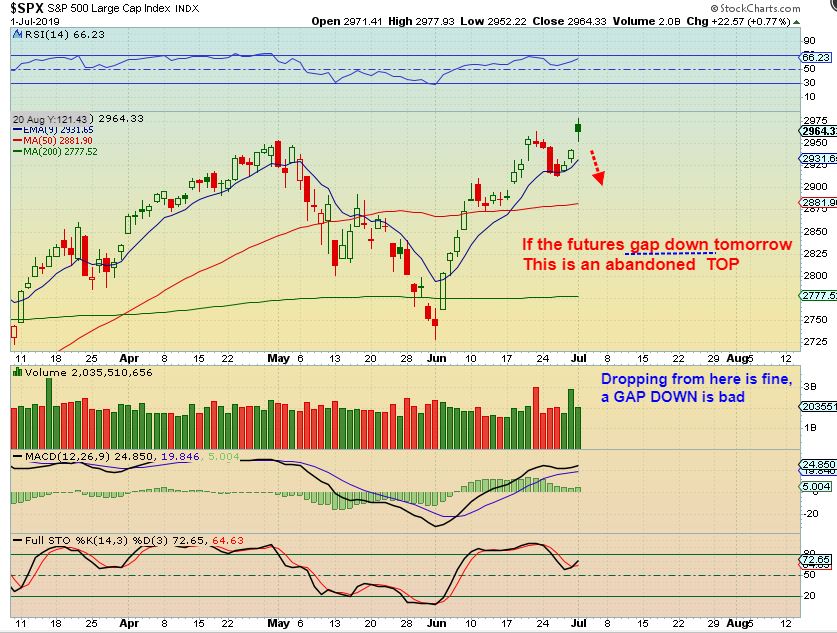
SPX – If this gaps down & doesn’t close the gap, I think it could be a TRAP. An exhaustion Gap is the final push higher. If I see the Markets run to new highs and draw in all bullishness, and then gap down, I Would sell. I can always get back in later, but this set up I would bail out. That would be an abandoned baby and an Abandoned baby is a sell, and…
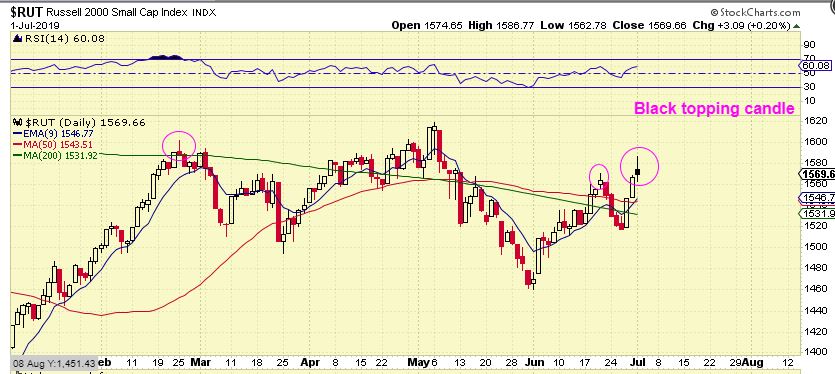
RUT – The RUT has a BLACK TOPPING CANDLE. As a technical trader, I would have seen this & sold any leverage if I had it ( I don’t have any since I’m focused on Miners, but I am just telling you how I view this).
TRAN – The TRANSPORTS also had a black topping candle. This chart ( & the Rut) does not have another black candle on it. They are often bearish after a move higher. Could this be a Big Boyz Game- paint a false break above the 50 & 200 sma to draw in Bullish Buyers and unload their positions to them? It could be, that is distribution at the tops when it happens.
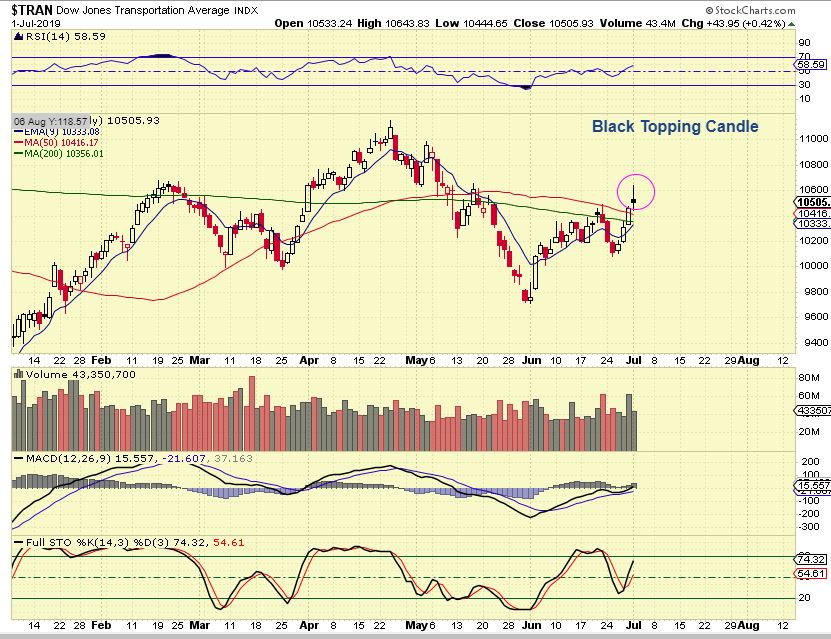
TRAN – And it looks like this if you step back. What will this do tomorrow? Stops go under the 200sma in my opinion.
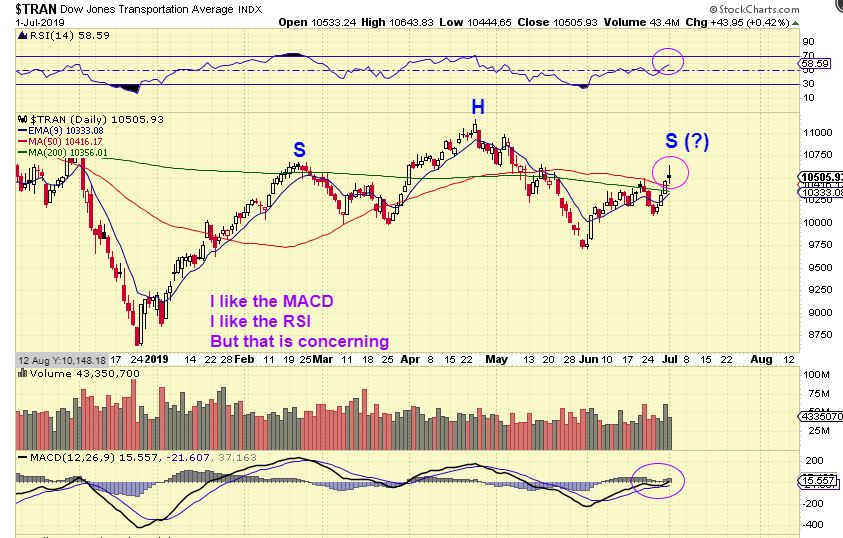
So this is NOT a H&S yet, and the markets aren’t guaranteed to top out here, but it could be forming one with a black reversal candle. That is why I’d raise my stops. If that was a 1/2 cycle low, it should hold up as a recent low, so my stop goes under that . If I get stopped out and it then recovers, I’d be more comfortable jumping back in ‘long’ that way, than to stay long and see what happens.
The SOX is still the more bullish sector.
.
Just a reminder.
MARKETS OFTEN TOP IN A PROCESS OF DISTRIBUTION. THOSE HOLDING BIG POSITIONS MOVE THE MARKETS BULLISHLY TO DRAW IN BULLISH BUYERS, SO THEY CAN OFFLOAD THEIR SHARES TO THEM. It is not that obvious until later.
.
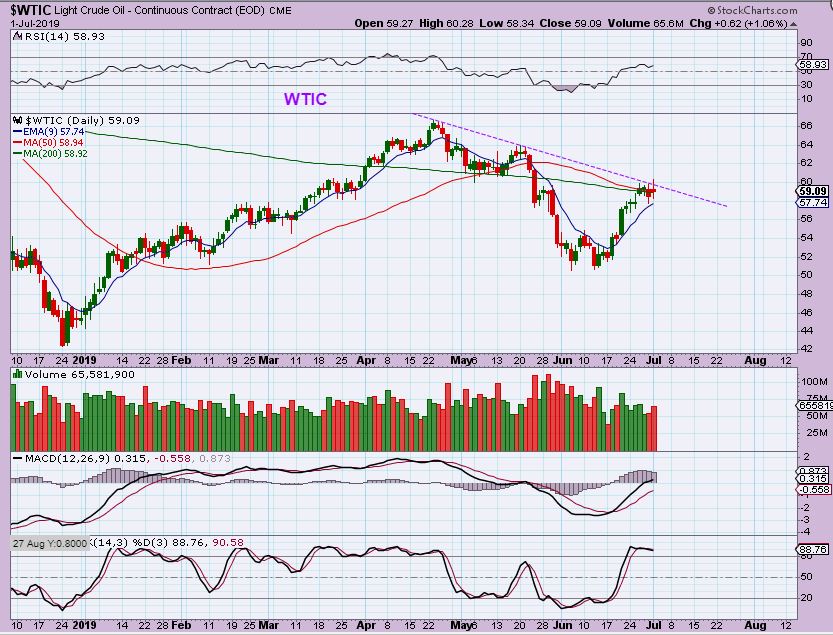
WTIC – Oil remains at this resistance area, possibly crawling before a break out, so let’s look at Oil / Energy ETFs
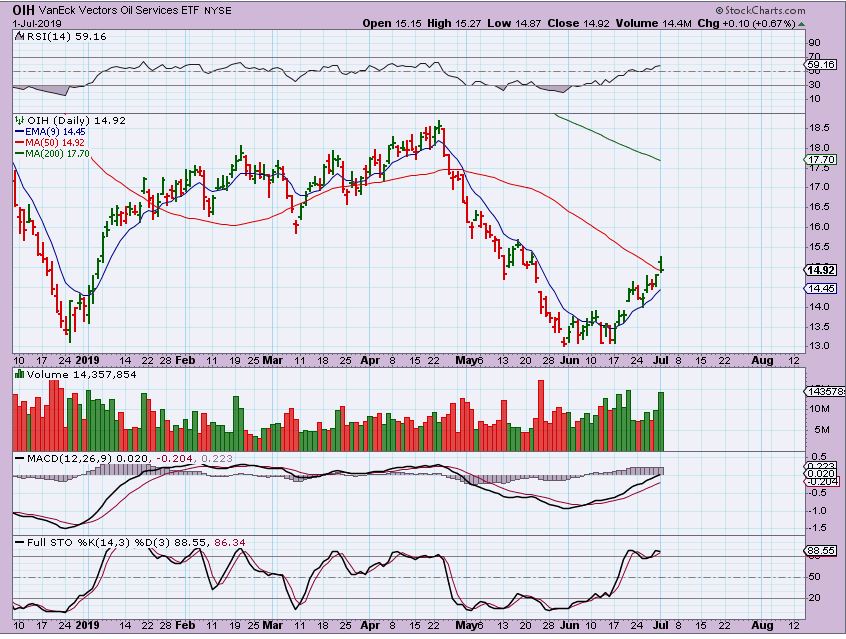
OIH – The OIH did break out, but then it sold off. This looks fine at this point, it filled the morning gap.
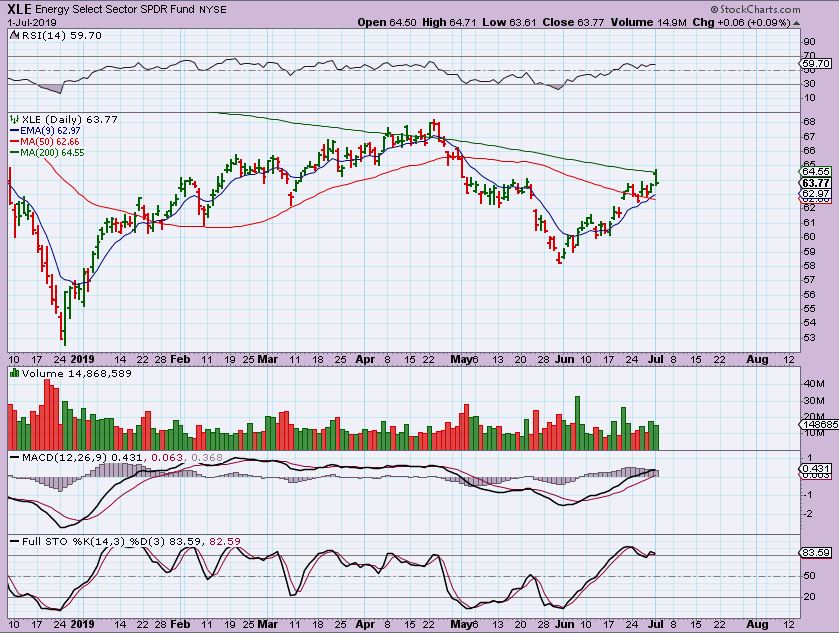
XLE – XLE gapped open but dropped at resistance. This also doesn’t look concerning, so maybe Oil is preparing to break out.
.
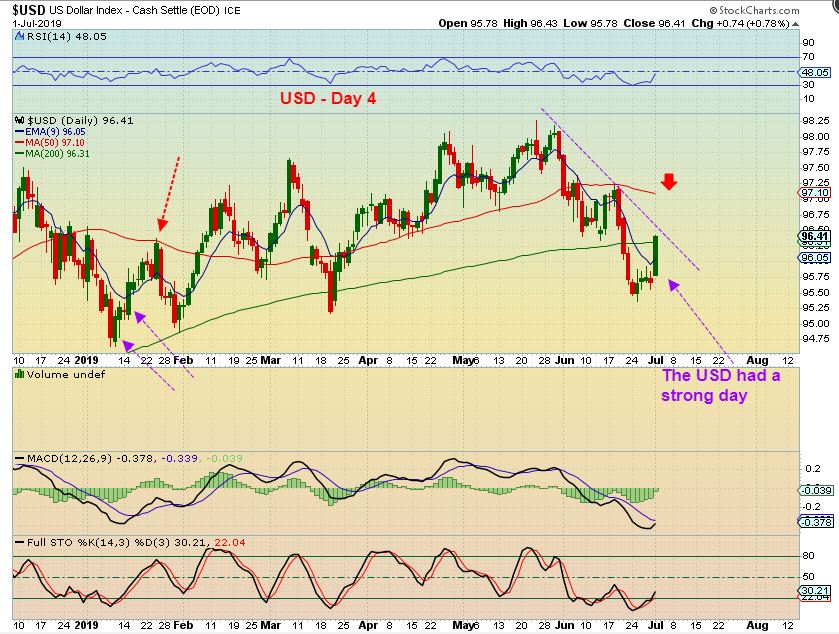
USD – This was a strong up day for the USD, and Gold finally dropped as a result. It is day 4 out of a daily cycle low, so I am pointing to the left of the chart to show that a rally from here MIGHT stall at the 50 sma. I do find 1 thing about this chart concerning, but at this point I AM NOT OVERLY CONCERNED. What concerns me? I’m thinking that if the USD breaks that trend line, it may have put in an ICL, since the last one was in January. Price coming out of an ICL can linger in this area for 2 daily cycles. Next chart…
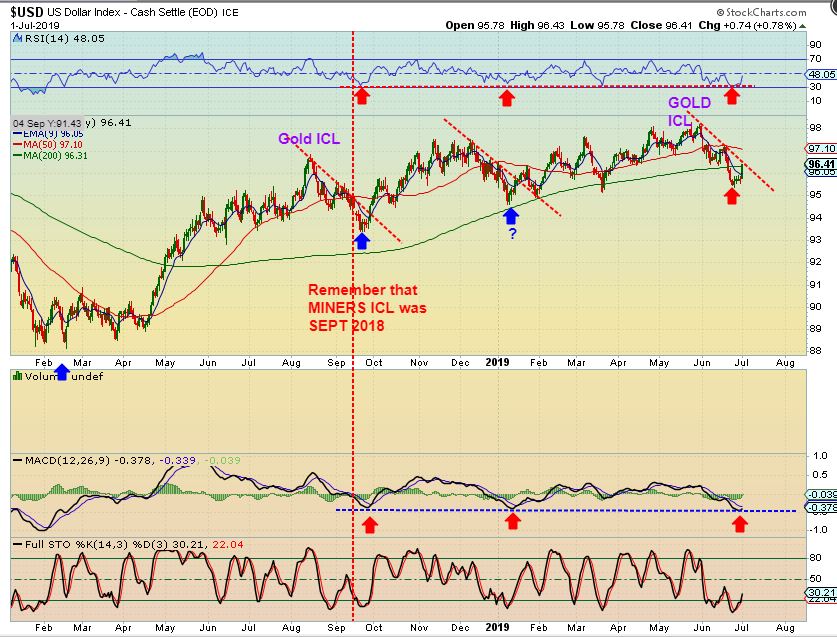
Let’s look at the USD ICLs, GOLD & MINERS recently
.
1. When the USD ‘peaked’ and was ready to roll into an ICL, Gold rallied out of an ICL. Notice on this chart of the USD that GOLDS ICLs came at the USD peak – Aug 2018 & May 2019.
2. In May 2019 though ( Fomc & Fed Minutes) the USD showed strength and Gold was fine. Now lets look at Miners.
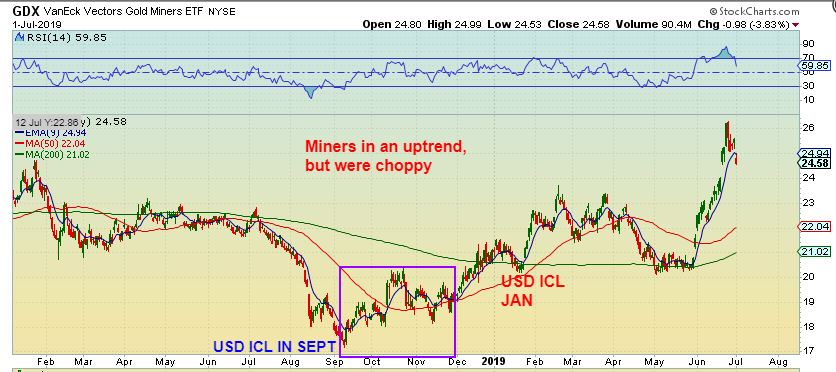
The ABOVE chart shows that the USD had an ICL in Sept. The chart BELOW shows GDX bottomed then too. It was choppy at first though, and that is the part that is a bit concerning to me. GDX was still an uptrend, but it was choppy & mentally difficult for some. The rally out of MAY lows was excellent though, and that could just continue as smart money accumulates on dips, so let’s not worry about anything yet…
.
Let’s Keep our minds on the Big Picture, because the USD/GOLD set up is very different now. GOLD & GDX are on the threshold of what should be a game changing break out. The USD has to put in an ICL every 4,5,6 months or so, it always does, but it does not always affect Gold the same way.
.
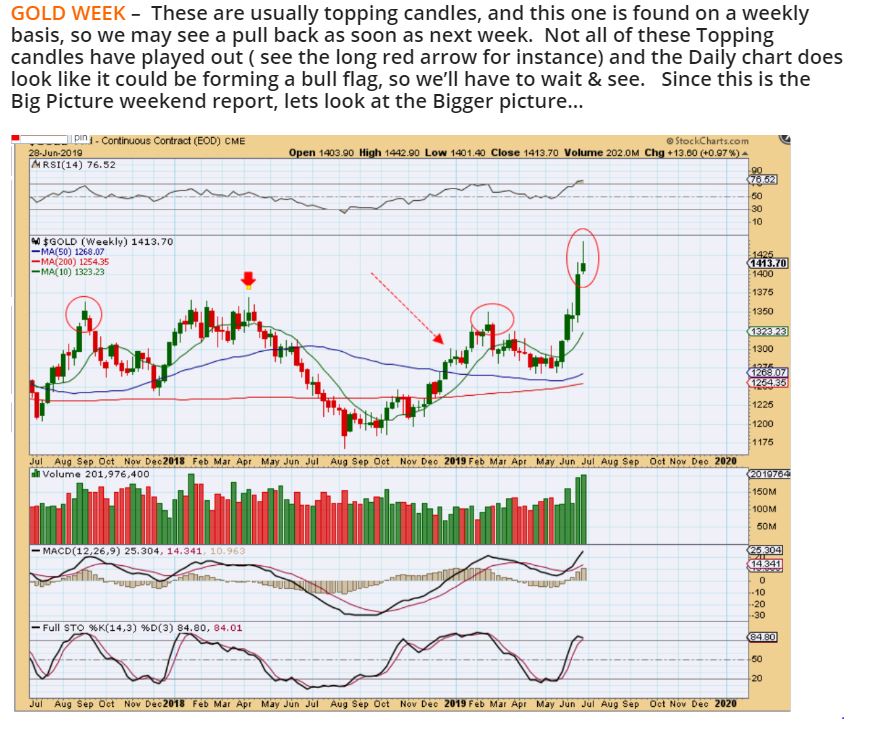
GOLD, SILVER, & The MINERS
THIS WAS IN THE WEEKEND REPORT:
.
GOLD DROPPED $24 MONDAY, SO THE SELLING HAS PICKED UP.
.
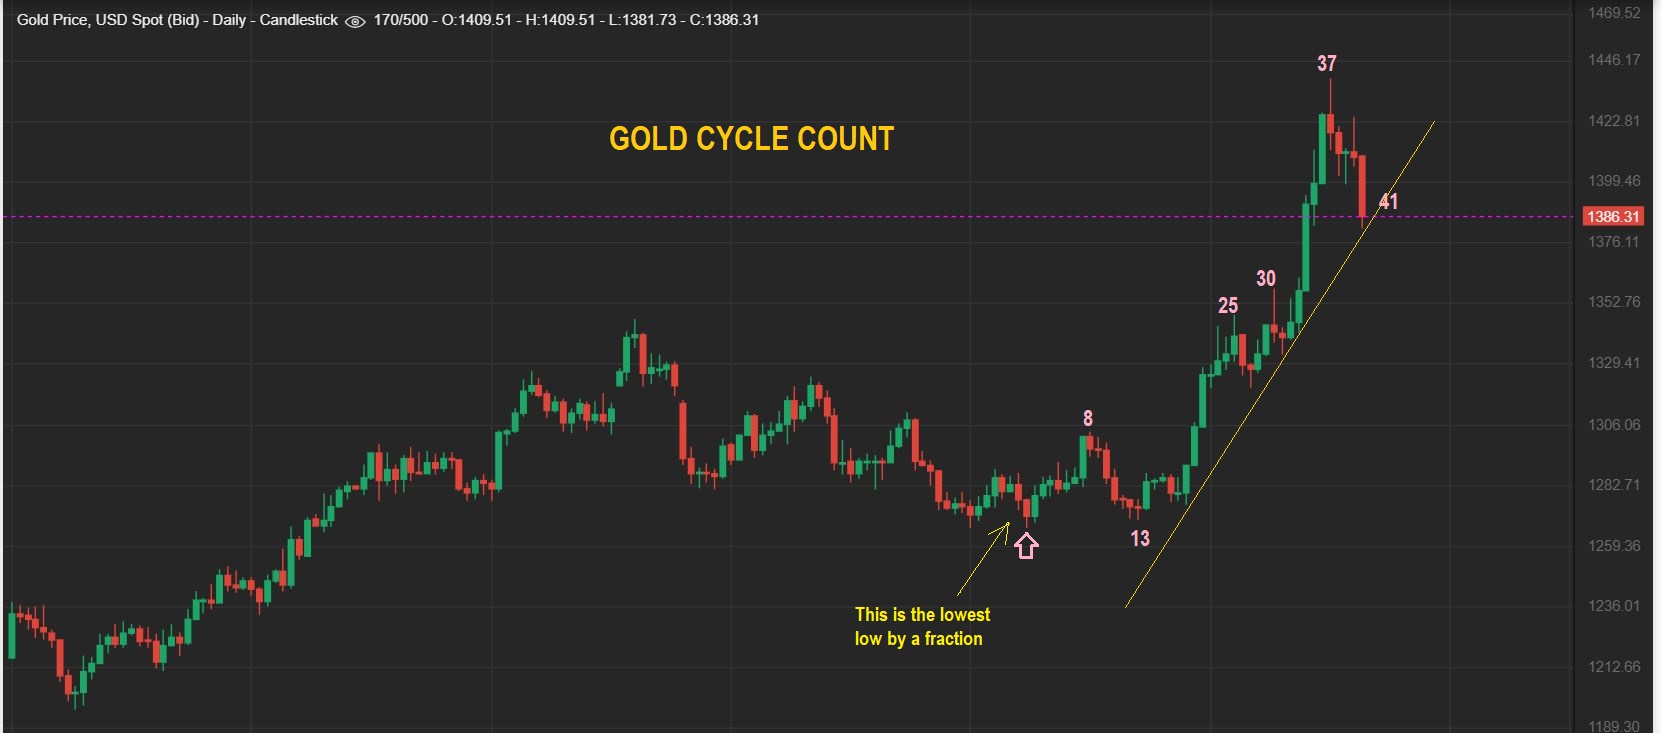
GOLD – We are on day 41 from the lowest point of that sideways consolidation (ICL). Unless day 13 was a VERY early dcl, then that means this should be a long first daily cycle VERY RIGHT TRANSLATED and very due to put in a Daily Cycle Low. This has been a power run.
.
Same chart: Even if that was a day 13 dcl ( less likely), then this would be day 28 of a 2nd daily cycle, and it would still be very R.T. and still due for a dcl , but could have 5 or more trading days to reach the mid 30’s count. CYCLE COUNTS ARE TRICKY, AND I’LL TELL YOU WHY SOON…
.
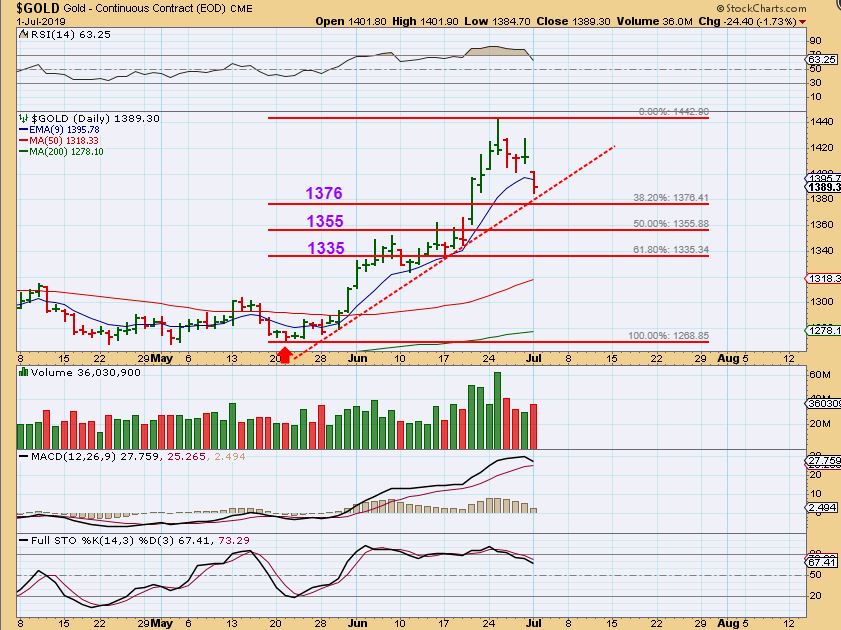
GOLD – Gold dropped $24 on Monday, and the fib retracement numbers are shown here. 38% and 50% are most common in a rip higher like the one that we just saw. The 38% is close enough to be complete, but it doesn’t look like a trend line was broken yet.
.
CYCLE COUNTS ARE TRICKY, AND I’LL TELL YOU WHY NOW– Golds count doesn’t come close to matching Silver or GDXJ.
.
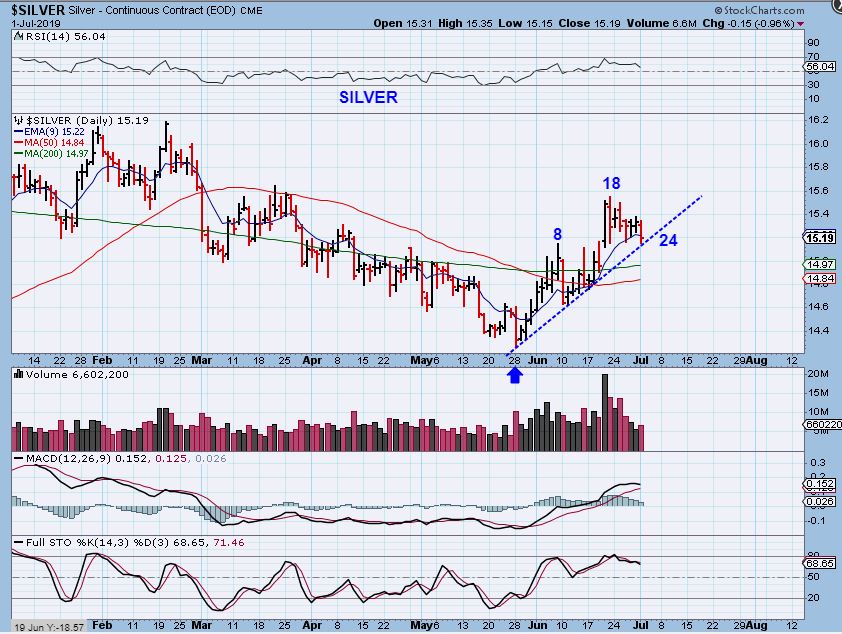
SILVER – Silver bottomed at the end of MYay at the FED MINUTES, GOLD bottomed at the Fed Mtg. That is almost a 1 month difference. THAT IS WHY I wonder if we count the first 13 days as a small daily cycle. It syncs up the 1st daily cycle low of Gold with Silvers low, but …
.
…but as you know, I have said that I am NOT using cycles as my primary gauge here, and it is for that very reason.
When Gold doesn’t match Silvers cycles, and GDXJ doesn’t match Gold or GDX, it gets confusing for my readers. It raised questions & Doubts in some of my readers minds in May, and they wanted to sell. I did not want my readers to doubt & sell out of that first run.
Silver here might drop to the moving averages and perform a normal back test.
.
LET’S ADD A BIT MORE CONFUSION TO THIS CYCLE DISCUSSION 🙂
.
GDX – I have ALWAYS said that when a triangle forms , the counts become obscure. I then usually start my count on the triangle break out, so with GDX, notice this …
1. GDX bottomed with Gold at the FED MTG
2. GDX then formed a triangle and synced up closer to Silver with the Post Fed Minutes rally. Read the chart, and…
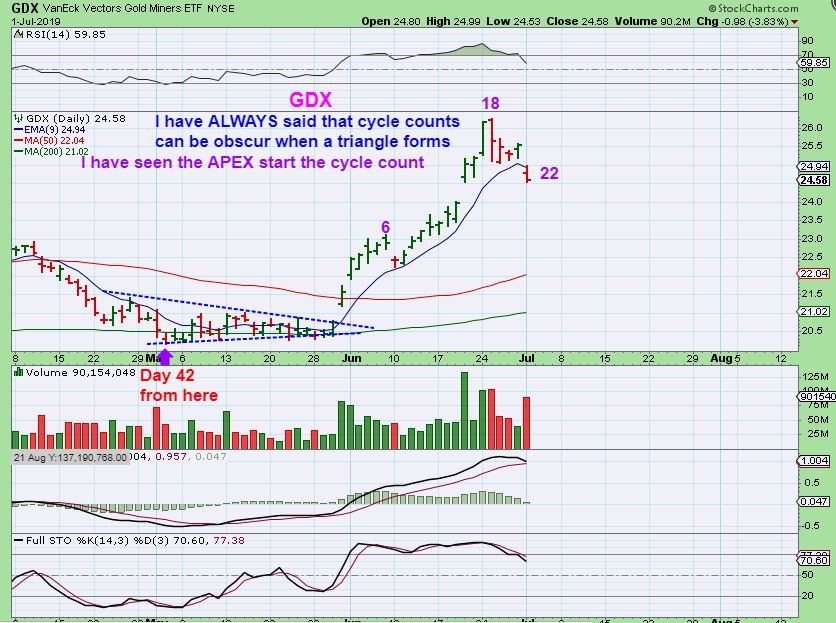
3. And GDXJ bottomed in late May for a Post Minutes Rally. 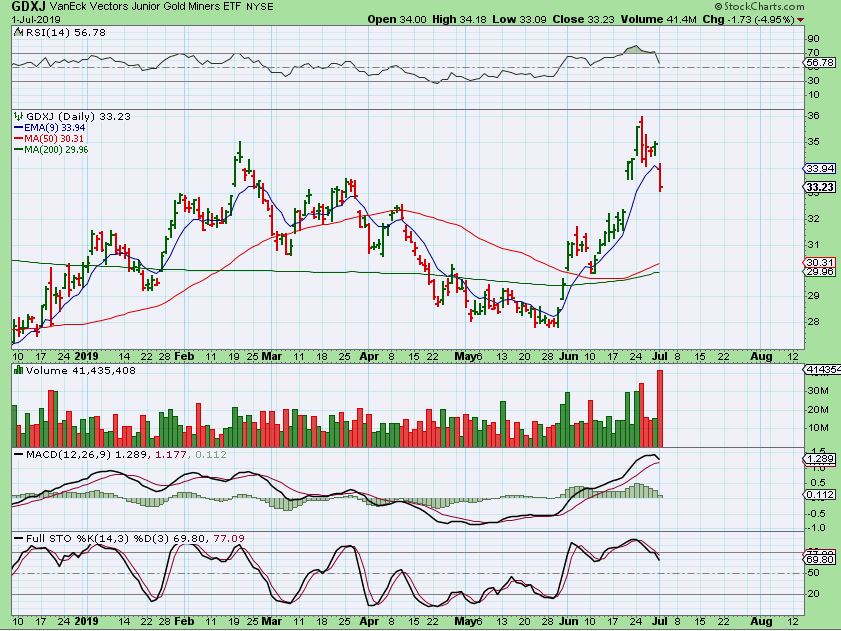
So how do you use Gold & GDX cycle count starting in early May, and SILVER & GDXJ in late May?
It is too vague to be considered concrete terms to me, so I usually switch to mainly relying on technical analysis and allow cycles to play a smaller part until they play out & give us stronger clues in timing later. They may sync up in time.
.
GDX – So breaking the 10sma & trend line is the start of a drop into a dcl, and Fib levels as guidelines are shown. If that gap fills, it is right on the 38% line.
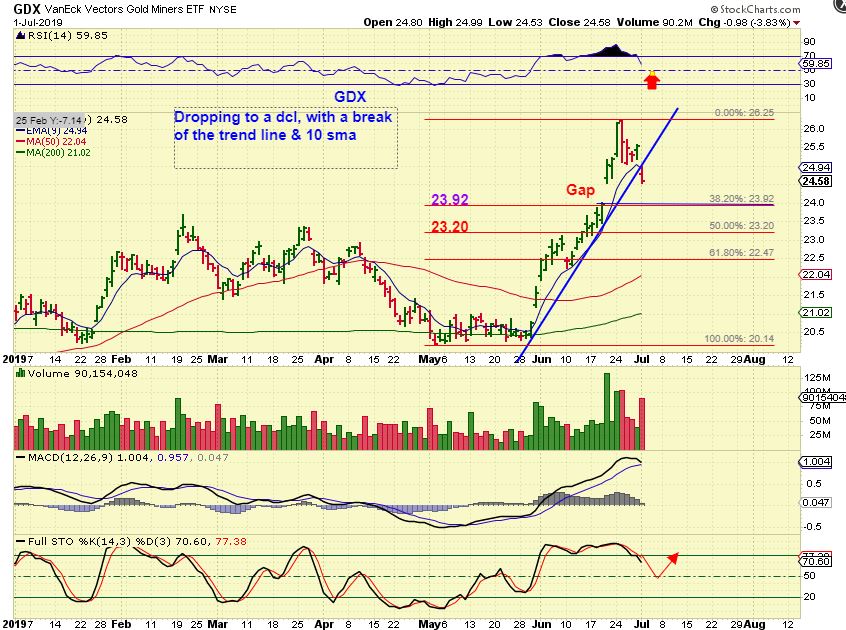
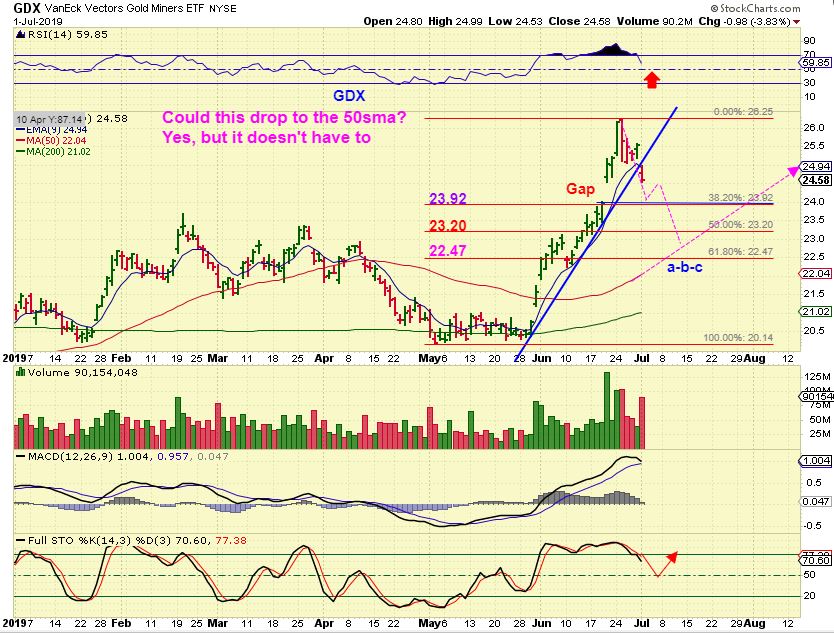
GDX – Can this drop to the 50sma? It could if the USD acted very strong, but I would expect a 38% or a 50% retracement.
GDXJ – I was gone for the 2nd half of the trading day, and when I got home and saw this volume, I was a bit concerned about that too. I hate to see high volume selling off of the top, but I am less concerned now. Why?…
.
I decided to run through a bunch of Juniors and see if they all had high volume selling too. That would be a warning, but as you’ll see, I found a lot of average volume good looking charts. let’s take a look.
.
AAU – AAU was up a penny when Gold was down $24? That almost never happens unless we are in a bullish mode. Volume was average.

.
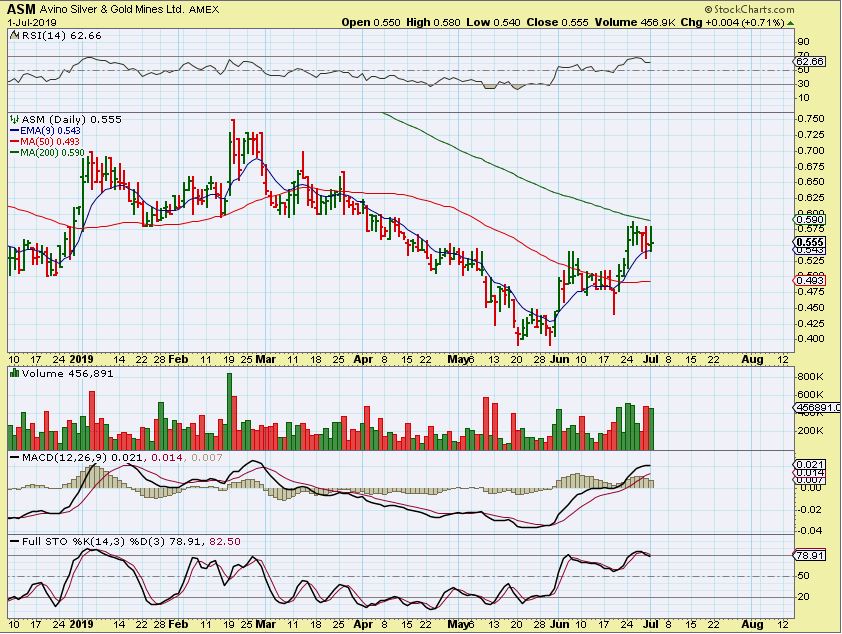
ASM – Closed up also when Gold was down $24, and volume was normal.
.
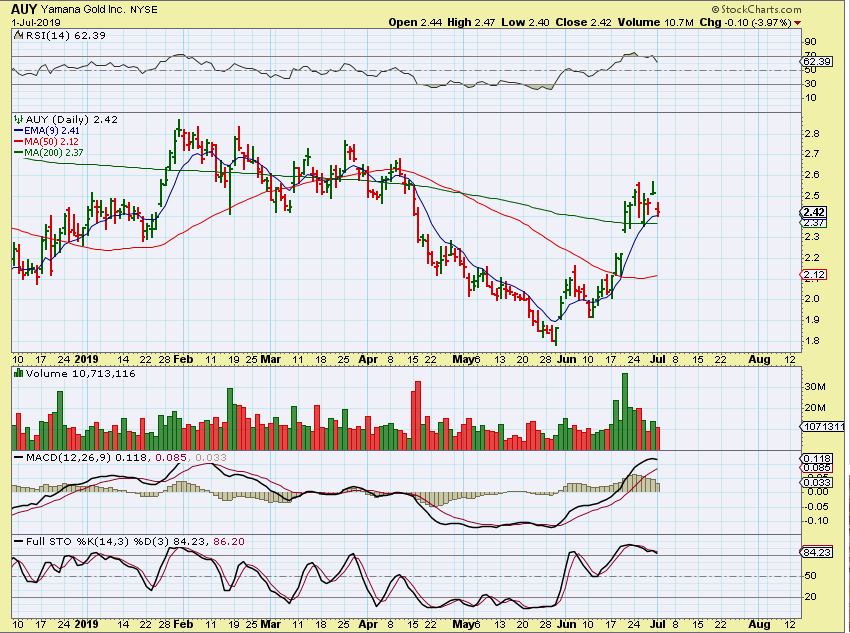
AUY – AUY dropped 10 cents toward the 9 ema & 200sma on light volume.
.
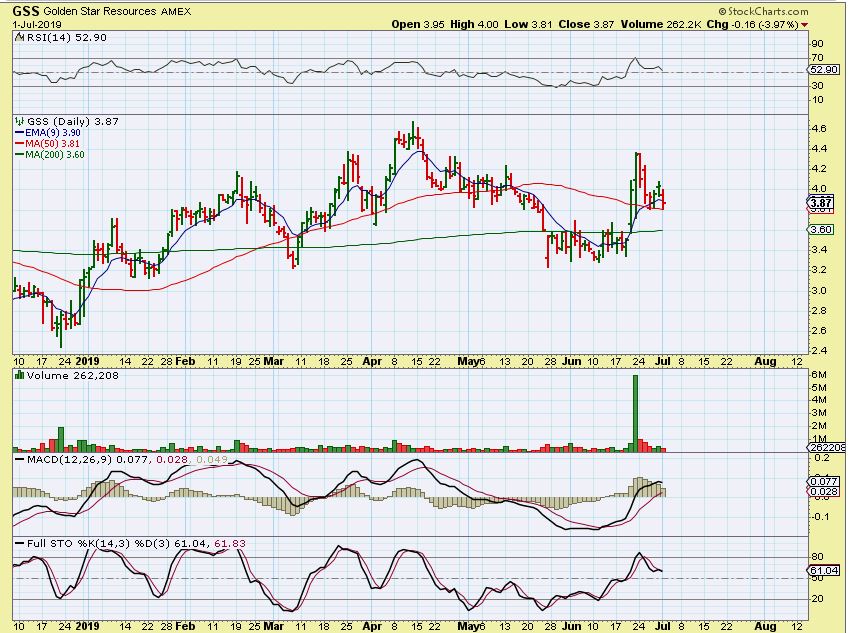
GSS – GSS tagged the 50sma on light volume.
.
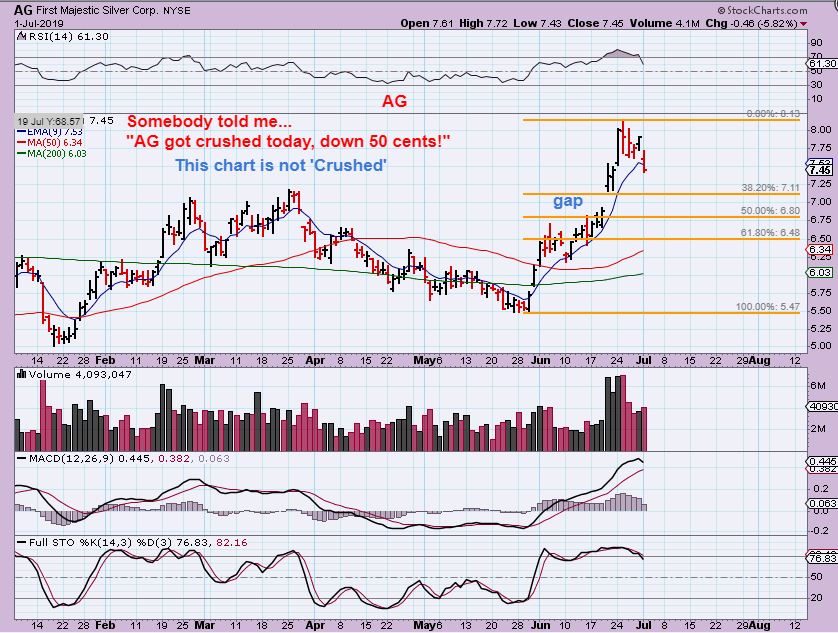
AG – Average volume, read the chart.
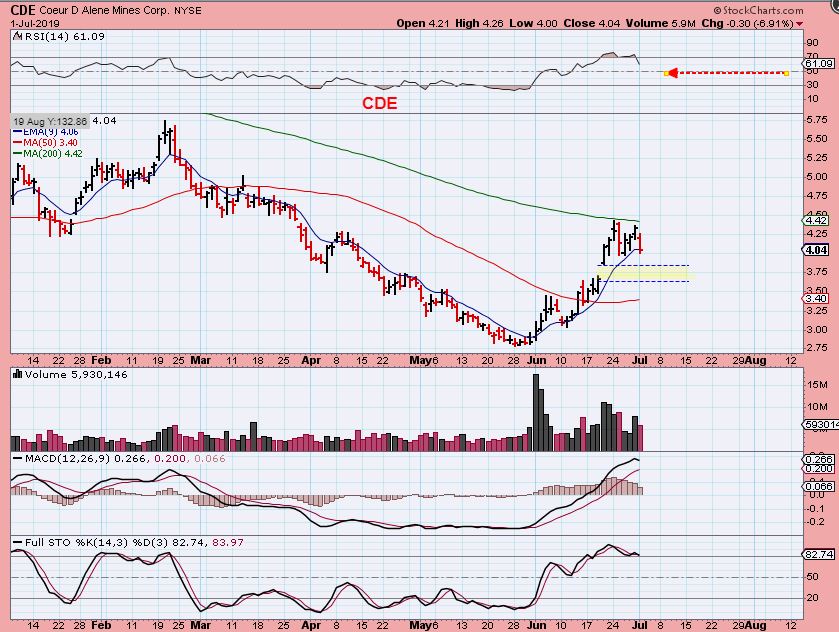
CDE – Lighter volume than several up days. CAN THIS drop to fill the gap or even enough to tag the 50sma? Unfortunately Yes, but it may not. It could actually do that in 3 days at this rate.
.
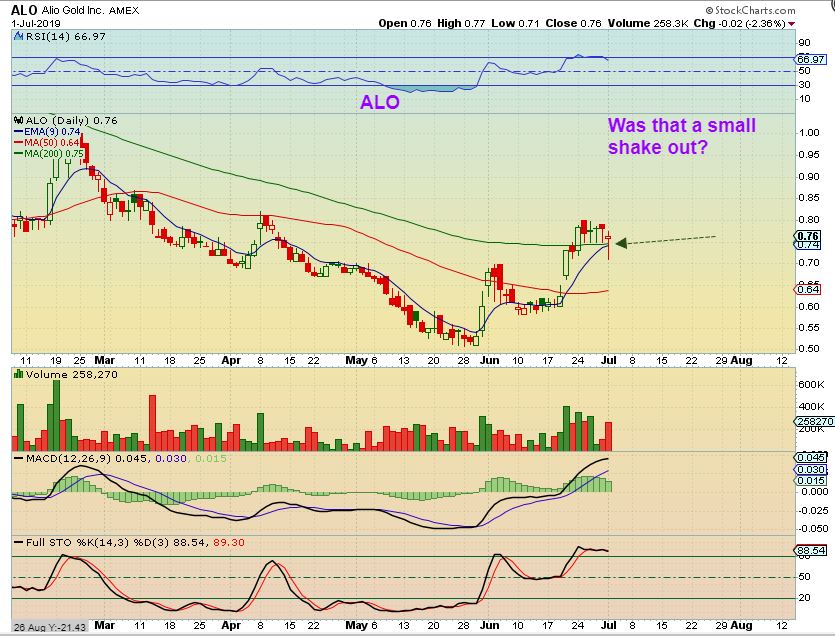
ALO – Shake out & recovery with Gold down $24? That’s certainly not ugly.
.
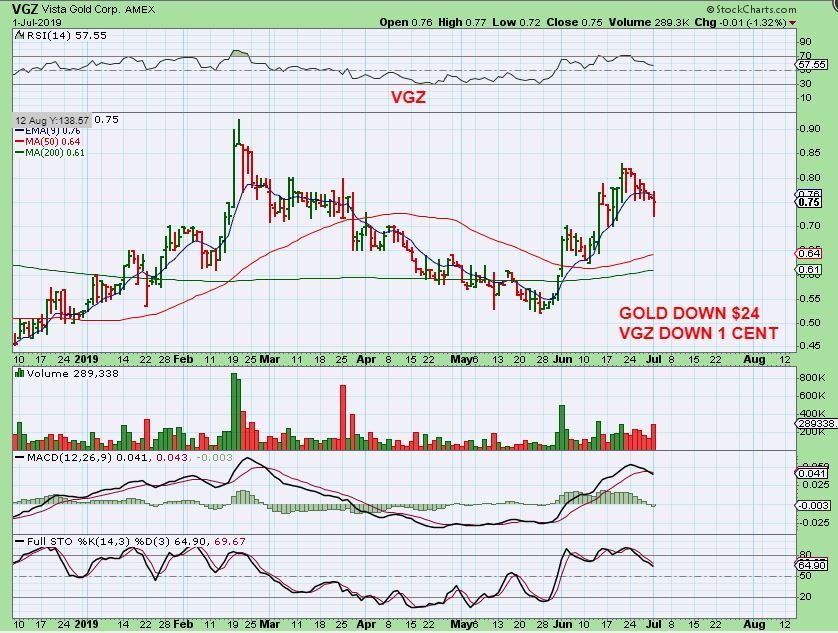
VGZ – VGZ dropped and started to recover, ending the day down 1 cent ( on a day when Gold was down $24).
.
Conclusion: Based on what I see, the selling in Miners after that strong rally higher is normal selling in a bull market. When the time comes for a drop into a dcl, we usually watch for the break of the trend line & 10 sma to signal that the drop has started. A DCL is in place when price reverses and breaks back above that 10sma. Waiting for that reversal is the technical way to look for signs that the selling should be finished. It does not catch the exact lows, but that is a safer way to buy leverage with minimal draw-down.
.
DID YOU KNOW: This is also a holiday week in the US and the US Markets close early Wednesday and are closed all day on Thursday. This often causes light trading on the 1/2 day Wednesday before the 4th of July holiday. Friday may be very light too, with people opting for a 4 day weekend Thursday – Sunday, rather than returning to work for just 1 slow Friday. That said, it could be a choppy or tricky week of trading.
.
We’ll see what happens, but for now, enjoy your Tuesday trading!
.

