
Weekend Review – June 29
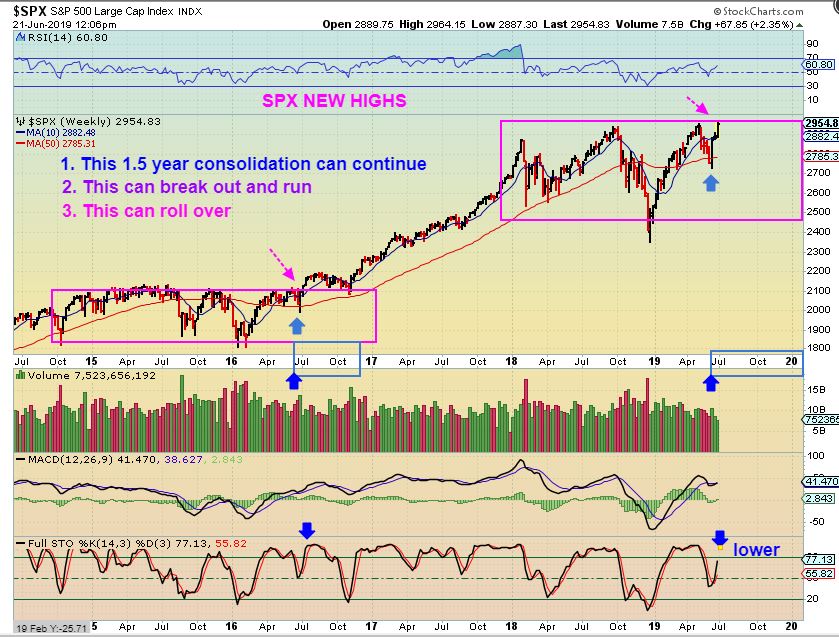
SPX LAST WEEKEND– Last weekend, using this chart, I pointed out the similarity between the long consolidation in 2015-2016, and I want to use that as a reminder again.
.
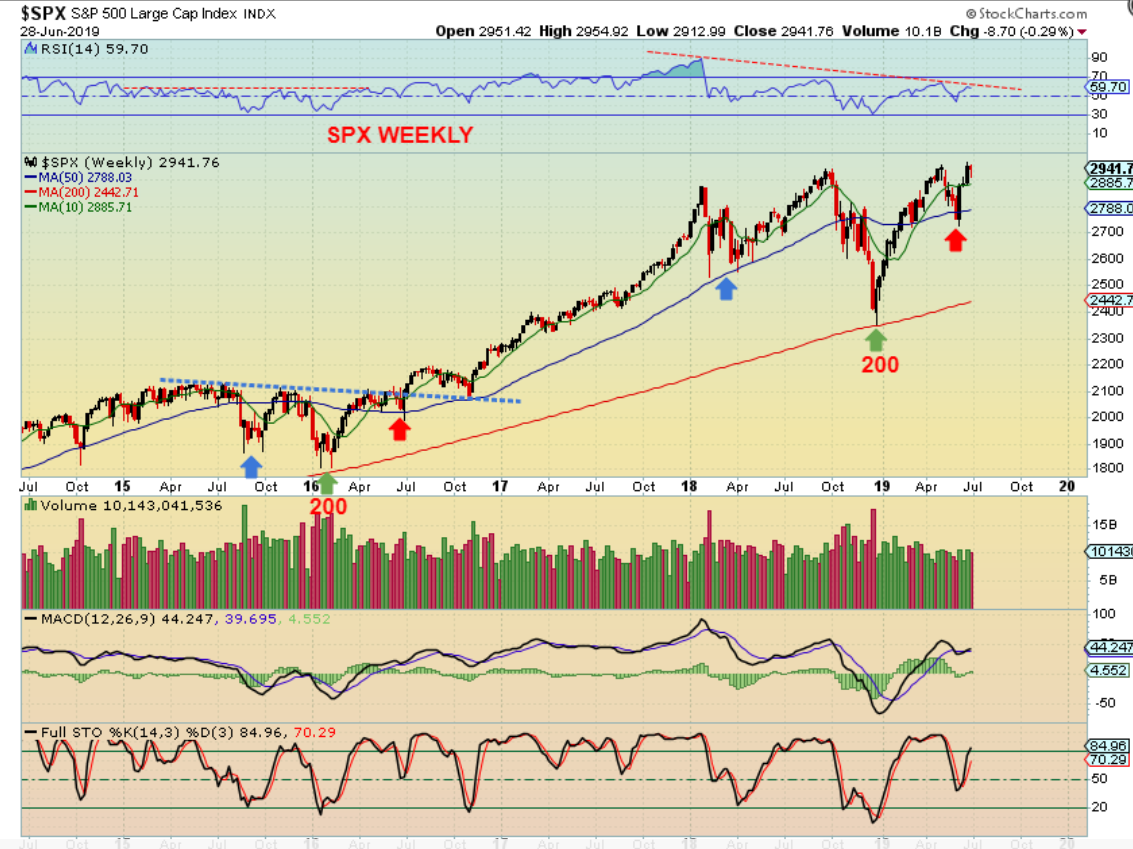
SPX WEEKLY – So again, The General Markets have been chopping sideways for over 1 year now and we are back at the highs. Here I am showing you the first sell off as a blue arrow dip, the Green arrow bounced off of the 200 week ma, and the Red arrow was the recent sell off. Notice that after that Red Arrow in 2016, the markets broke to new highs , but still bounced along sideways from July to the end of the years back test of the blue break out line. Currently the RSI is not showing strength. This may continue.
.
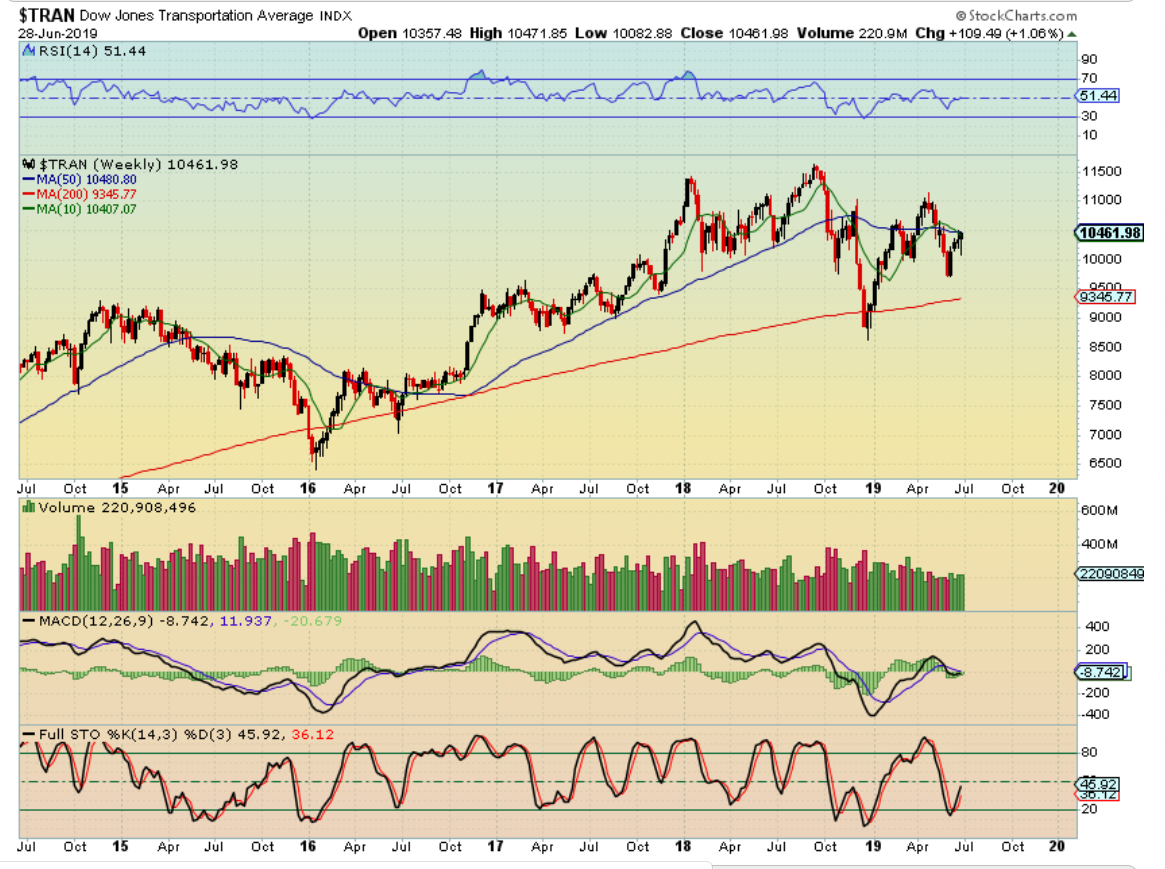
TRAN WEEKLY – I pointed out the TRAN & RUT as Lagging this week, and the SOX as leading. Here the TRAN is at resistance. If it breaks higher, that will add bullishness to the big picture, and continued long positions can raise stops. .
.
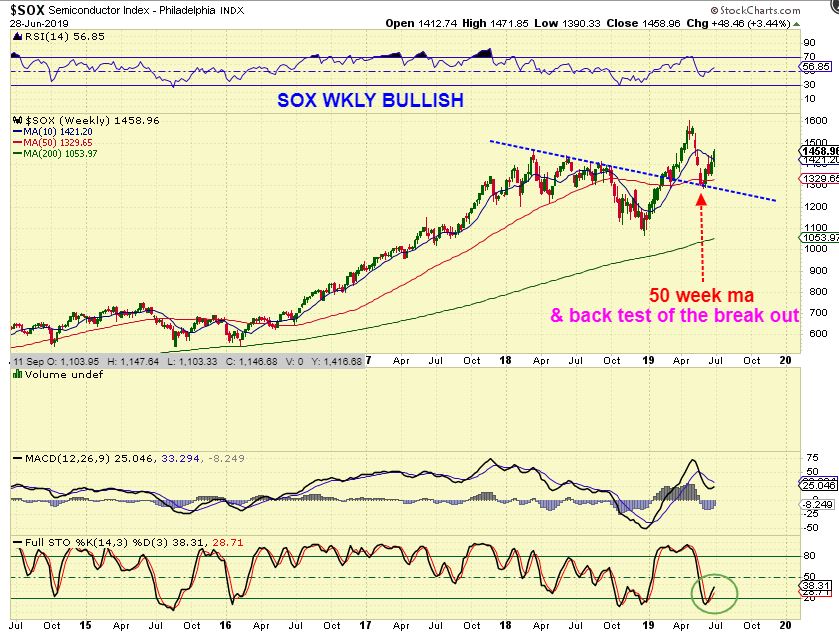
SOX WEEKLY -When I look at the SOX WEEKLY however, I do see more of a Bullish set up. This is oversold and back tested the 50 week ma ( and the down trend line). This was a buy and a trailing stop is safe ( I Posted a daily chart of SOXL recently as a leveraged vehicle with good upside potential. I am not in this trade, I am focused on the miners.
.
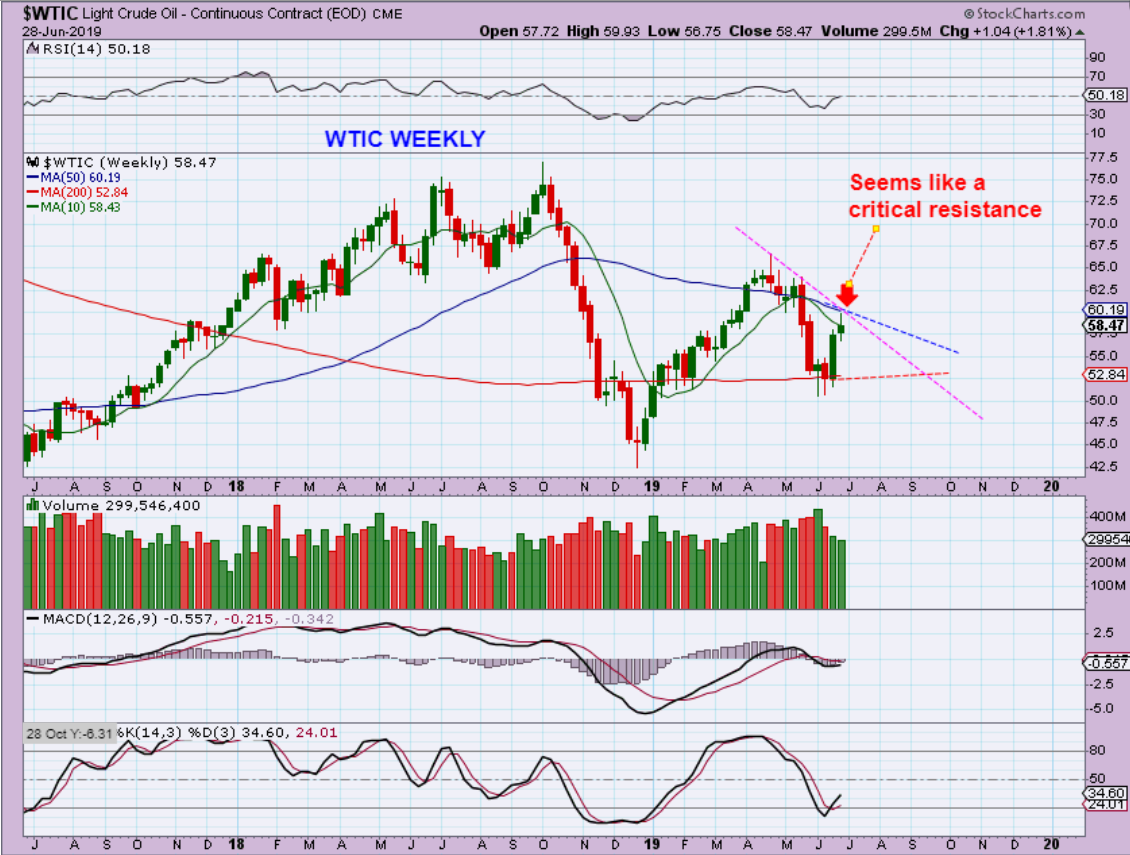
WTIC WEEKLY – Oil also finds itself at strong resistance. In fact, it is between the 200 weekly ma , where it bounced, to the 50 week ma , where is stalled. This is a possible reversal candle, or price may stall here in the $60 area. It is oversold and the RSI improved, so it looks more bullish with this bounce.
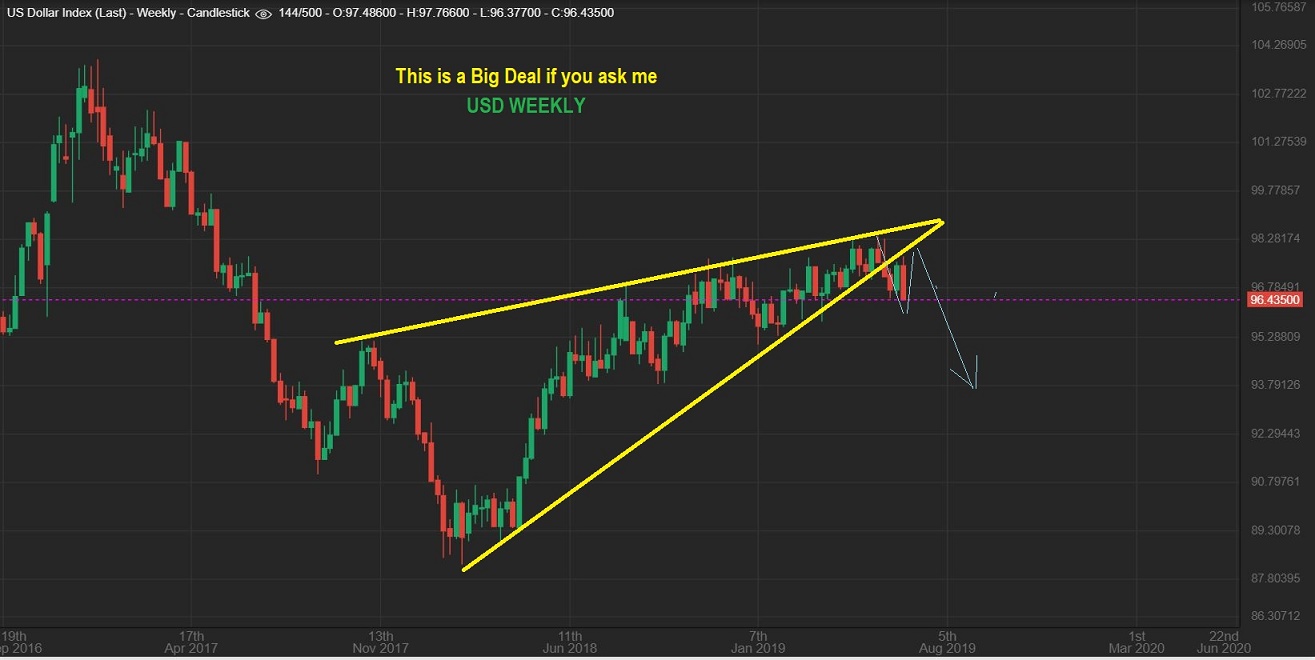
USD Big Picture – I have been showing this Large multiyear wedge breaking down. I also said that it could bounce & do a back test…
.
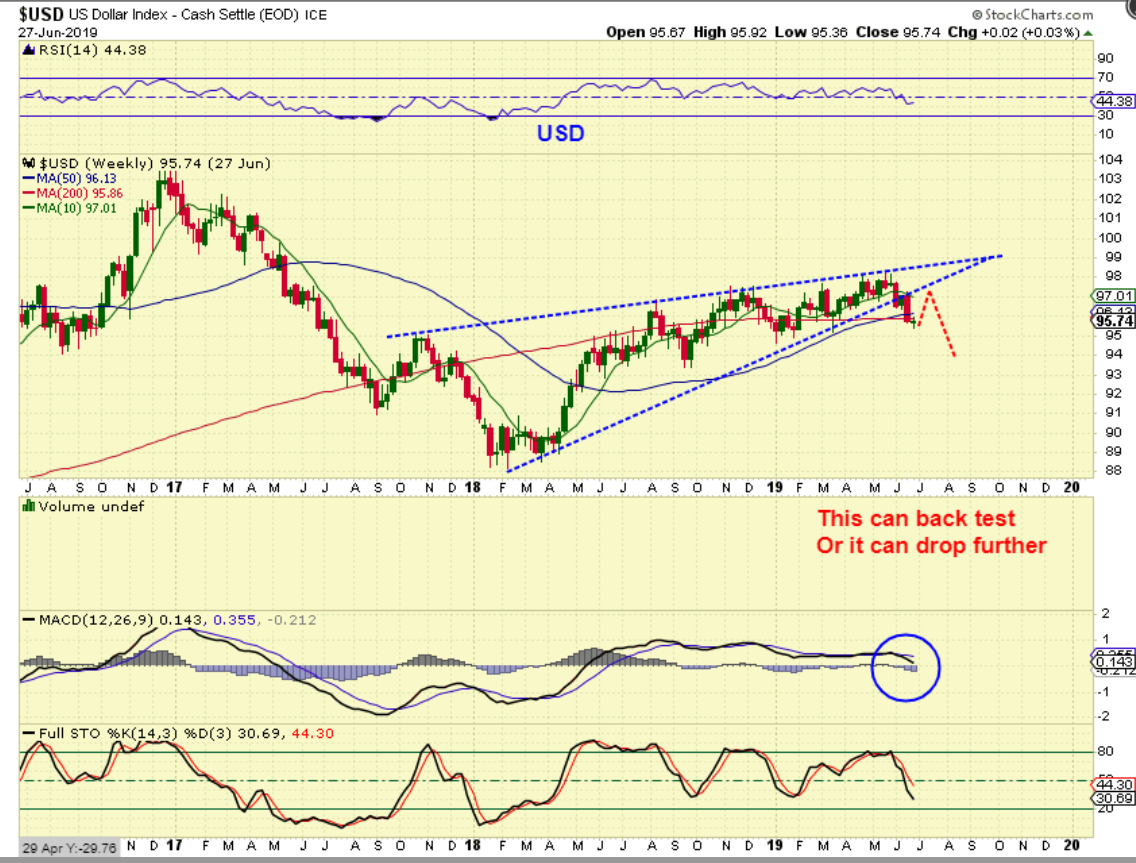
USD – This week it can be drawn like this, but that is a wkly doi candle, and that can lead to further downside or a reversal ( it is an indecision candle). As this wedge broke down…
.
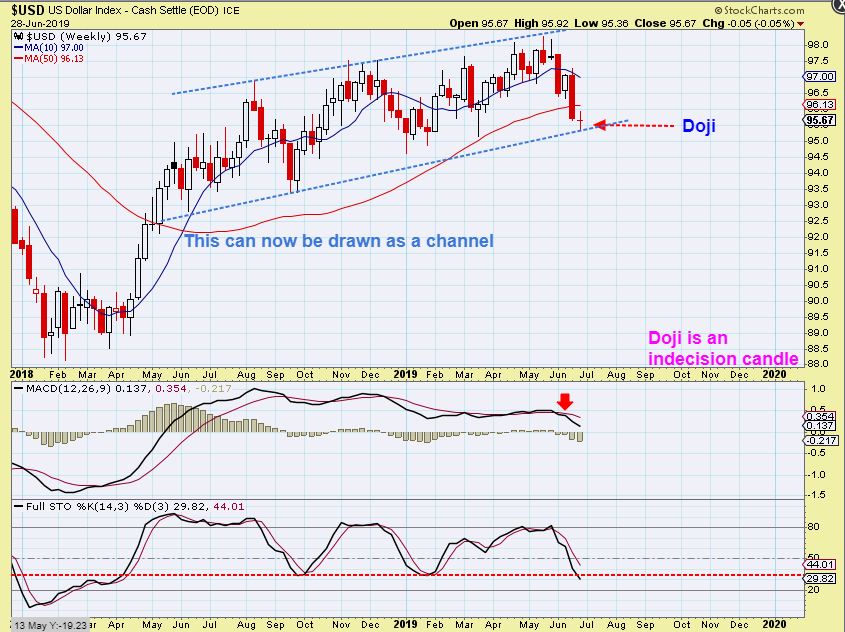
USD WEEKLY – A close up of it shows that now a channel can be draw, and a sideways or slanted move higher to that 10 or 50 ma line could be that back test mentioned above. Again, it is the BIG PICTURE that I am watching here…
.
Even with a possible bounce, the USD BIG PICTURE BROKE THE WEDGE, SO IT IS BREAKING DOWN & REMAINS BULLISH FOR GOLD . To further build confidence in what we see here, we also looked at…
.
To further build confidence in what we see here, we also looked at the YEN. Last week I wrote…
.
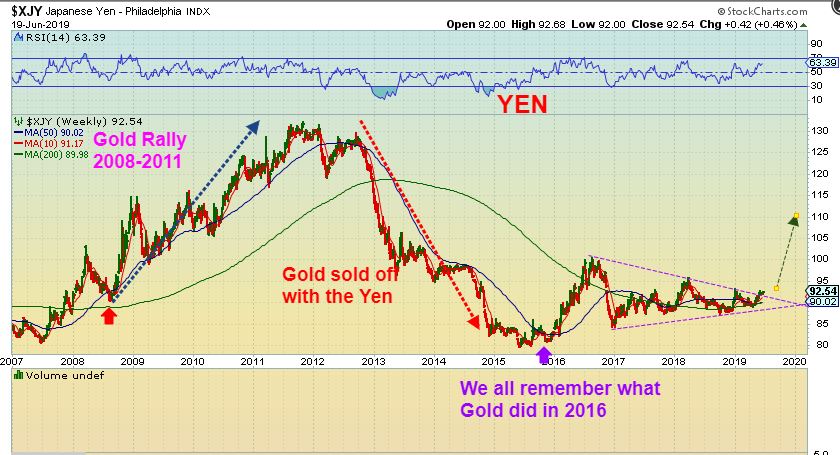
YEN – The YEN often mirrors Gold. Notice the 2008-2011 Run & 2016 rally was similar to Gold. Well the YEN looks ready to break out Bullishly Here, and so does Gold, as the USD is breaking down.
.
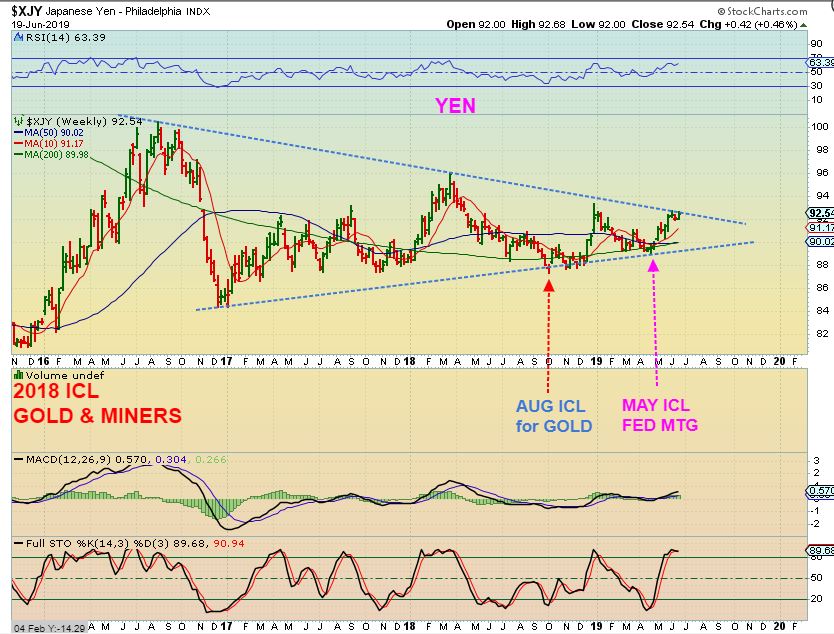
YEN – The YEN has similar ICL locations as Gold too. So did THE YEN break higher from last weeks 92.50 level?
.
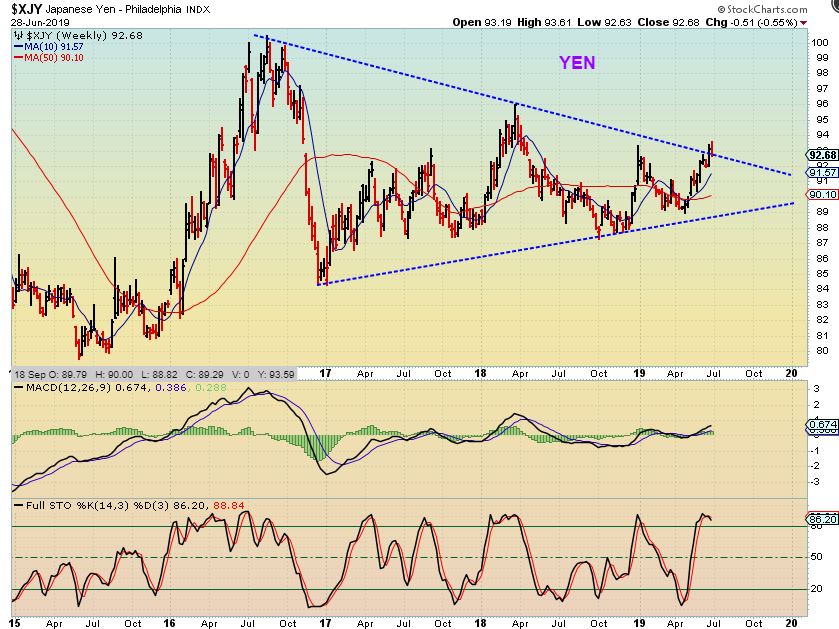
YEN – It broke out to 93.61 and dropped back to the trend line, so this adds bullishness to the Big Picture for the Yen & Gold.
.
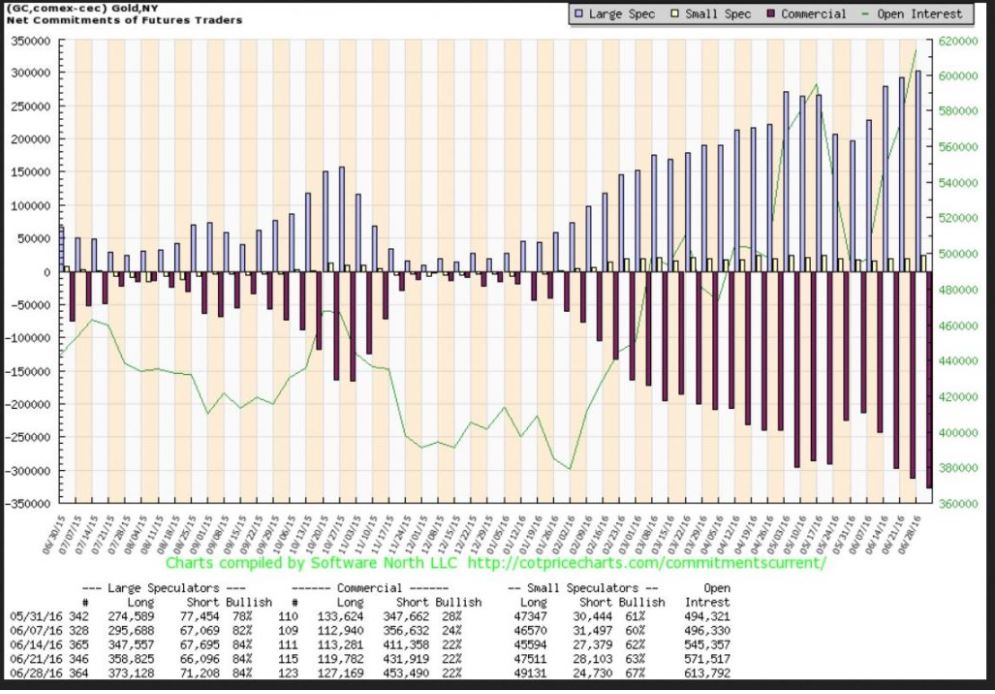
COT – Smart Money shorts increased again, and I am mentally conditioned to hate seeing it this way, but I discussed this in my weekend report 2 weeks ago. In past bullish rallies like 2016, the shorts just continued to increase over time. I will show that COT Next.
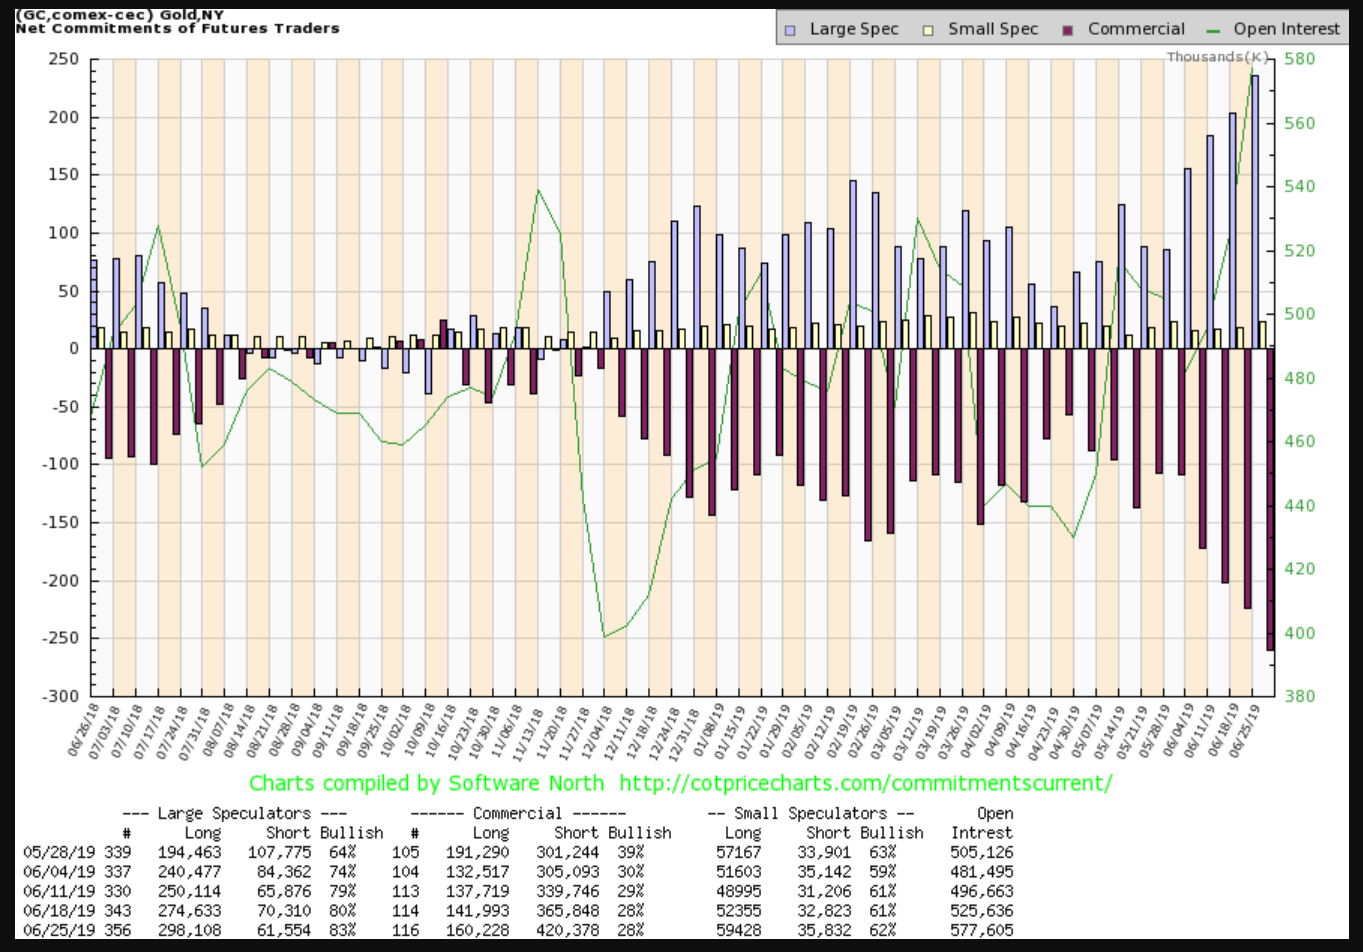
This is GOLDS COT for 2016. You can see that it surpasses the prior intermediate cycles peak as Gold rallied and then just continued to grow. It dropped in MAY 2016 when the ICL came along, but it was still very high at that ICL.
.
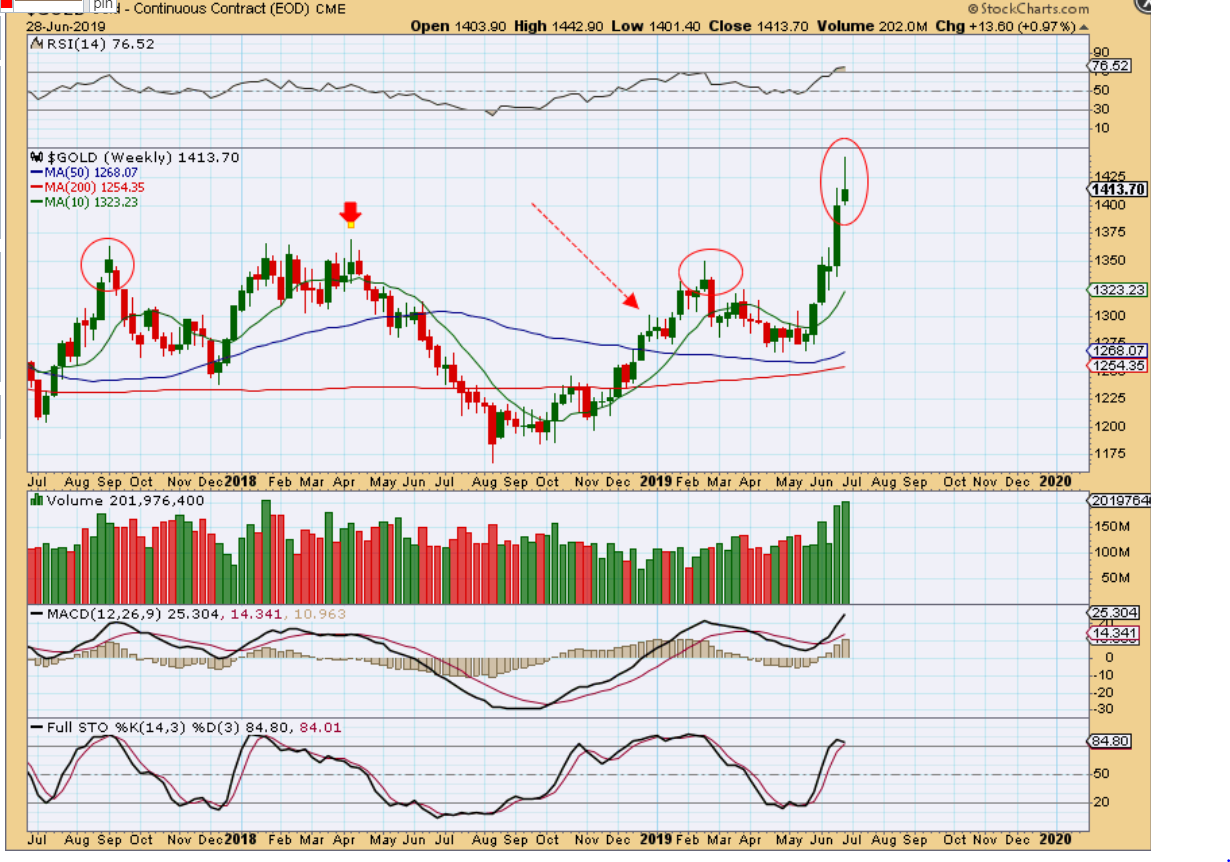
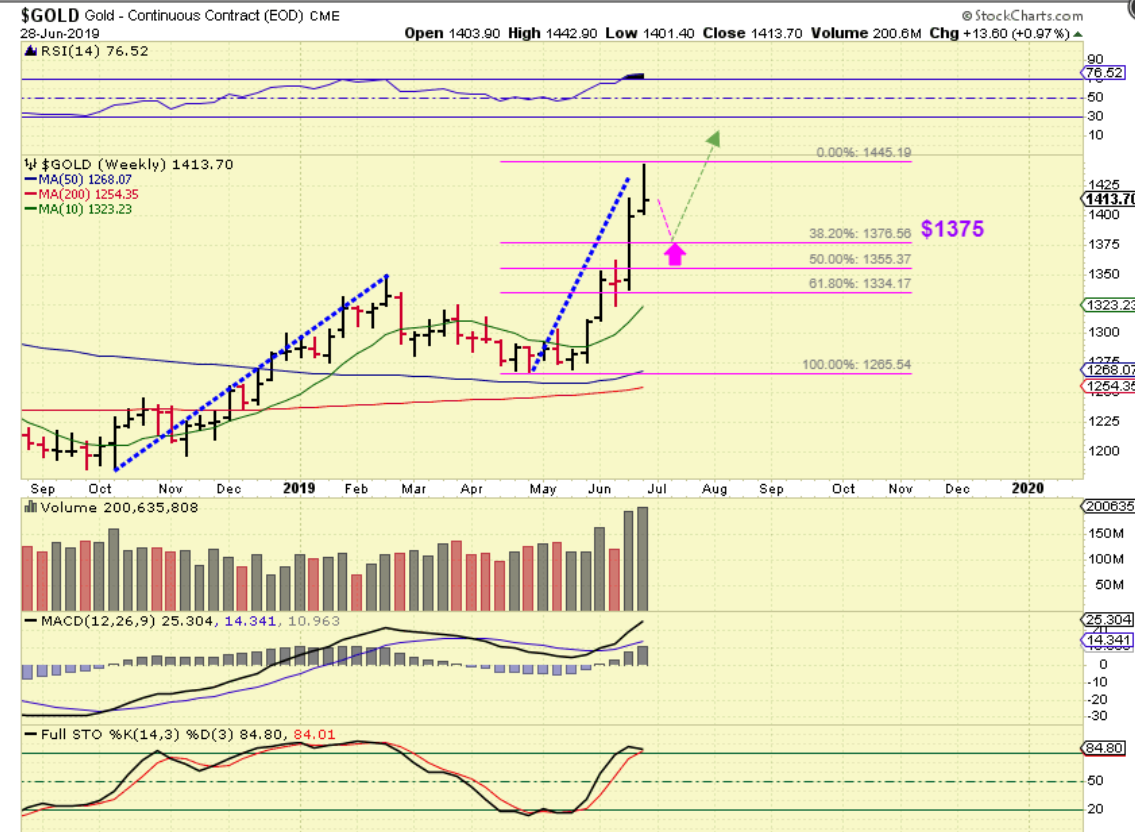
GOLD WEEK – These are usually topping candles, and this one is found on a weekly basis, so we may see a pull back as soon as next week. Not all of these Topping candles have played out ( see the long red arrow for instance) and the Daily chart does look like it could be forming a bull flag, so we’ll have to wait & see. Since this is the Big Picture weekend report, lets look at the Bigger picture…
.
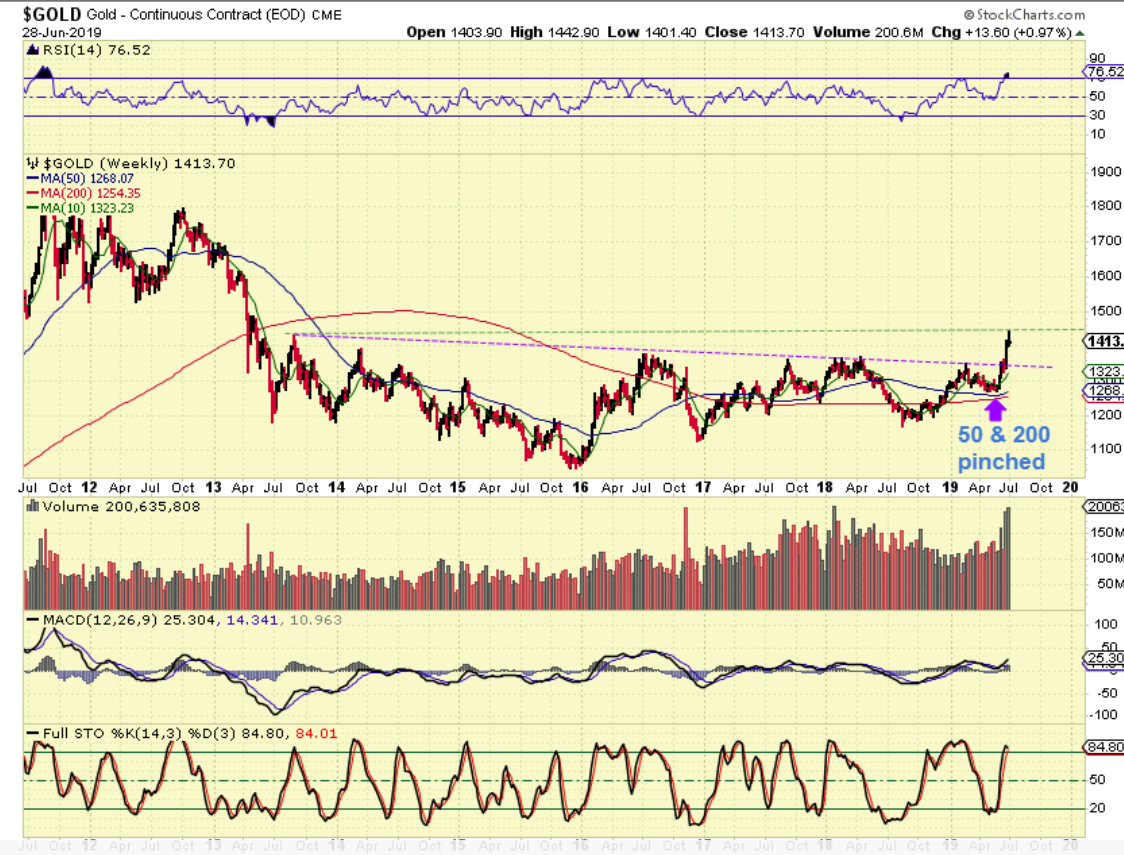
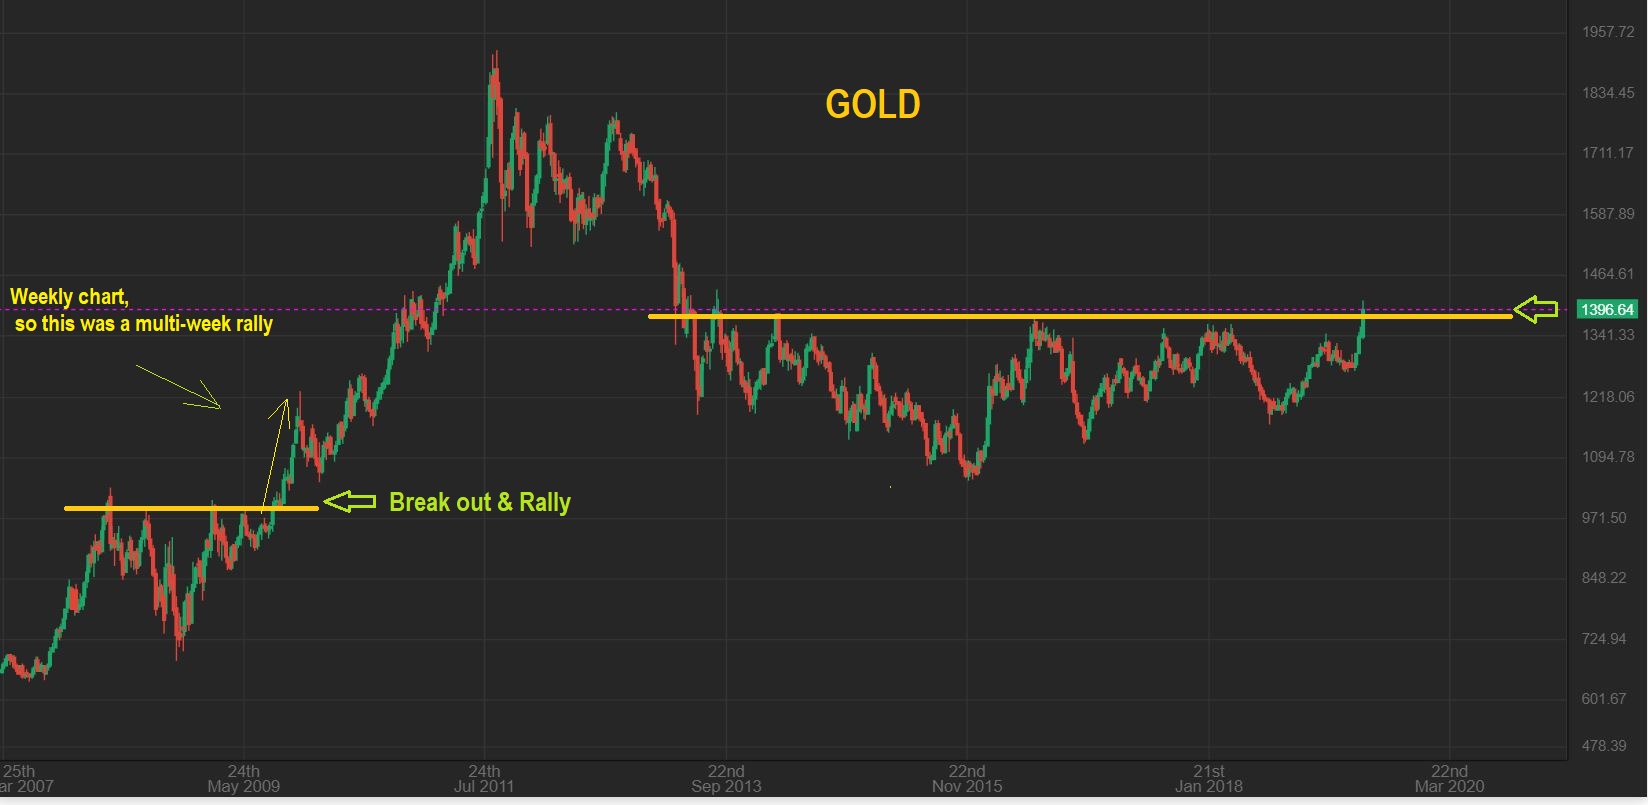
GOLD WEEKLY BIGGER PICTURE – Gold is breaking from that very long Base, and I mentioned 2 weeks ago that it would need high volume to do that. We are now seeing a high volume break out. Since we have a weekly doji candle at this point, it IS possible that Gold dips back from here, but this Big Picture set up can be extremely bullish. The Big Picture remains very bullish.
.
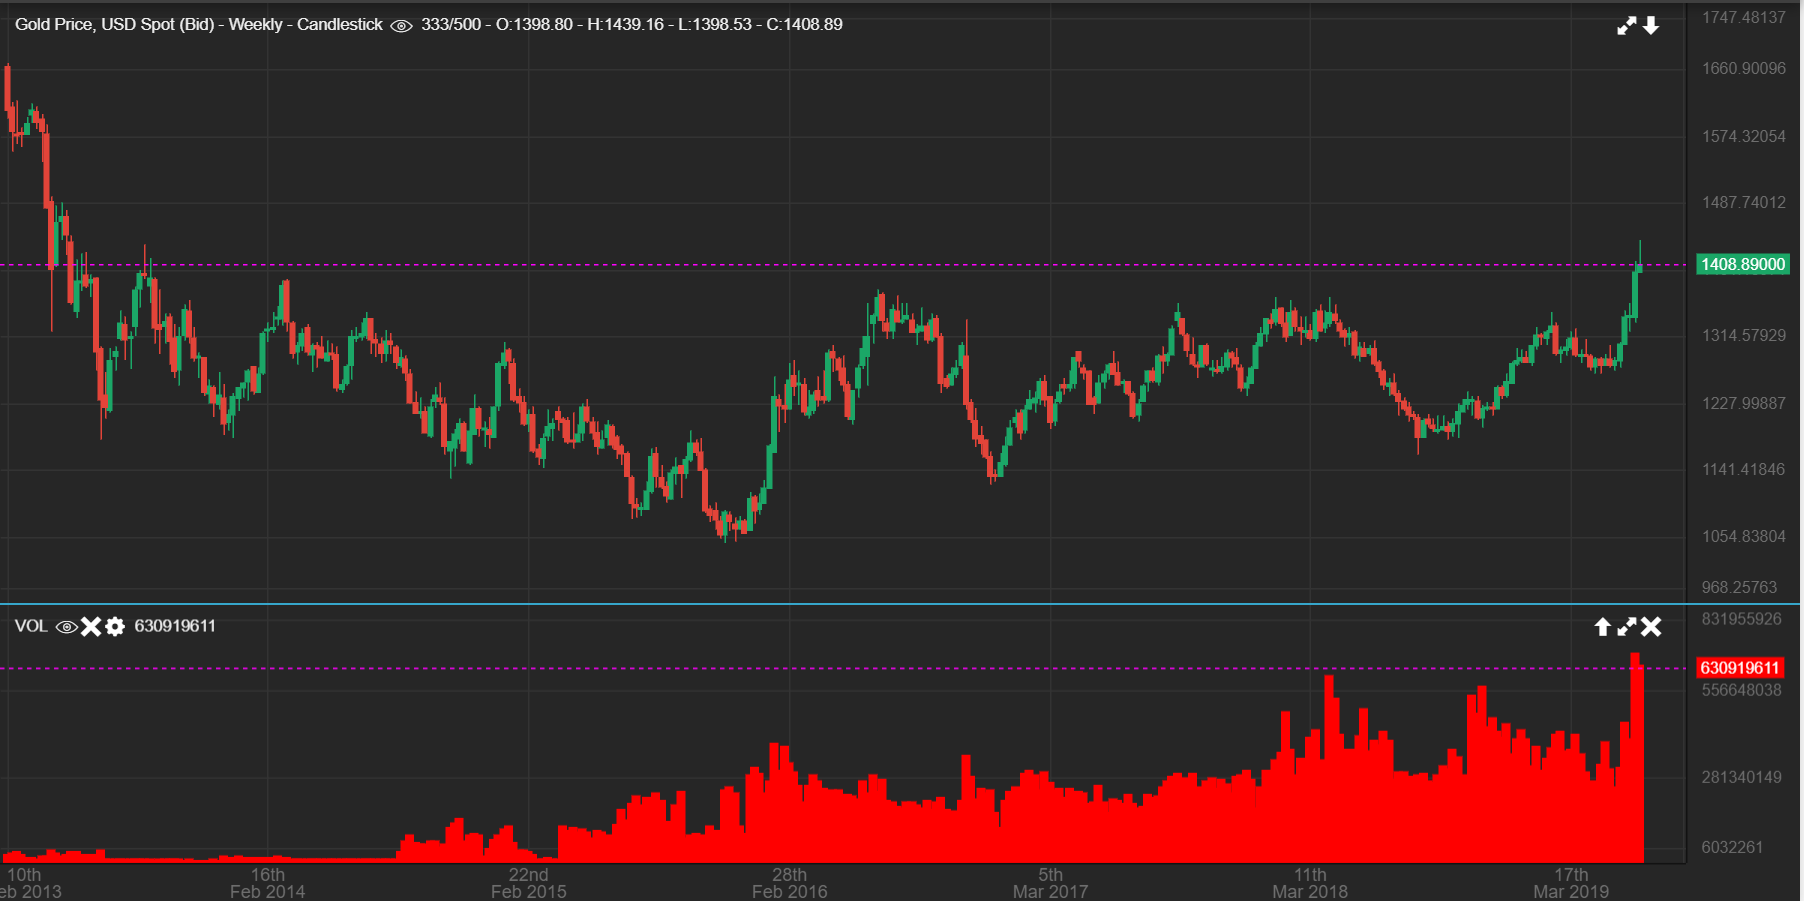
GOLD – Zooming in a bit helps us to see that Gold has taken out many prior highs in that base. If it pushes a little higher, it could rally quickly since there is hardly any resistance overhead.
.
Last week I showed how Gold ran after breaking from the 2008 consolidation – When the 2008 base broke, it ran higher for weeks. This one is trying to break out now too. I pointed to $1500-$1550 as being rather easily attainable. Running to former highs is likely over time.
.
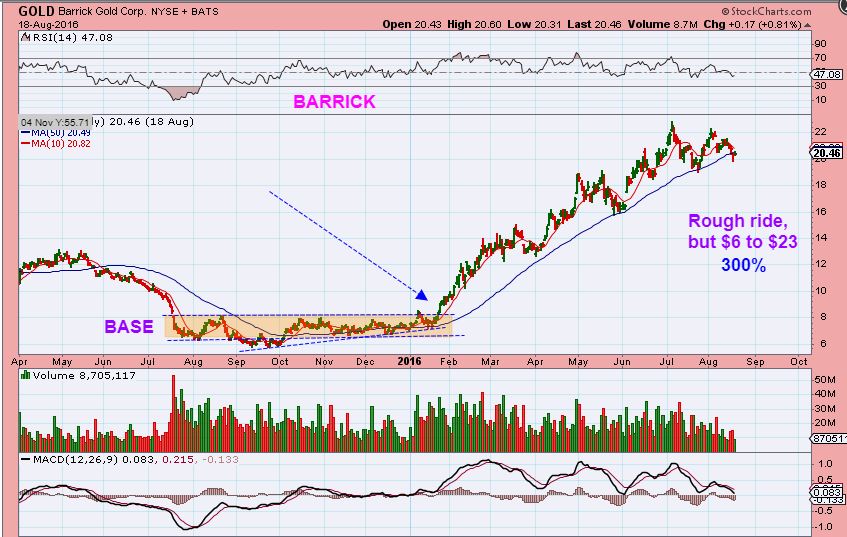
You may recall that last week I also showed how BARRICK, NEM, and a few other Miners broke from their bases in 2016 – Once they got OUT OF A BASE, we saw great moves that didn’t even back test. This also didn’t have deep dips to buy if you lose position, and since it did NOT back test the base, I have encouraged not selling your entire positions in various Miners.
GOLD WEEKLY – IF that ‘topping candle’ does call for a pull back, these are Fibonacci levels that are reasonable for a pull back. The 38% & 50% are most likely in this strong of a push.
.
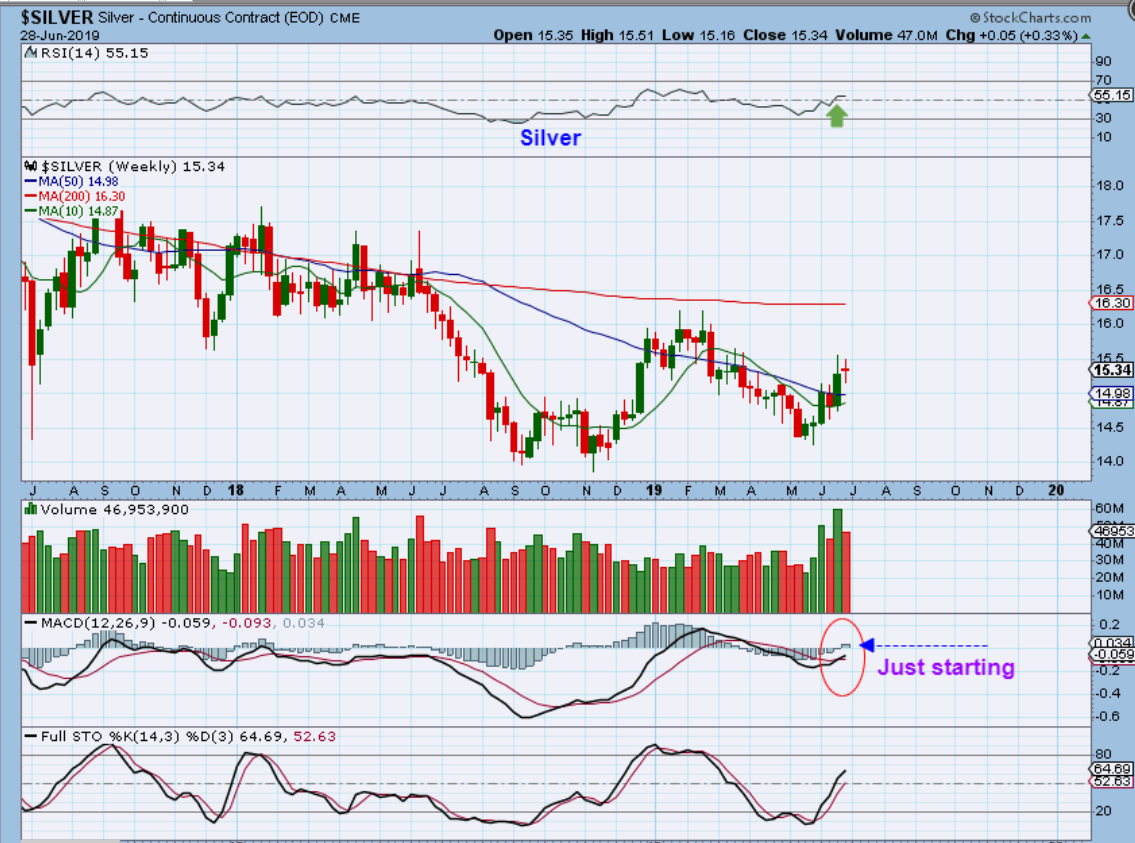
SILVER – Yes, Silver is lagging, and I get more emails about “Silver lagging Gold, isn’t that Bearish?” I’ve responded by saying that I have seen this in the past and when Silver plays catch up, YOU WANT TO OWN SILVER MINERS. Sound familiar? Well, I will go into this further at the end of the report, because based on what I am now seeing, the timing may be close for a nice rally in Silver Miners.
.
REMINDER: IN MY REPORT MONTHS AGO, I DISCUSSED THE SILVER VS GOLD RATIO OF 2016 with several charts . I will review that again, but in these 2 charts I pointed out something noteworthy …
.
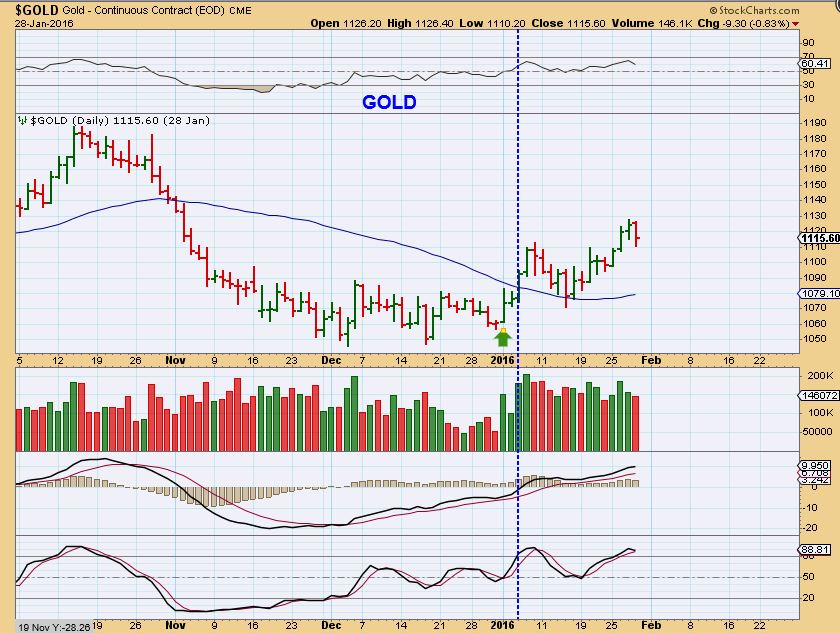
GOLD Bottomed on Dec 3 and broke the 50 sma in early January. Notice that Gold was well above the 50sma & lows by the end of January.
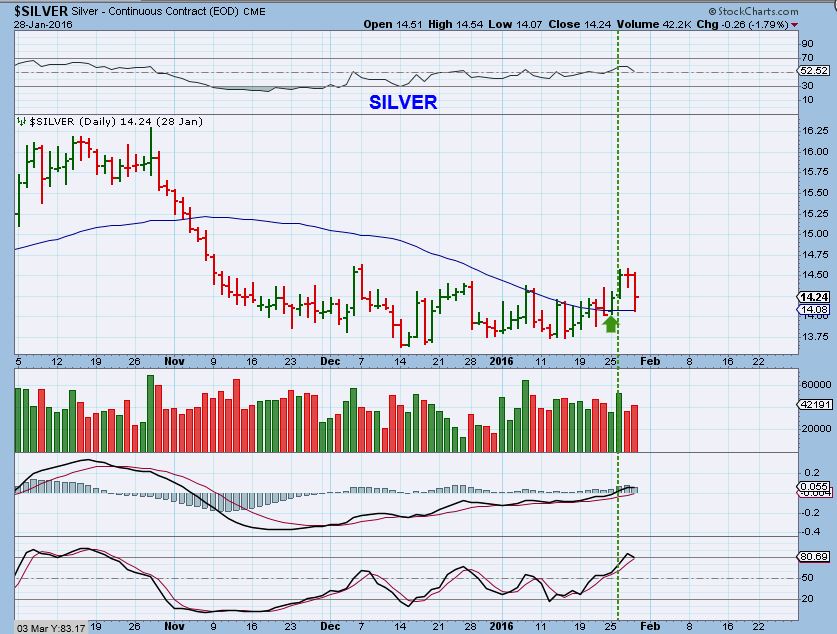
SILVER bottomed later in December, broke the 50sma in late January and was still near the lows in late January. That shows that Gold was leading early in the 2016 rally too, but what I show at the end of the report today will really clarify why I am ignoring the fact that Silver is lagging, and why I see it as Bullish for Silver stocks.
.
MINERS SHORT TERM VS LONGER TERM
.
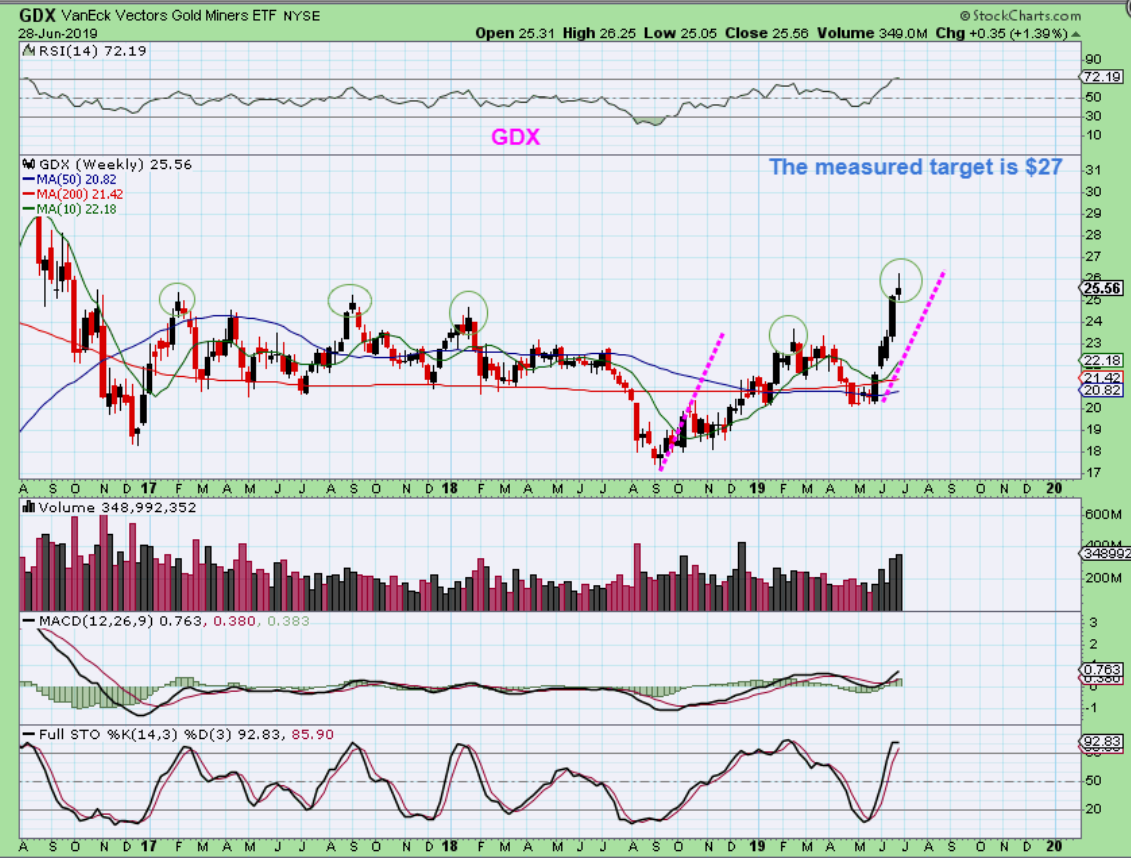
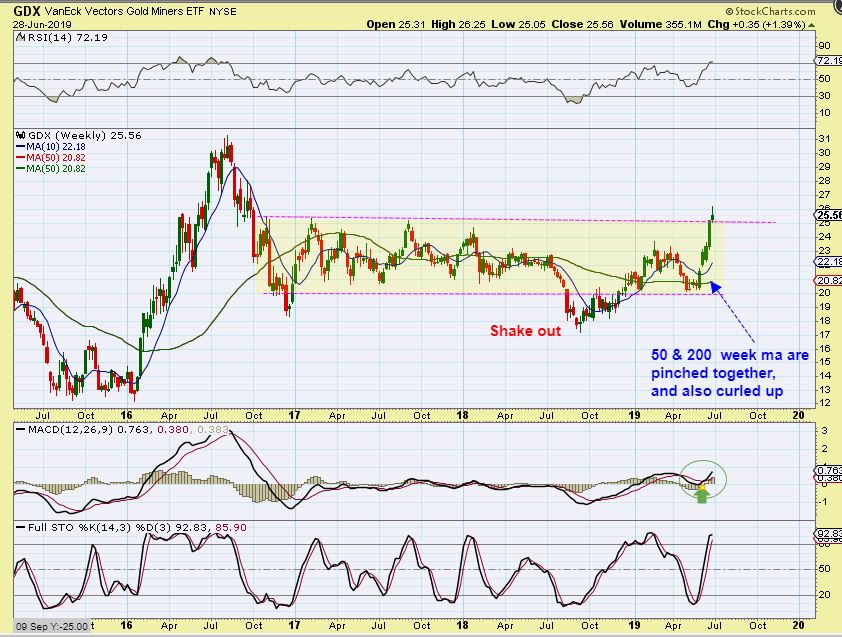
GDX WEEKLY- I had a measured target of $27-$28 for GDX, but it only got to $26.25 , and now we have a potential Topping candle on the weekly here too. This type of candle is how former tops showed up (circled), so it is possible that after this very strong run, the Miners may pull back here, but they also could just get choppy & go sideways, let me show you why…
.
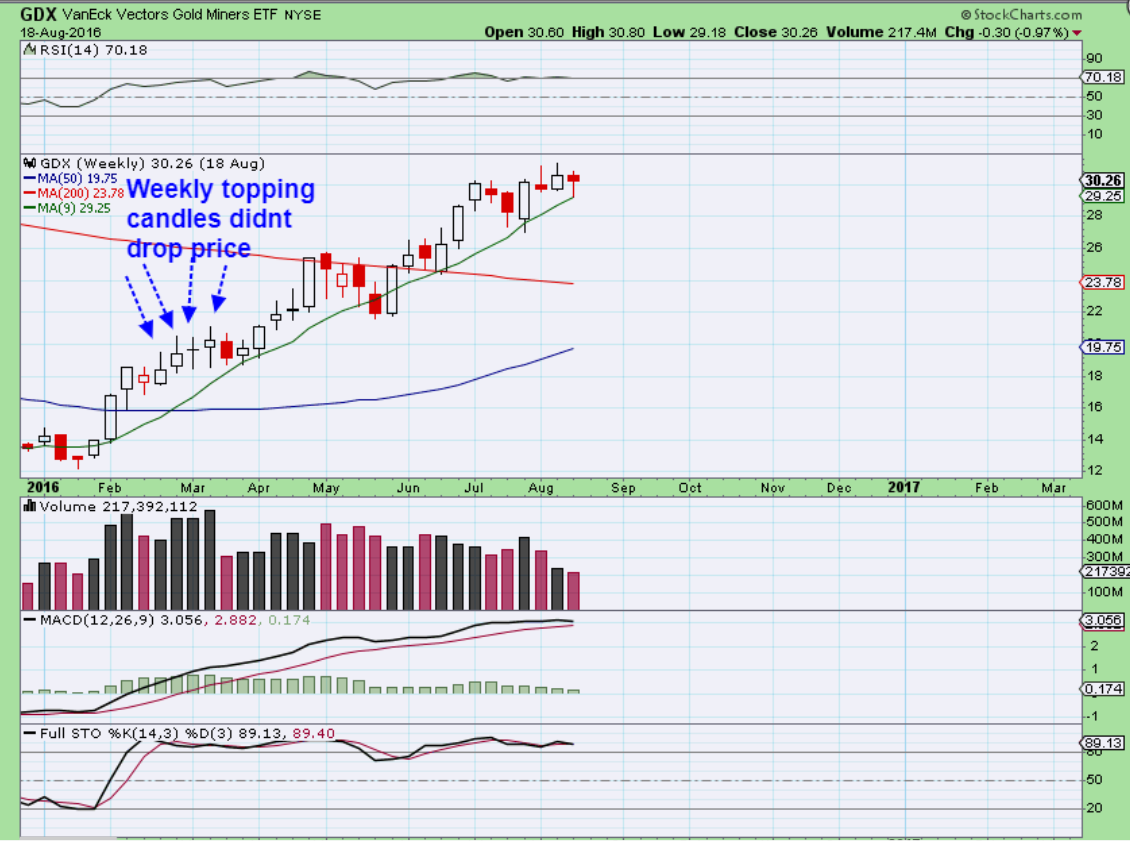
GDX 2016 weekly – We did see some of these same ‘topping’ candles in 2016, but price didn’t really fall back. Miners remained strong and it appears that dips were constantly bought, so price went sideways & then ran higher again. We could see that again, and…
.
GDX WEEKLY – And again, it is the Bigger Picture that I want to focus on and GDX broke out above this multiyear base last week too. So look again at the left side of the chart in that 2016 run. What if you want to trim some positions to lock in gains because you are concerned? That is a personal decision and that is fine. It can be part of a winning plan to lock in gains on the rise higher, but my recommendation has been not to sell all of your positions. Look again at 2016 on this chart. In 2016, if you sold your whole positions 2 or 3 weeks into the run, where would you buy back in? Higher or maybe never.
.
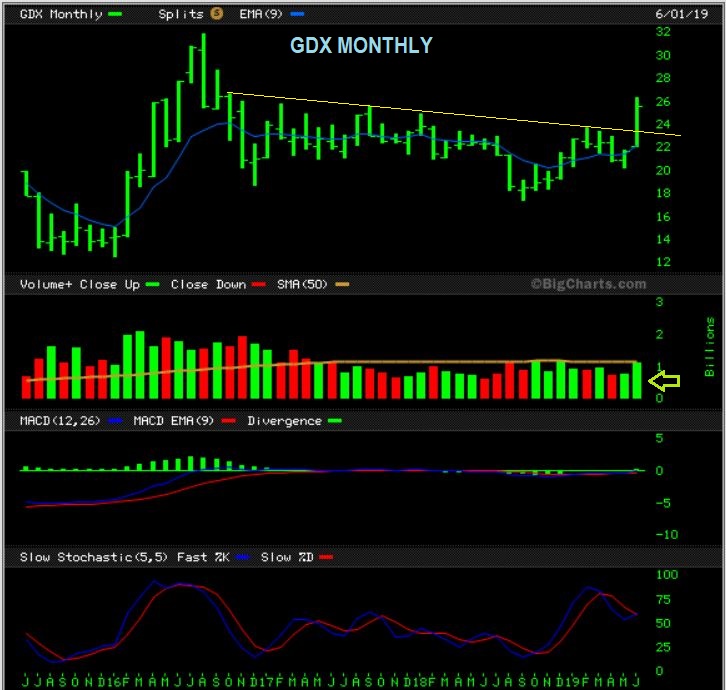
GDX MONTHLY – The Monthly chart at the end of the Month is the break out that I have been discussing for months, and is Beautiful ! Breaking from this kind of a consolidation can lead to months of gains going forward. My next chart looks a bit crazy, but it isn’t…
.
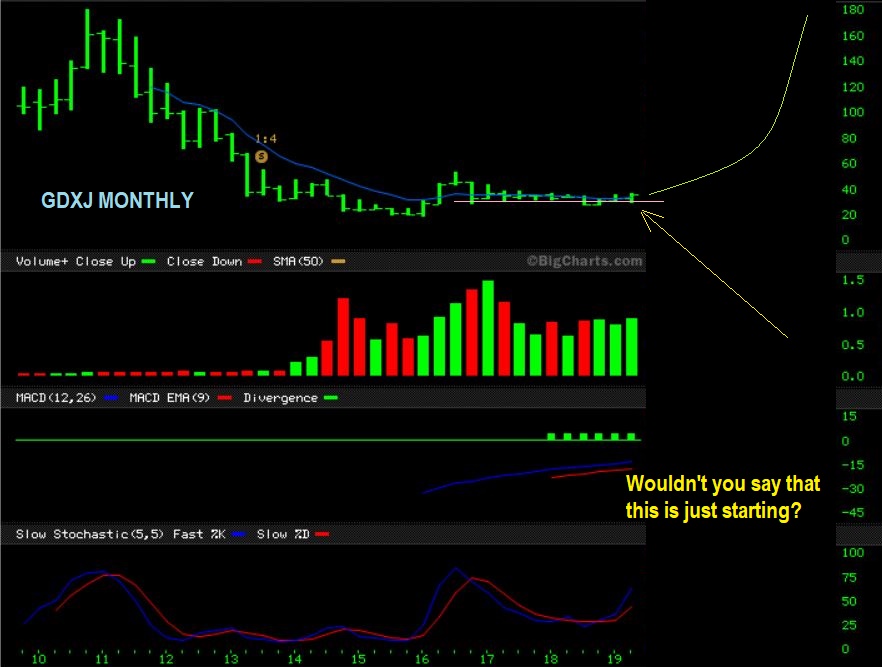
GDXJ MONTHLY – Look at the Month of GDXJ and you can see that the move so far is small compared to the potential. Over time this could go MUCH higher, but there will be dcls and ICLs on the way. Despite that, we could make serious gains over time as we trade setup after set up in various Miners and the ETFs. Options are an option too at Icls and maybe an earlier dcl.
.
So it was another good week for the Precious metals and even some of the regular ‘Metals’ stocks. In some Miners, we have started to get some sideways moves or even some dips, and these are the times that we can look for areas to buy the dips. I have pointed out some ideas, and I will continue to do that going forward. This is how we have progressively looked at CDE for an example of possibly buying the dips:
.
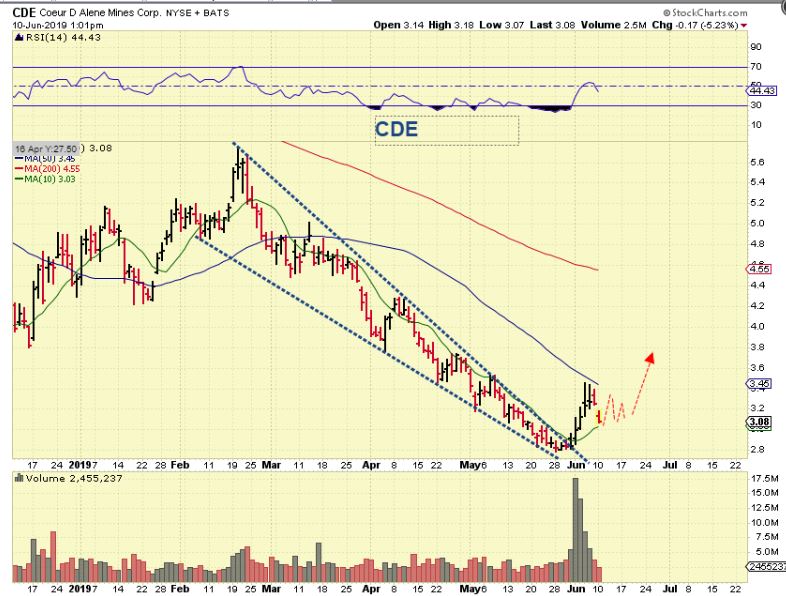
CDE – We were starting positions as it came out of the wedge after the Fed Minutes at the end of May.
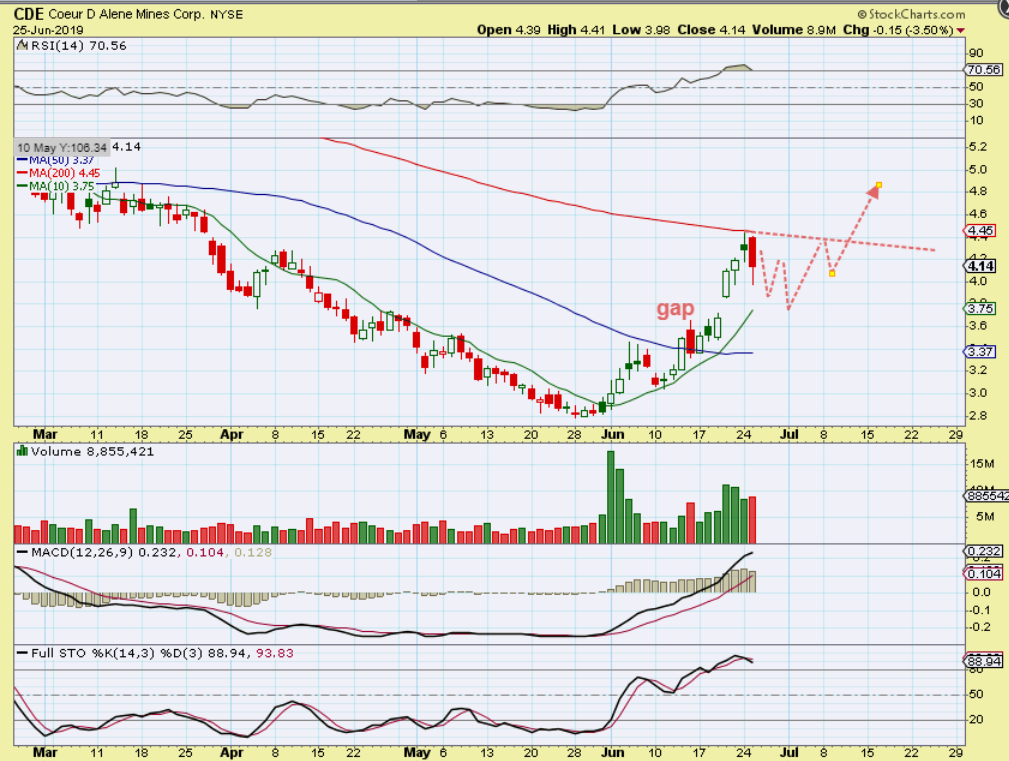
CDE – After the anticipated run to the 50sma, I discussed a possible bullish pattern before breaking above the 50sma as a buy or Buy the break out.
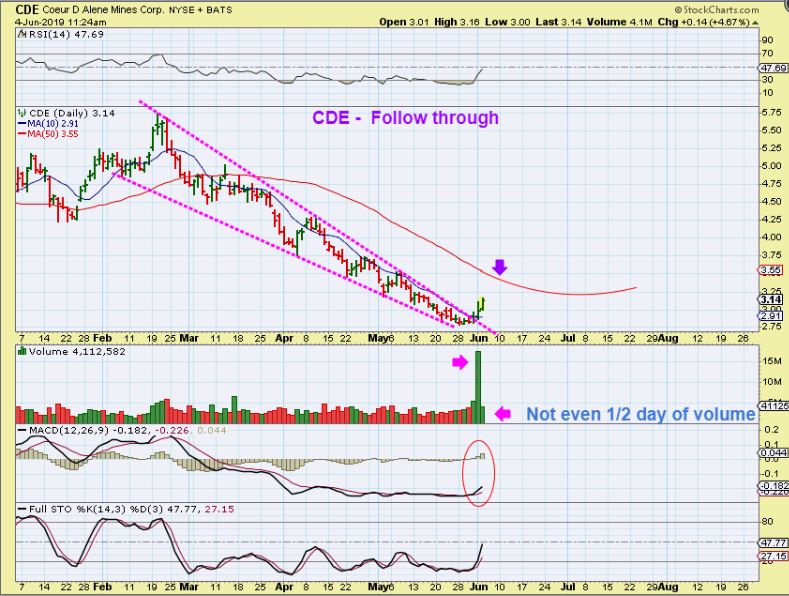
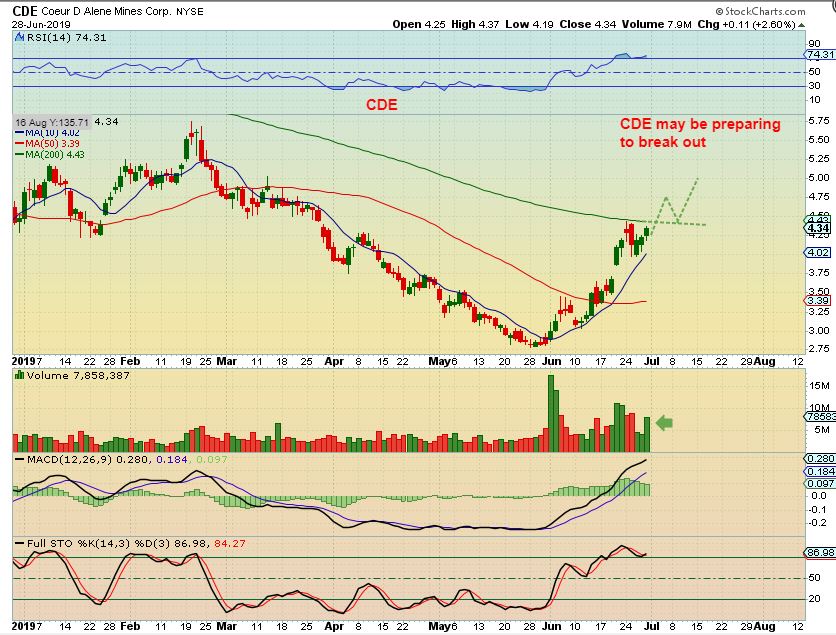
CDE – It broke out & ran to the 200sma. This week I pointed out that we may be seeing something similar here too, where the price may crawl along the 200sma before breaking out ( add partially or fully to a position near the 10sma, add on the break out, or it may drop to back test the 50sma as a Buy).
CDE – And this is CDE as of Friday. As mentioned in past reports, a drop to the 10sma may be all we see on some of these Miners. It had an increase in Volume and it is possible that it will increase even further if it breaks out Monday, with shorts being forced to cover. When I discuss Silver at the bottom of this report, I will be mentioning CDE again.
.
So the Miners are acting correctly and Bullishly at this point. I will discuss something else that I think you will find Important and quite possibly very timely at the bottom of this report. Try your best to keep that Big Picture in the back of your mind as you trade the Miners, it will help when it comes time to buy the dips. So far we have been able to enjoy some very good gains over the past few weeks. Along with that…
.
Enjoy the rest of your weekend. 🙂
.
~ALEX
.
How about what may be some Great News? !
.
I often follow various ratios in the Precious metals sector. You’ve probably often seen me cover the GDX vs GOLD Ratio at the start of an ICL or DCL to gauge whether or not Miners are leading or lagging. Silver vs Golds ratio is another one that I check from time to time, and last week Matt from Australia sent me an email & his chart of the SLV VS GLD ratio that reminded me of the discussion I had along time ago about Silver bottoming after Gold in 2016, and also Silver lagging Gold in 2016. ( Thanks Matt) .
SILVER LAGGING GOLD IN 2016 DID NOT HURT THE RALLY THEN, so I pretty much have ignored the imbalance now and have simply stated that “When Silver plays catch up, and it usually does, the Silver stocks will probably fly.” I have also recently recommended AGQ or USLV as a way to catch that move when it unfolds, and I do think that it will.
.
After doing some additional research while waiting for my flight at the airport yesterday, I think that I have found something else that I find not only very interesting (It certainly caught my attention), but this will be VERY IMPORTANT if we see things playing out this way soon. Let me show you what I found…
.
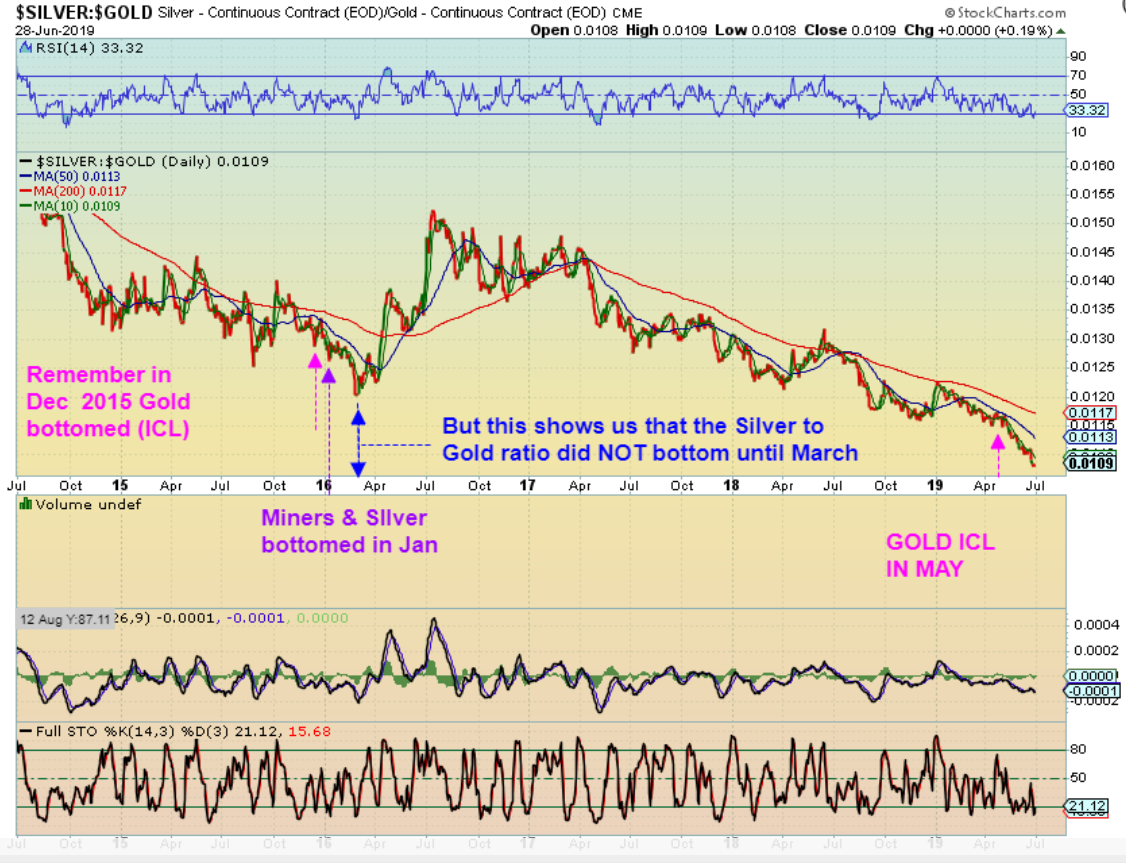
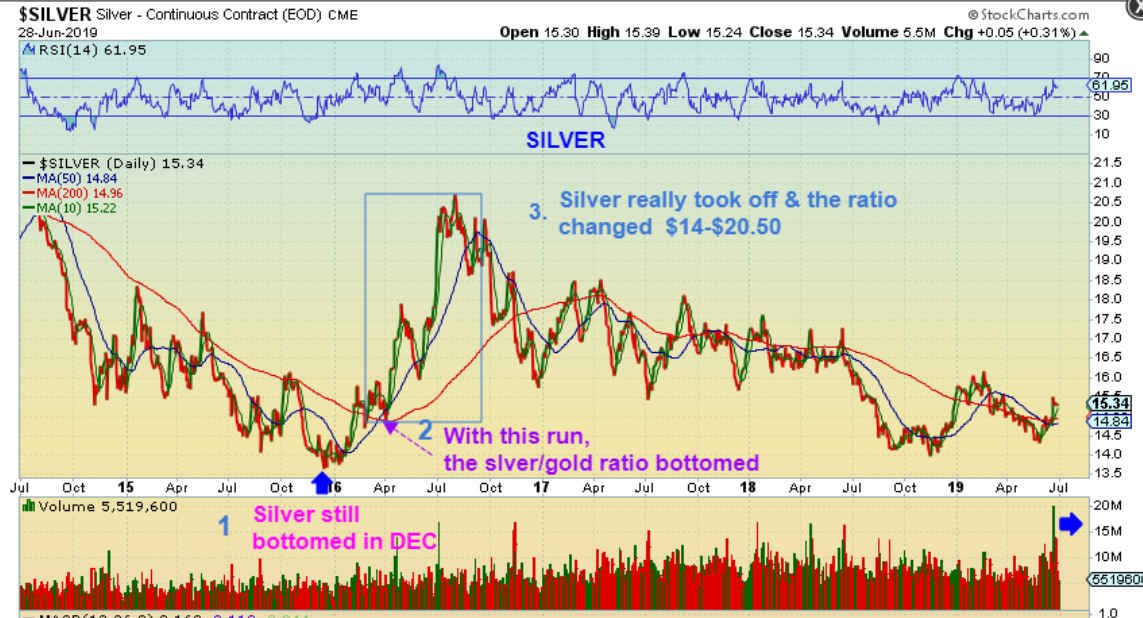
SILVER GOLD RATIO 2016 & now – As a review, follow along on the chart.
1. Magenta arrow, Gold bottomed in early December 2015, but Silver bottomed late Dec/Early January 2016 with Miners,
2. But the SILVER / GOLD RATIO did NOT bottom until MARCH.
3. That was months after the ICL, and we may have that happening again now.
4. Why is that important to you & I ??
.
SILVER RUN 2016 – Silver bottomed In Dec & Jan 2016, and the first small push higher obviously didn’t change that Silver / Gold ratio, because Gold was still doing better. I showed that in the other charts using the 50sma. Now look at this with 2016 & Now…
1. Silver bottomed & ran near Golds ICL, but Gold was leading then & now. Why?
2. Silver broke above, but then stalled & bounced around that 200 sma, Then & Now.
3. Notice that a flag formed at the 200 sma in 2016 into March & THEN Silver really started a major run higher. That could happen here too, and…
.
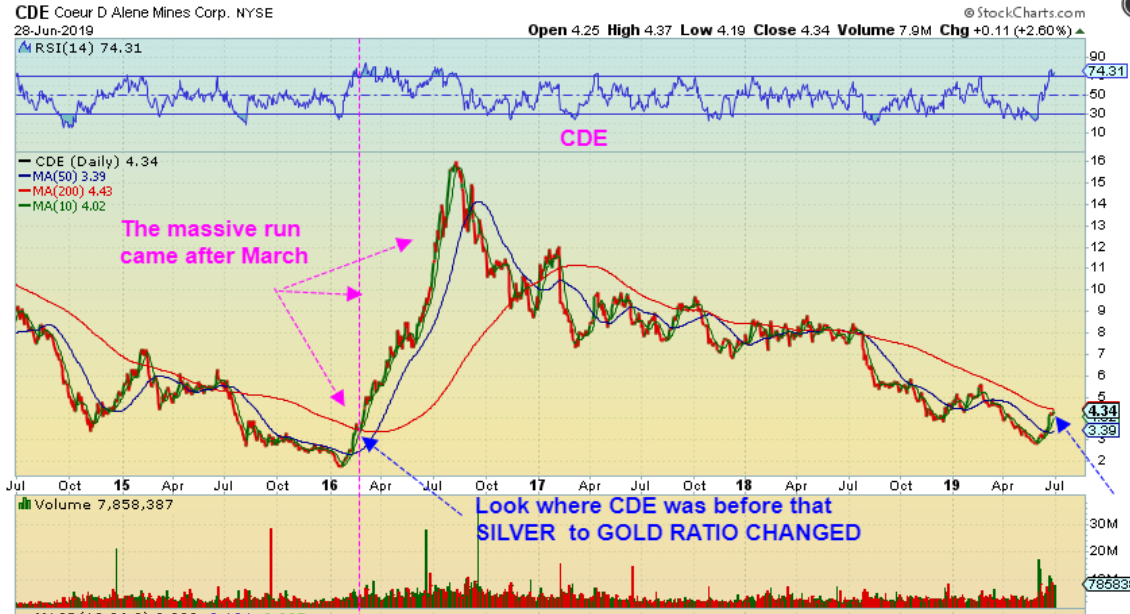
CDE MASSIVE RUN – Now look at the CDE run to the 200sma then and now. From Jan to March 2016, CDE made small gains to the 200sma, similar to now. When Silver took off in March and the Silver vs Gold ratio flipped? Silver was leading and THAT IS WHEN CDE took off, so …
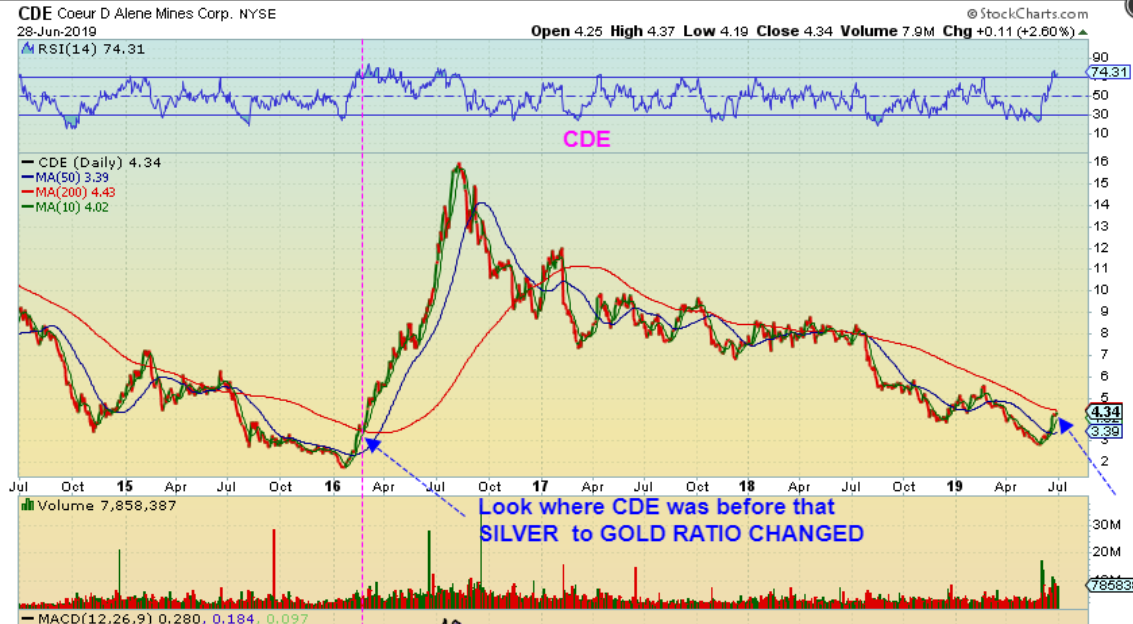
CDE MASSIVE RUN –
It was from March 2016 onward that CDE bolted straight up from $3 to $16, more than quadrupling, right? The set up looks very similar now with CDE making that run to the 200sma. We caught the absolute lows again 🙂 And…
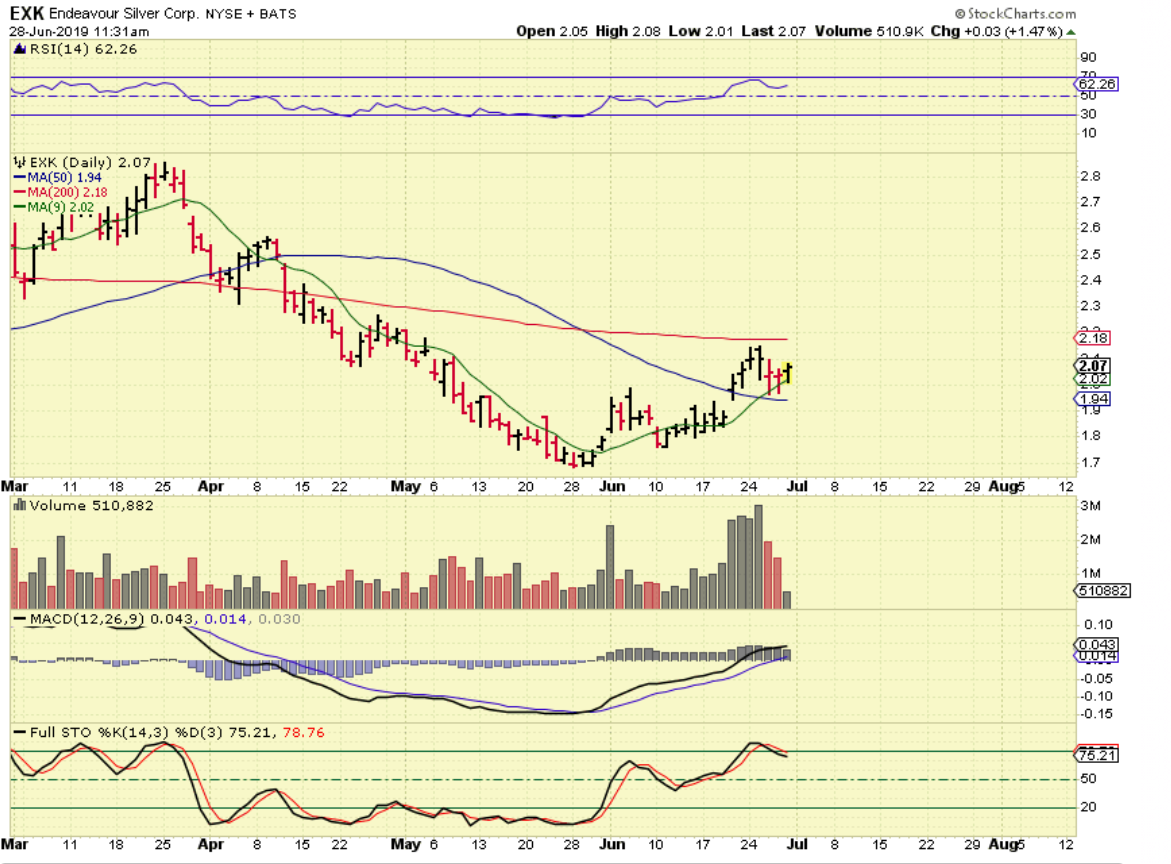
EXK – EXK made smaller gains at the start of the 2016 run too, as it approached the 200sma. Silver was lagging until march. After the Silver vs Gold ratio broke in March, EXK then quadrupled.
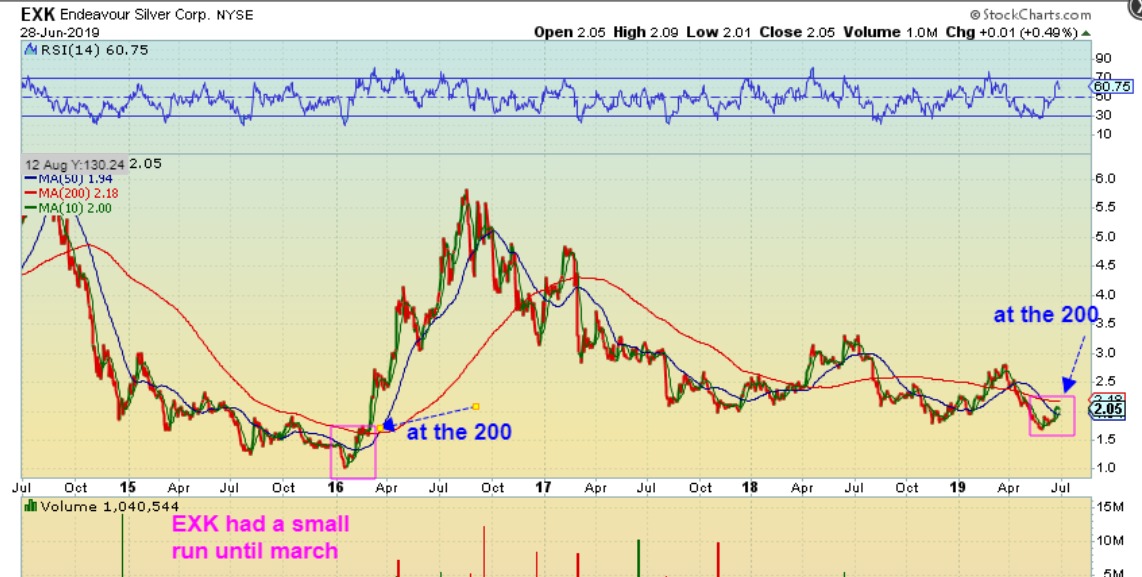
EXK – I have been pointing out EXK as it broke the 50sma and I mentioned that the volume was telling us something important. It then back tested the 50sma last week, and I pointed it out as a buy. EXK reversed off of the 50 sma last Wednesday and this could be setting up to break that 200sma soon. Look at the difference in Volume lately.
HL – I am NOT saying that all silver stocks are equal to the 2016 time period and AI’m not saying that ALL silver stocks will triple & quadruple. Here you can see that HL actually broke down below the 2016 lows and made deep new lows, but it also had a slow start in 2016 and really took off after that Silver vs Gold ratio showed Silver taking the lead in March 2016. Look at HL from March 2016 onward.
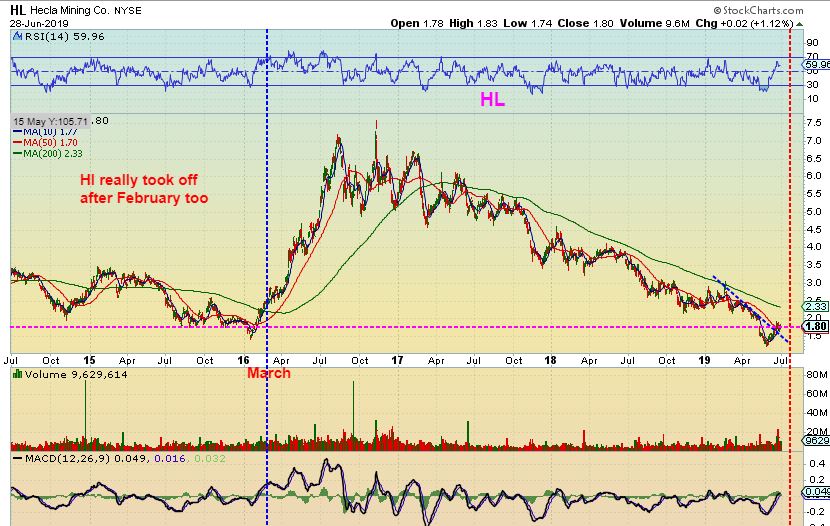
Many of the SILVER STOCKS acted this way.
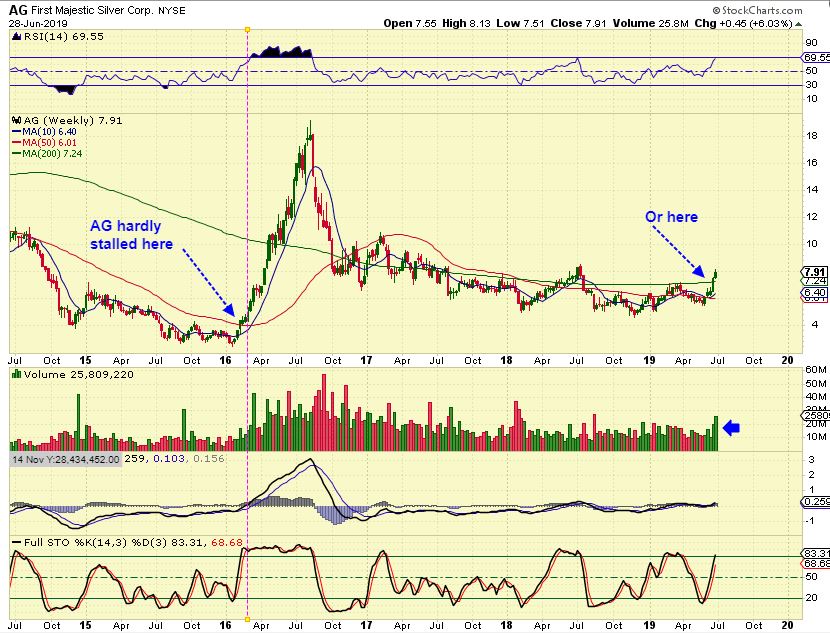
AG actually paused very little into March 2016, and also seems to be pausing very little now.
.
So the above is just another observation that I made while studying that 2016 Rally. It is something to take note of and it might just be something to profit from in a big way if the Silver stocks do rally in a similar way that they did in 2016. It was after they broke their 200 sma, and after the Silver / Gold ratio broke out, that Silver stocks made the better part of their gains. It would seem that that time period is still ahead, so I’m not worried about Silver lagging right now, I’m looking forward to seeing if it plays catch up!
.

