
Wed June 26th – A Dip?
Today we have a little more to talk about. A Dip. Let’s go to the charts…
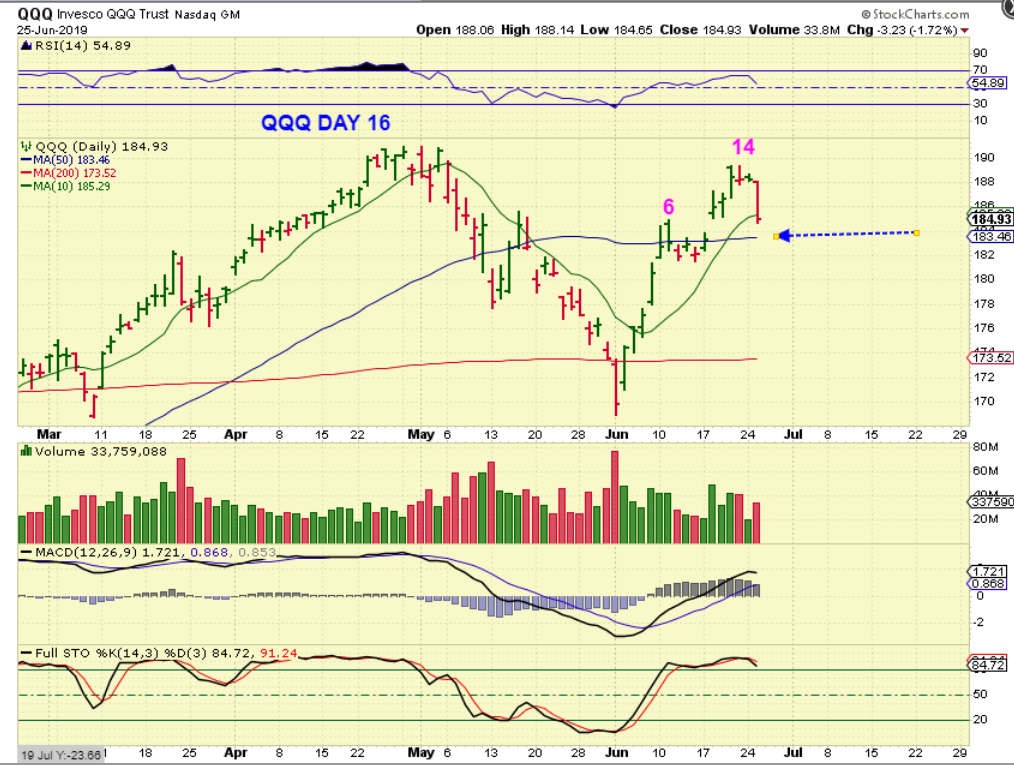
QQQ – The General Markets sold down pretty sharply Tuesday. A day 14 peak would be Left Translated and bearish at this point. Will the 50sma act as support? Normally I would say yes, but this time I am thinking that it may not, and this is why…
.
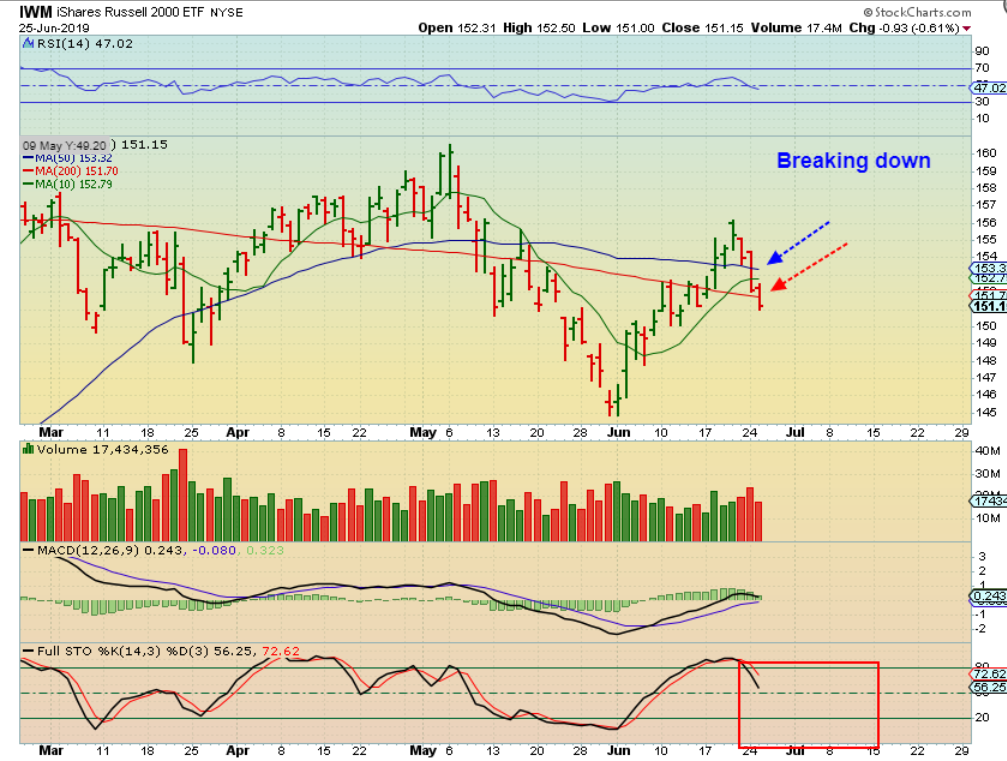
IWM – The Russell seems to be leading the way down. It broke & closed below that 50 & 200sma. This is a sign of a weakening market in my opinion. Add to that, this…
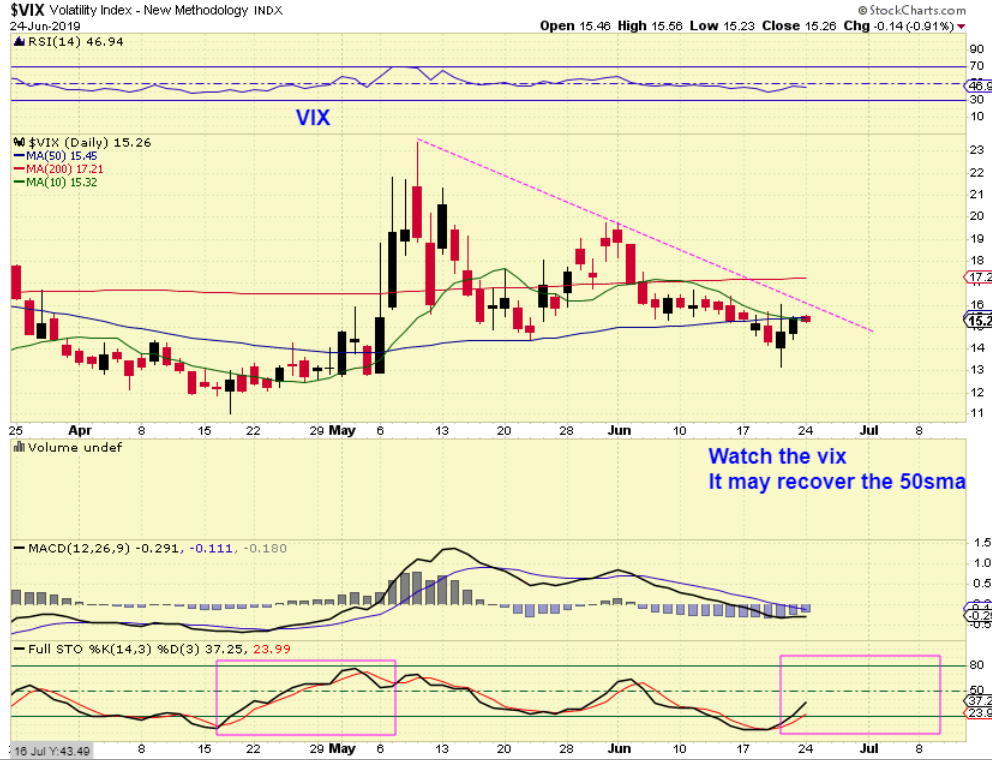
In yesterdays report I wrote this:
.
VIX – Keep an eye on the VIX. A burst higher on the vix could cause the markets to sell off. We also know that the economy has softened enough that the FED now wants to cut rates, yet the Bulls think that ‘nothing has changed, well have 5 more years of Bull market’. Maybe we do with the Feds help, but only Time will tell.
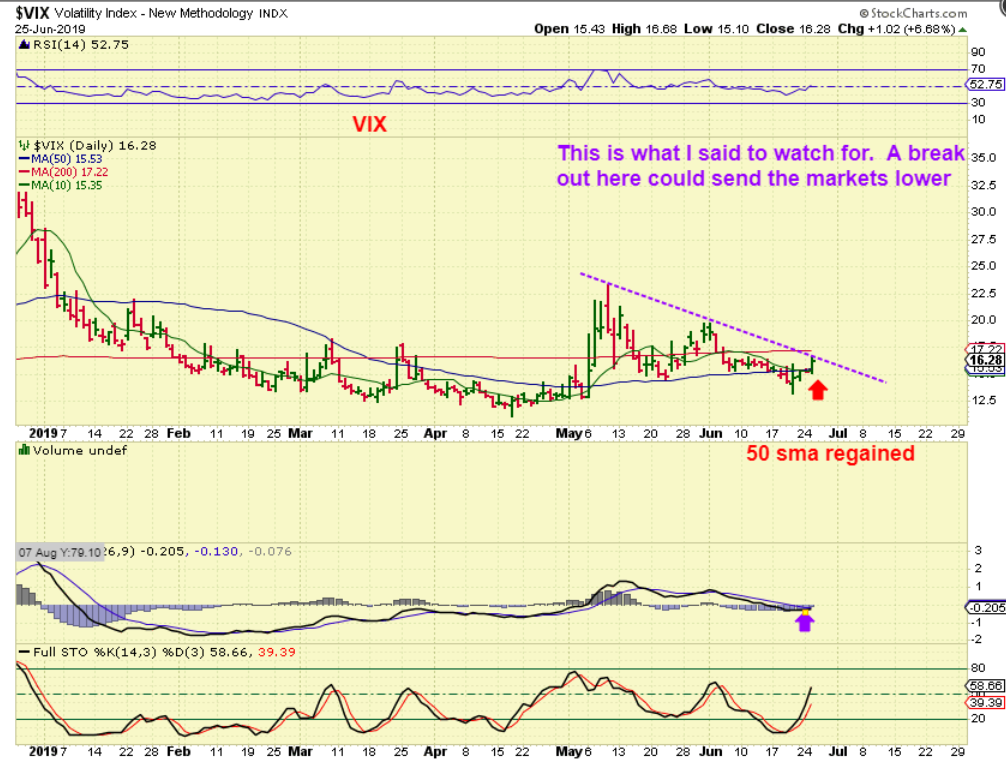
VIX – The VIX popped and has regained the 50sma & is pushing on a downtrend line. It looks bullish, and that is not good for the markets if it breaks out.
.
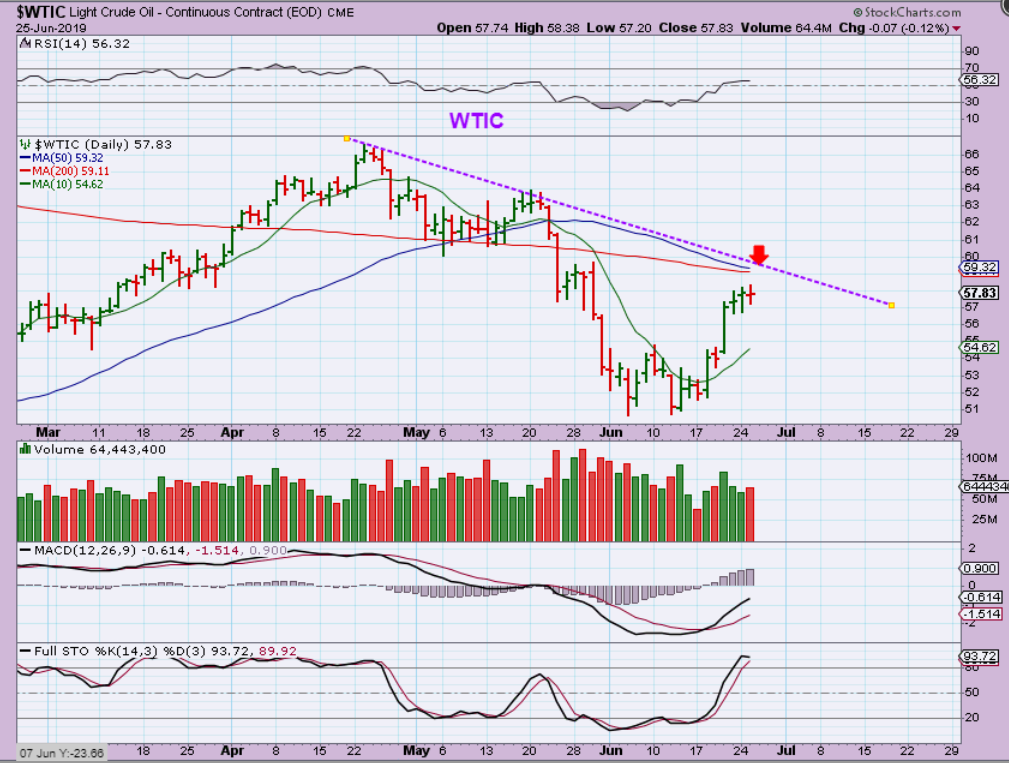
WTIC – Oil is flagging as it approaches a confluence of resistance points. Oil inventory reports are released on Wednesday and may help us to see what direction Oil wants to travel.
.
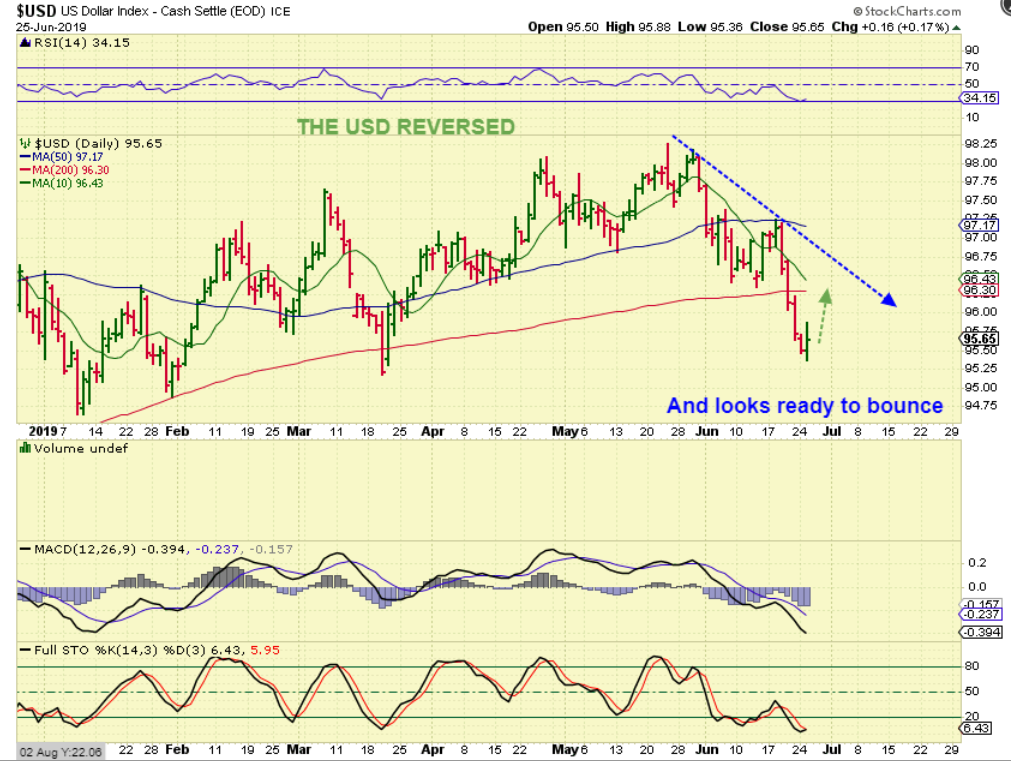
USD – This USD reversal looks ready to bounce & that will put pressure on Gold.
.
GOLD – I mentioned my Fib Targets in my Monday night report. I wrote…
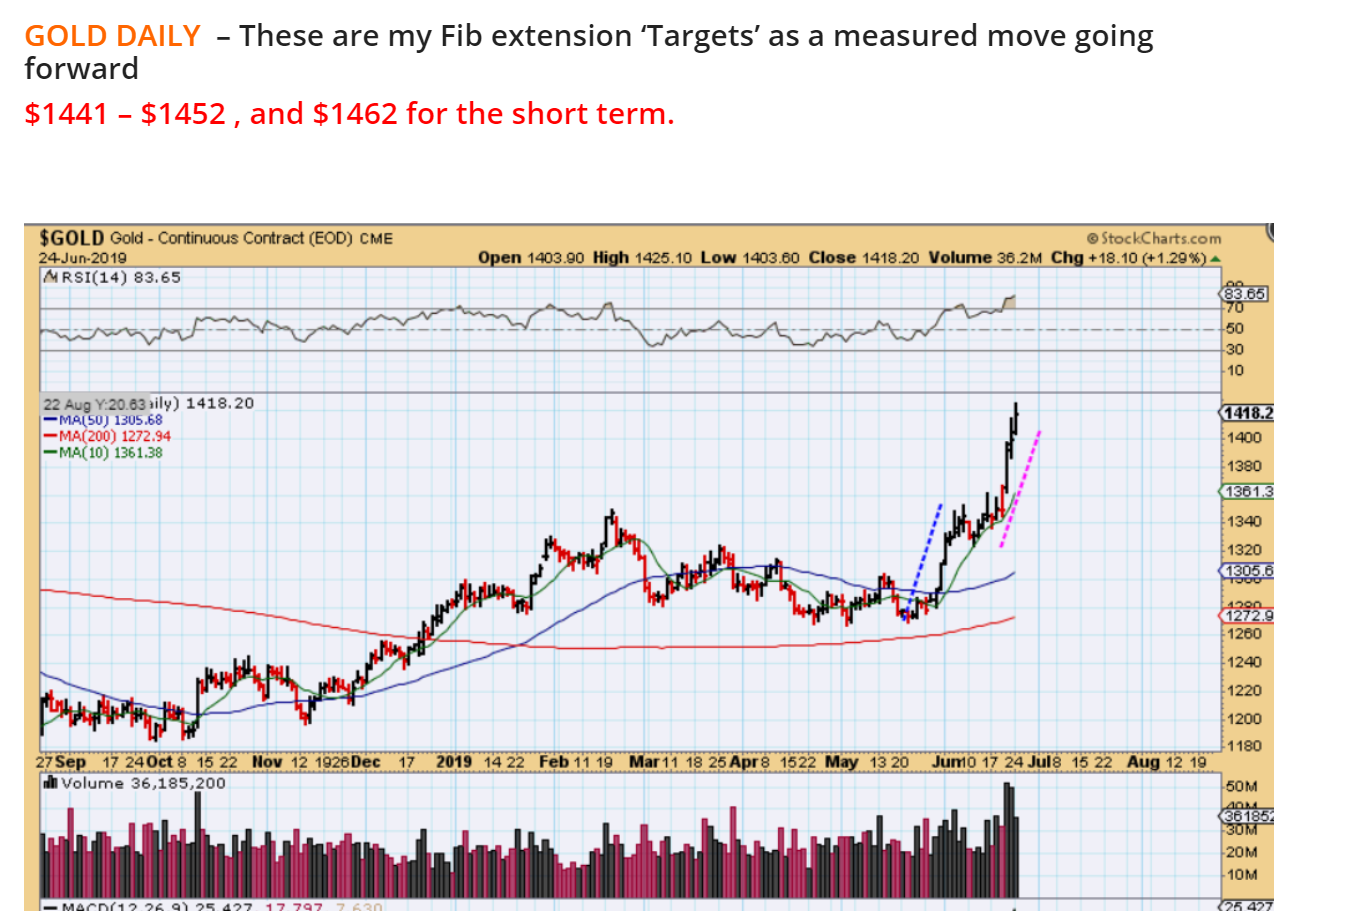
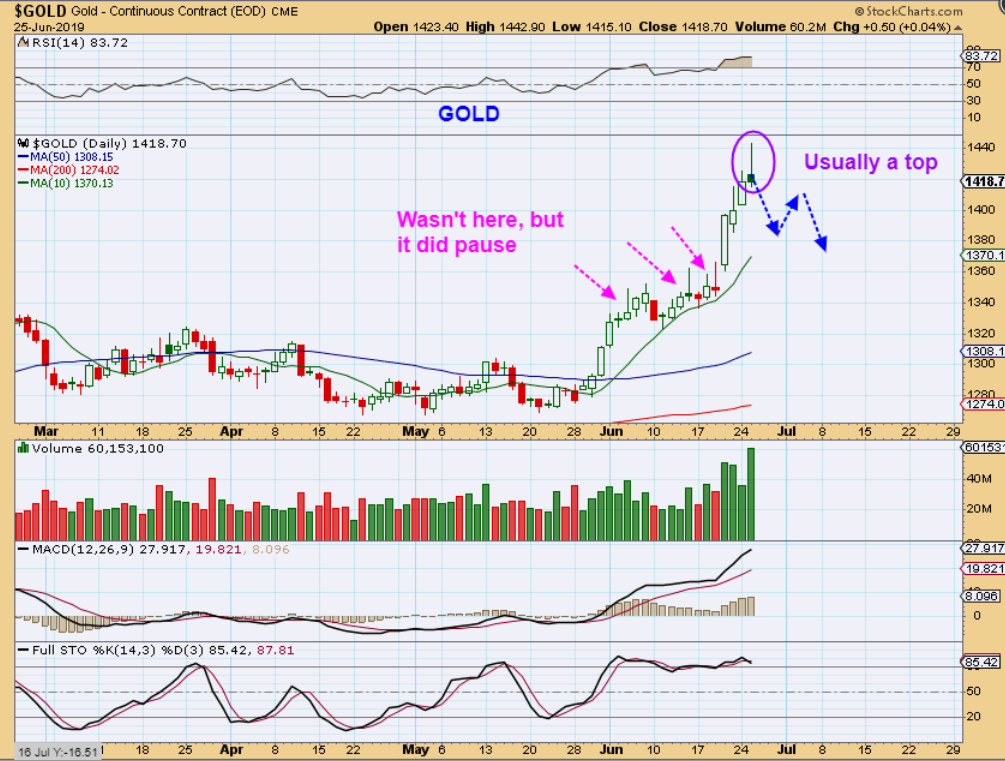
GOLD – This chart shows that Gold hit $1442, another service that I use says it hit $1439. EITHER WAY, reaching within a couple dollars can be enough, and Gold did reverse after tagging that area. Now we may see GOLD DIP. That also is a ‘topping candle’, but you can read the chart for more thoughts about that.
.
GOLD (Same chart)– My honest thought at first glance is that the target was reached & we have a reversal, we will likely dip into a dcl. That would break the 10sma ( $1370) & eventually reverse for the next daily cycle to begin.
.
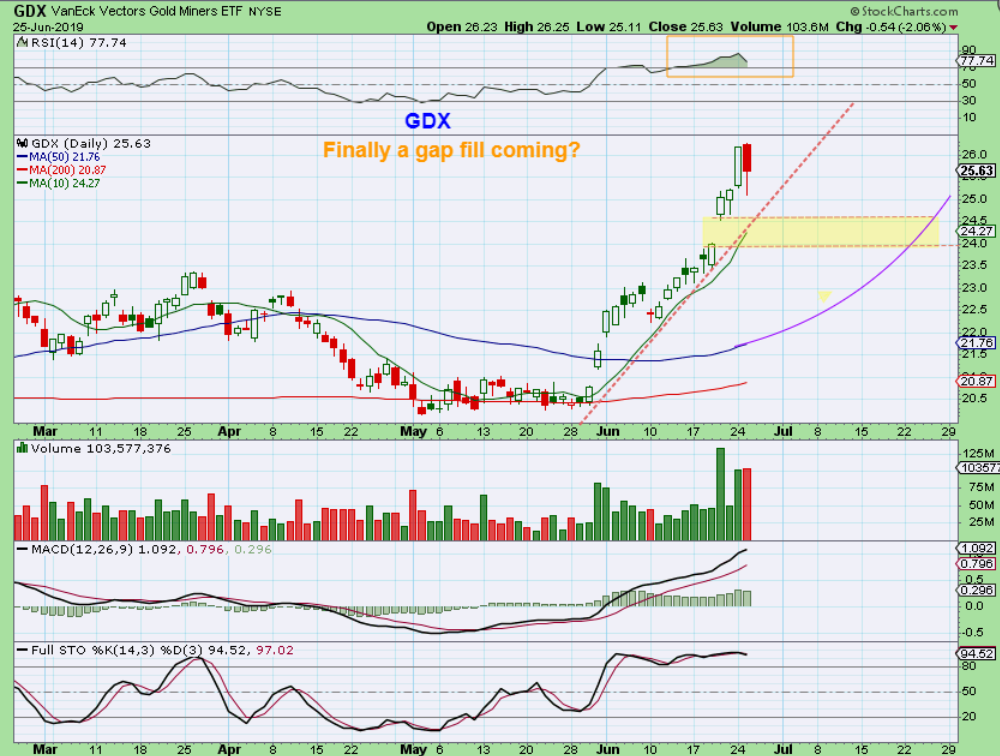
GDX – This has been a great run. This ran 8 days in a row green, then had 1 red candle, then ran 10 more green days. 19 days with 1 red candle is impressive! A dip is due, a gap is open at the 10 sma, we will see how this plays out.
.
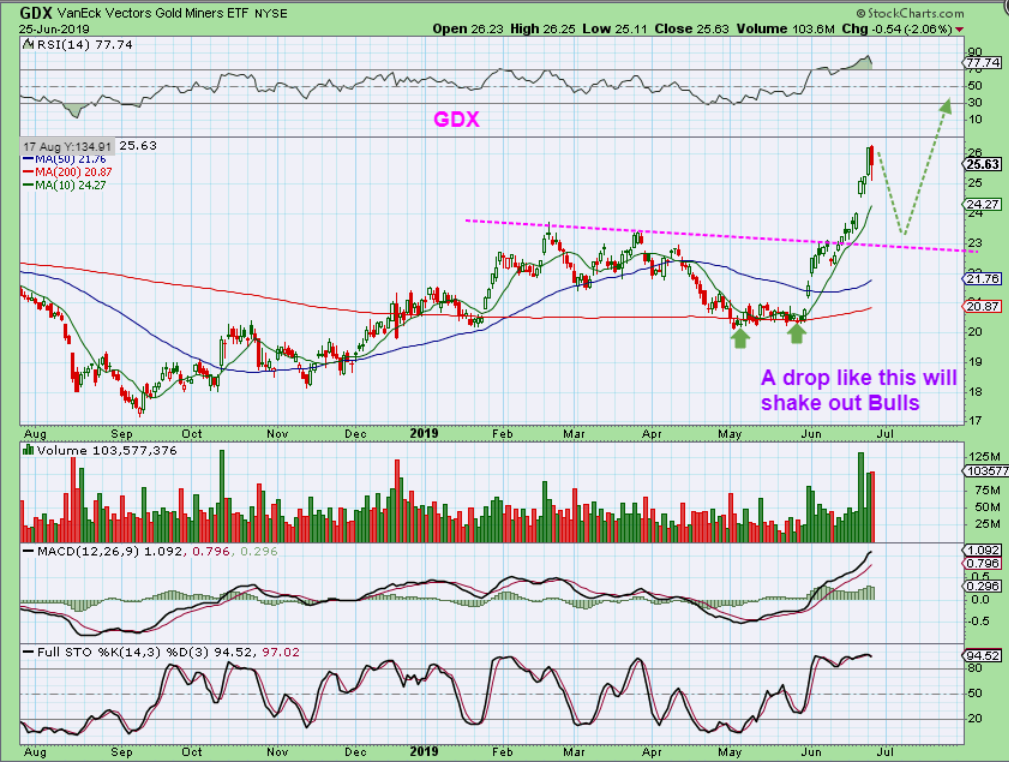
GDX – Yes, it COULD drop to back test the 50sma and scare a lot of Bulls away. Now I am being asked…
.
Now I am being asked… We are at the highs, can I sell? You can lock in gains any time you want. I would not sell it all, sell 25%? sell 1/2? That is your decision, and be ready to buy if we get a reversal after breaking the 10sma.
.
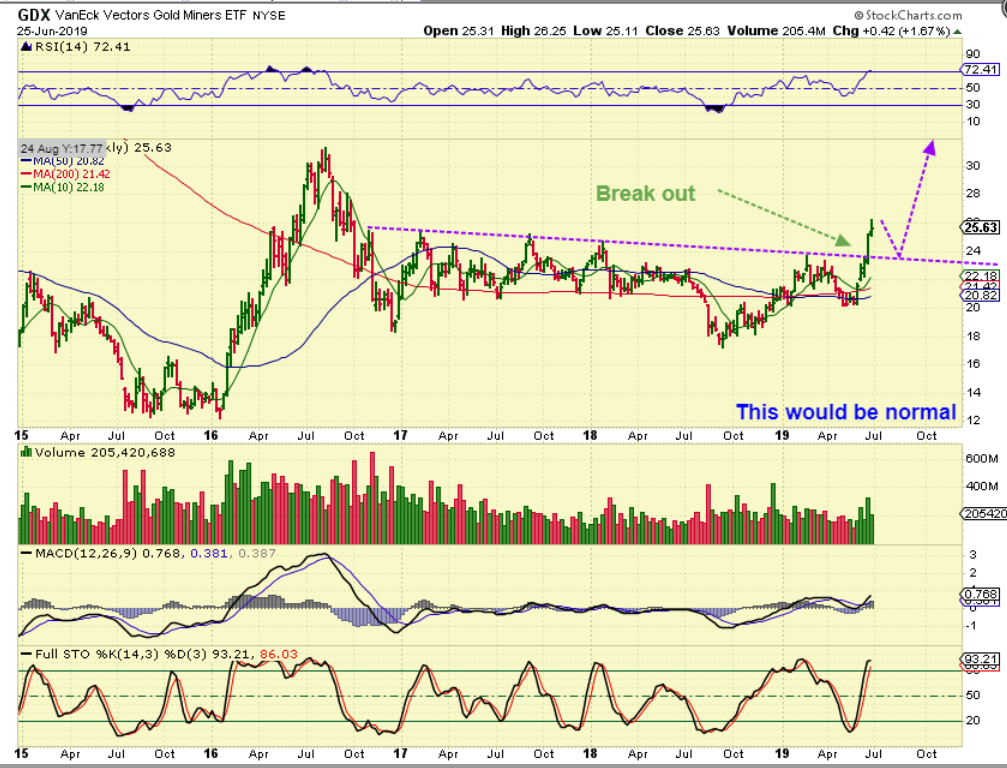
WEEKLY CHART: Do we have enough time to drop like this? I don’t know, but this is also a normal back test in a bull market, so it can happen. I still believe that we go higher from here over time. Since this drop can happen, we would look for price reversing there. That is a low risk Buy on support with a stop.
.
Many want to sell ‘Something’, and I do not blame you, since we have very good gains. If you sell just a partial and it just keeps running, you are still invested & gaining. If it dips lower & you buy back as it reverses at the 10sma or gap or 50sma, or back test support- you enter with a nice low risk entry again on your other partial buy. The choice is yours.
.
Below I will discuss just a couple of thoughts. Enjoy your Wednesday trading!
.
~ALEX
.
JNUG Volume Spikes – Yes, 3x etfs SPIKE on volume near turning points. I have seen it at highs, and lows. I have seen it on THE HIGH or LOW, I have seen it 2 days before the Peak, so I thought I would share a chart. Lets just call this chart..
.
JNUG SPIKES & TURNING POINTS – It does not necessarily indicate THE TOP, but a top can come at any time.
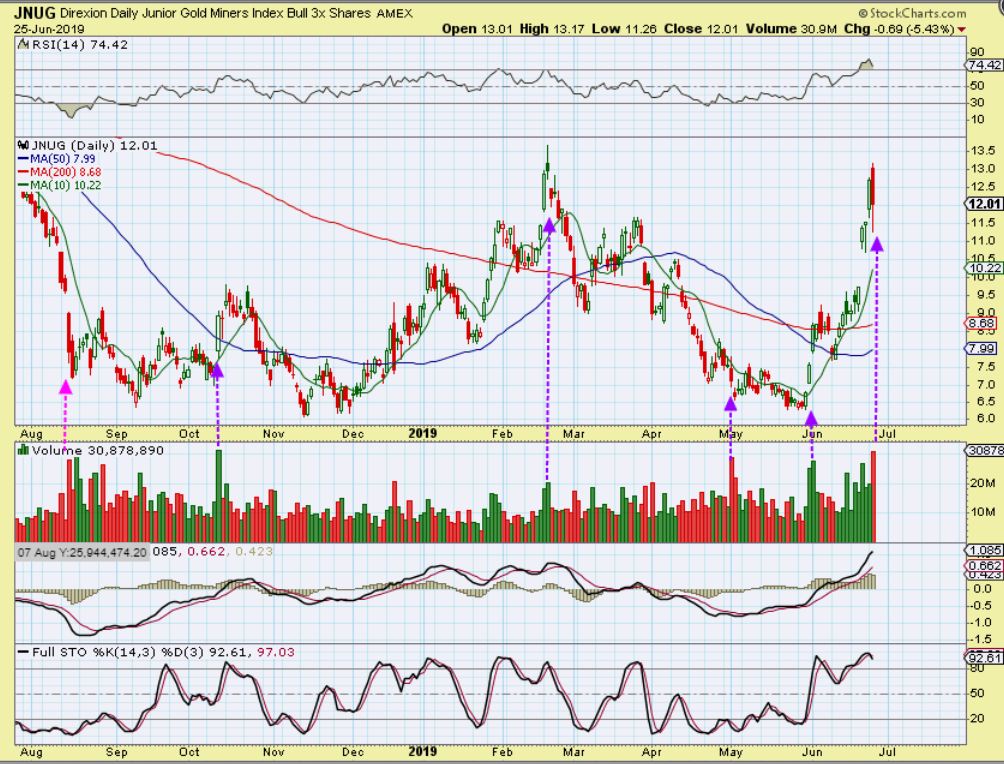
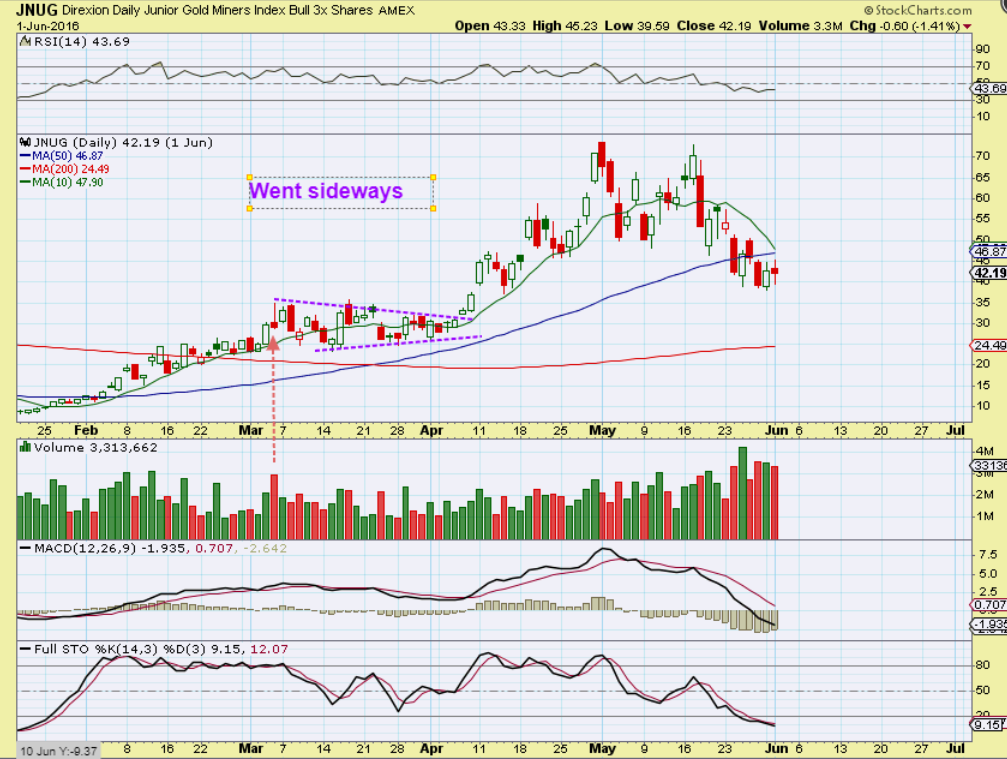
JNUG 2016 SPIKE – During our 2016 run, JNUG Spiked near a top, but it didn’t drop hardly at all. We got that midpoint triangle and then a continuation higher after almost 3 weeks of chop. NOT AN EASY RIDE, many people no doubt began to think that Miners were weak, etc. Just another history lesson for us.
CDE JUNE 10 – So We bought CDE at $2.85-$3.00. It stalled at the 50sma, and I guessed that maybe it’d tag the trend line or bull flag & break out…
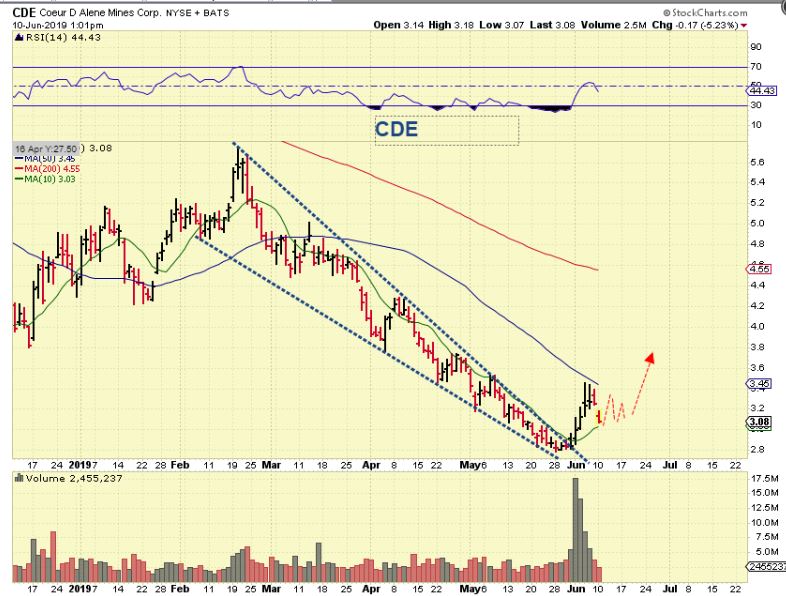
.
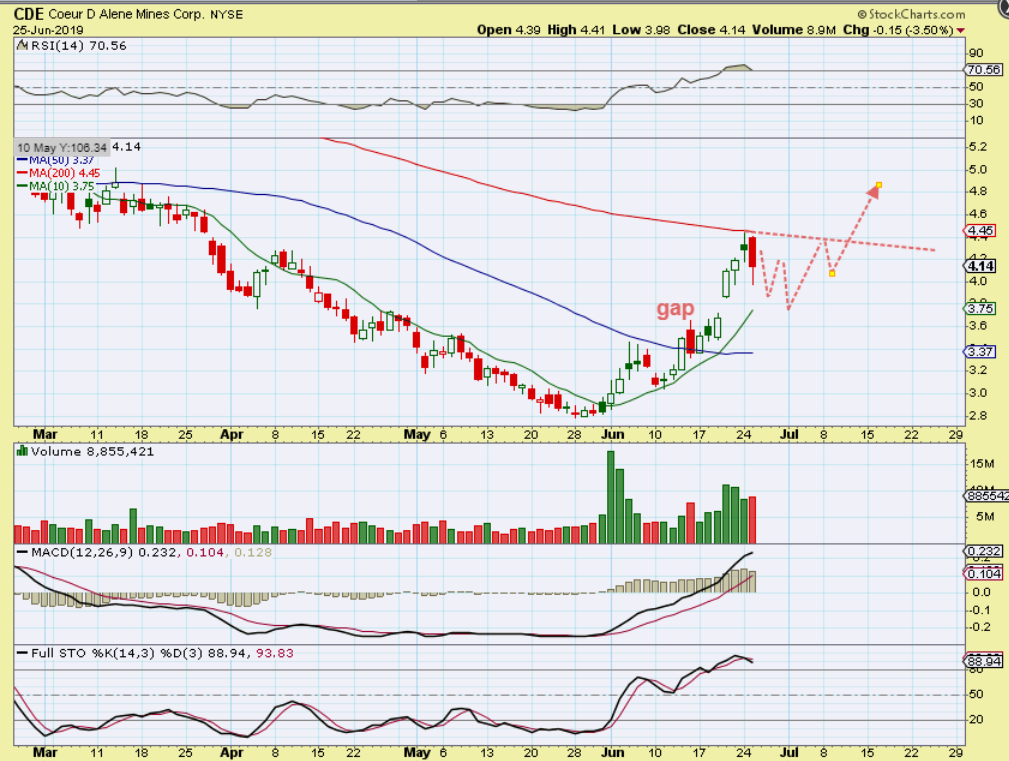
Then it DID BREAK through. Now it is at the 200sma & stalling, so I am again thinking that it may do something like this. It may even fill the gap. You have 2 choices (maybe more really)…
1. Sell some & add at the gap, the 10sma if you see a reversal, or 50sma?
2. Ride it out until CDE hits $10 🙂
We are due for a pull back & so far they have not been happening. I would expect a bounce in the USD, and with that GOLD & MINERS can pull back for a few days into a dcl. Reversals after the selling should be buying opportunities. The choice is to either Holding positions and ride things out or selling partial positions is a strategy that can work here too. I just wouldn’t personally sell everything ( Hold a basket), since this can continue to be a run away move.

