June 22nd Weekend Review- Breaking Free
In this Big Picture Weekend Report, I am once again going to discuss the importance of recognizing the Precious Metals set up Early…as if BREAKS FREE from a massive base. First we will discuss the other market sectors…
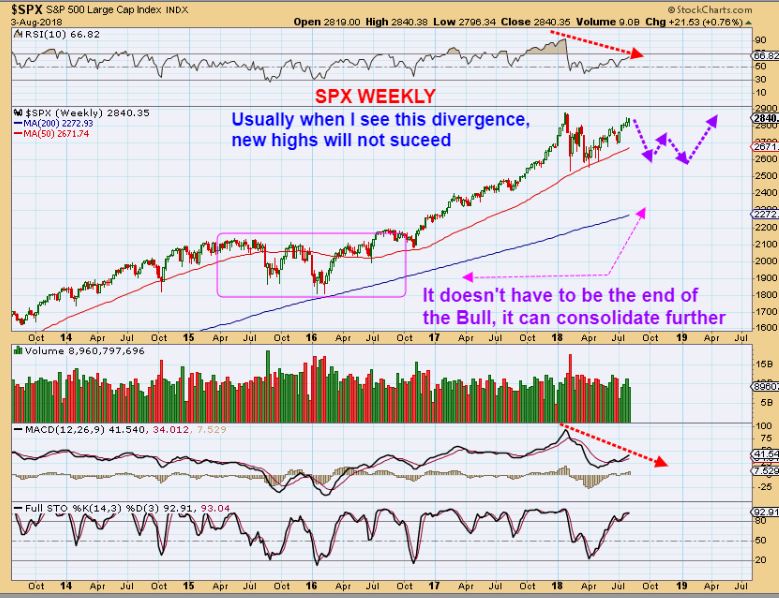
SPX WEEKLY – A LONG time ago ( 1.5 yrs) when the markets sold off in early 2018 & recovered, many thought now we’d go parabolic higher. At that time, I mentioned that the General Markets could just go sideways similar the 2015-2016 and be choppy for years . So we’d possibly see years of sideways consolidation rather than a double top or parabolic run higher at that time…
.
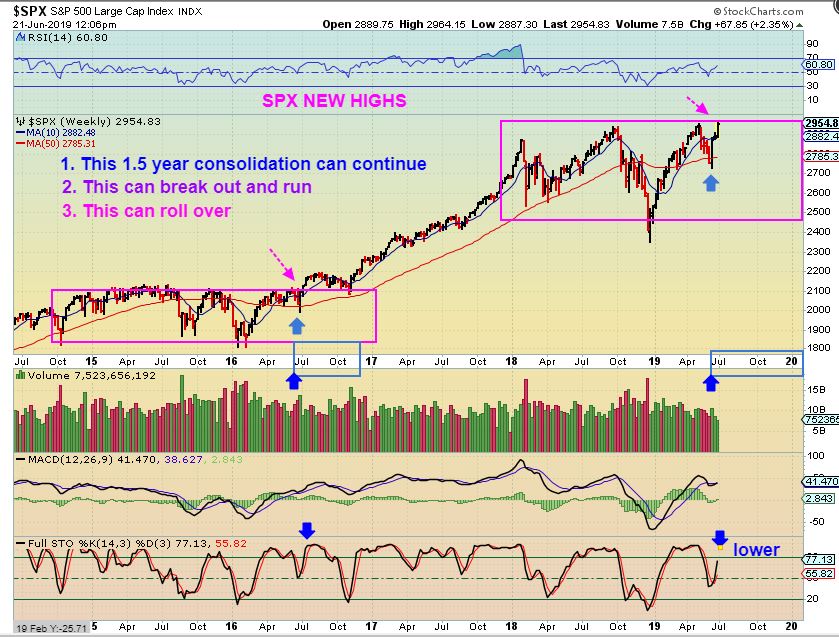
SPX WEEKLY – Wow, I just realized that that is what has happened. I see similarities now as it runs back to the former highs, see the Pink Arrows. Those arrows are both at June/ July, and it still went sideways into the end of that year. So a Break to new highs DOES NOT AUTOMATICALLY MEAN a rally, but it could.
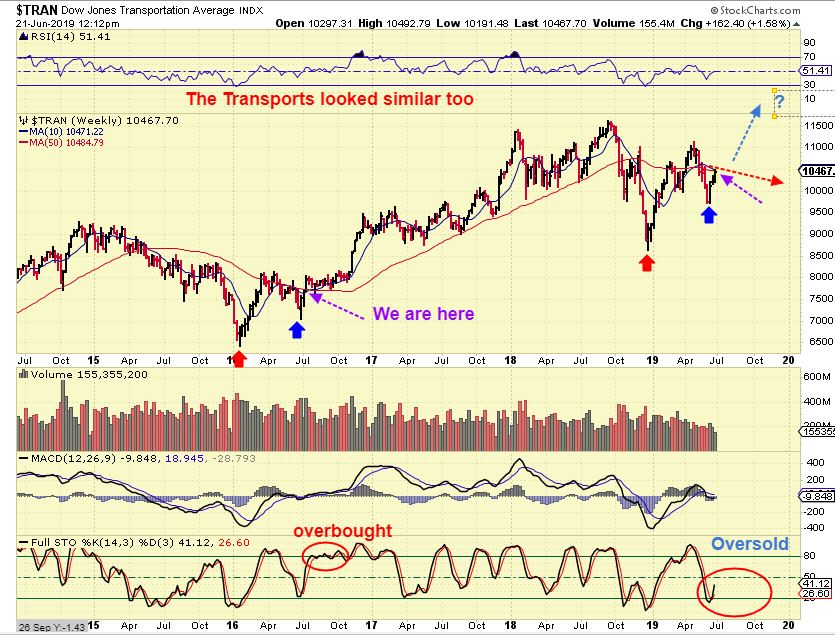
TRAN WEEKLY – Now notice how closely the Transports look to the situation in 2016 too, but there is one difference and it seems more bullish for the current set up.
When the Trannies stalled & crawled sideways for months after July 2016 (Blue arrows) into the year end, they were already over bought on a weekly basis. Currently they are oversold, so that could be Bullish. They may have the power to push through that 50ma here. *If the TRAN pushes through and runs higher instead of sideways like 2016, that could be a Bullish sign for the General Markets.
.
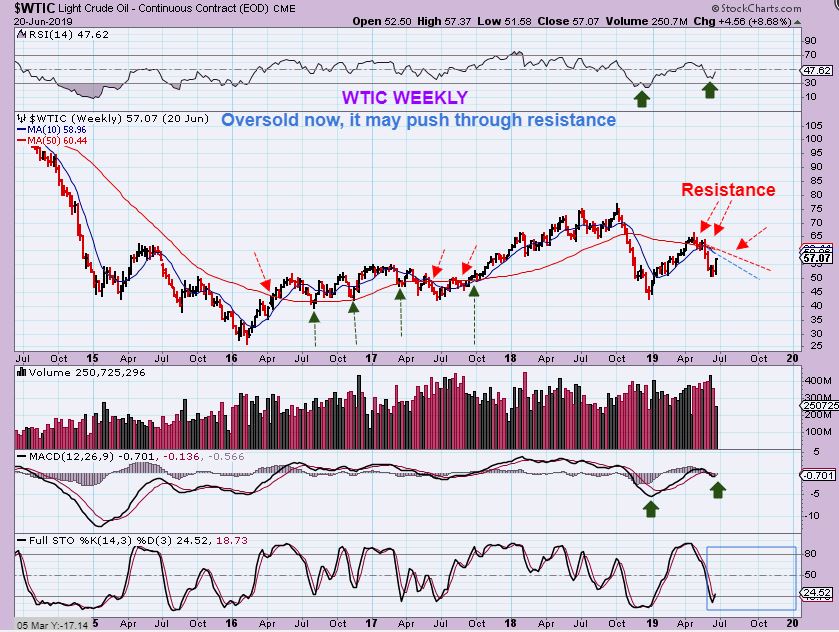
WTIC WEEKLY – With troubles brewing in the Oil Shipping route, Oil reversed and put in a higher low. It was a shortened daily cycle, but the weekly did reach oversold. Oil looks Bullish and may be able to push above the problem area that stalled it on the last run ( 10 & 50 week ma). THAT will be the test.
.
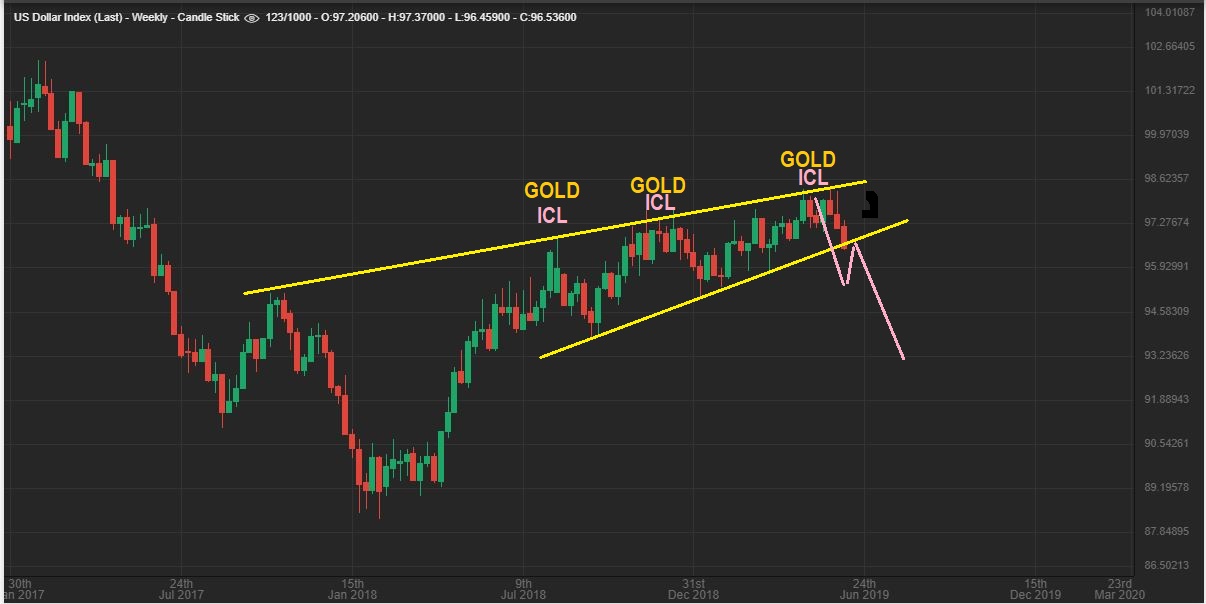
USD WEEKLY – FROM JUNE 8– We can look for a bearish break down, but don’t be surprised if it bounces and back tests before really rolling over…
.
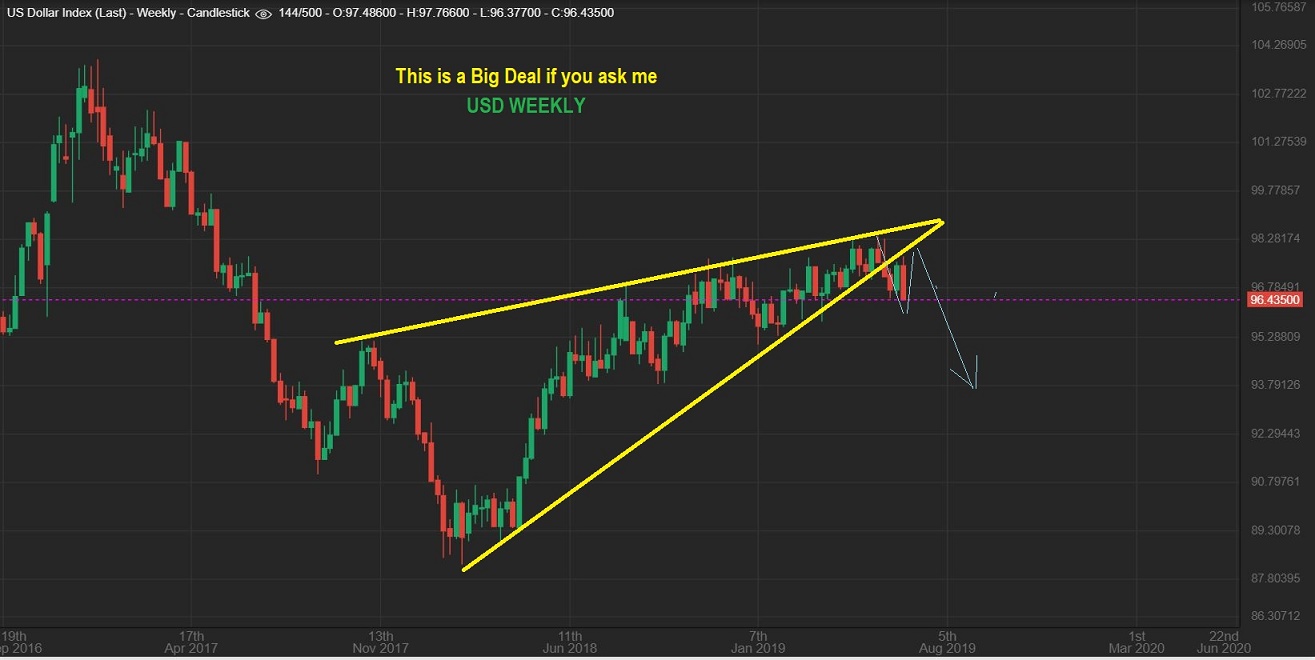
USD WEEKLY – Break down & Back test completing? I think so. The Daily closed under the 200sma. When this drops, YOU WANT TO BE LOADED UP ON MINERS IN MY OPINION.
.
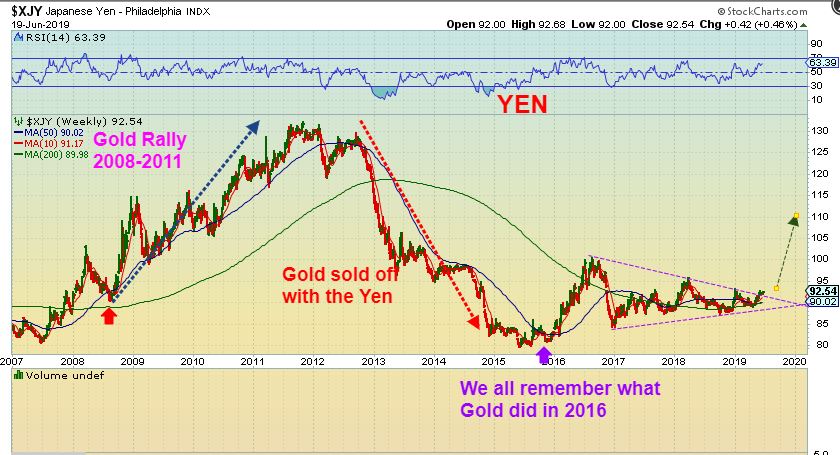
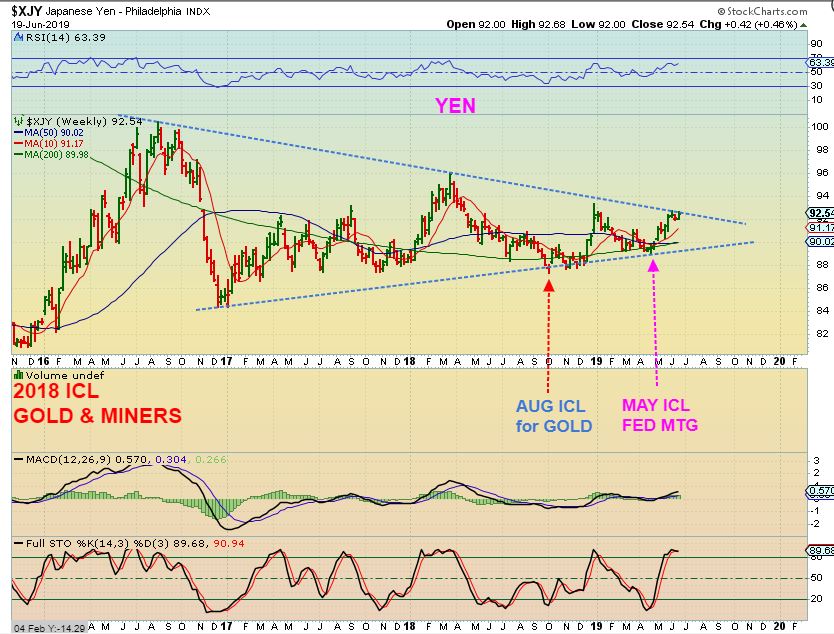
YEN – The YEN often mirrors Gold. Notice the 2008-2011 Run & 2016 rally was similar to Gold. Well the YEN looks ready to break out Bullishly Here, and so does Gold, as the USD is breaking down.
.
YEN – Similar ICL locations too.
.
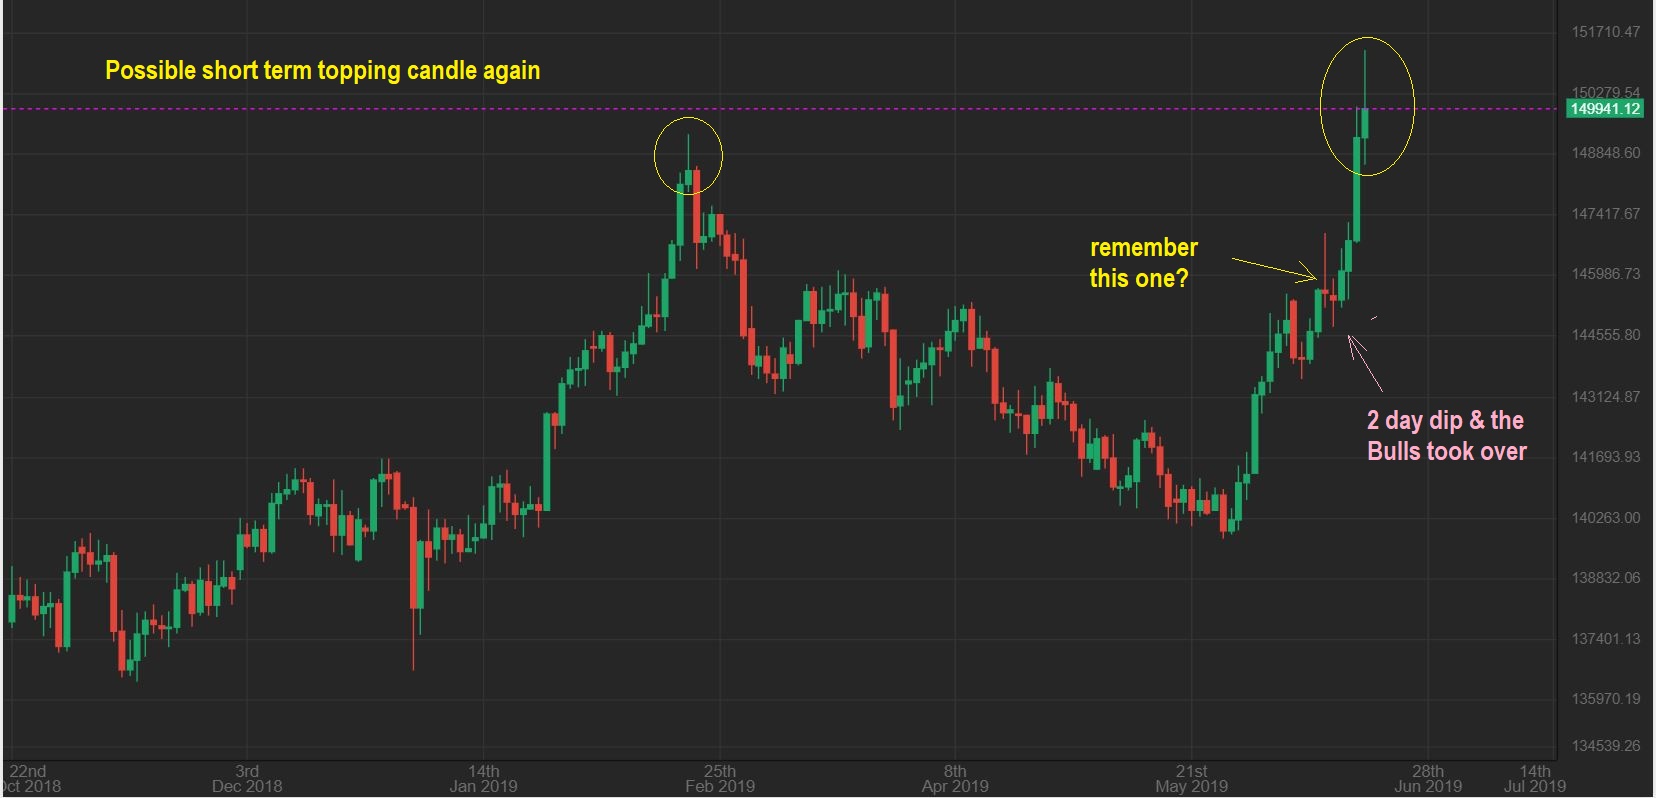
GOLD DAILY – Yes, that was (another) possible topping candle, but we did see one over a week ago and it was just a 2 day pause. See the chart.
.
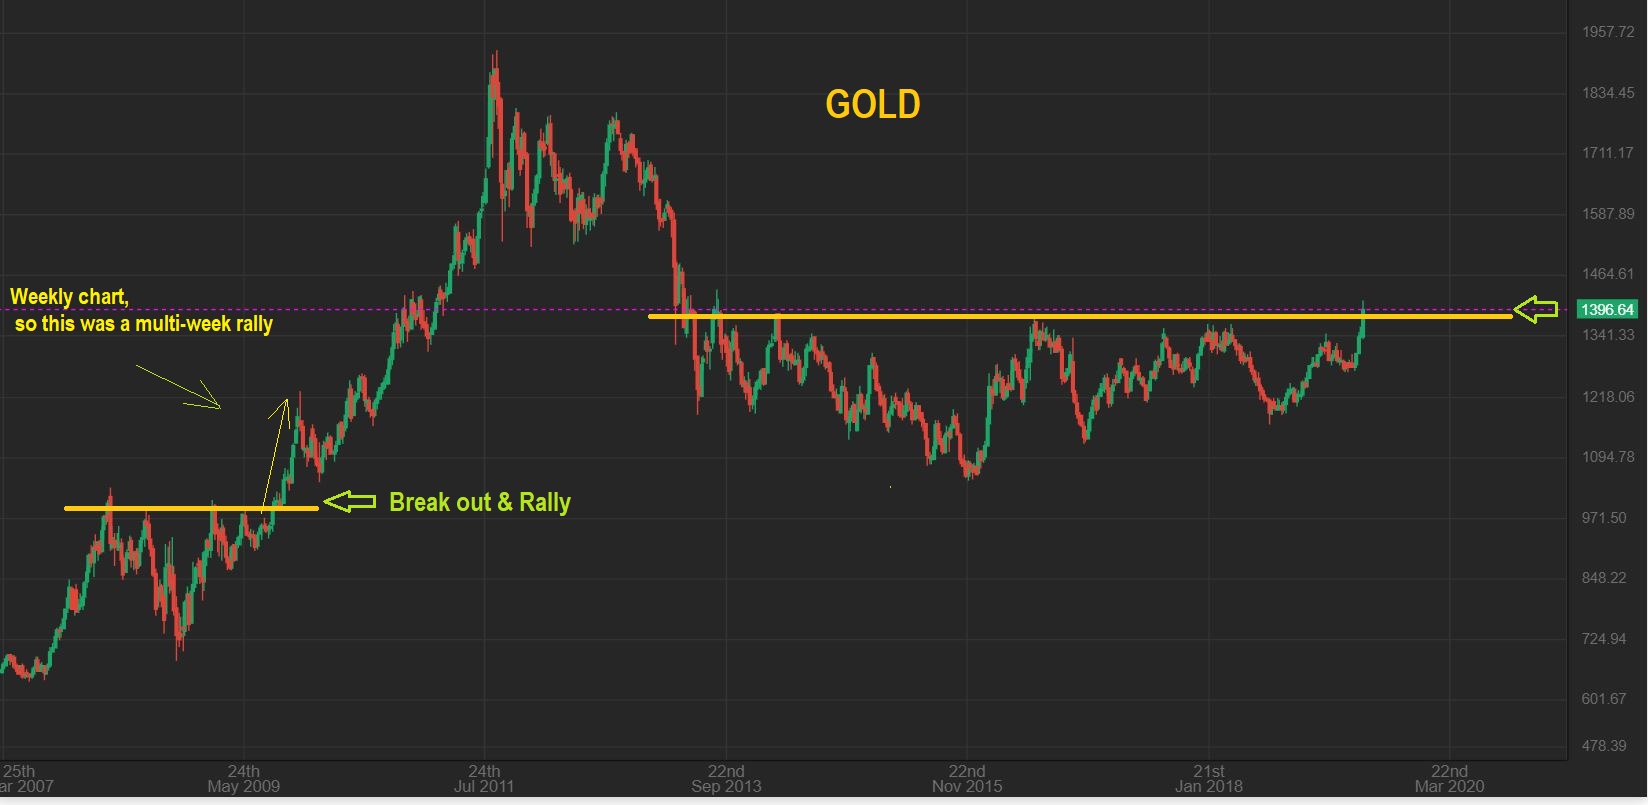
GOLD WEEKLY – When the 2008 base broke, it ran higher for weeks. This one is trying to break out now too.
.
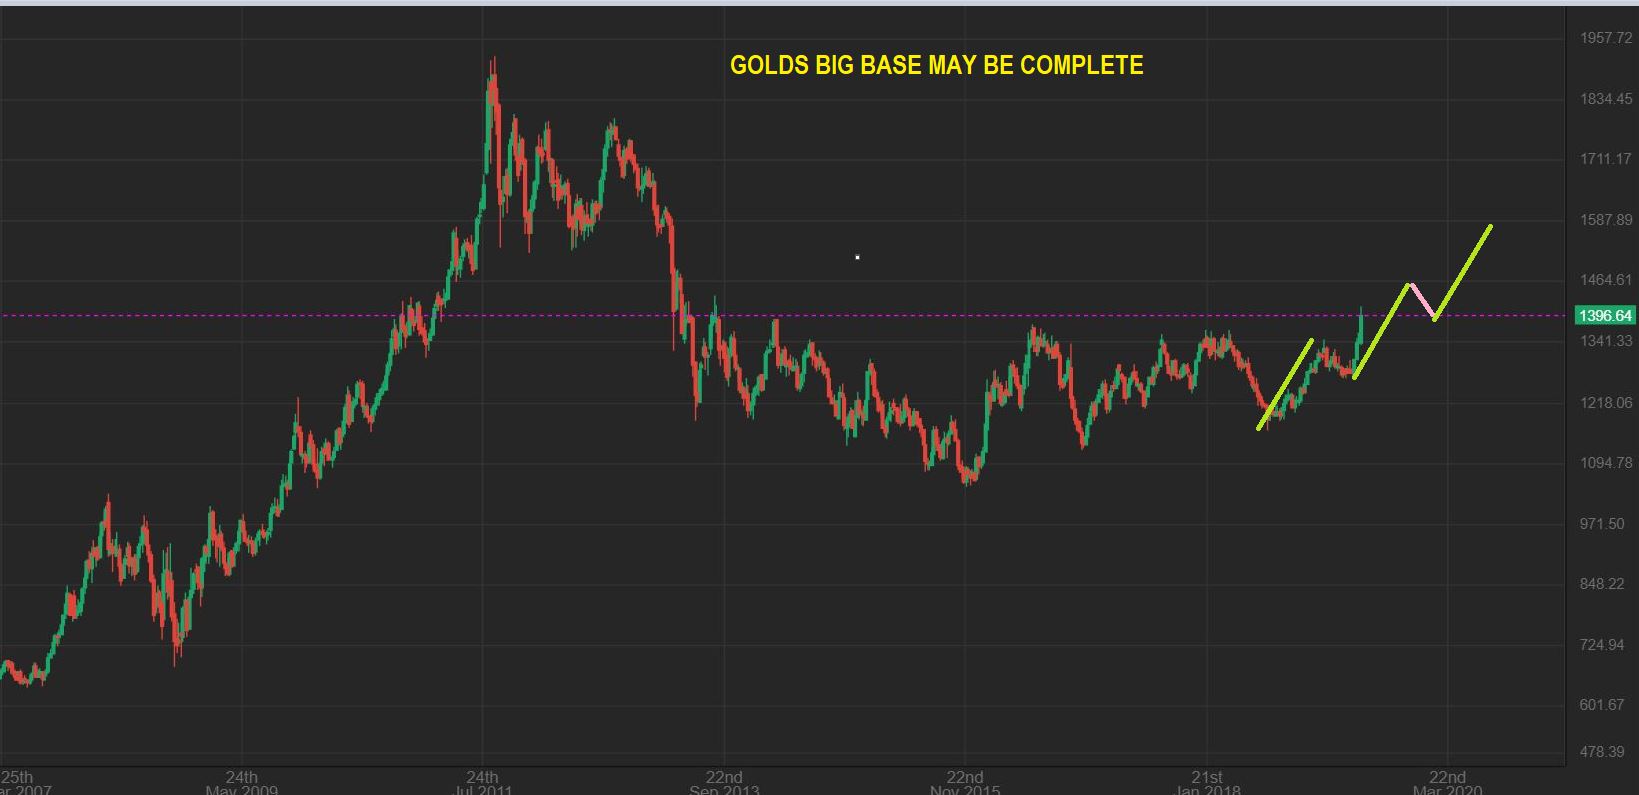
GOLD WEEKLY – 2008 did stair steps ( Icls & Dcls) , and this may too, but it is a Big Bullish Move coming. We have been ready for Months for this and this will be rewarding.
.
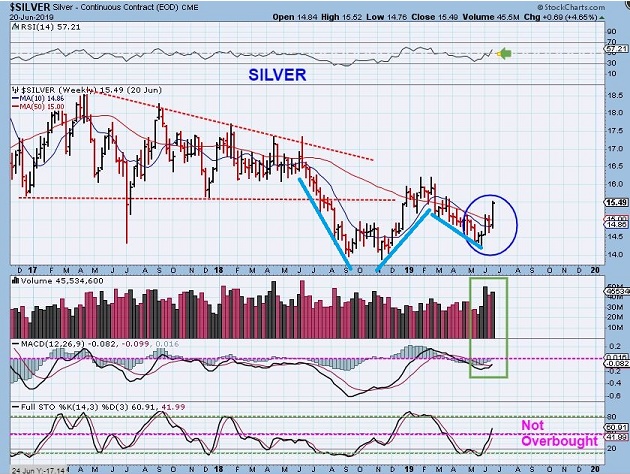
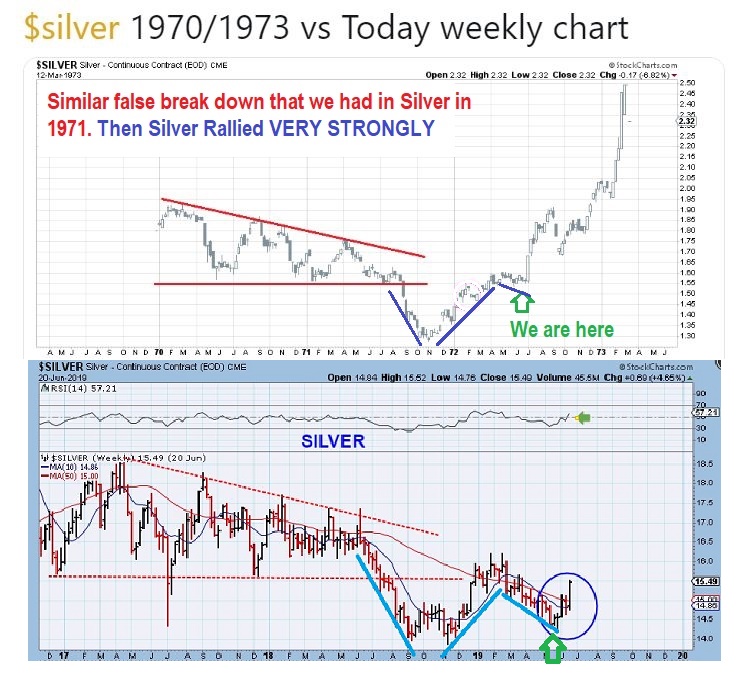
SILVER WEEKLY – SILVER is breaking out, and I am going to show you something about SILVER later in this report. It could have VERY BULLISH SILVER IMPLICATION. 🙂
.
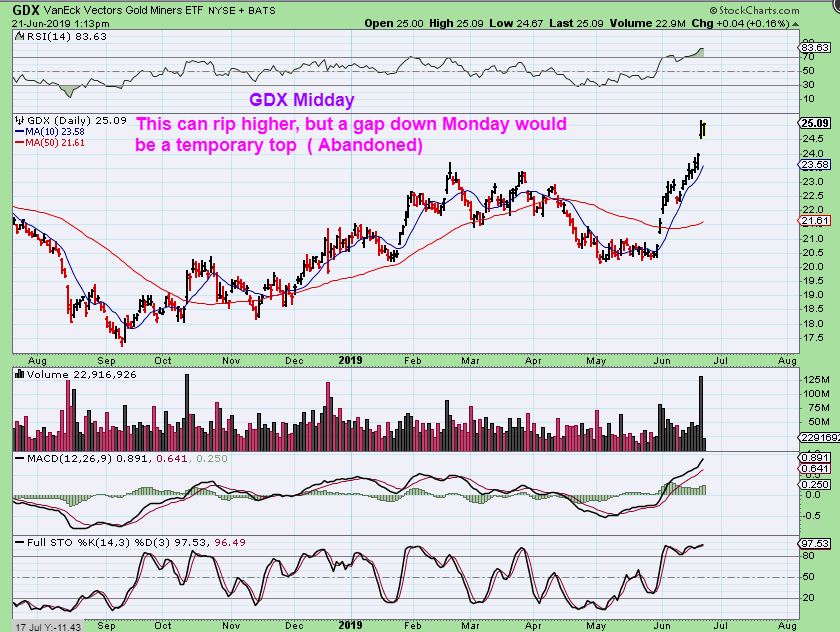
GDX DAILY – I just want to say that this CAN fill the gap, it can even Gap Down Monday, it can also just run away- so be ready for anything Monday. Either way it remains Bullish and not a concern, so let’s discuss that…
,
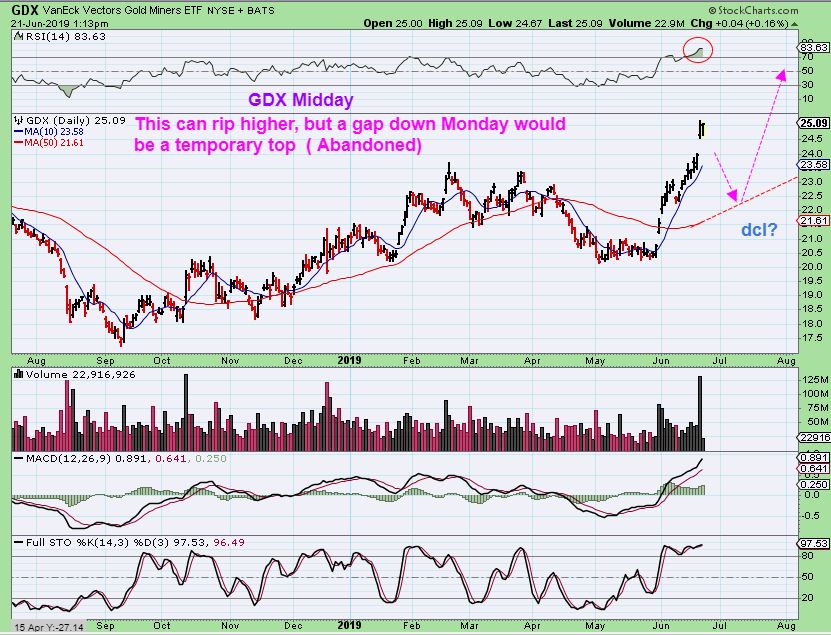
GDX DAILY – A Gap down Monday would be an ISLAND TOP. We’d find a dcl.
.
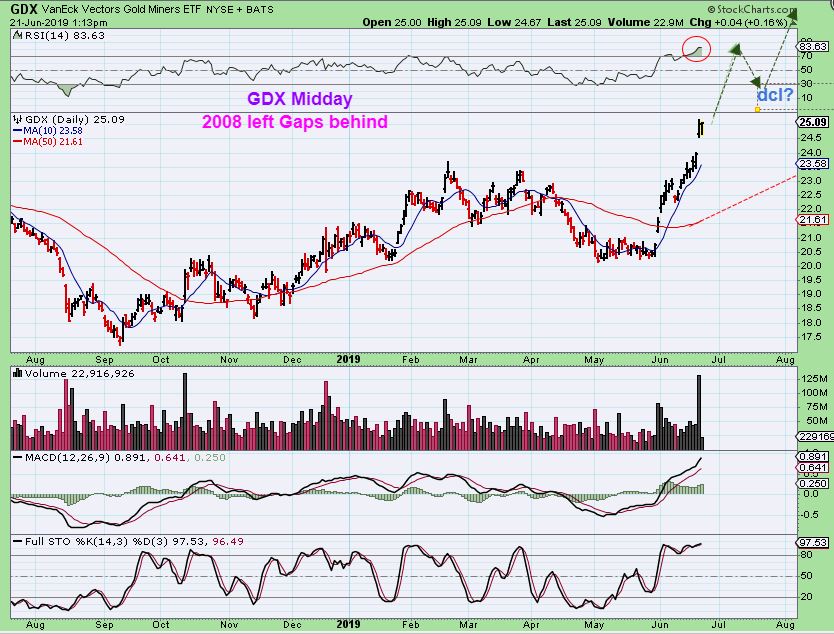
GDX DAILY – This could just run away and drop back later into a high dcl. The weekly chart explains why…
.
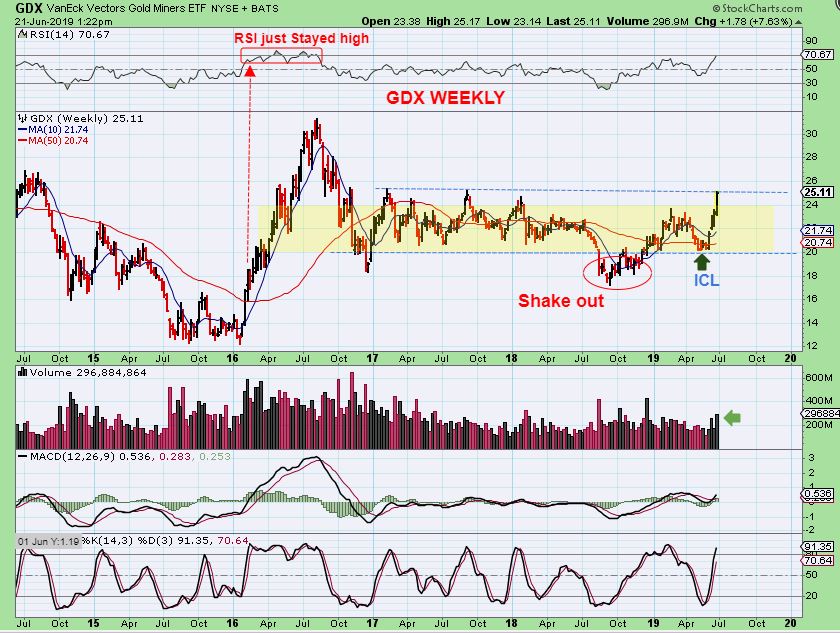
GDX WEEKLY – We are at resistance and a critical point on the chart. Even if that daily pulls back, Look at the progress we’ve made with our Buy & Hold approach. I still expect a break out & run later…
.
GDX WEEKLY – But you already knew that. Forgive me if I have posted this 20 times since drawing it up in March, but I just CAN’T get sick of it. It’s beautiful if it plays out this way, and so far, it is doing just that.

.
If you want to trade around it, its up to you, but ignoring the wiggles SO FAR has paid off, again with this reminder and I have added a few more reminders…
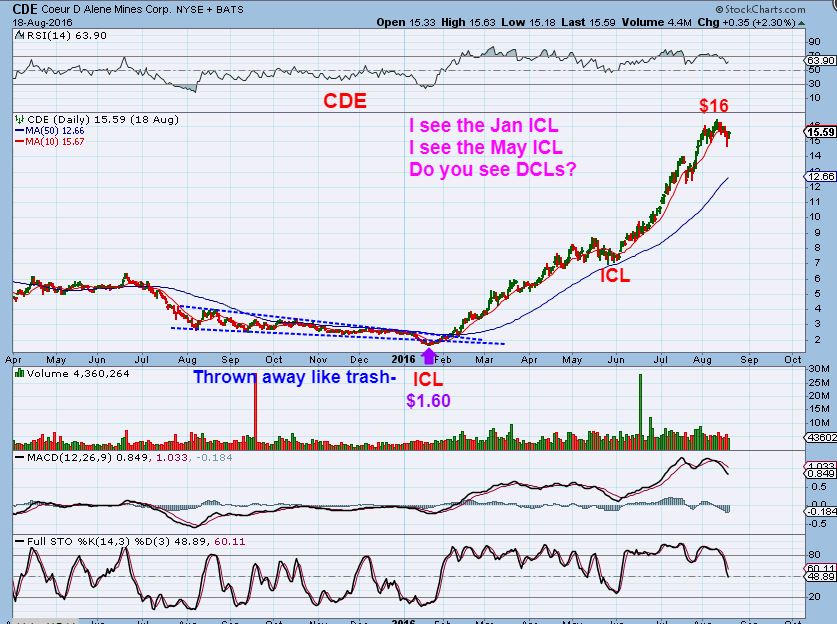
CDE 2016 – The reminder that individual stocks Can & Might just run off without buy-able dips. read the chart…
.
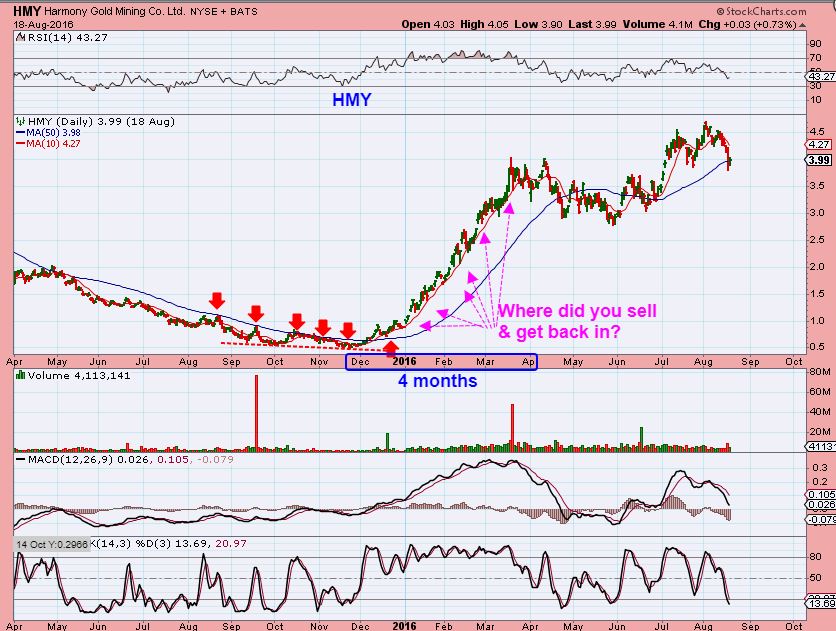
HMY 2016 – If you bought HMY and just held on, it was a very nice run with Tiny dips along the way. If you sold it, those werent easily bought. These Miners didn’t hardly break the 10sma for Months!.
.
I WANT TO REMIND YOU OF THIS –
.
IF YOU WERE WITH ME IN 2016, THIS IS WHAT I SAID ABOUT BREAKING FROM A BASE: The SELL OFF on the left side of the chart, with price trapped under the 10sma could be repeated on the right. In other words, it fell straight down, it could run straight up.

.
AND IT BOUNCED OFF OF THE 10 SMA & KEPT RUNNING, similar to some Miners today
.
STRAIGHT TO FORMER HIGHS. A GIANT CUP FORMED, that was a powerful run. Anyone that did not buy when I mentioned the break out GOT LEFT BEHIND.
.
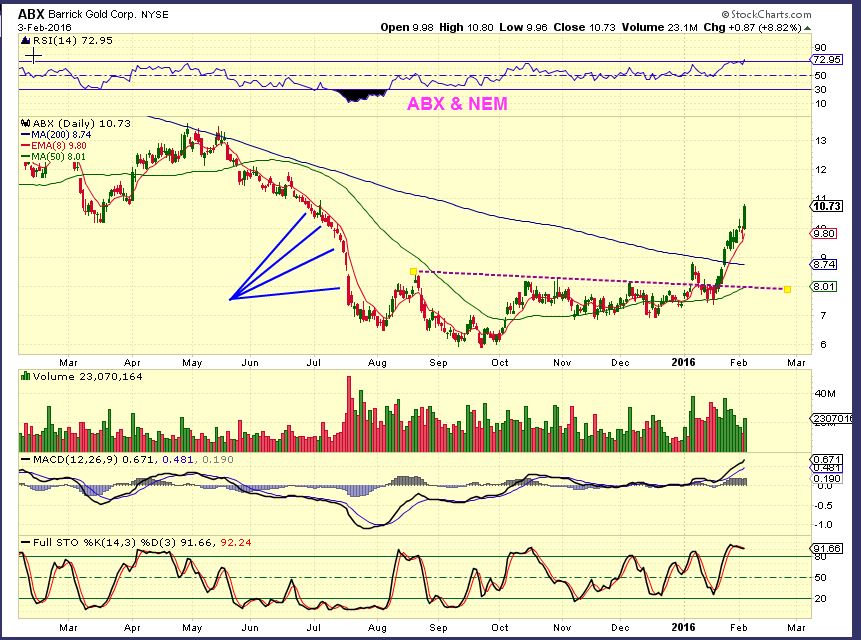
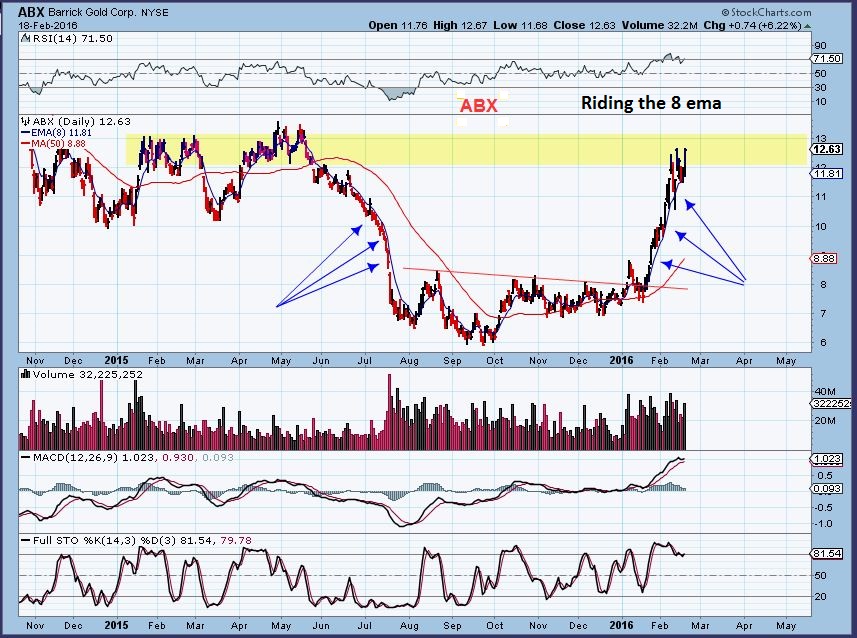
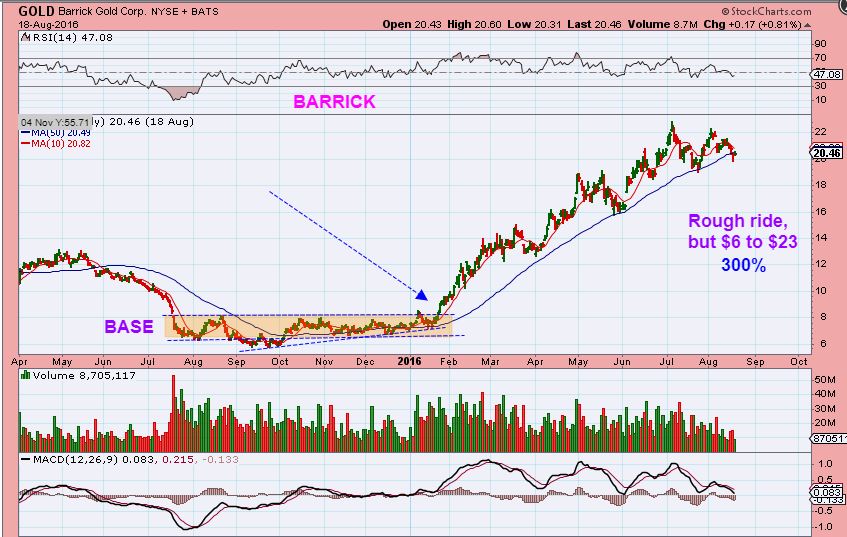
BARRICK 2016 – OUT OF A BASE comes a great move. This just didn’t have deep dips to buy if you lose position, and it did NOT back test the base.
.
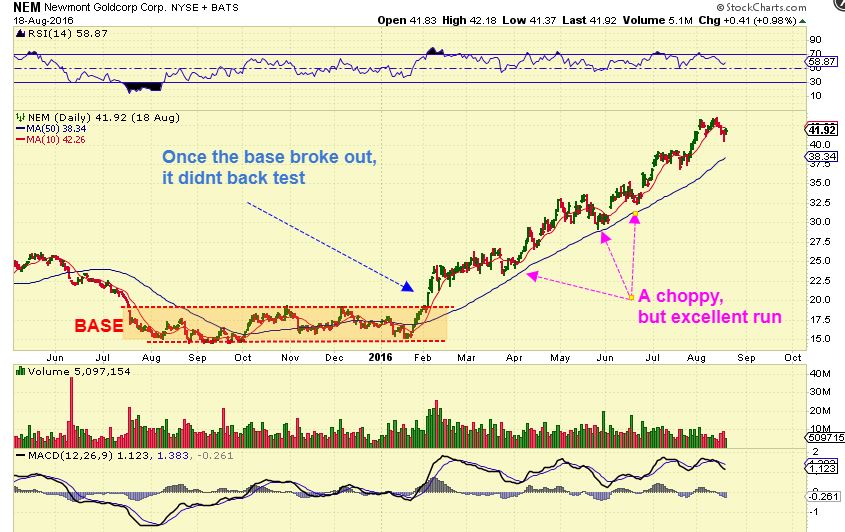
NEM 2016 – You see why I am telling you that GOLD & GDX breaking the base is important? NO BACK TEST of that break out- it just took off & left people behind. That MAY OR MAY NOT HAPPEN WITH GDX, but you should be aware of it.
.
I can’t promise you that GDX will break from the base & NOT back test it, but if we sell shortly after the break out waiting for a back test that never comes? That will be sad, so I keep pointing this out over & over until you’re tired of hearing it 🙂 . You want to OWN SOME MINERS buy & hold, just in case. Scroll up to Barrick & Nem chart again. That BASE broke out & never looked back. Good to remember.
,
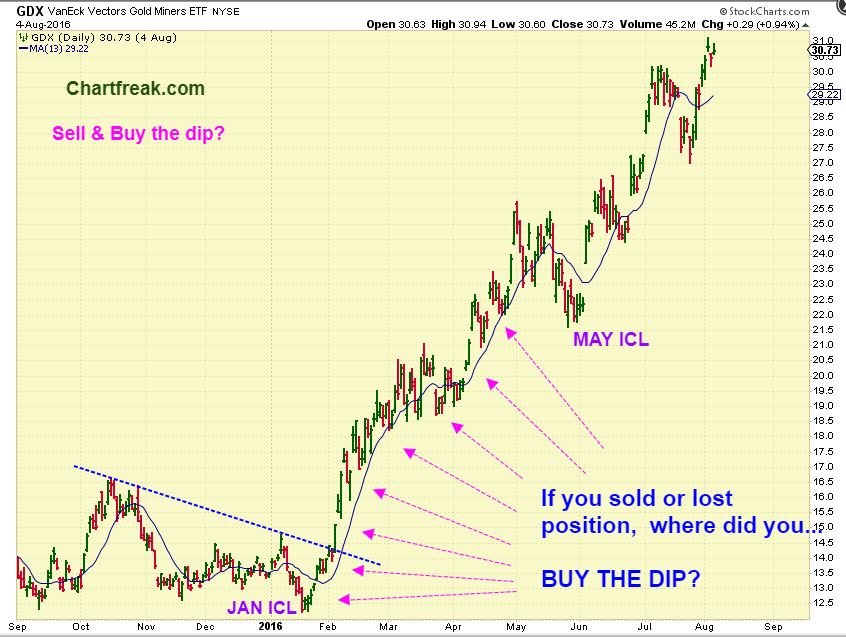
GDX 2016 – I’ll throw this chart in there again too. Until we do get a pull back, we are seeing something similar to this so far.
.
The last 2 weeks were very rewarding, and believe it or not, we are likely heading for a Big Change in the Precious Metals markets. I have taken a ride on the Gold Bull and it is an exciting ride. It is very profitable too.
.
~ALEX
.
SILVER WEEKLY – I said I’d show you something very exciting about this SILVER Chart, especially for those thinking that Silver is lagging. Let’s just call this blue line a cup and handle type pattern ( technically it is not a true cup & handle, but let’s say that it is , sice they often play out the same)…
.
SILVER REPEAT – 3 months ago, I saw someone on the internet compare the wedge & Break down in Silver to the wedge in Silver 1970. I give credit to whoever that person was for catching this set up back in March when it was just a recovering break down V-Bottom! Cudos & nice catch to him going WAY back to 1970. ANYWAY-
So I decided that I wanted to also start keeping track of it since then… and Now what has happened?
.
I think it looks AMAZINGLY CLOSE, and if so —look at what comes next after ‘We are here’ ! WHOA!
.
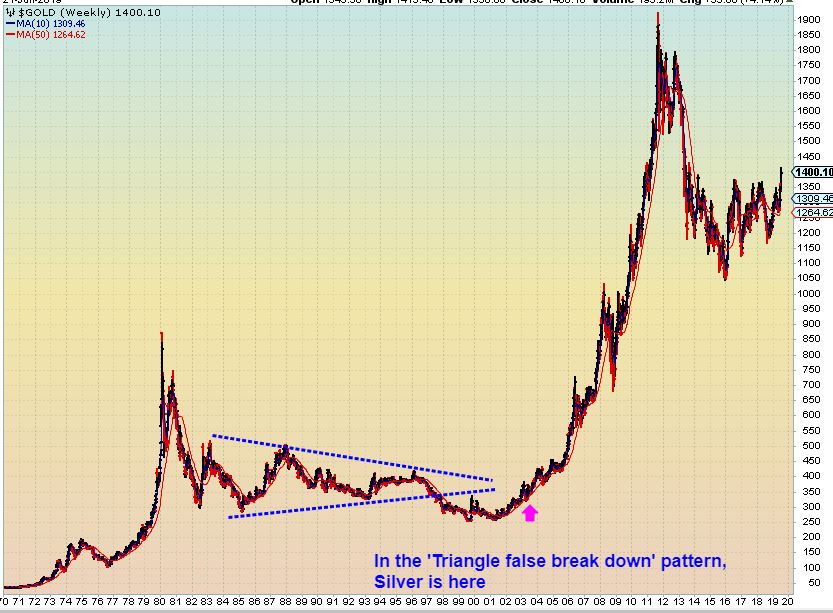
EVEN BETTER….. I found this one on my own. Isn’t that beautiful 🙂
.
Someone actually asked me- “What made you think of or even remember that Gold & GDX bottomed with the FOMC & then again with MINUTES? I didn’t think of that. “
Answer 1. I remembered the FED MTG Reaction as we approached the Minutes. Then I jot down the MInutes reaction too, but this is actually what I literally do each year…
.
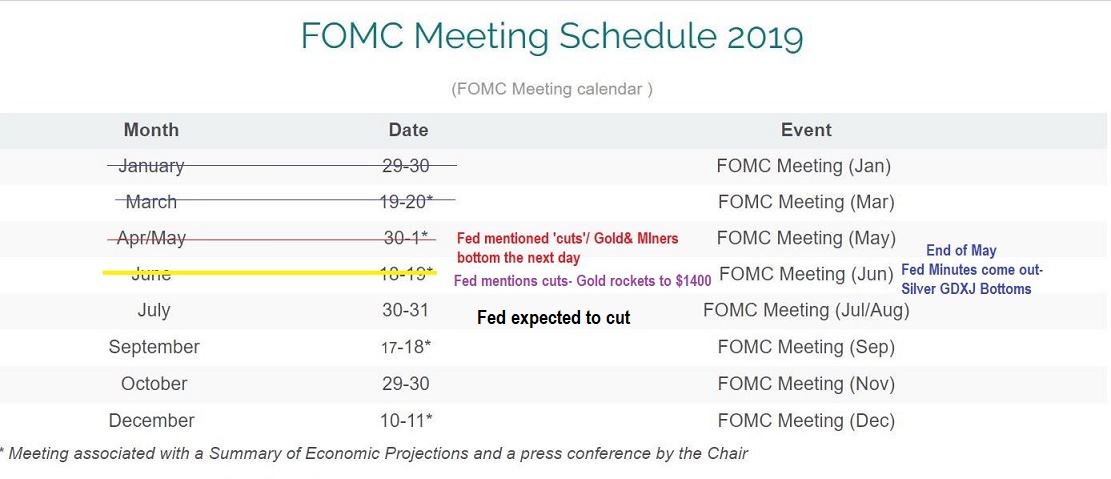
FOMC SCHEDULE – This is my personal FOMC MTG Schedule. Each year I mark off ‘interesting’ reactions as they happen. That is why I remembered MAY 1 Gold Bottomed, May 22 Minutes they bottomed again with Silver & GDXJ. The other dates Jan / March were closer to tops.
.
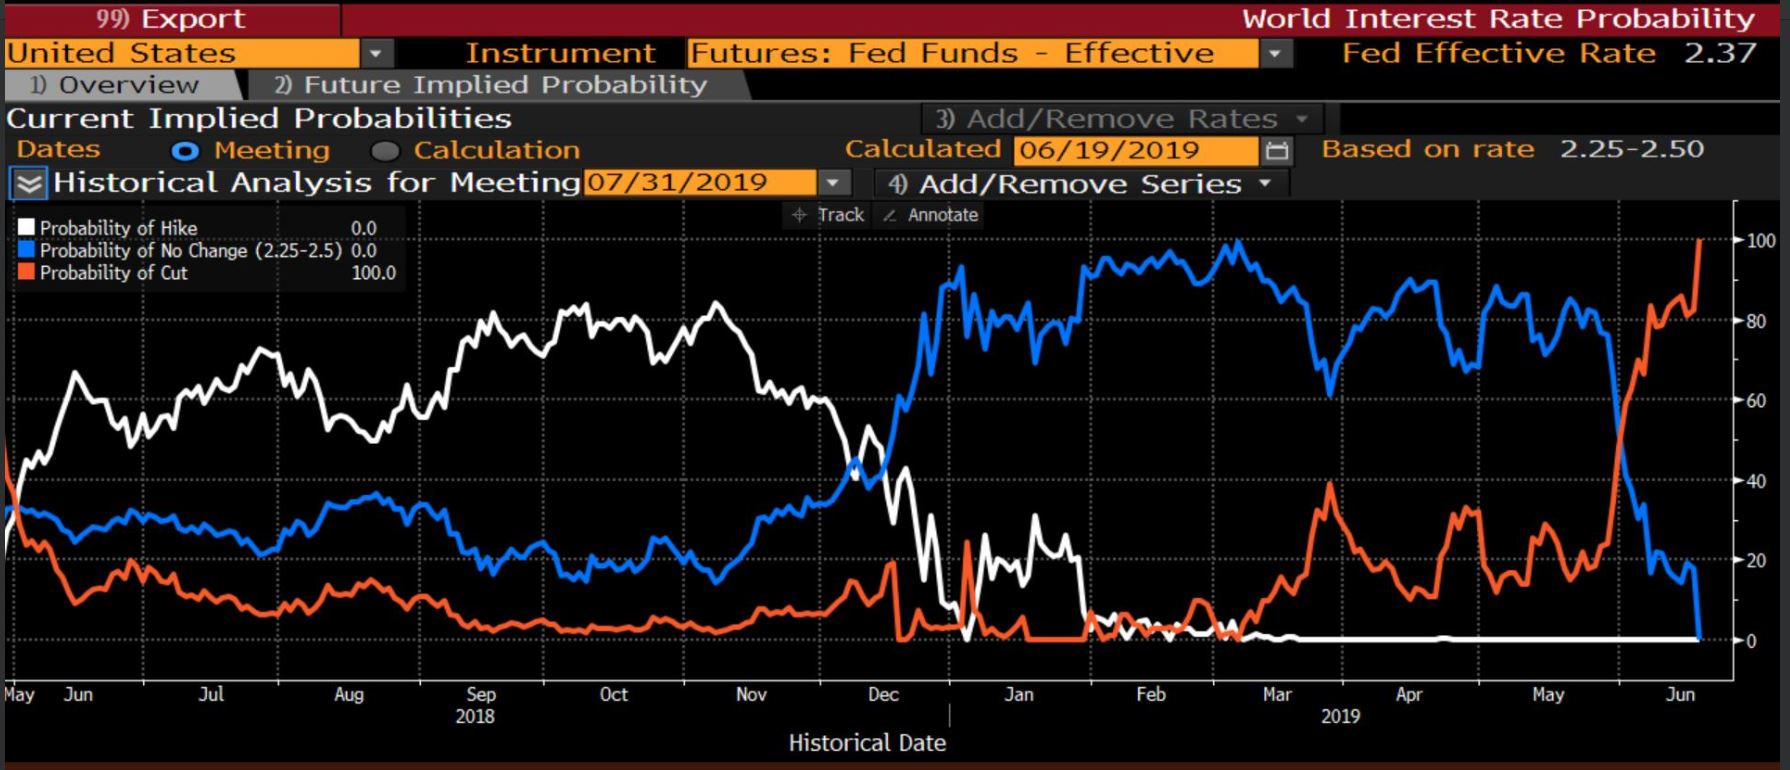
I thought that this was interesting. I haven’t seen it before, but it is possible that it has happened. You may hear CNBC or another analyst talk about “The FED FUNDS FUTURES”. They read it and it hints at an interest rate cut or not , etc .
FED FUNDS FUTURES –
LOOK AT THE RED LINE ON THE CHART. It is saying that we have 100% chance of a rate cut at the next Meeting. I don’t know if I’ve ever seen this read 100%. Probability: On the left of the chart is also a white box, a Blue box, and a red box. Read those. Interesting.
.
I want to show you something else.
1. I called the lows in BITCOIN in Feb / March, so …
.
2. As time went on, I drew BITCOIN coming out of the base with Bullish patterns, but notice the parabolic run in 2018 and the BASE that formed here…
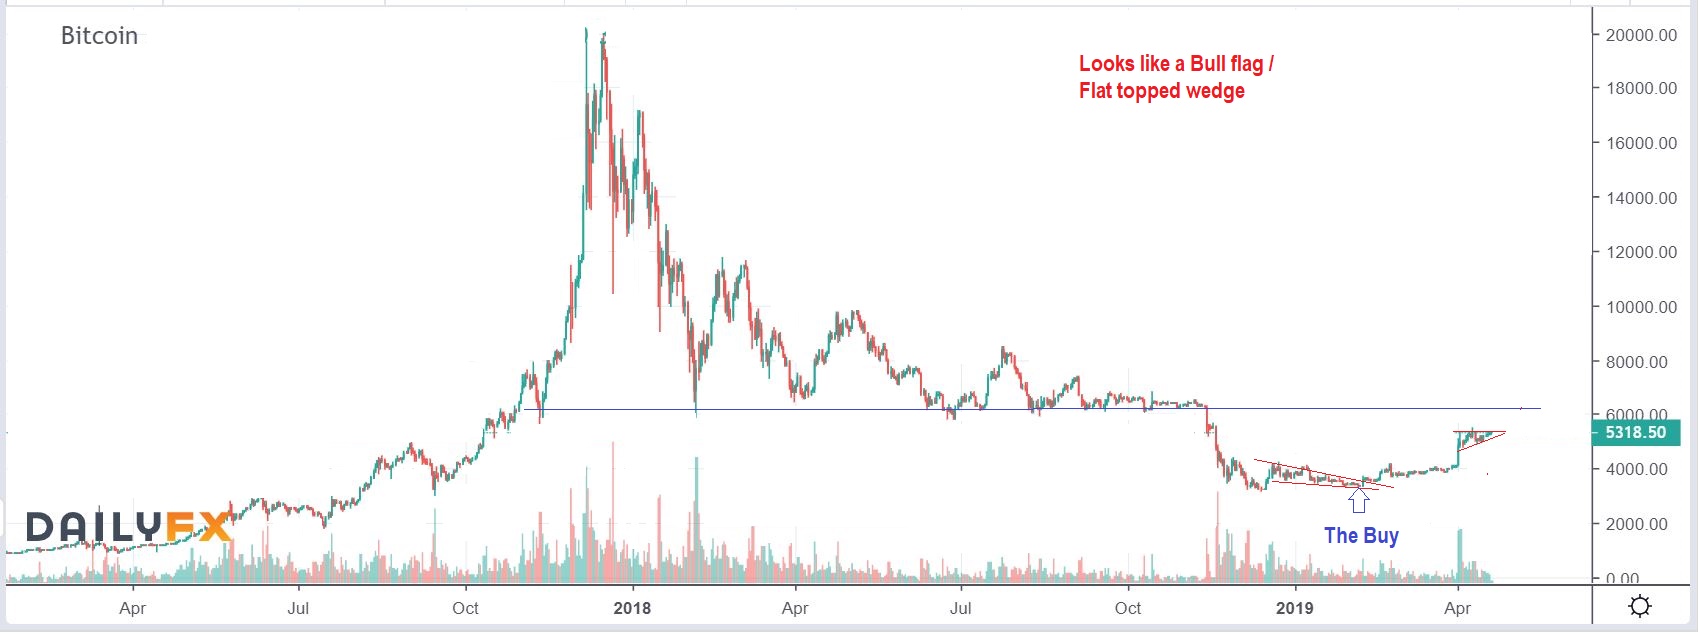
I drew this and said that breaking from this base could get exceptionally rewarding…
.
BITCOIN WEEKLY – AND IT IS, but also…
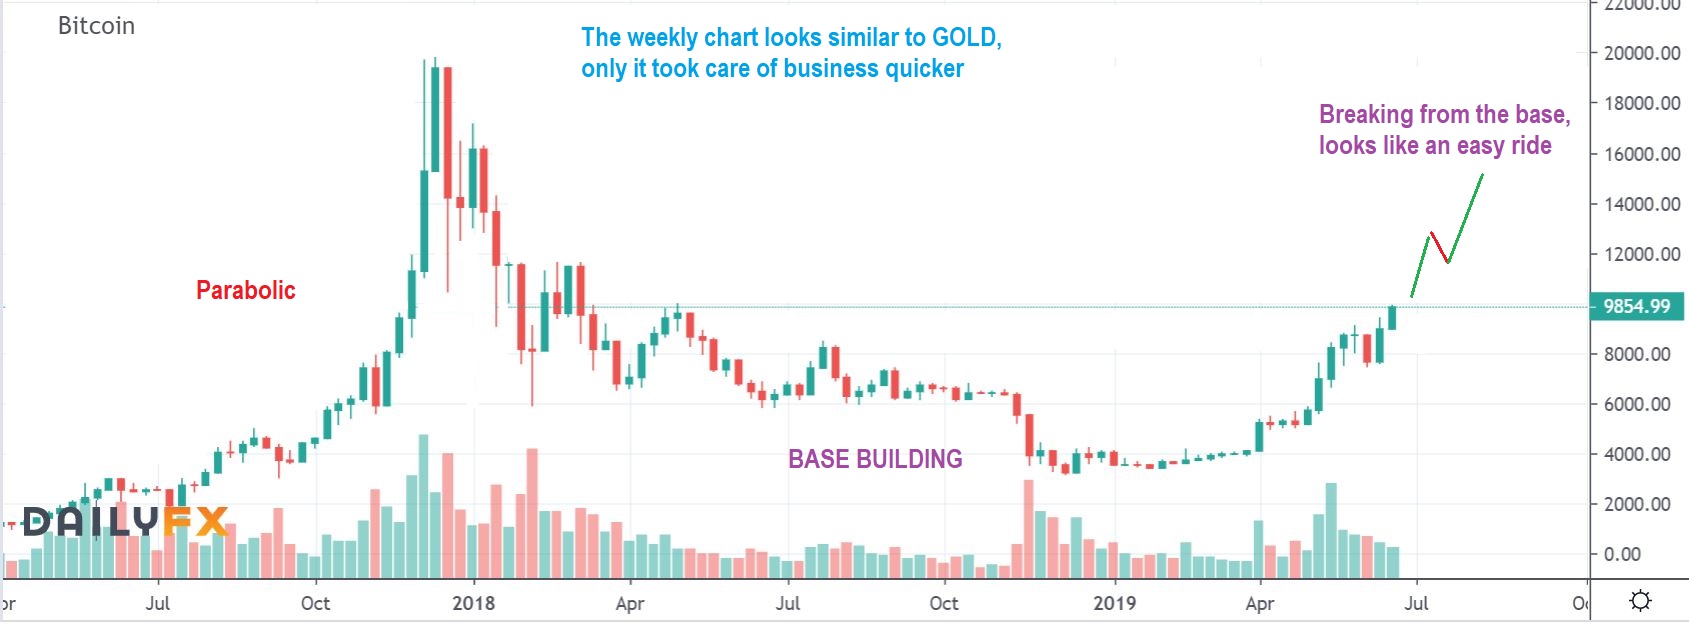
.
GOLD WEEKLY AGAIN – Doesn’t this look similar? THAT SHOULD GIVE YOU EXTRA CONFIDENCE OF WHAT IS GOING TO HAPPEN WITH GOLD.
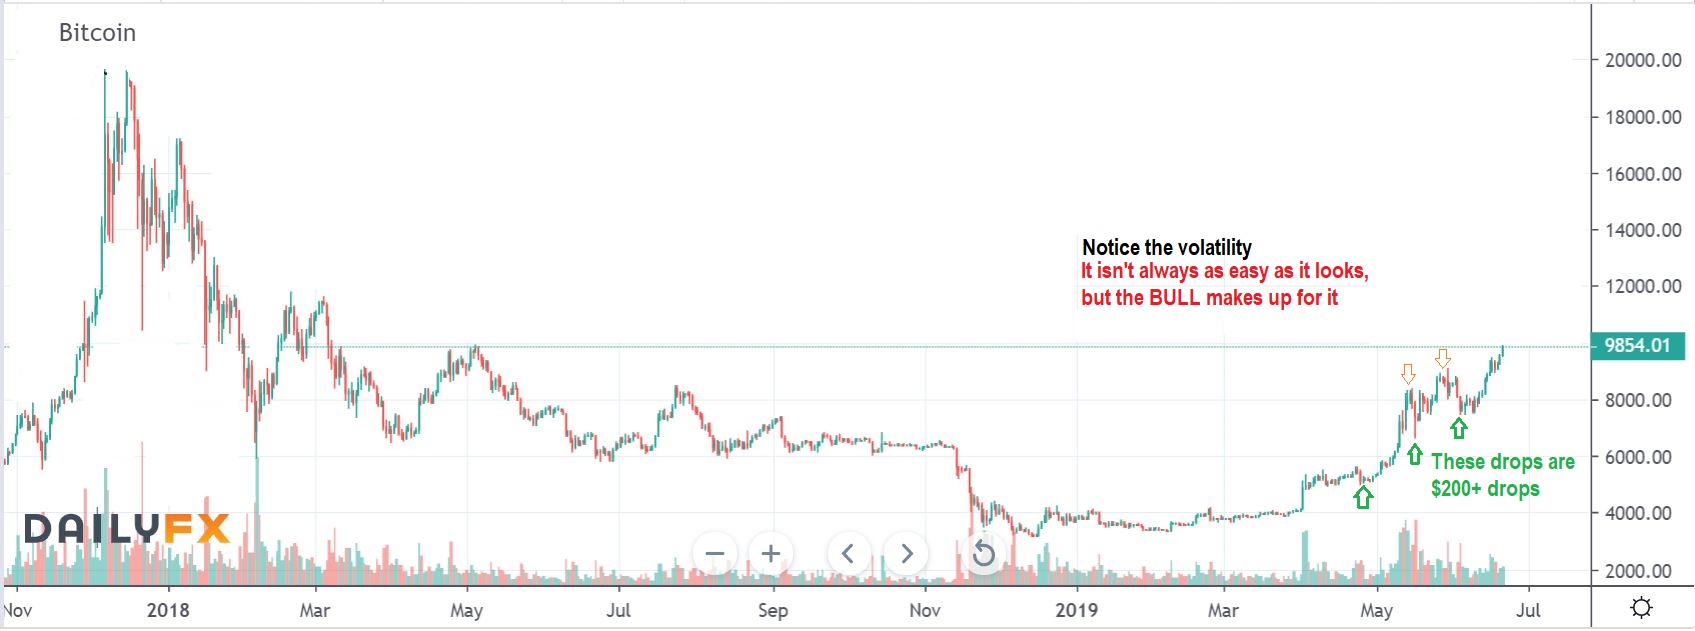
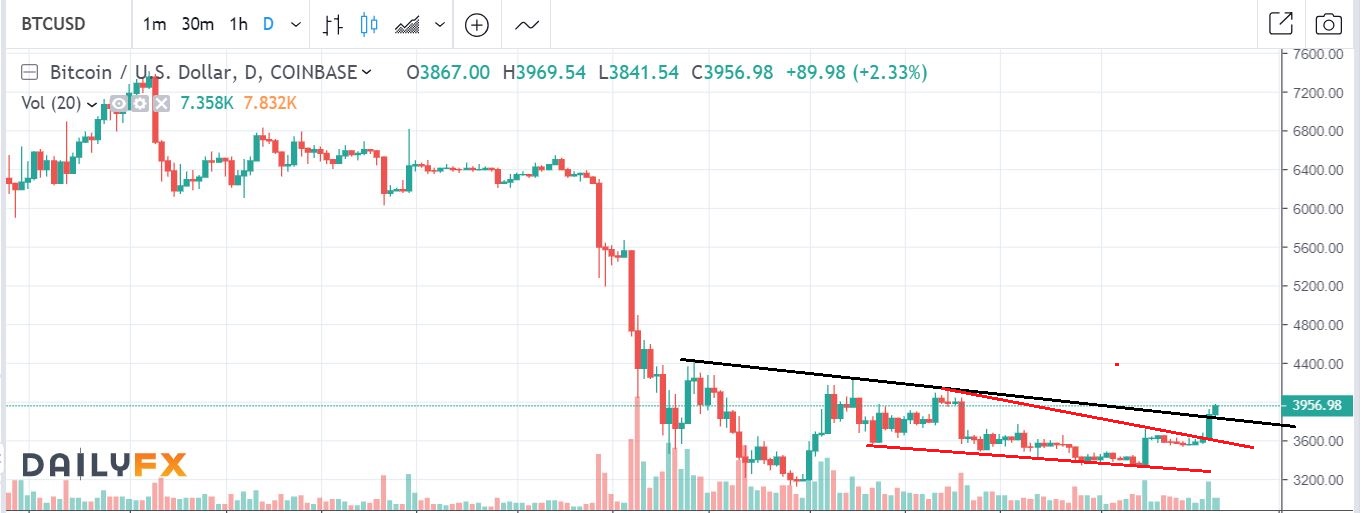
BITCOIN WEEKLY – But it is not as easy as the weekly chart makes it look. Doesn’t this look like a nice fast ride higher?..
.
BITCOIN DAILY – It has been very volatile, choppy, scary at times, with $200 drops . Those might compare to dcls in Gold, so it may get bumpy. Let this chart help you to prepare for any choppiness that we may see in the precious metals over time. BITCOIN got VERY CHOPPY, but today is at new 14 month highs. #Progress