June 6th – Pullbacks And Resistance
Pull backs are normal and healthy action in a Bull Market, so I am going to discuss that when I get to the Precious Metals section of the report. The General Markets are experiencing quite a pull back too, so lets take a look at our markets…
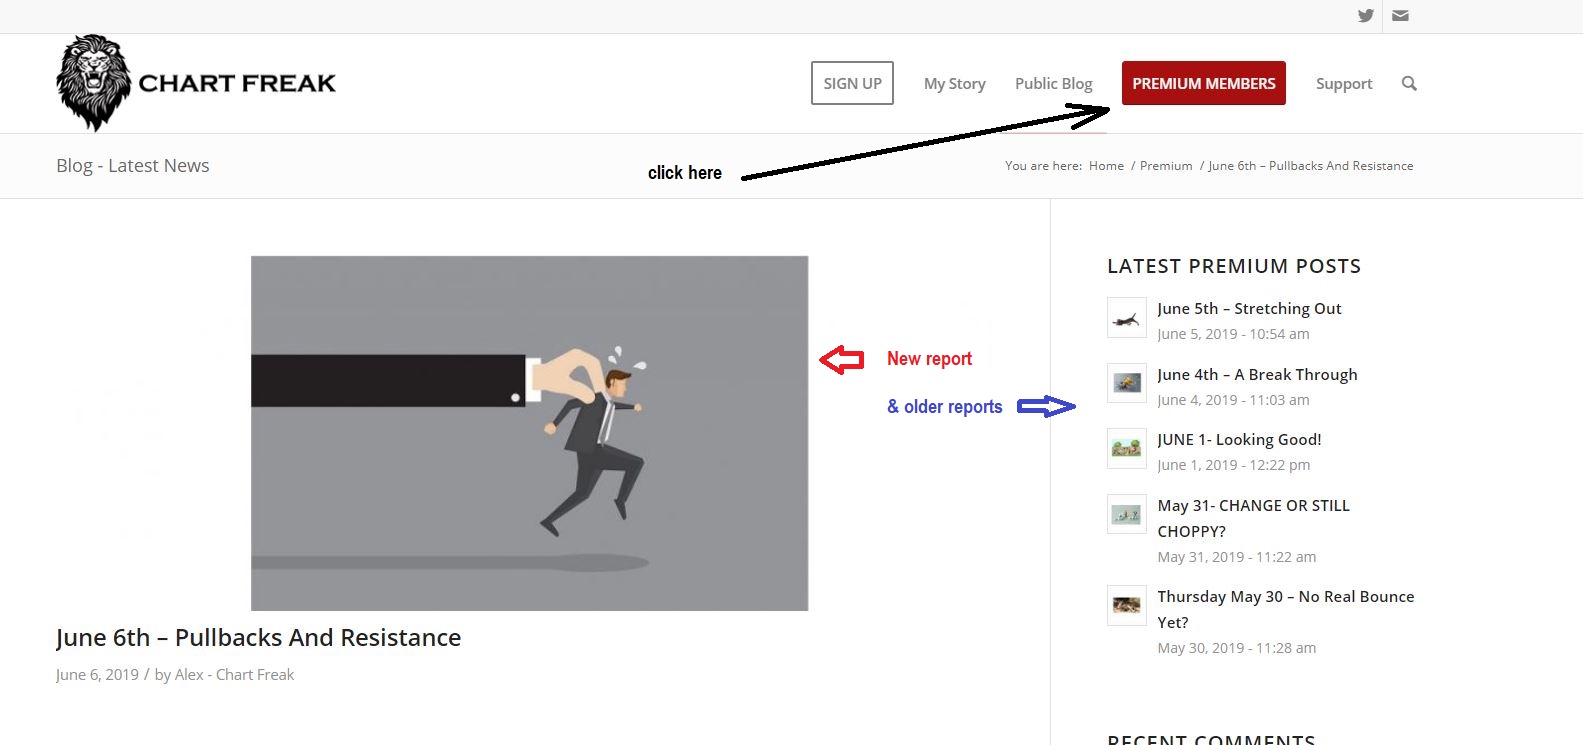
Important NOTE : We use a service that sends out ‘auto email alerts’ to let readers know that the report has been released. We have been having trouble with that service. My reports are usually released between 7-8 a.m. Eastern Time- so you can just go to the website, click on that red premium members tab shown in the picture below , and see if the new report has been released. I’m sorry for that inconvenience- we are trying to work that out.
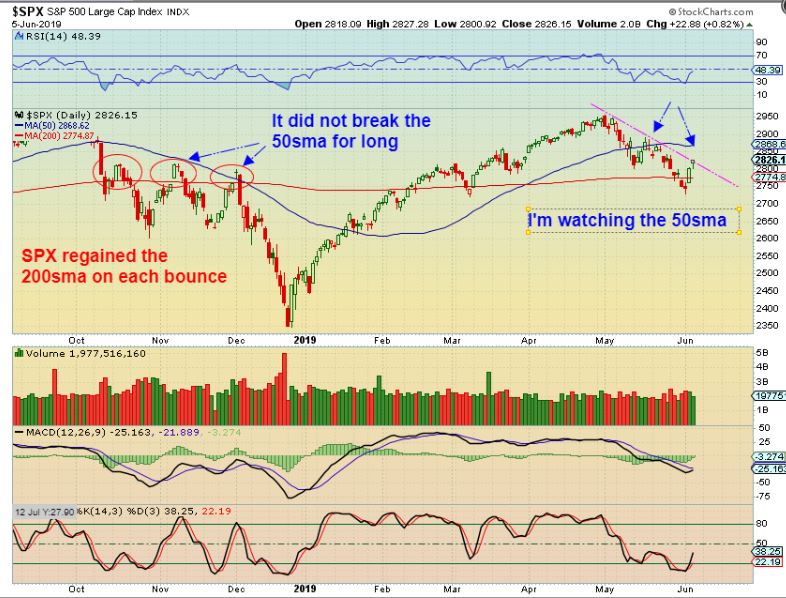
SPX – The SPX bounce is as big as the last one so far. It recovered the 200sma, but notice how it did that with the bounces before the crash in November & December, so thats fine. The 50sma was where it failed then, so I am watching the 50sma . The Friday Jobs report will be released by the time the SPX gets to the 50sma.
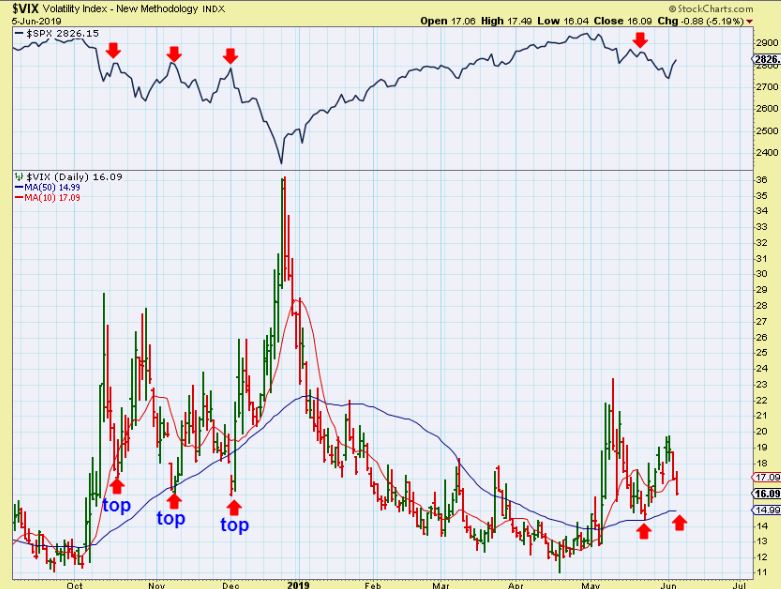
VIX – There is a chance that this VIX tags the 50sma, when the SPX tags its 50sma, then we’ll see if they reverse or break through (Jobs report Friday).
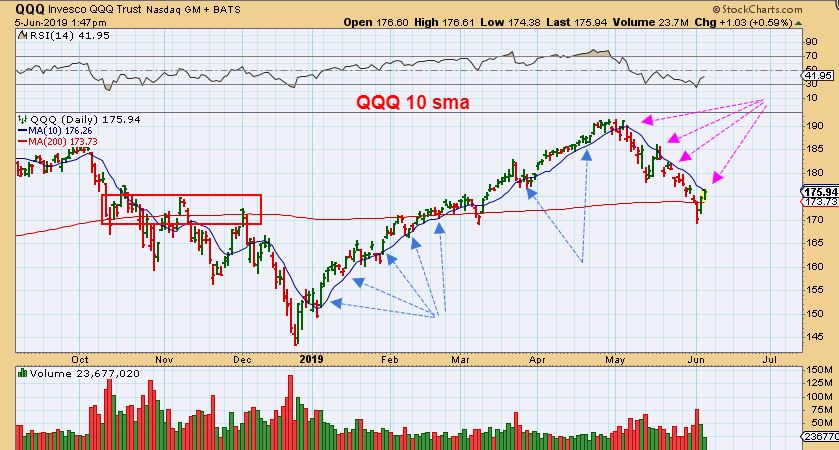
QQQ – I looking for strength vs weakness on the bounce. Regaining the 10sma would be a sign of strength. You CAN be long the markets here, but need a stop. Friday is the JOBS REPORT, and any surprise could cause a sell off.
WTIC – Oil did not bounce with the markets. OIL IS ON DAY 21, and that is EARLY for a dcl, so…
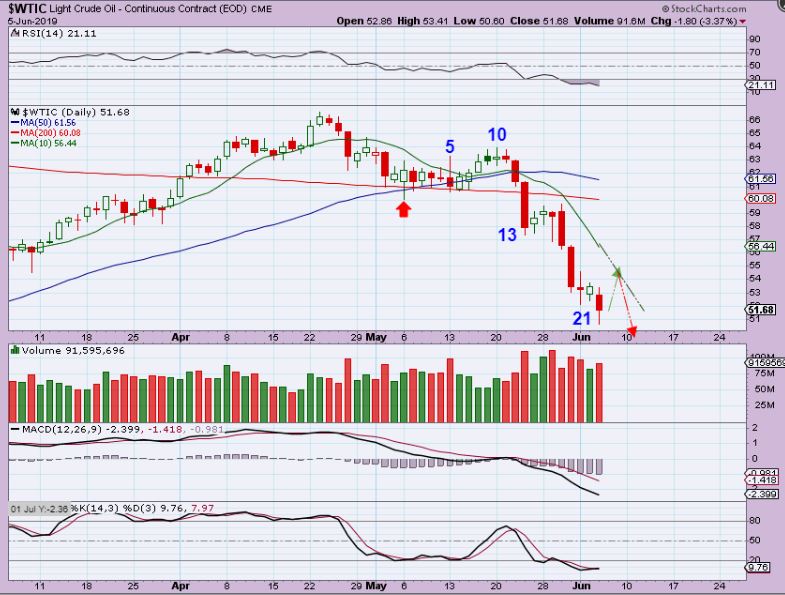
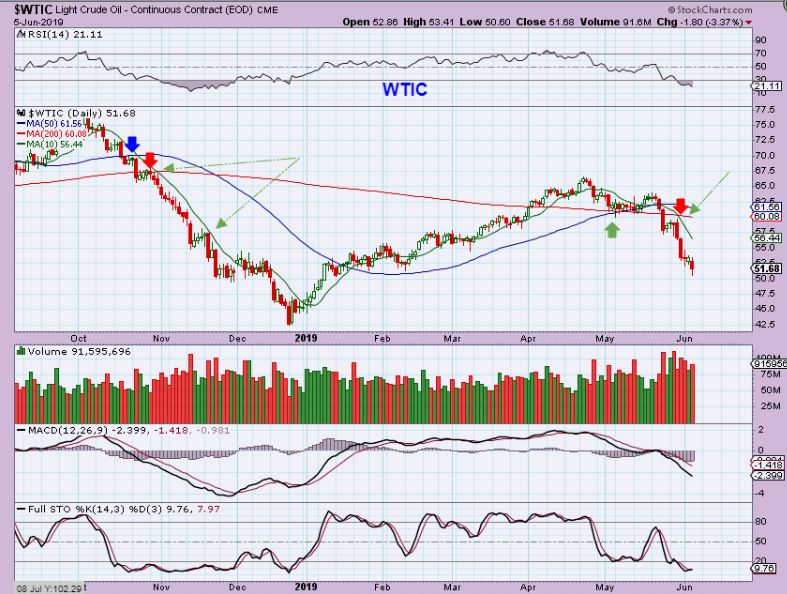
WTIC – This sell off could be ready to match the one on the left, and the Markets have been following OIL ( or visa versa). If Oil keeps selling off…
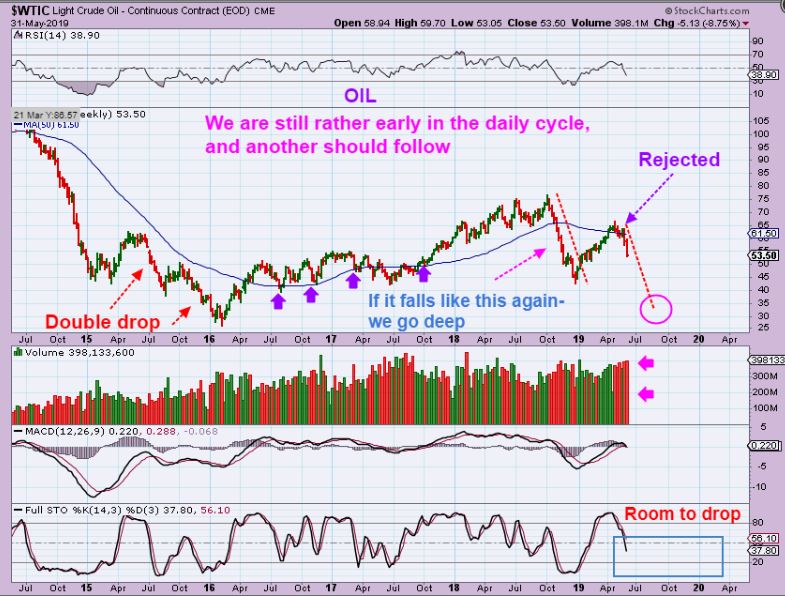
WTIC – This was my weekly Oil chart on May 31, and this could play out . This second leg down would match the first drop. Will the Markets follow after the Jobs report?
.
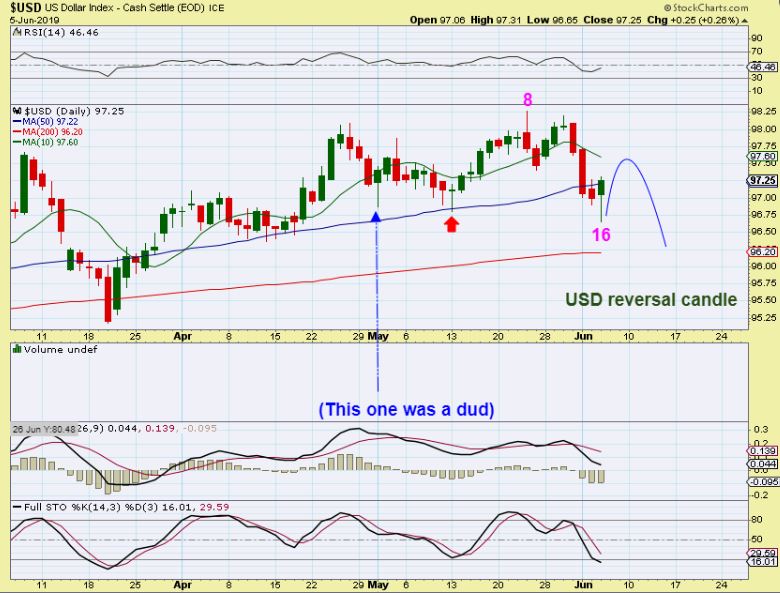
USD – The USD peaked on day 8 and broke the recent dcl lows. I see a reversal, BUT…
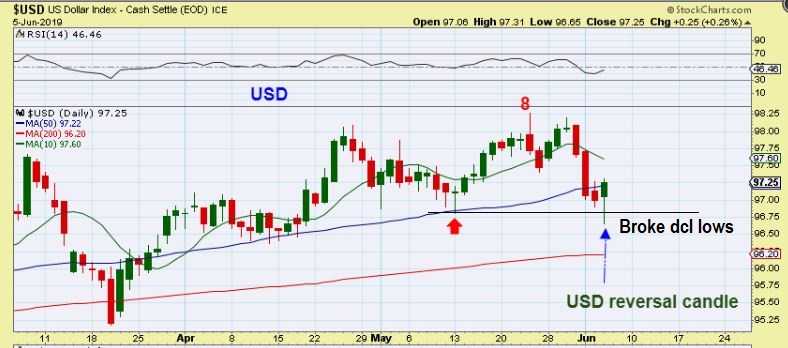
USD – Reversals aren’t always the start of a rally. Look at the nice reversal in May 1 (FOMC). The USD has gone sideways for over a month. This is helping Gold, which bottomed at the FOMC & has now rallied.
.
Just remember:
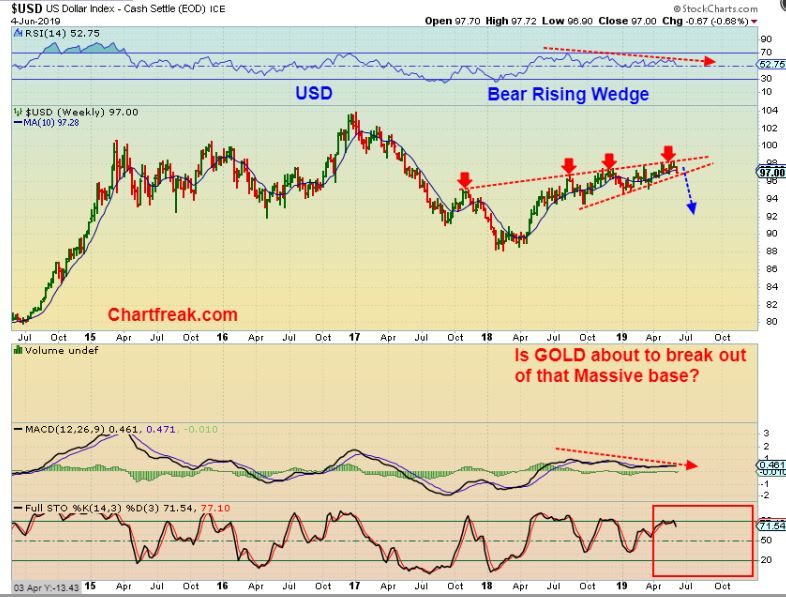
The Big Picture USD Chart is Bullish for GOLD. This is a bearish rising wedge.
.
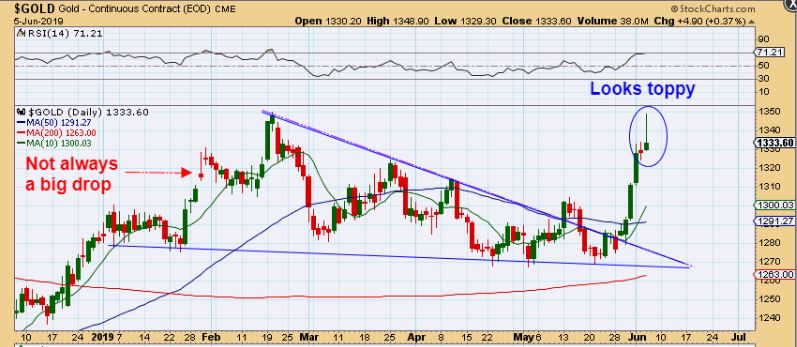
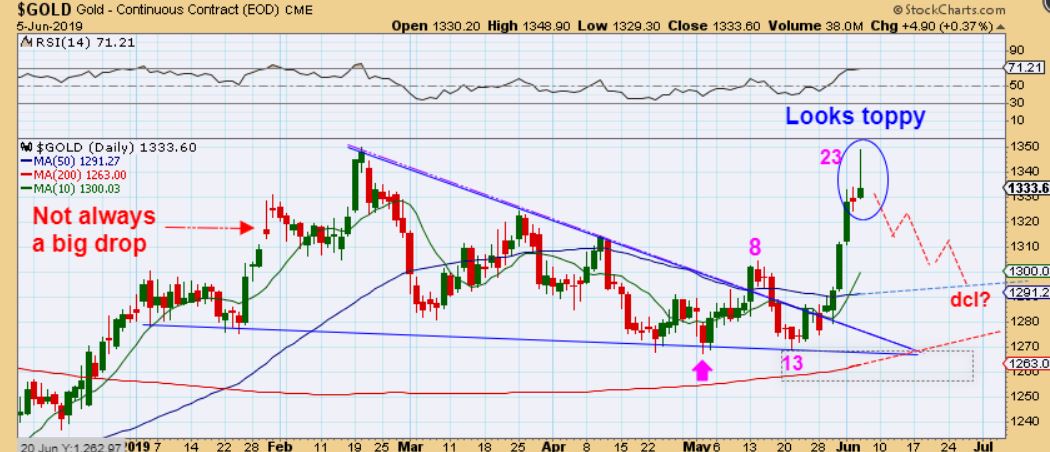
GOLD #1 – A short USD bounce could put pressure on Gold, which does have a topping looking candle. A SHORT TERM pull back could follow, some traders chose to sell when a candle like this shows up expecting a dip, but longer term buyers ride it out. The ICL is in place.
GOLD #2 – GOLD could drop. Read this chart.
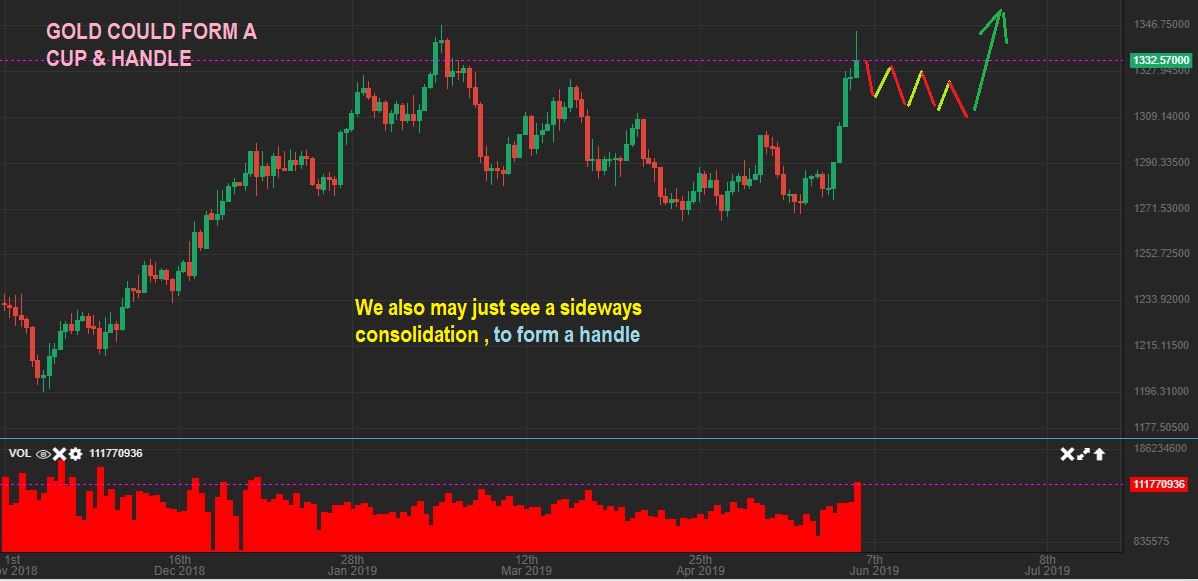
GOLD #3 – This ‘ Cup & Handle’ or pan & handle would be a normal bullish pull back for a dcl.
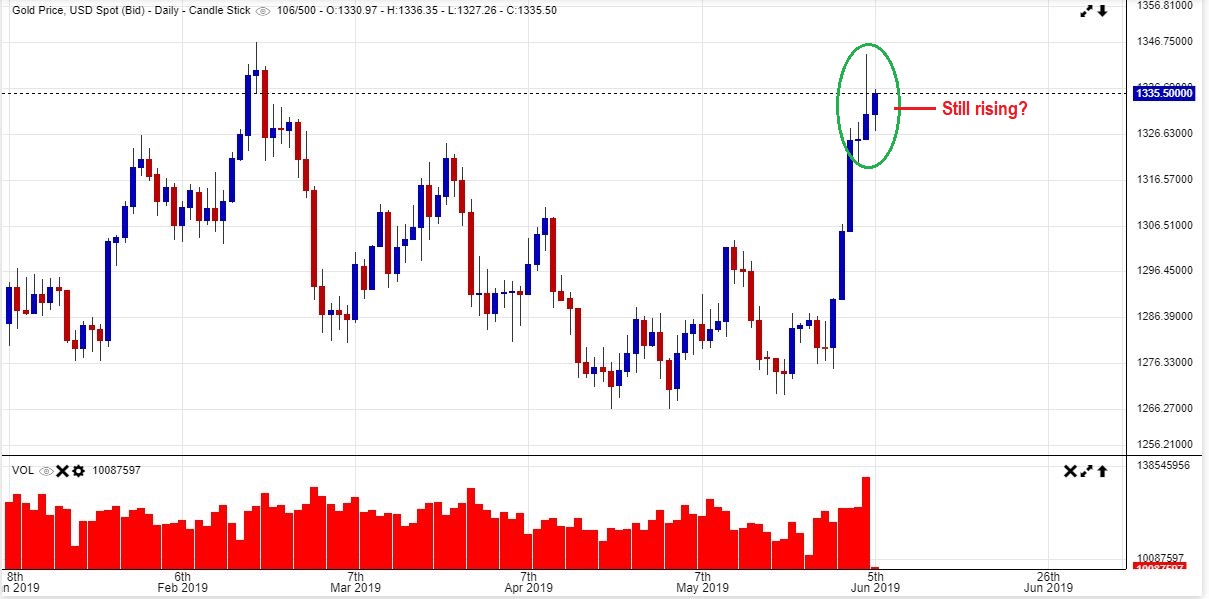
EDIT: 7 am Thursday , Gold is still rising? I really expected that reversal candle to be a stall point or top.
.
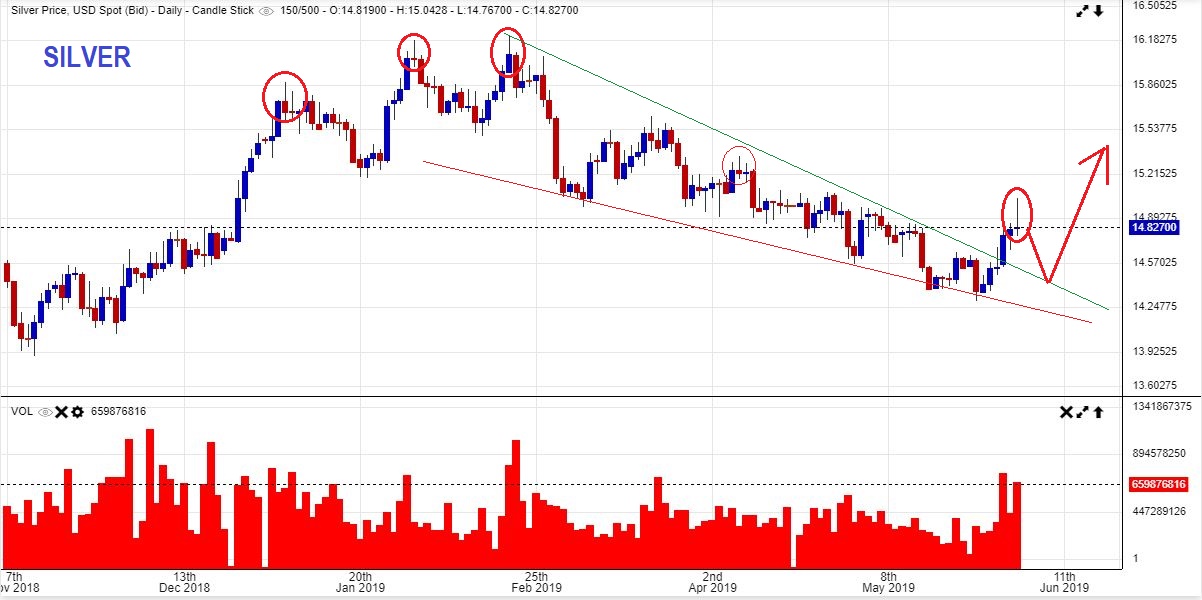
SILVER – Silver really hasn’t been keeping up, and yes that bothers me a little, but it is not a major concern. We’ll keep an eye on it.
GDX – I drew this midday, because as Miners start to sell off, traders want to sell. If we are coming due for a dcl, we could see something like this, so I just wanted to give a visual of a 50sma back test & gap fill.
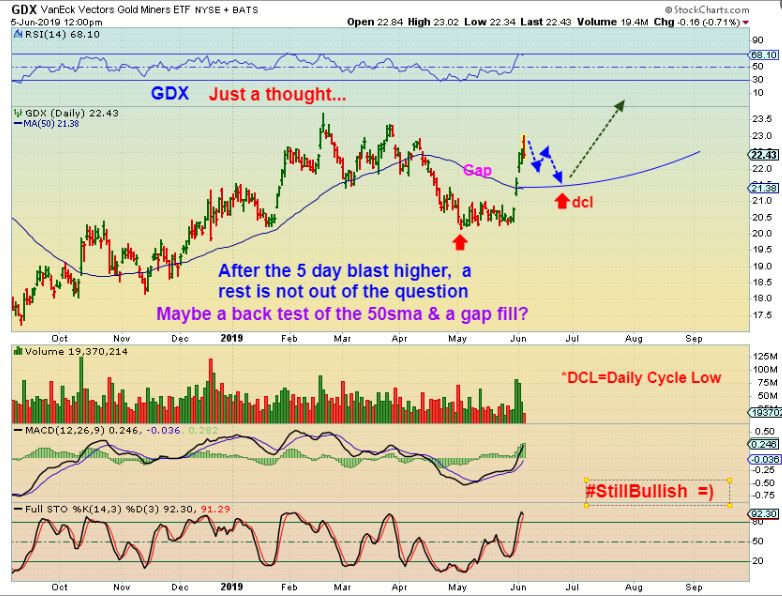
GDX – Then GDX actually closed the day GREEN. 🙂 So far, this is not letting the ‘Buy the dip’ crowd in.
.
If we do see some selling, let me just draw for you a few ideas of how things could play out. That way those that still have cash on hand can be mentally prepared to buy a reversal.
.
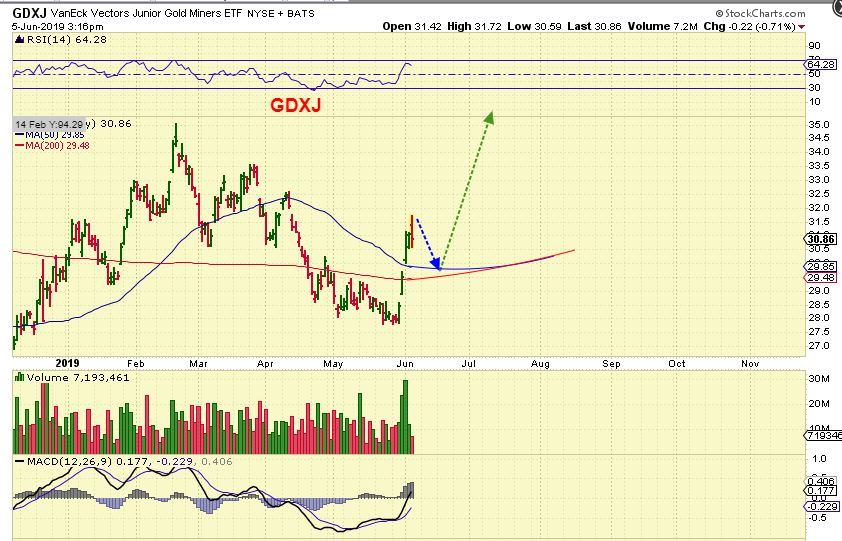
GDXJ #1 – How about a tag of the 50 or 200 sma & reverse?
GDXJ #2 – Inverse H& S formation, where it gets a bit choppy again?
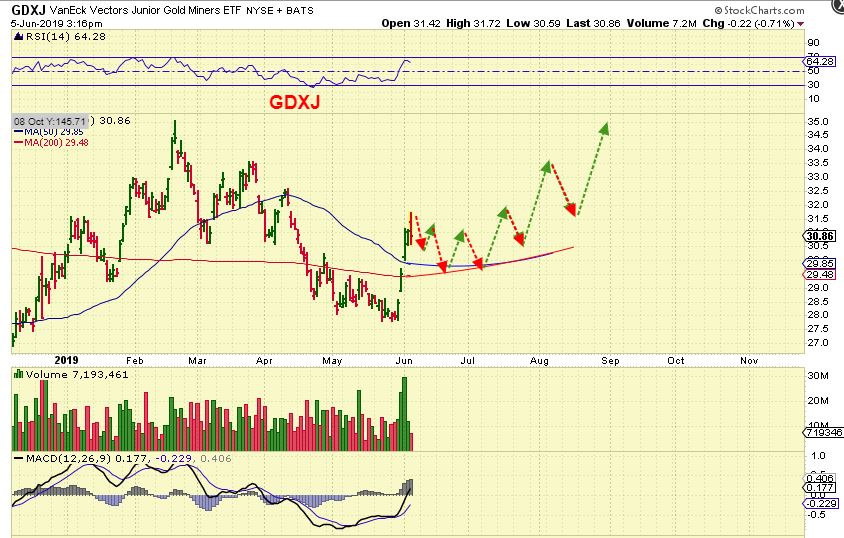
GDXJ #3 – We could see a repeat of that small flag ( this time to the 50sma), one similar to the Feb dip.
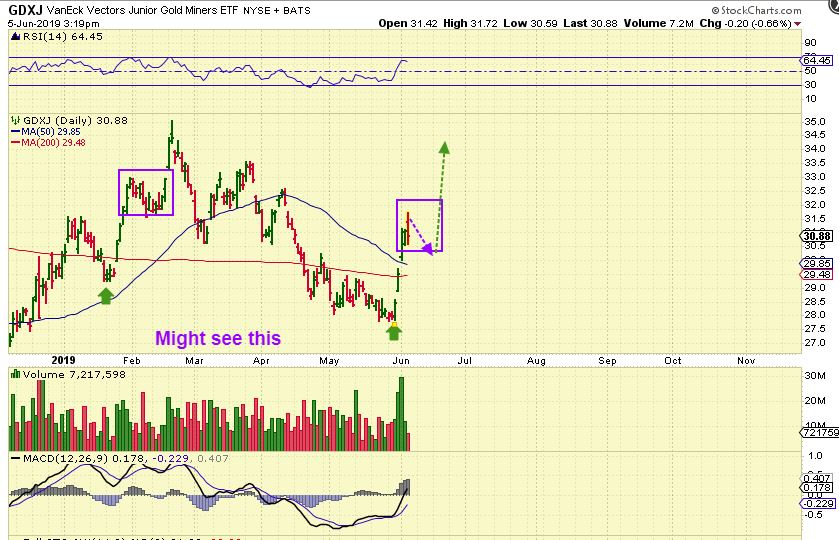
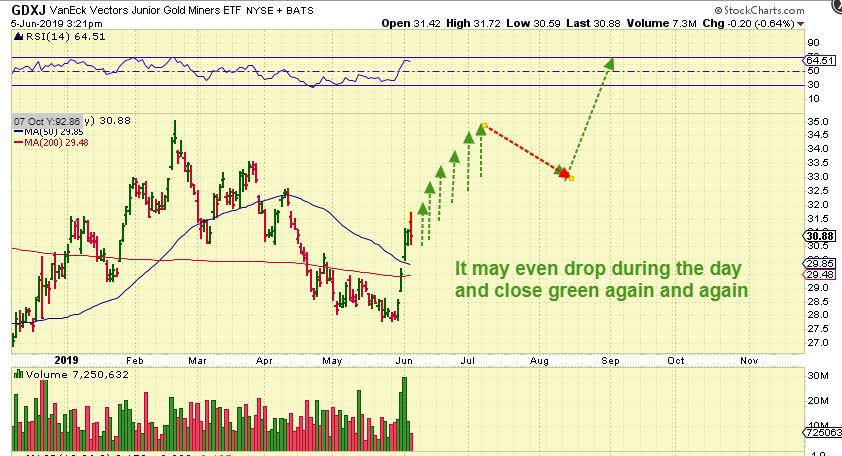
GDXJ #4 – But a ‘lock out’ runaway move is not out of the question, and that is why I have been saying that you should own a few Miners at least, and buy the dips when possible.
.
lock out’ runaway move
.
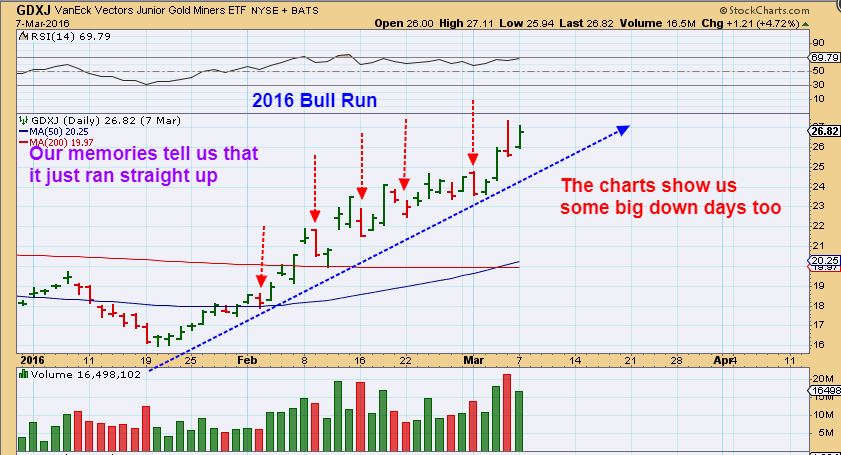
GDXJ 2016 – Another look at our 2016 run shows sort of a runaway move that locked out buyers. Notice that it often had a sell off day big enough to wipe out the prior days gains. Those were big 1 day drops ( possibly scaring people out ), but within 1 or 2 days, it was at new highs again. THAT is why that move left people behind. A Big down day scared people out, but then the dip was too quick to buy. So we need to try not to let a big down day or 2 affect our Big Picture view.
.
So there are many different ways that this can play out in the Precious Metals sector, but I am talking about Bullish ways. I feel that the ICL is in place and GOLD has been strong. Let’s just see how things continue to play out, and any 2-3 day dips may just be a good place to add or buy that dip 🙂
Enjoy your Thursday trading!
.
~ALEX
.
IDEAS:
.
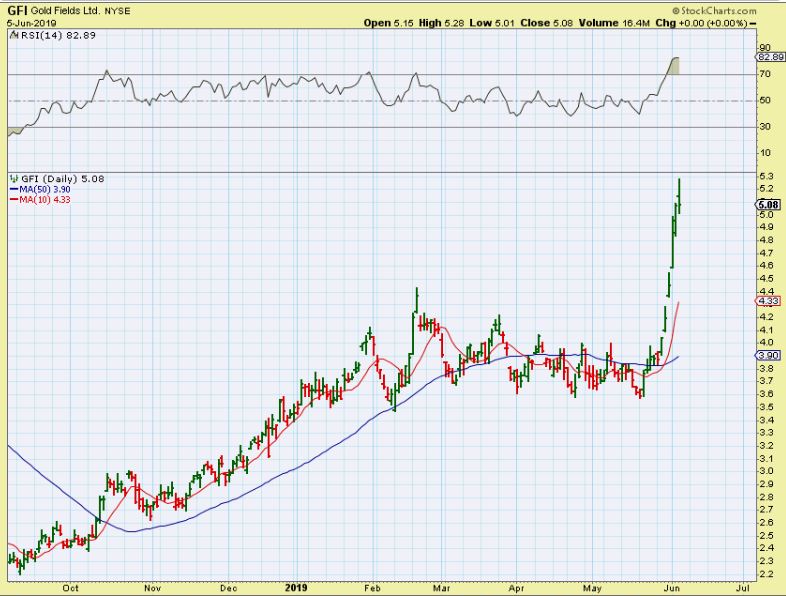
GFI – This one I would have sold , to buy again later.
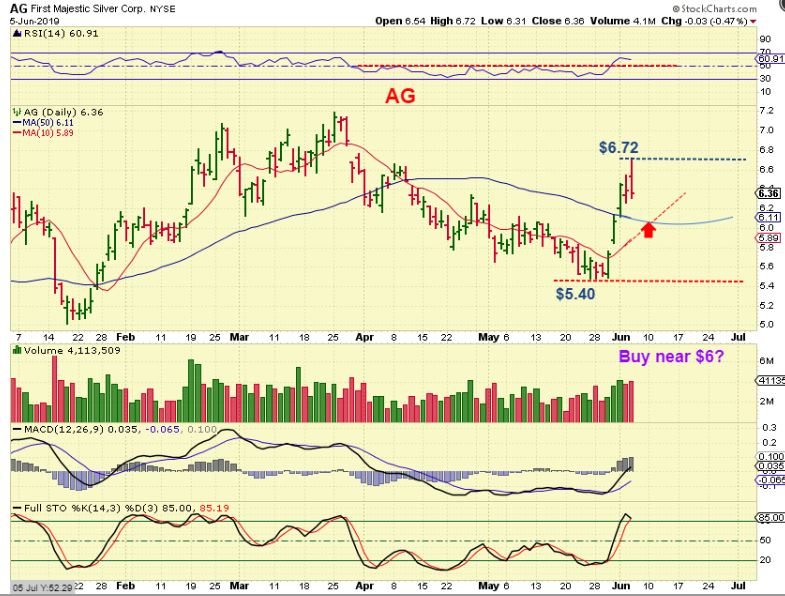
AG – AG broke above the 50sma and could do a back test soon. A reversal there is a buy, because I think that this is a great silver Miner.
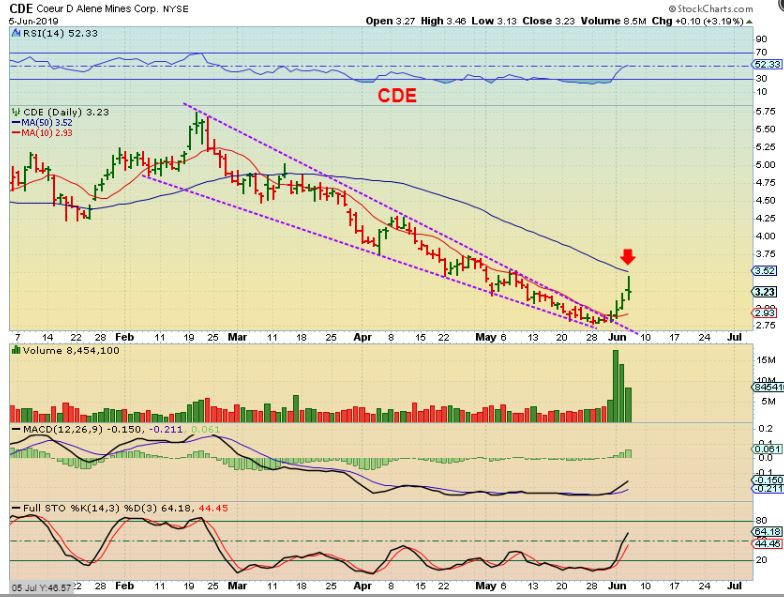
CDE – CDE may be temporarily peaking, so you can buy the dip if it drops. It also may just crawl sideways along the 50sma, because the volume has been double & triple average volume.
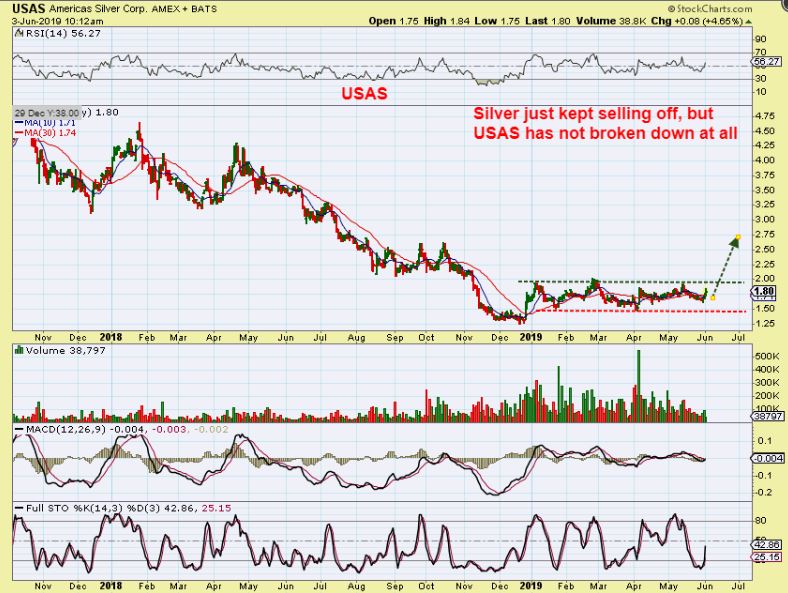
USAS – On June 3rd, I posted this base as a nice set up for a Silver stock.
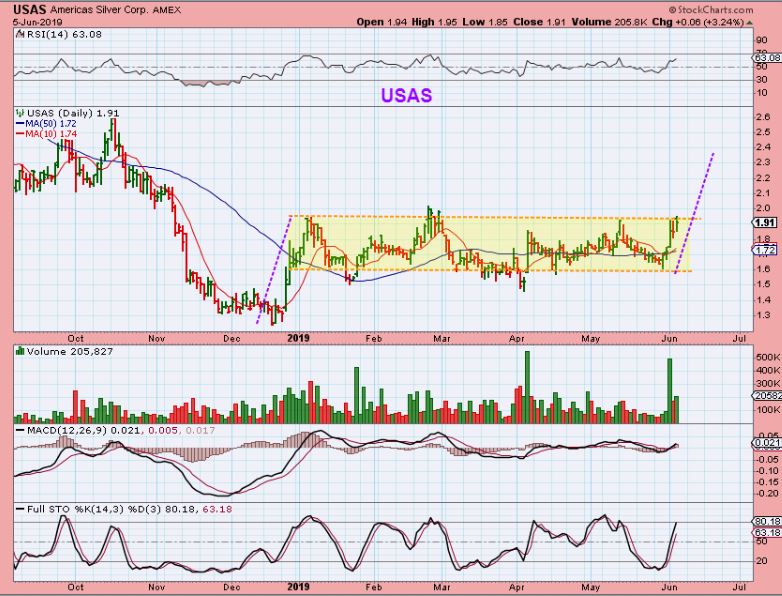
USAS – It is at the top of that base now (Progress).
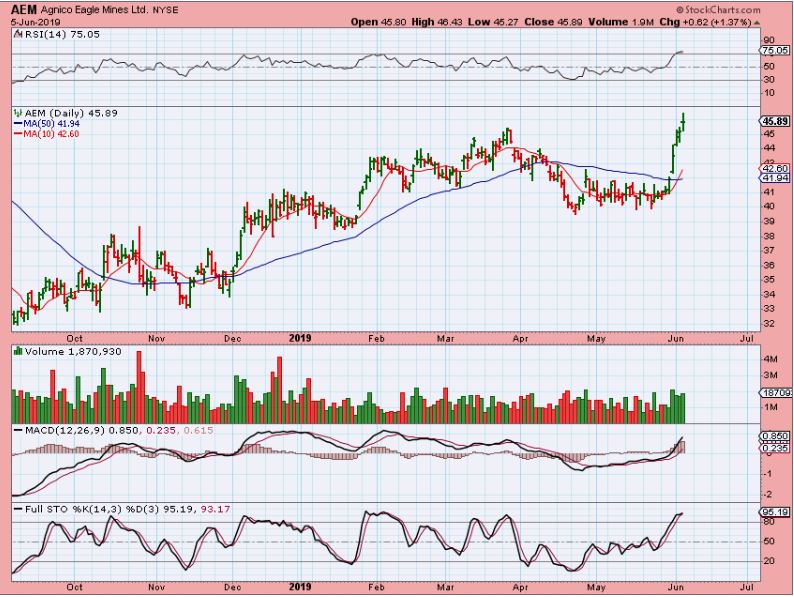
AEM JUNE 1 recommendation – This inverse H&S was about to break out, and the upside potential looked great.
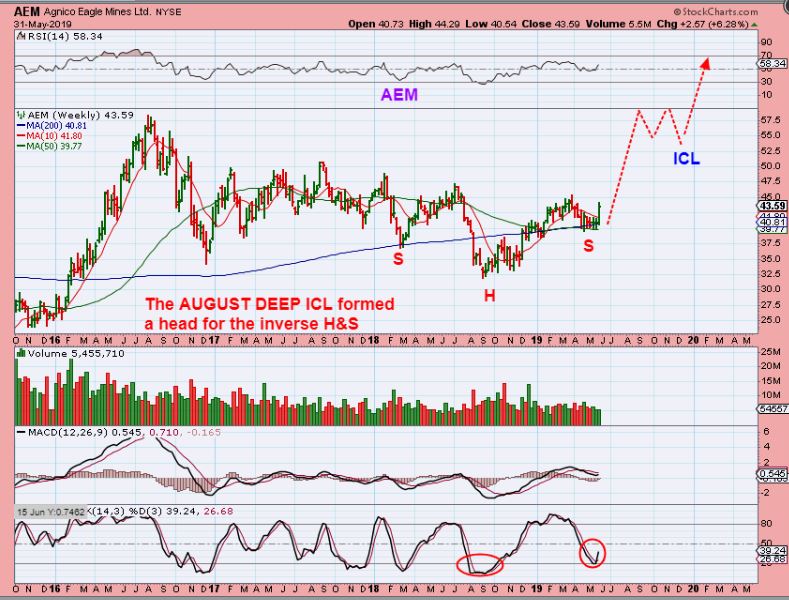
AEM – So far it is continuing on its way. Buy a dip or bull flag if we get one, this looks like the big Boys may be buying it ( Funds, etc).
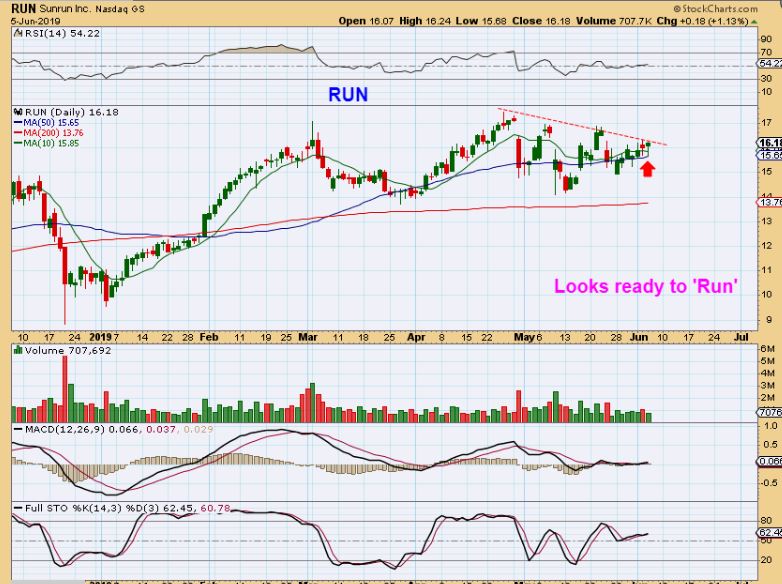
RUN – I just want to return to RUN, the Solar stock. It is still Bullish too.
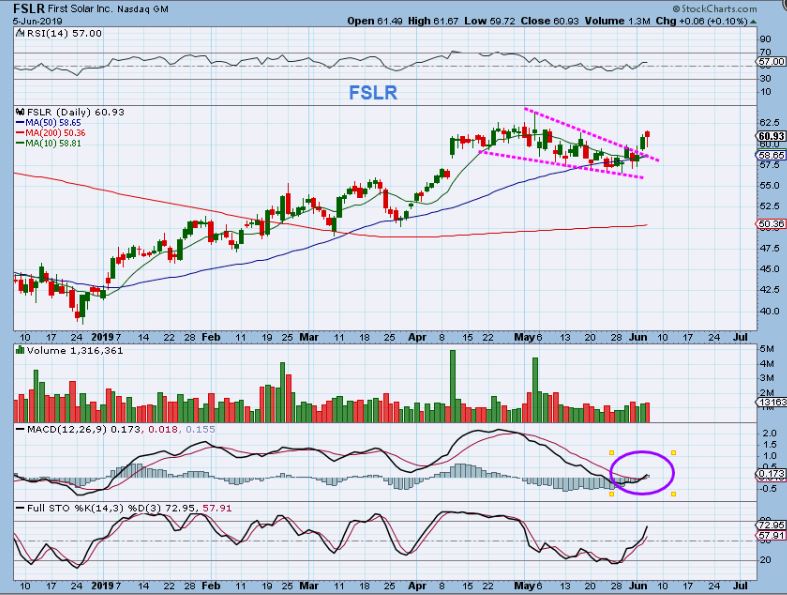
FSLR – FSLR broke out and is above the 50 sma.
ON THE WATCH LIST:
.
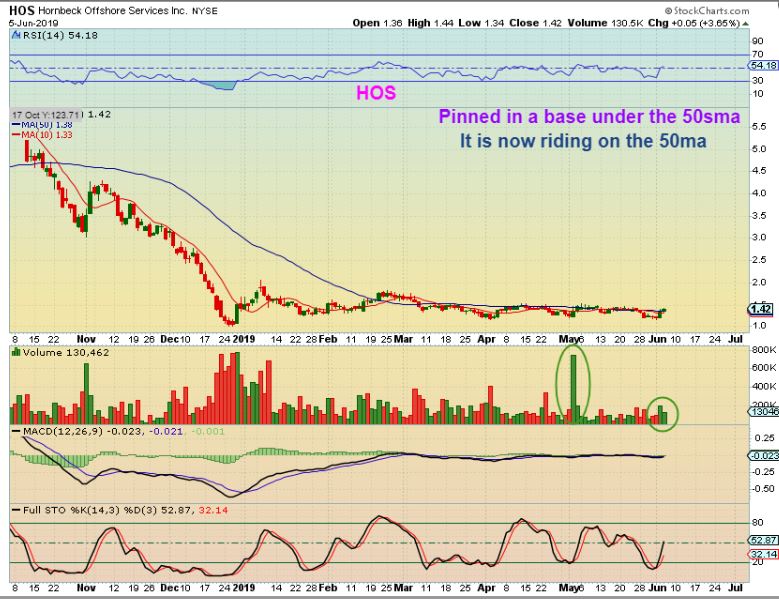
HOS – Most of you know how I feel when I find a nice long tight base. This is an energy stock, but if it POPS or when Energy starts rising, this may make some fast gains. Place it on a watch list or a ‘ Break out ‘ alert (Maria). 🙂
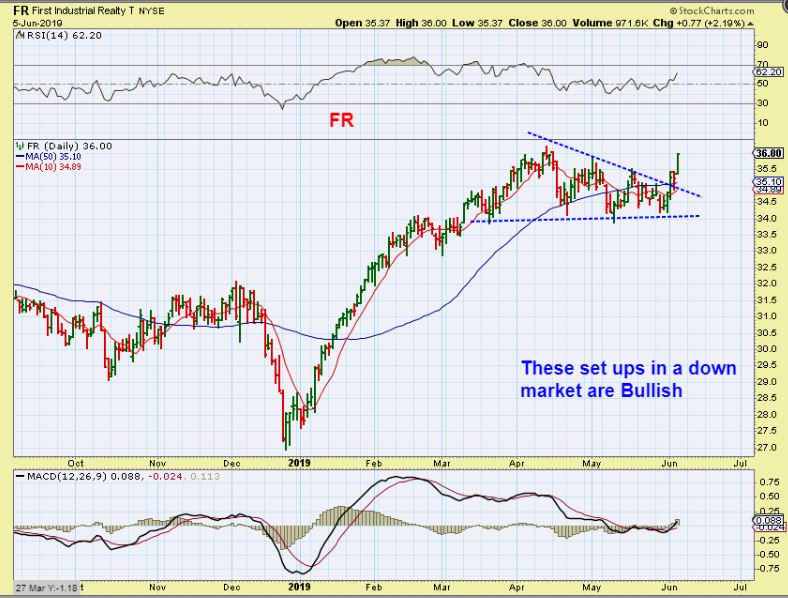
FR – This is a bullish set up & break out. It ignored the sell off and instead consolidated with a triangle flag.