Weekend Big Picture For May 26th ( Long Weekend In The U.S.)
WEEKEND REVIEW AND OBSERVATIONS
Note: I am spending all my time this long weekend with Family & friends. To be able to release this for my readers outside of the US that will have open markets Monday, I need to release this now, Sunday 2 p.m. Eastern Time. To do that, it is going out with out a good proof reading for typos. I still hope that I have been clear, I only really had maybe 4 hrs set aside to gather charts and to explain what I see happening after the Fed Minutes week of trading passed by. I think that I have done that below, but the choppiness in various sectors does remain and does make pure clarity elusive. Enjoy the report, your weekends, and again, please excuse any typos!
.
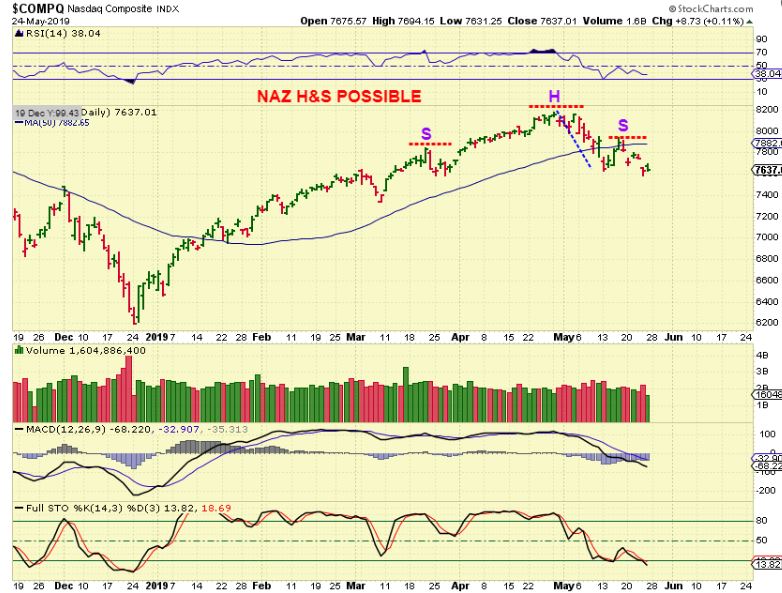
NASDAQ – The General markets SHOULD BOUNCE with a new daily cycle low, but they appear to be in danger of forming a H&S on the daily charts. This is the 3rd daily cycle and Markets are struggling out of the gate. I still would expect a bounce.
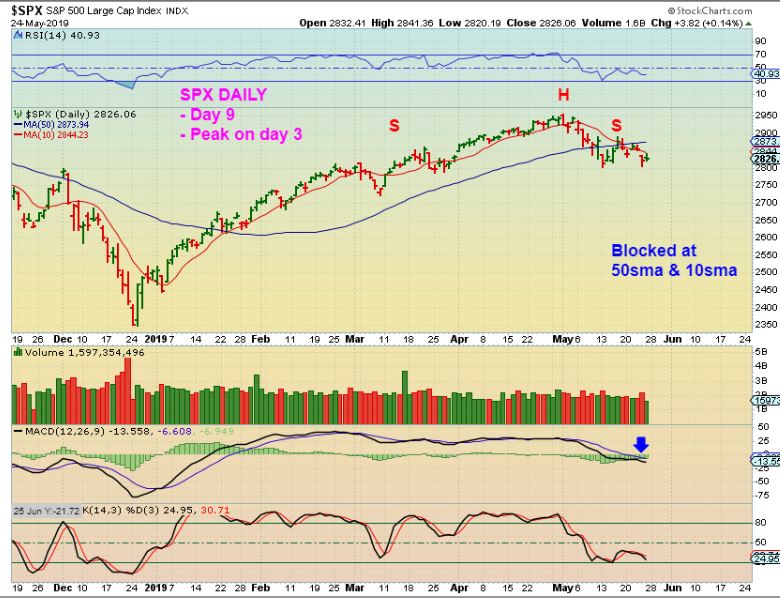
SPX -Same here with the SPX – the 10 & 50 sma have held price back.
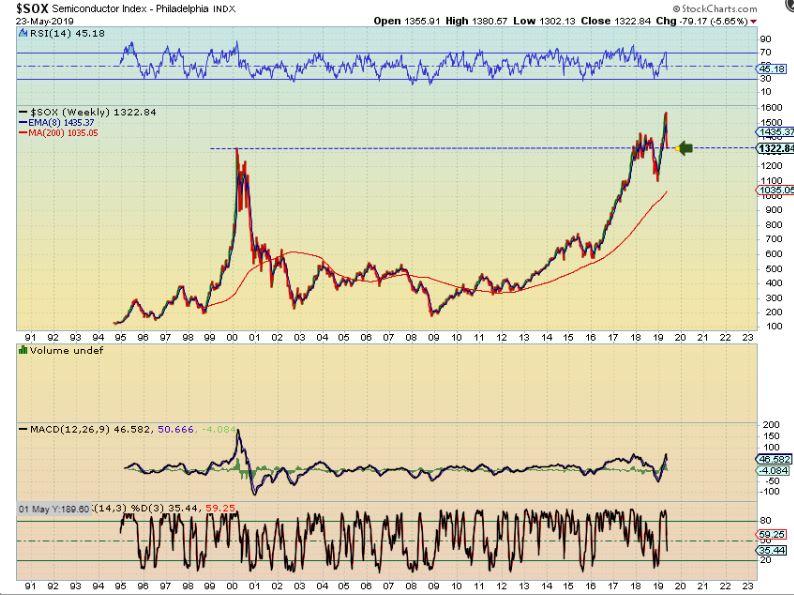
SOX – THIS COULD BE A BREAK OUT & BACKTEST, OR IT COULD BE JUST BREAKING BACK DOWN. SO FAR, SO GOOD, but notice what I found here…
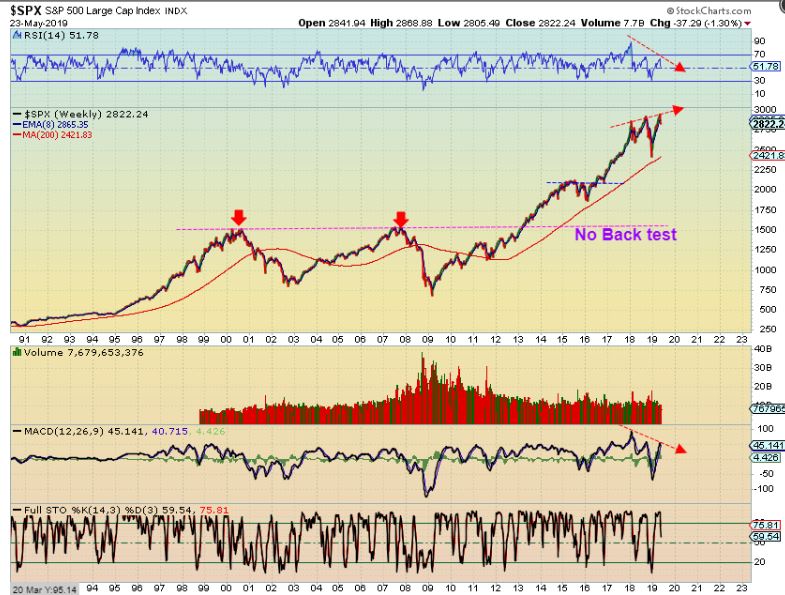
SPX BREAK OUT in 2013 – THE SPX Break out to all new highs did not back test, and now this looks like a possible triple top with negative divergence.
NASDAQ – The NASDAQ broke to all new highs in 2016 and never really back tested either. It also now looks like it MIGHT be forming a double top with negative divergence on the RSI weekly too.
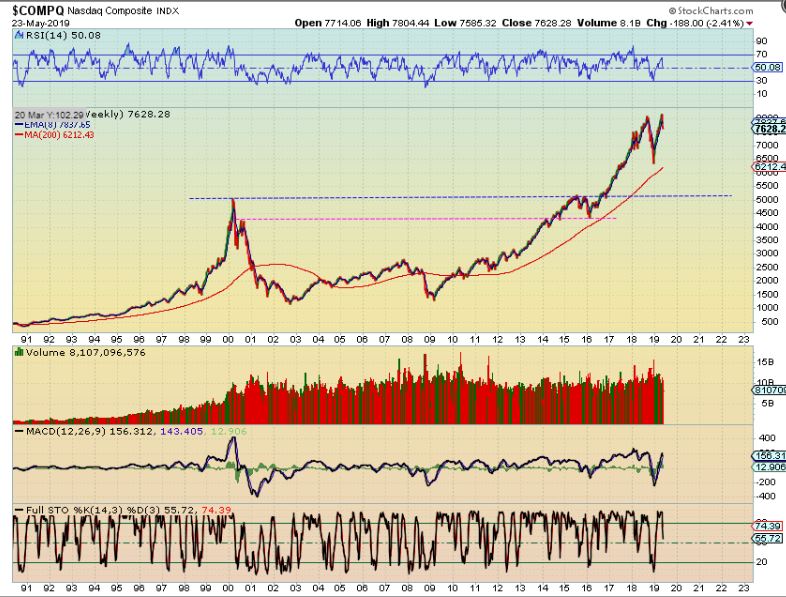
So my point is that these markets breaking to new highs may be a bull trap. These markets could be topping after a nice long multi year run. The Big Picture needs more time to prove things out 1 way or the other, but these are some of the things that I am watching.
.
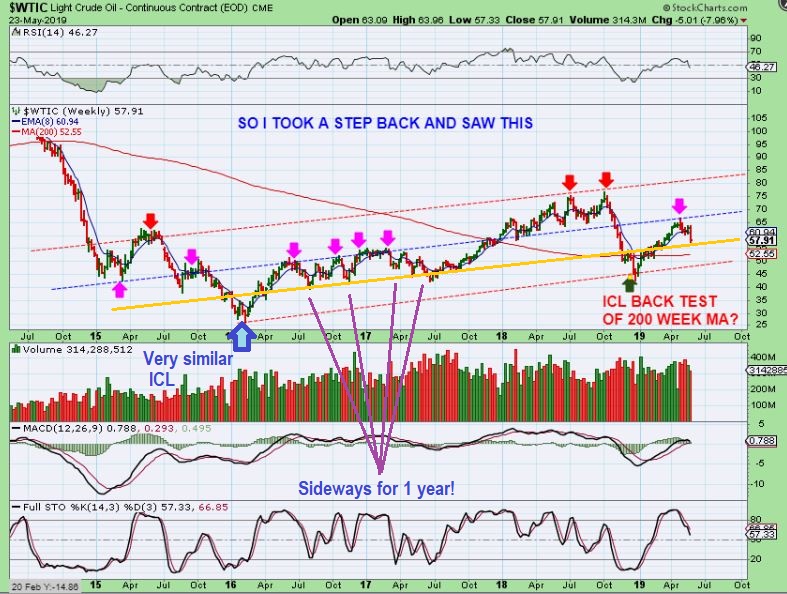
WTIC WEEKLY – I posted this chart in Fridays report, but I I studied it a bit further too. I noticed something interesting, so I added the Orange-Yellow line. That ICL in Early 2016 (Blue arrow) rallied 2 daily cycles just like this one, and dropped just like this one. Look at that one compared to now. What came next? Sideways chop for a year.
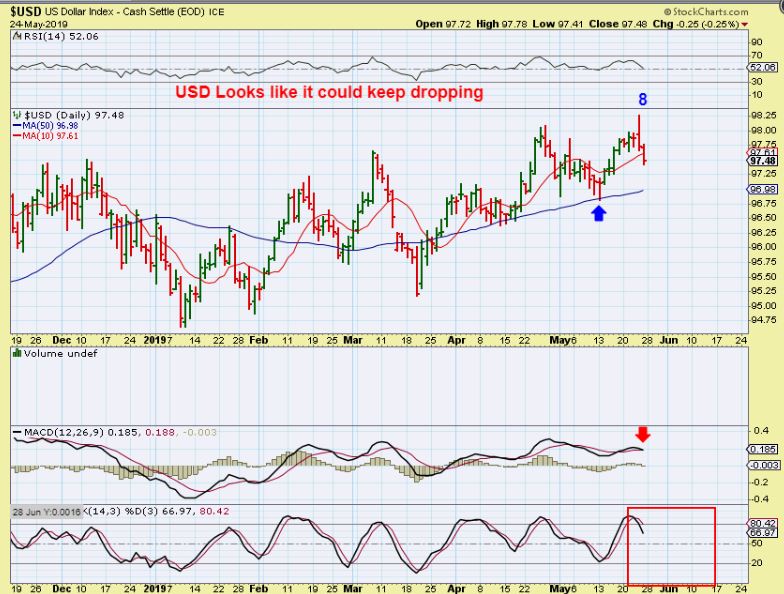
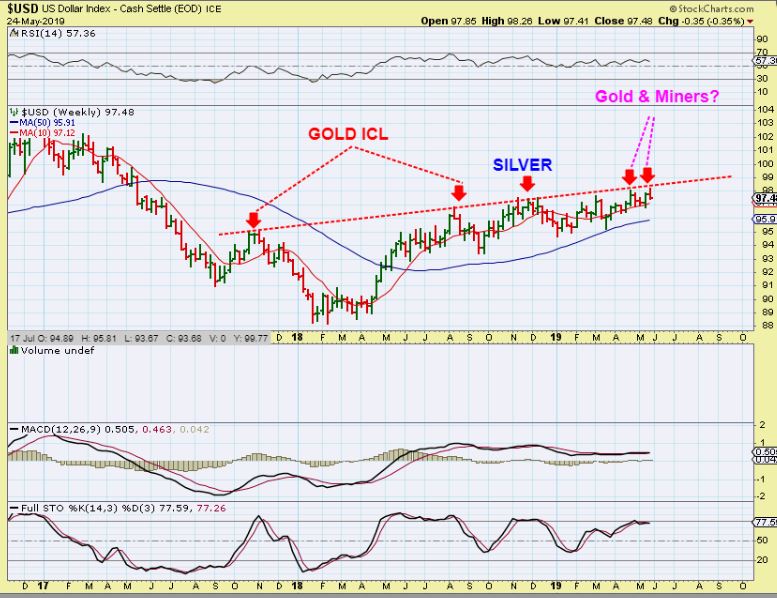
USD – The USD surged the day after the Fed Minutes Thursday and then Bull trapped. It fell immediately after.
.
USD BIG PICTURE – I have been pointing out the correlation of the USD topping with past GOLD ICLs. When GOLD gets to the upper line, I wanted to look for GOLDS ICL. This was my MAY 3 chart as a reminder. 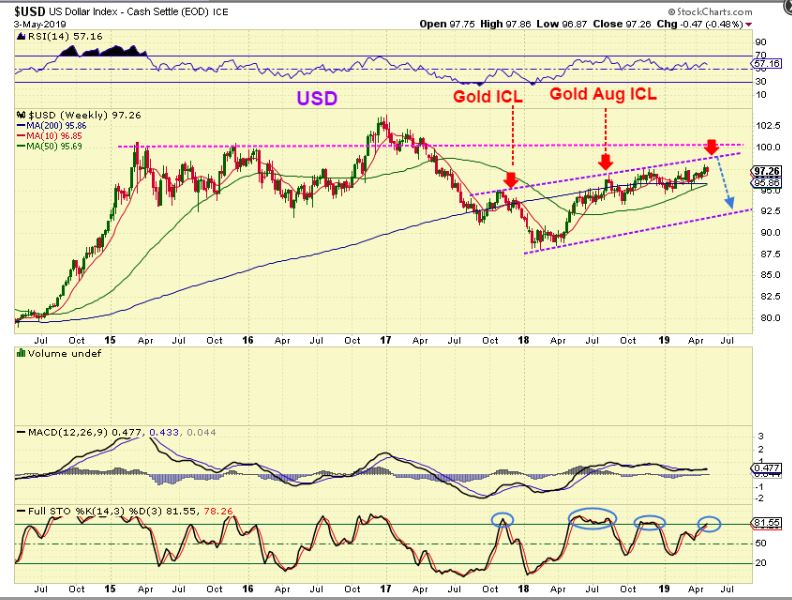
This was May 20 with a little more room to go? GOLD already looked to have put in a low the day after the FED MTG though.

USD BIG PICTURE – Now the USD popped with the FED MINUTES last week and then dropped into the end of the week ‘weekly reversal’. We have a pop to the upper line & reversal. Could that be the LOWS in SILVER & GDXJ, with GOLD & GDX bottomed the day after the Fed Mtg? Time will tell. Let’s look at Precious Metals .
PRECIOUS METALS
.
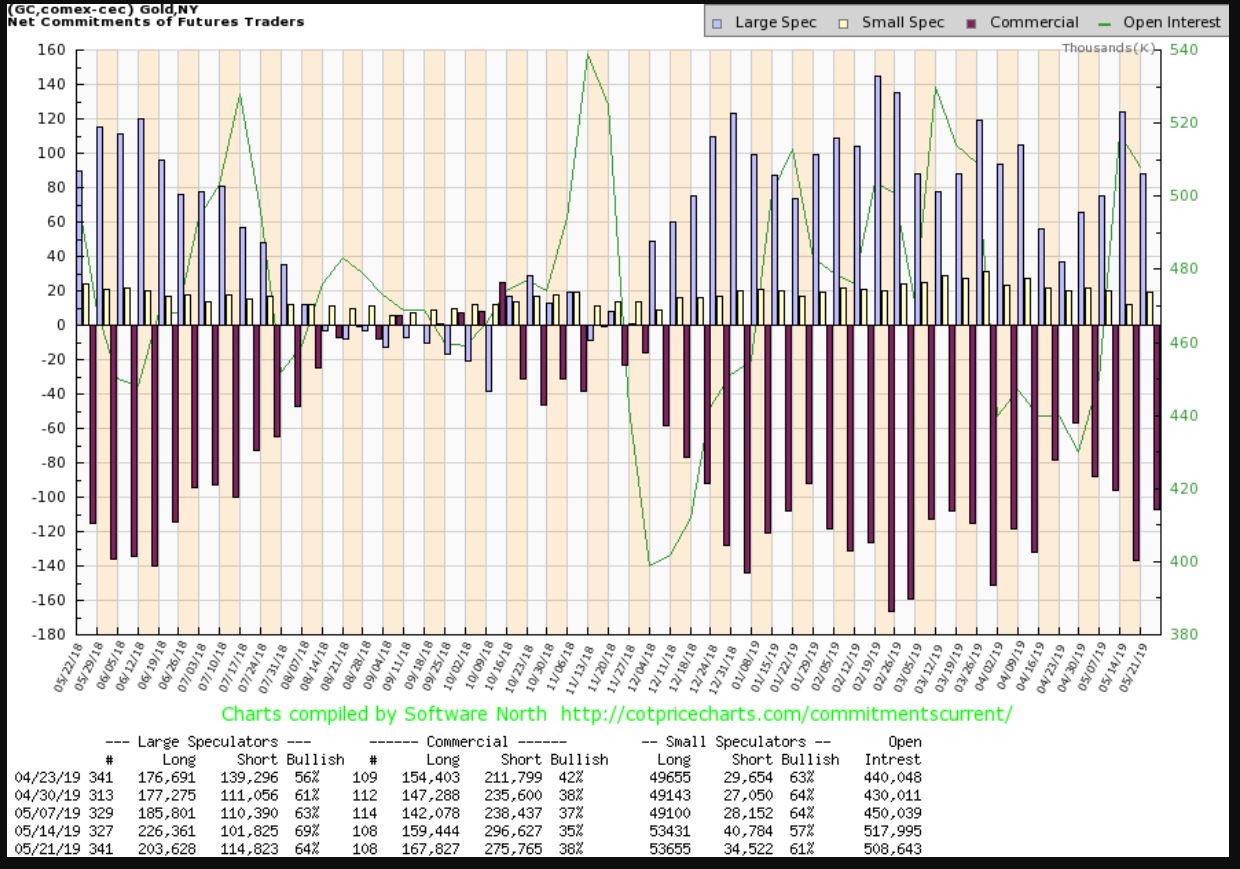
GOLDS COT – Improved but is not near ICL levels. It WAS in that rage for a week at the Fed Mtg.
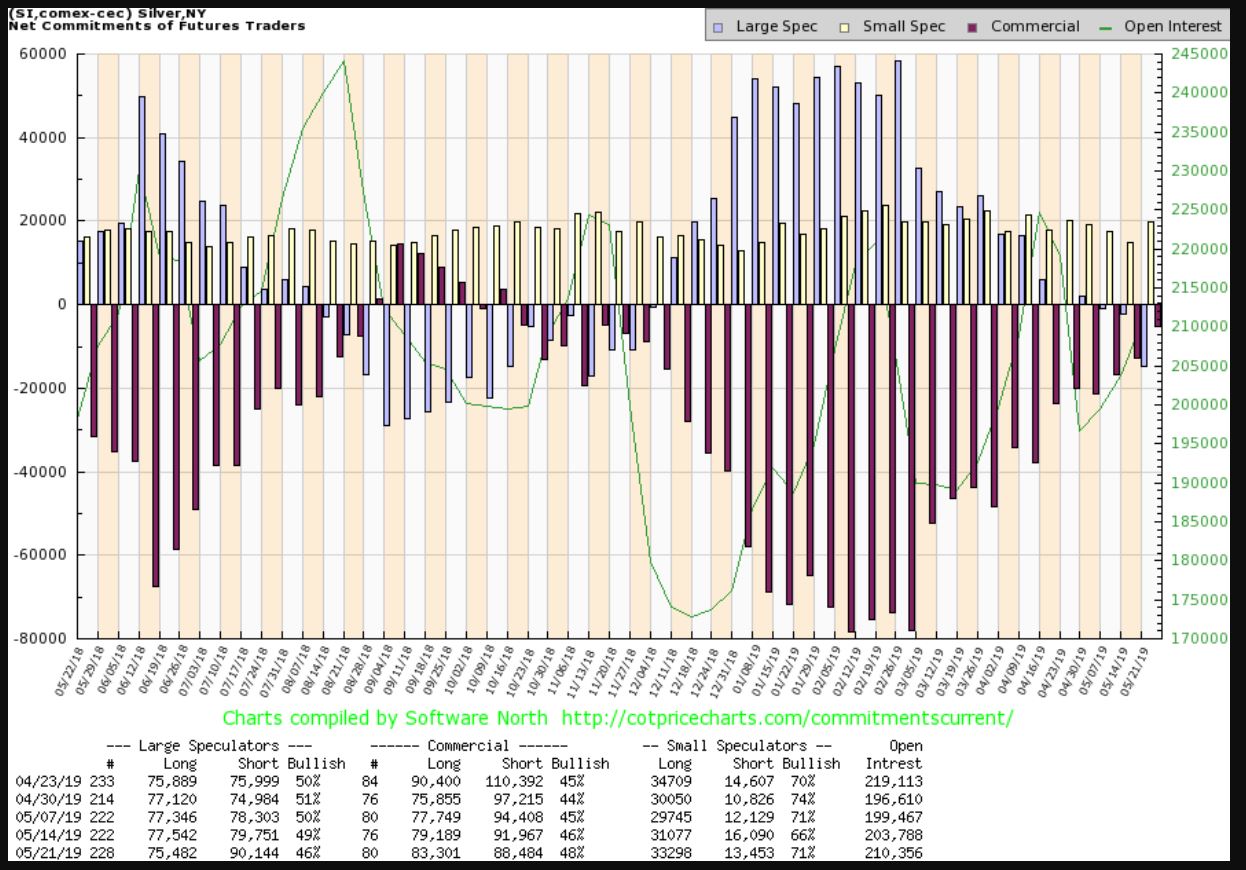
SILVERS COT – Silvers COT is within the ICL range. We have seen it better last September, but this is a good reading.
.
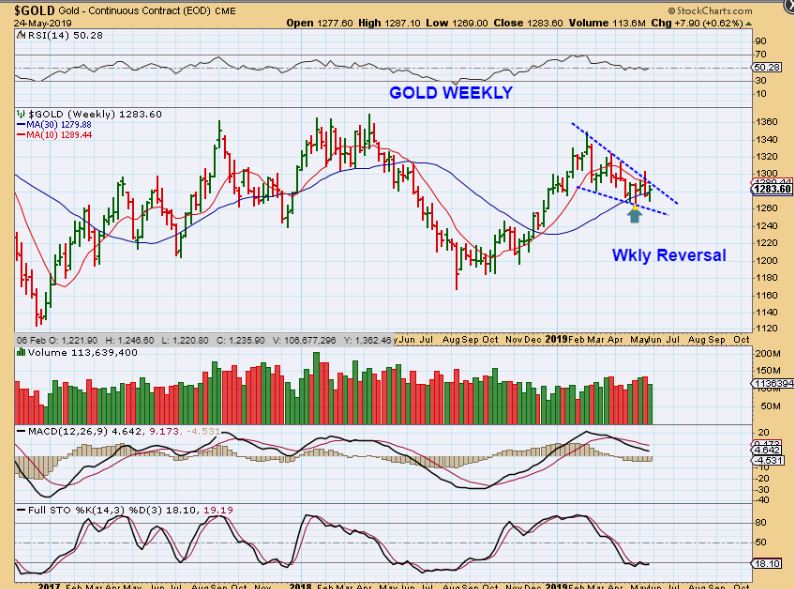
GOLD WEEKLY – We still have the FED MTG lows in place. Gold has been choppy and with the Fed Minutes released, we now have a weekly reversal in Gold ( & the USD topped). We now have to see what happens next week, but though it has been choppy, the lows for GOLD have held up.
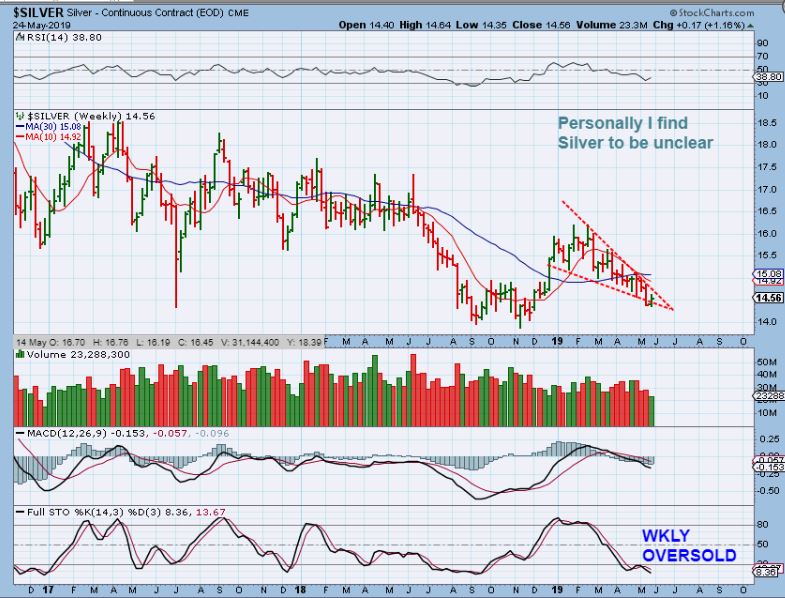
SILVER WEEKLY – Silver made new lows and reversed after the Fed Minutes (or into the close of the week). The COT is bullish, Silver is now very oversold, but the charts still a bit ugly. Let’s hope that this is the start for Silver coming out of the lows.
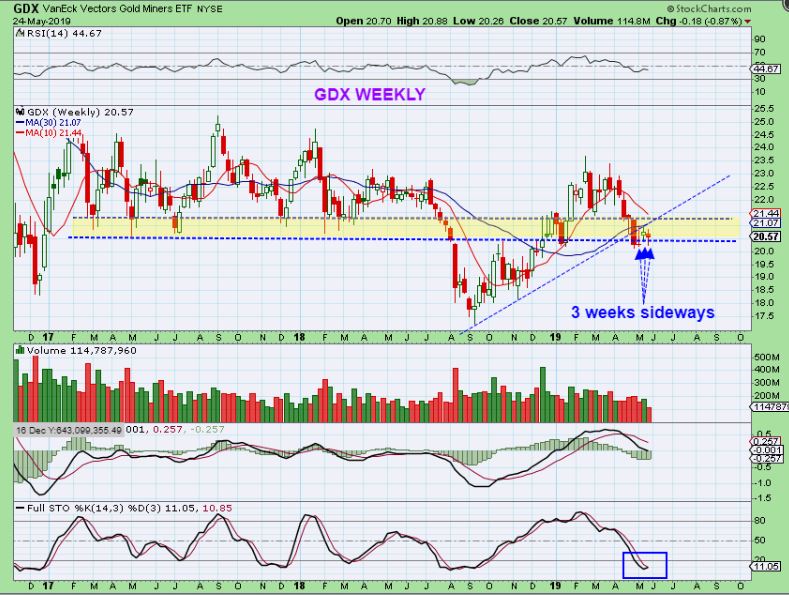
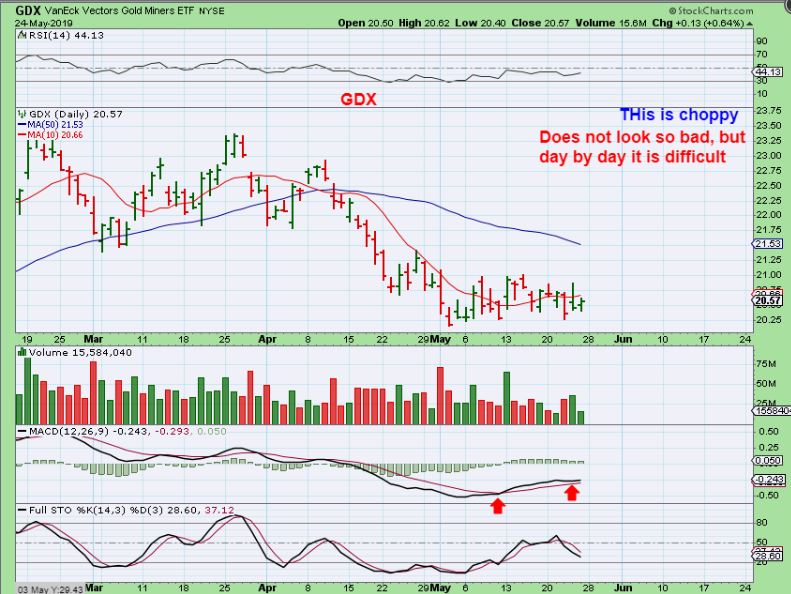
GDX WEEKLY – GDX lows from the day after the Fed are still in place ( GDXJ chart is closer to Silvers). It has been choppy and difficult without upside follow through, I’ll discuss that shortly. The point is, GDX still has lows in place from 3 weeks ago, but Nobody loves the miners here.
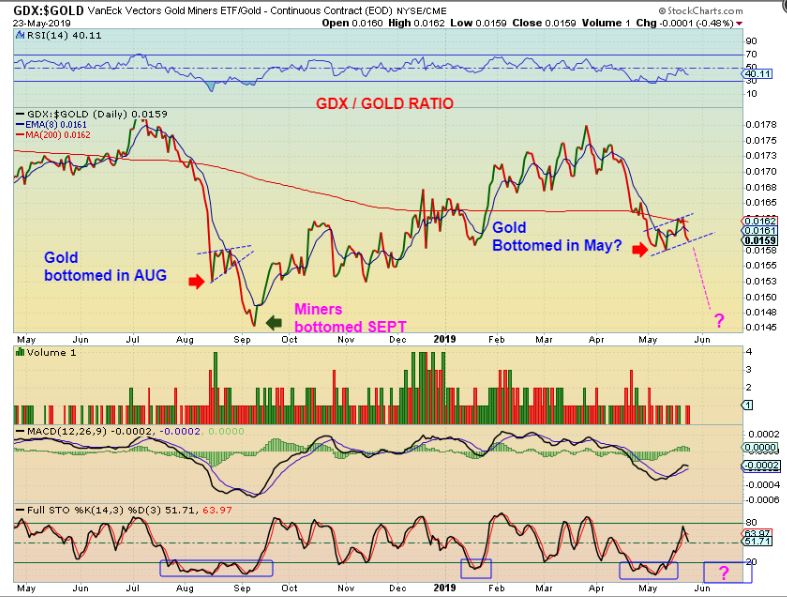
GDX / GOLD RATIO #1 – Our GDX to GOLD ratio dropped this week because Gold reacted to the Minutes immediately and ran higher, Miners dropped and reversed Friday. This can be bearish if it continues. In January we saw a similar drop , but then Miners ran higher. See the chart.
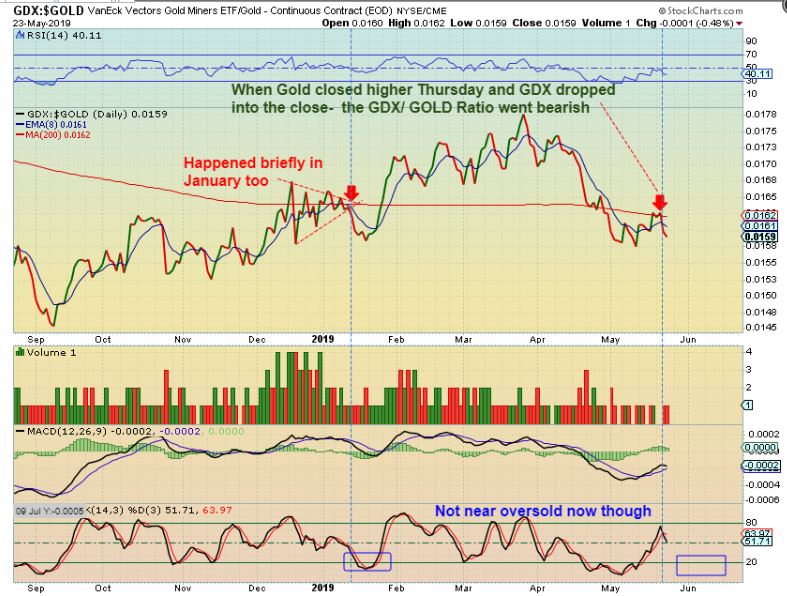
GDX / GOLD RATIO #2 – Just a reminder , In August we saw something similar and it led to the final sell off for Miners where GOLD bottomed in AUGUST and MINERS bottomed 1 month later. What can we do about that? We use stops, keep positions smaller, and Stay Frosty.
.
GDX – So GDX lows from May 2 are still in place, but it has been choppy and most traders are frustrated, irritated, Hate Miners , etc. Is there a Bullish side to this? History says “Yes’.
GDX November 2015 to Jan 2016- I HAVE TO keep reminding all of the sloppy, choppy, trading in Miners as they tried to bottom in 2015-2016. Look at this chart, picture day after day after day trading. THEN A SLAM DOWN!! OH NO!!
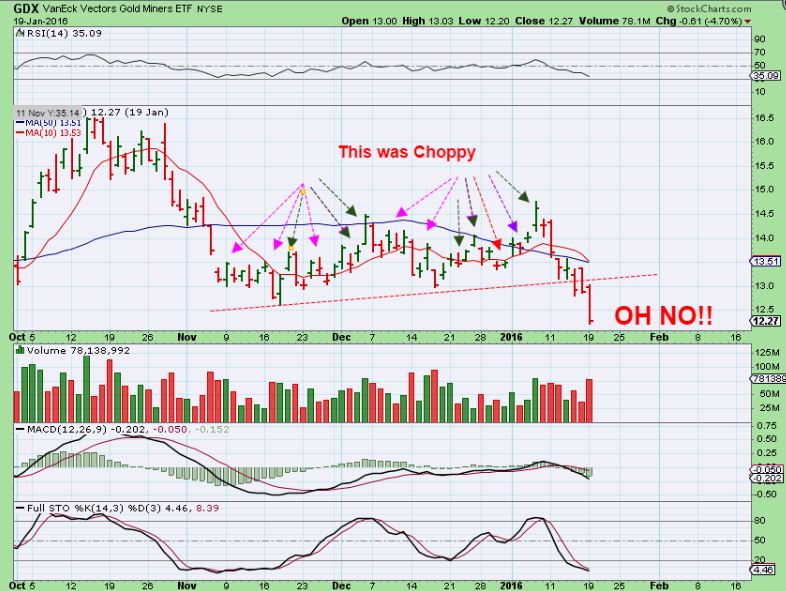
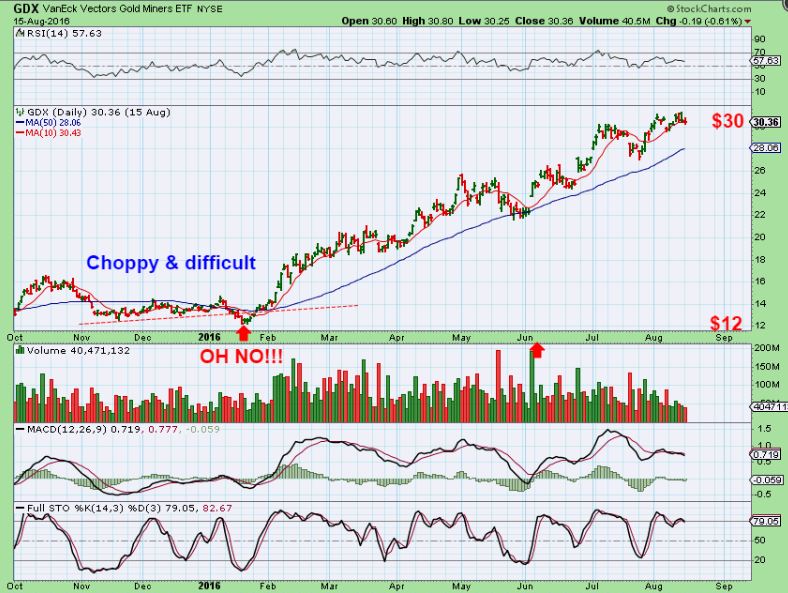
GDX – It looked like nothing at all once the rally took hold, and I am expecting good rally soon too. SO WAIT PATIENTLY? KEEP POSITIONS SMALL? USE STOPS BUT BE READY TO BUY THE COMING RALLY.
.
The current lows in GDX look similar to those Nov 2015 to Jan 2016 sloppy choppy trading days , so this is not unusual. I just wanted to point that out. Some of the Bigger Miners are also holding up fairly well, they seem to have bottomed with GOLD, so you may want to buy one or 2 of those when they pull back. I have mentioned that in prior reports too. I will discuss it further below.
.
In the Big Picture, the markets are very choppy and seem to have started their 3rd daily cycle. This daily cycle could give us clues as to how the markets will play out going forward. Sentiment seems lows & fearful, so I’d still expect a better bounce than we have already seen, but we’ll see what happens next week. No trade there for me.
OIL dropped, and I wasn’t really expecting that early in the daily cycle. It sliced right through the 50sma & then the 200sma the next day. Oil needs watching. Precious metals was explained above.
So overall, the markets in all sectors have been choppy and that makes things impossible for the buy & hold crowd- Traders can still find set ups here and there. Some are on the sidelines patiently waiting for the volatility to die down, others should try to keep positions small and use stops for protection of funds. It is a holiday in the US Monday, so we’ll be back Tuesday and see what the markets do in the US, for now you can watch the Markets in other countries Monday for clues. I hope that you are all enjoying your weekend!
.
~ALEX
.
SOME MAY WANT TO BE SELECTIVE:
.
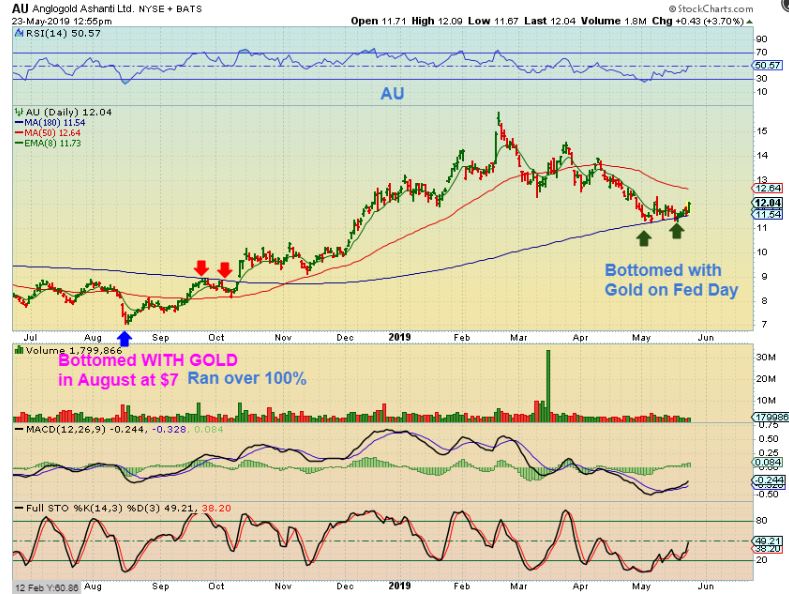
AU – This is a stock that I would be comfortable buying since it is holding up after the FED & FED MINUTES. Buy a dip? Wait for a break out? Etc…
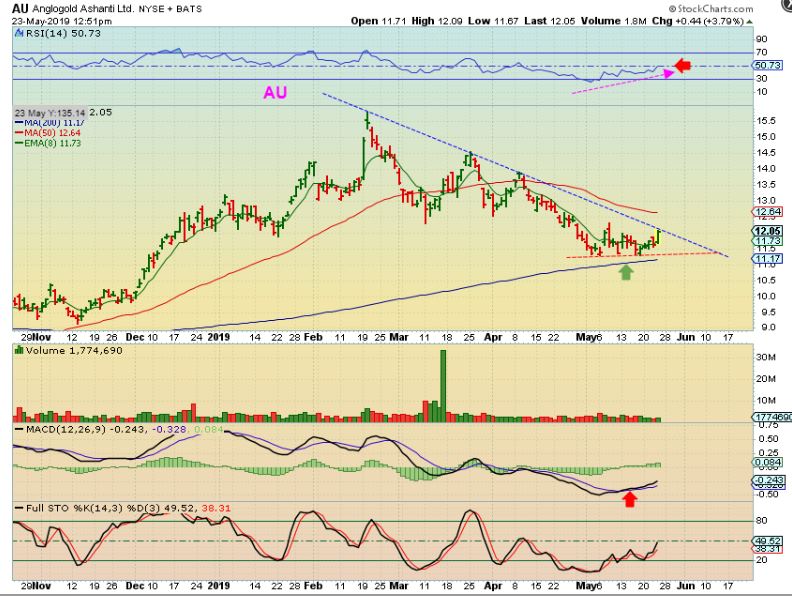
Noteworthy? – AU also bottomed in AUGUST with Gold at the last ICL, not September with GDX.
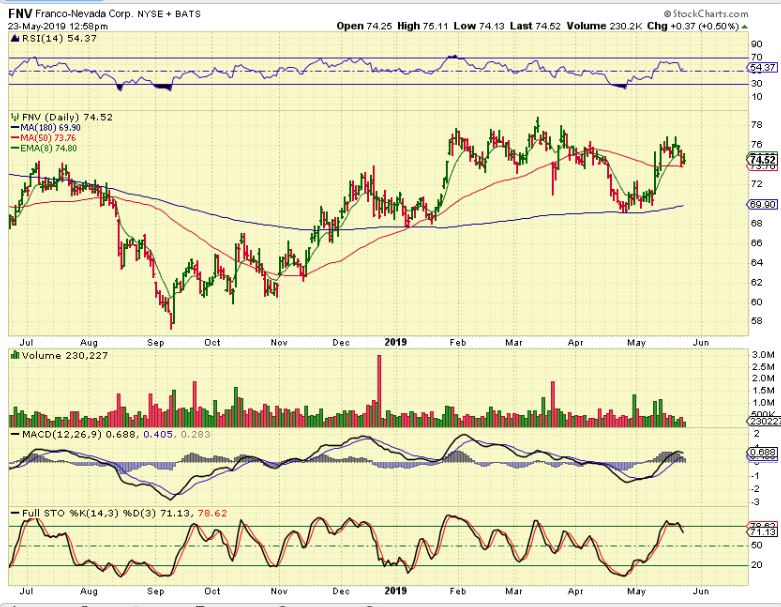
FNV – FNV bottomed before the Fed Mtg and took off that week, so this is a potential candidate to buy a dip. It closed $1 lower than this chart on Friday, so watch it around that 50sma. A Back test of the 200 sma may actually happen too.
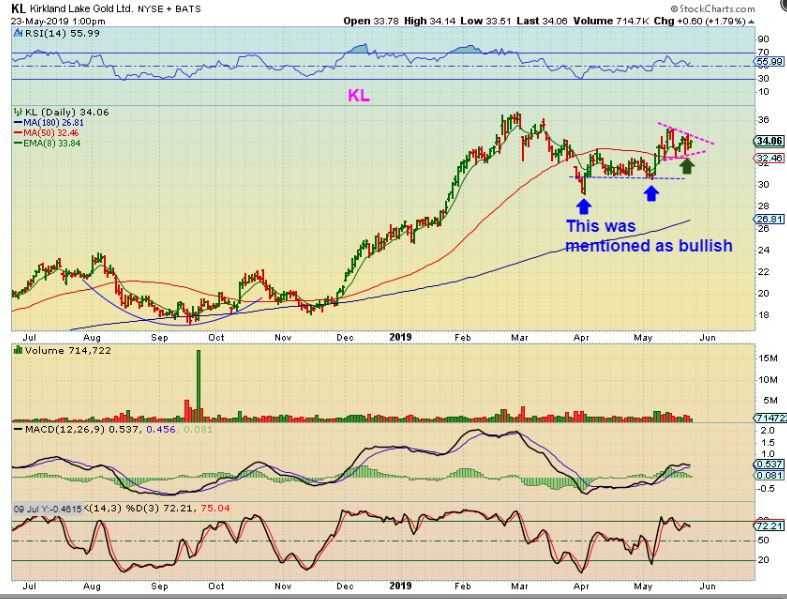
KL – I have liked KL , I mentioned it NOT breaking down with Gold into the FED MTG, so it was a buy then, and may be a buy now at the 50sma. It seems like a leader ( Bottomed before Gold).
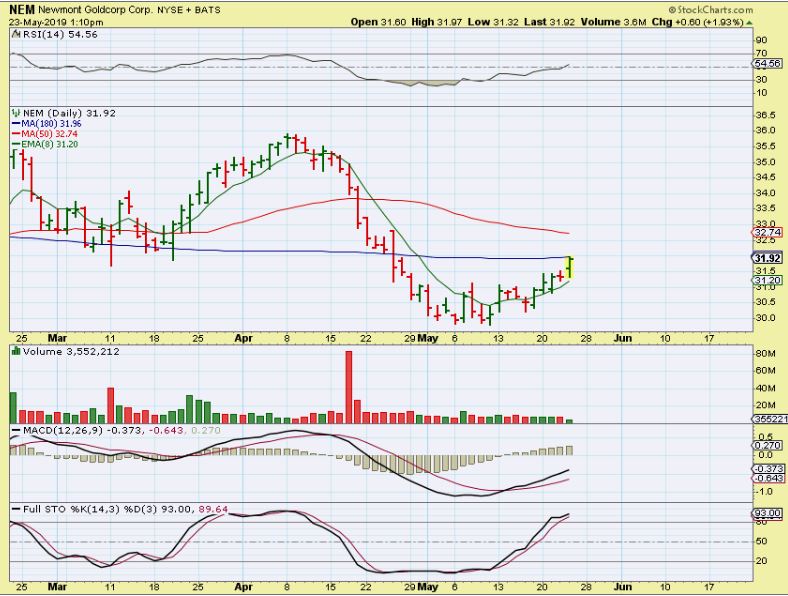
NEM MAY 17 -I pointed this out as a bullish NEM, possibly ready to Pop.
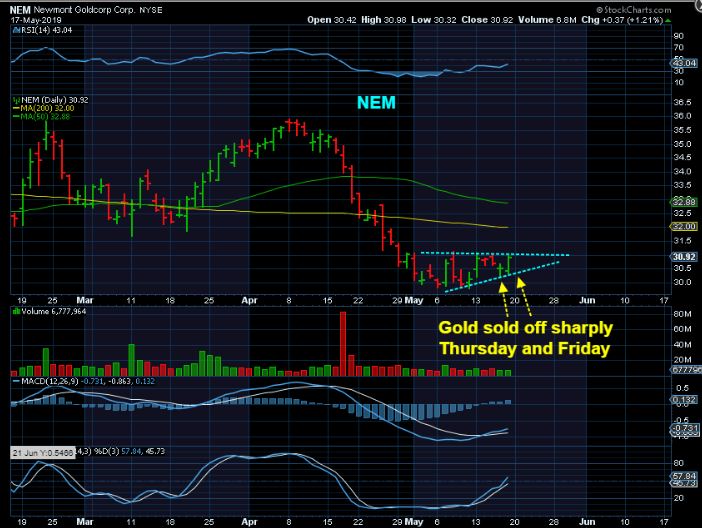
NEM – This is actually where it closed Friday too, at $31.92 . It seems to be bottoming.
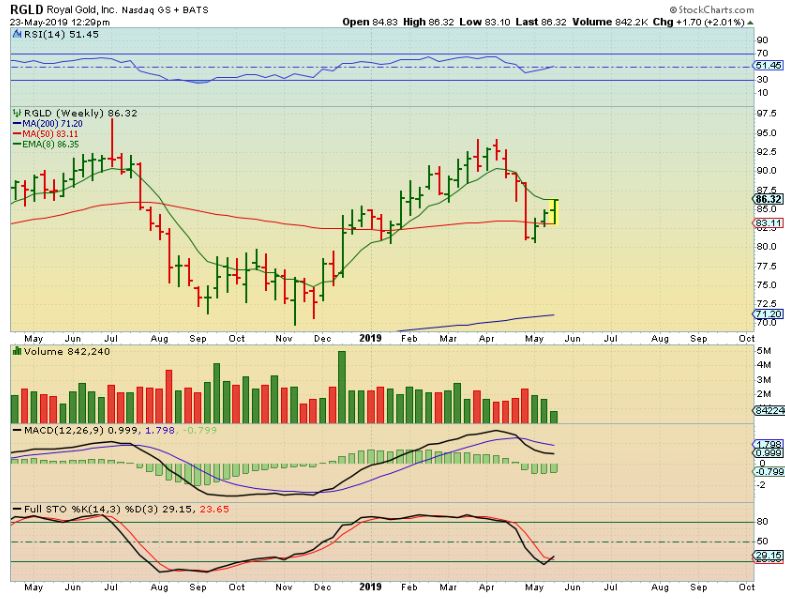
RGLD WEEKLY – Look at RGLDs weekly chart. It bottomed with the FOMC Meeting, broke above the 50 week MA, and is pushing on the 10 week ma. RGLD looks like a leader too.
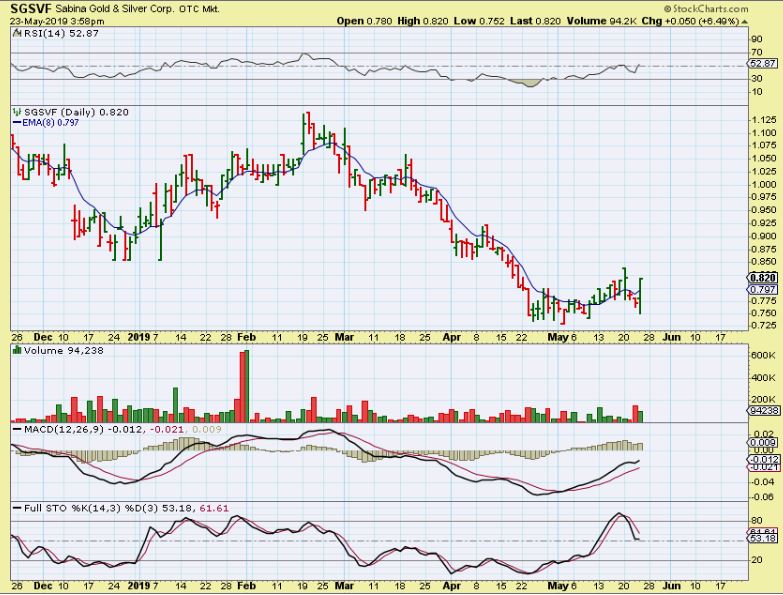
SGSVF – This may be bottoming. It closed lower Friday, so put it on a watch list and see if these lows hold up.
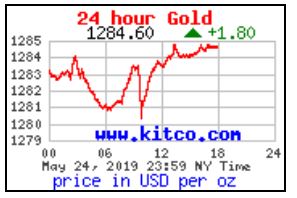
Even though GOLDS lows from May 2 may be in place, Gold is choppy, and this was Gold on Friday alone! The day after Fed Minutes it took off higher, Friday it is all over the place, selling off & rocketing back. They are NOT making it easy to read the real intentions of Gold. .
It looks like Gold & GDX May 3 lows could be holding up, but some miners broke the lows ( GDXJ did too), so there are different ways to view this. Sit on the sidelines and wait for some trending moves to start. Start small and use stops. Start small and only buy Miners that look to be taking the lead, save some funds for Bigger positions later when we get less choppy trading. Pick a style that lets you sleep at night, and remember- 2016 was just as choppy as this and the rewards were staggering once the rally took hold.

