
APRIL 27th Weekend Wrap Up – Time To Rest Up
This weekend may be a bit more relaxing for those interested in the Precious Metals Sector, because as discussed in recent reports, some of the ideas presented here do still seem to be playing out. I will discuss how to take advantage of current set up, without losing too much sleep. 🙂
.
SPX WEEKLY – The SPX is at the highs, and of course this looks very bullish, but the best way to play this is still with a tight stop. SPX has been climbing the 10 daily sma, a stop under the 13 sma would keep you in the trade , as long as it remained bullish. I think this may break out to a BULL TRAP, and quickly pull back. Let me show you why…

SPX DAILY – This is an FOMC Meeting week, and we are already on day 34, due for a drop into a dcl. I think that the Fed Mtg could trigger the pull back, but we may break to new highs first to really draw in the Bulls afraid of missing a strong run higher.

SOX WEEKLY – When the SOX got to prior highs, it stalled & dipped for 2 weeks before breaking out. See the Blue arrow. Now it also has a Weekly DOJI in place, so the SOX looks ready to pull back on FED WEEK too.

TRAN WEEKLY – The Tran was bullish a few weeks ago, as it broke out above that down trend line, but now it also has a weekly Doji Candle too. The Tran looks like it may be ready to pull back on the FED WEEK too.

IWM WEEKLY – The Russell 2000 actually looks Bullish. So we have a bit of a mixed market.

WTIC DAILY – Oil SLOWLY started to sell off Wed after the inventory report, and dipped a bit more of Thursday. Friday Oil really dropped (over 3% at one point). The volume surged too, so this is a cautionary note…

WTIC WEEKLY – Oil has a weekly Doji, after dropping from the highs Thursday & Friday . This can drop further, watch the weekly 10 ma.

USD DAILY – After breaking out to new high, the USD stalled . We see a DOJI candle on the daily chart.

USD WEEKLY – I drew a line of resistance overhead. We are in a FED WEEK, so the F.O.M.C. Meeting Wednesday could top the USD. Wouldn’t that help Gold?

.
PRECIOUS METALS
.
GOLD – Just over a week ago I used this chart & discussed that GOLD broke down from my triangle. It could then back test that 200sma as it drops further to a dcl (ICL?)…

GOLD – Gold closed above the 10sma. This looks like day 3 of a DCL, and it may be the ICL. It becomes a buy with a stop under these lows.
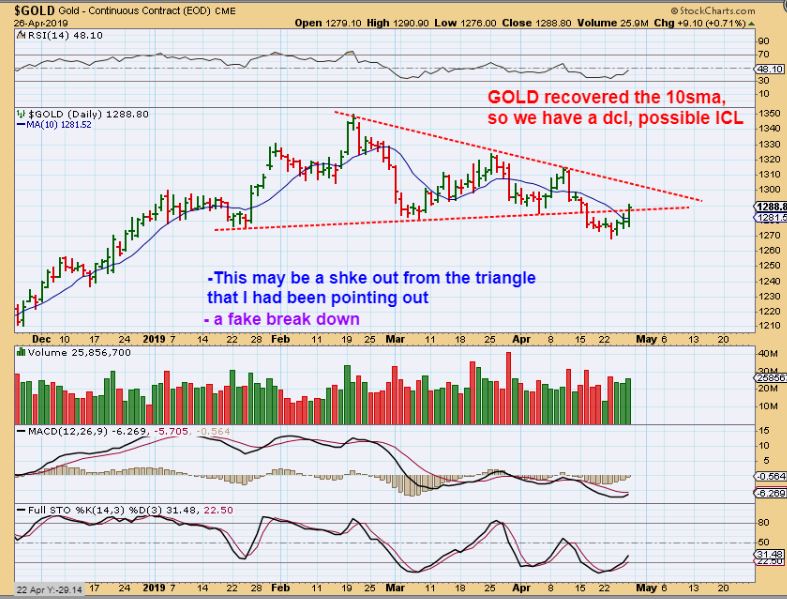
GOLD – Gold also looks like it is trying to complete a shake out, a false break down of that triangle.
1. Gold did close over the 10sma, this looks like a dcl (maybe a mild ICL, we need more time to know).
2. If the FED pushes gold right through the top of this triangle, that confirms an ICL to me. Raise stops.
SILVER – This is a bullish descending wedge, and a BUY if it breaks out higher (FOMC). I have already been buying Silver Stocks, because of this risk / reward. Some people HATE buying & getting stopped out, but I don’t mind taking a chance with the Risk Reward set up this good. A break higher is a BUY in technical analysis, so technical buyers may pile in when it breaks ( if it breaks) and it could gain traction.

.
MY FAVORITE CHART:
.
SILVER WEEKLY – I have pointed out this wedge on support repeatedly, and it still has Not broken down, even as Miners sold off day after day after day. That seems very Bullish too. In fact, Silver is now a weekly reversal candle under oversold conditions. This looks VERY VERY Bullish. A break higher on the week of F.O.M.C. Meeting is certainly possible.

.
GDX DAILY – GDX is being tricky. It did NOT fill that Gap, it did NOT tag the 200sma, but that may just fool buyers into waiting for a gap fill, and it could then leave many behind. GDX also did not confirm a swing low yet, by closing over the 10sma, but GOLD & GDXJ did, so this should be day 2 after a DCL. I feel the set up is very bullish, and I added to Miners Friday, but you may ask, ” Am I worried about GDX not yet closing over the 10sma, with the FED MTG ahead?”…

.
GDX WEEKLY – Look at GDX WEEKLY. That is a shake out / reversal candle. It lost the trend line of the up channel and it lost the 200 weekly ma early this week, but then recovered. This makes me a whole lot less worried. This is quite bullish.

GDX WEEKLY – AND REMEMBER THIS? 🙂 I have been hoping for this set up for a while now. This would almost be too perfect to be true, right?

GDX WEEKLY #1 – Now with a weekly reversal candle in place on the 200 week ma, we have Exactly what I have been looking for & hoping for. It slightly broke support as I have pointed out in the past ( 200 weekly ma). It almost seems too easy, right? This is a perfect set up, too good to be true . I will now point out one short term bearish thought, though I am not overly concerned …

GDX WEEKLY #2 – Look at the weekly stochastics compared to prior lows. It looks like we need another daily cycle to roll over & get us to a deeper oversold condition. At this point in time, I am going to ignore that stochastics, and view this price set up as at least a short term perfect buy, possible ICL.

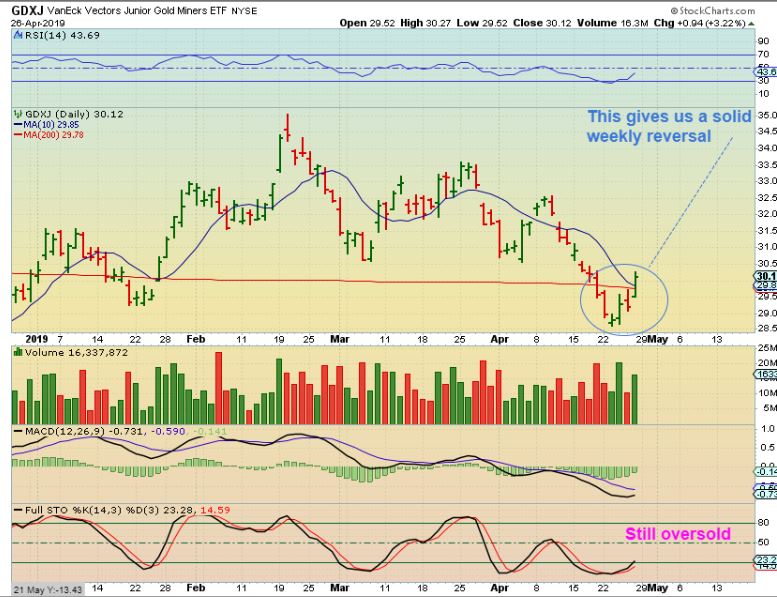
GDXJ DAILY – This strong move Wednesday & Friday gave us a nice reversal candle on the weekly chart. GDXJ closed above the 200 sma and the 10 sma ( usually confirmation of a dcl, possible shake out ans ICL).
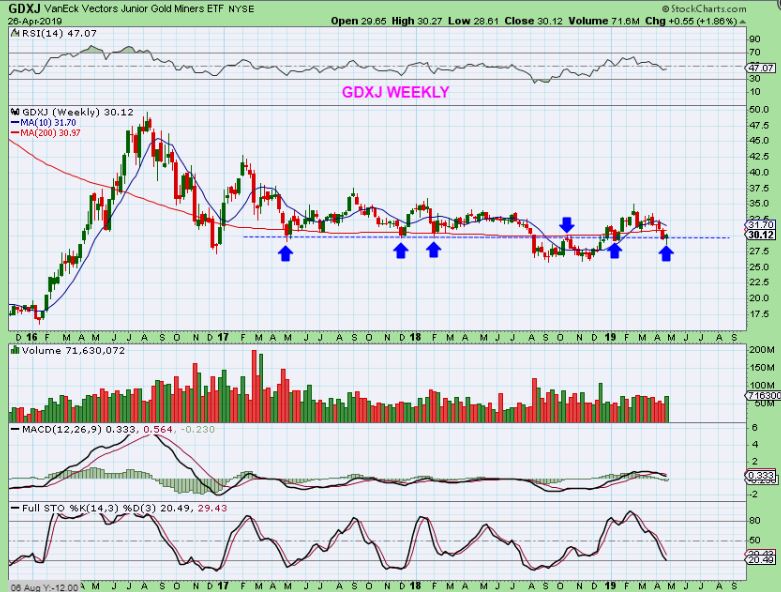
GDXJ WEEKLY – A Bullish weekly reversal candle that broke support & recovered is here too, and this stochastics has reached oversold.
GDX E.W. + Cycle Counts – I like to ‘guess’ at how things could play out in a logical manner ( I say Guess, because I am no Elliot Wave expert). An ICL would make sense to me as part of a 1-2-3-4-5 of ‘1’, with our next ICL possibly forming near October or November. The a-b-c would be the final 2 daily cycles. It allows for a back test of an upcoming break out.
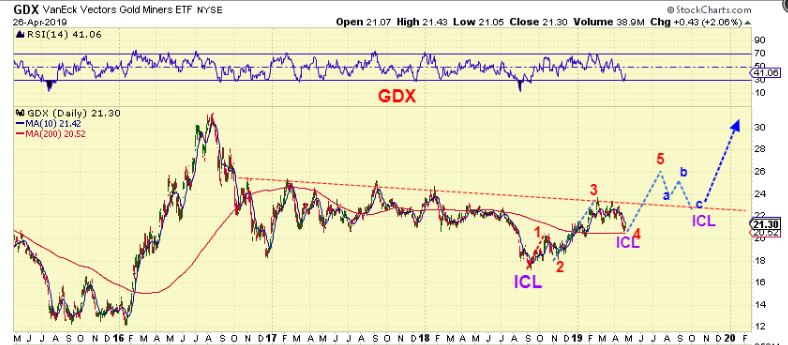
Or keep it simple, and draw it like I did before.
.
Summary: To be perfectly honest, I cannot PROMISE that this is a mild ICL, we need more time to see if other requirements confirm that, but last week was a Bullish reversal in Precious Metals. As of now, Gold did put in a swing low and closed above the 10sma. Silver is a solid Bull wedge on support, and GDXJ closed above the 200sma & 10sma ( DCL). GDX still needs to close above the 10sma, but GDXJ did so GDX likely will too. Fridays action in Miners was bullish. Right now at this cycle count ( into the 30’s) and with these reversals, I see some nice Bullish set ups in Miners, and this is a low risk entry area for many Miners. Friday saw Gold close above the 10sma , so it was a BUY with a stop.
I love the way things have slowly but bullishly been setting up in the precious metals sector. Many, if not all of us, have been holding at least some Miners recently, along with setting aside some cash, just waiting for that Fat Pitch- The one to take a swing at. With what looks to be a dcl, and maybe even an ICL, That fat pitch could be here. Below I am going to just add some ‘Miners’ to the report. Some readers have told me that when they look at charts of some Miners, the daily charts have been choppy and it is unclear to them whether they are currently set up as bullish or not. The charts below may help to give a better perspective. We have low risk entries, ESPECIALLY if we get a small day or 2 pull back as we approach the FOMC MTG. The upside potential out weighs the down side risk.
.
Enjoy your weekend, and rest up- Next week could be active with the F.O.M.C. Meeting Mid week.
.
~ALEX
.
AG – AG closed under the 200sma and I was stopped out. I said that I would buy it back if it recovered, and it did on Thursday. Friday it popped even further, closing above the down trend line, so AG looks bullish again. I posted this an hr into trading in the live discussion area below the report.

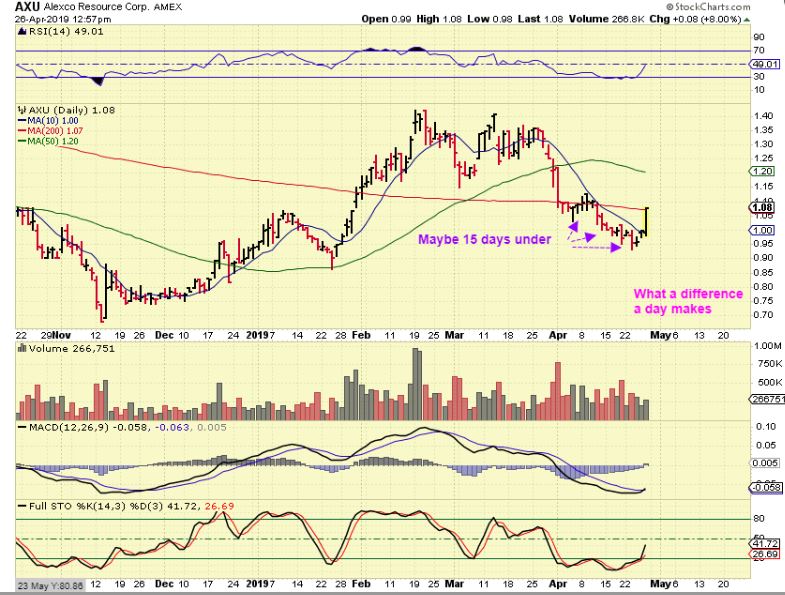
AXU DAILY – I posted this midday Friday as AXU bullishly pushed over the 10sma and up against the 200sma. Is this now too extended to buy?
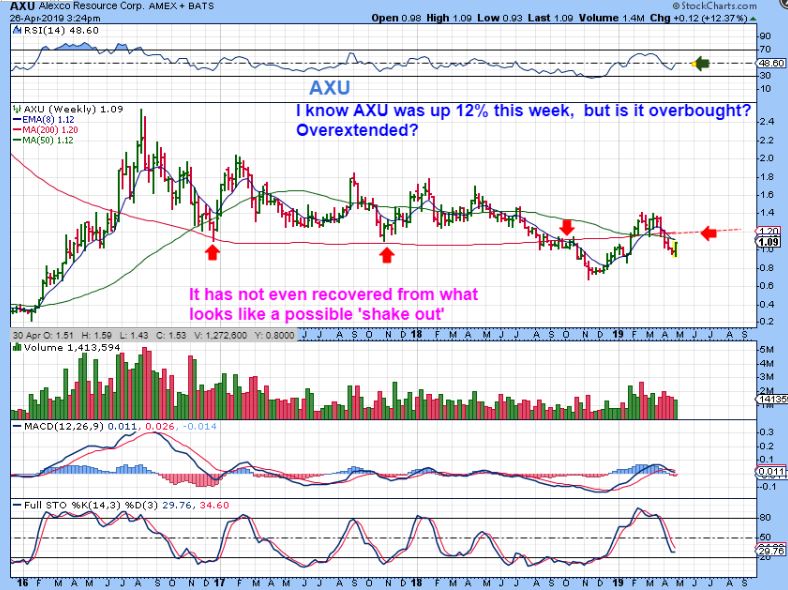
AXU WEEKLY – Now we look at the weekly and though it was up 12% for the week, it is still under the 200 weekly ma. One minor concern is that it never reached oversold on the weekly stochastics. That isn’t necessary, but I love to see a stock pop up from deeply oversold conditions. If this pushed above the 50 & 200 weekly ma next week, that will be a better looking chart actually. Last week was a nice reversal.
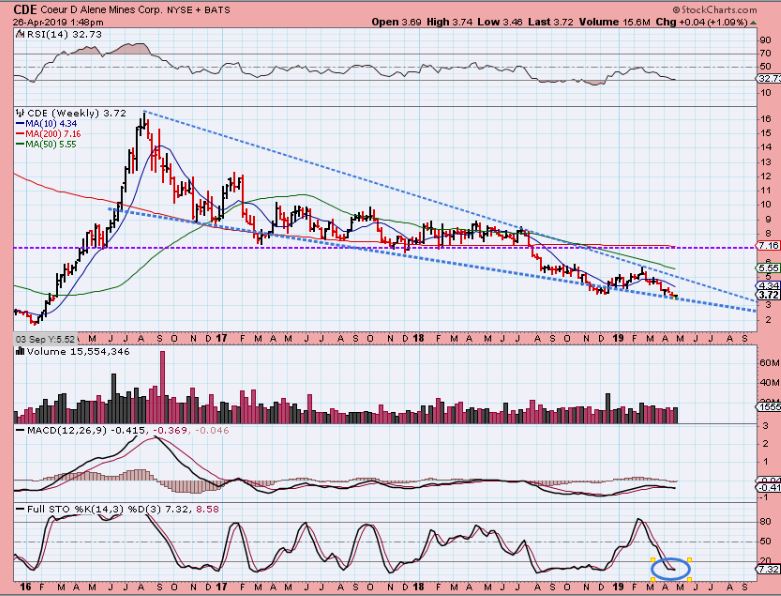
CDE – Who wants to buy the very bottom? CDE is pretty much not only at 2019 lows, but it is at 3 year lows. I have people say to me, “I don’t know what to buy, I don’t want to chase these moves up 5-10%.” Well, CDE is up 2% off of 3 year lows. My thinking is this: WHEN SILVER FINALLY takes off running, I have a very hard time believing that CDE wont take off too. Look at CDE in 2016. Someday we may look back and say, “Why didn’t I buy CDE under $4? Now it’s $12 (or $16!) !“
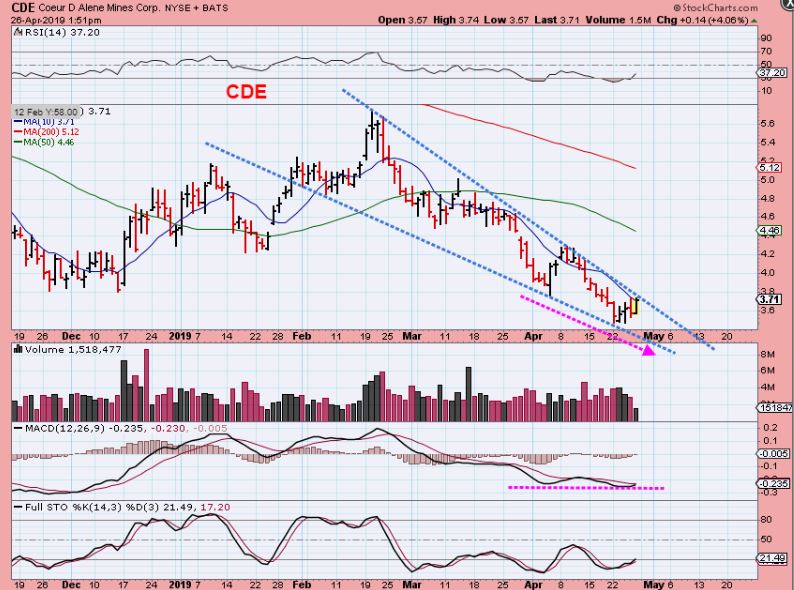
CDE – CDE has daily divergence and is forming a Descending Bullish Wedge. If it breaks out this week, I would call it a buy.
GFI DAILY – When I looked at GFI, I noticed that it won’t even sell off enough to come close to the 200sma. It now looks ready to break out from a downtrend . So…

GFI WEEKLY – I took a look at the weekly chart and can hardly tell that we have been in a 2 month sell off for GDXJ. It has moved sideways & found support at the weekly 200 ma. GFI is forming a weekly bull flag consolidation. It isn’t weekly oversold, but a break out is a buy.

GPL – Mini-shake out? This could become a buy next week if silver takes off. It is over the 10sma, so really you can buy it here. You can also buy on a break over the magenta trend line, or you can buy a move over the 50sma, all bullish signs.
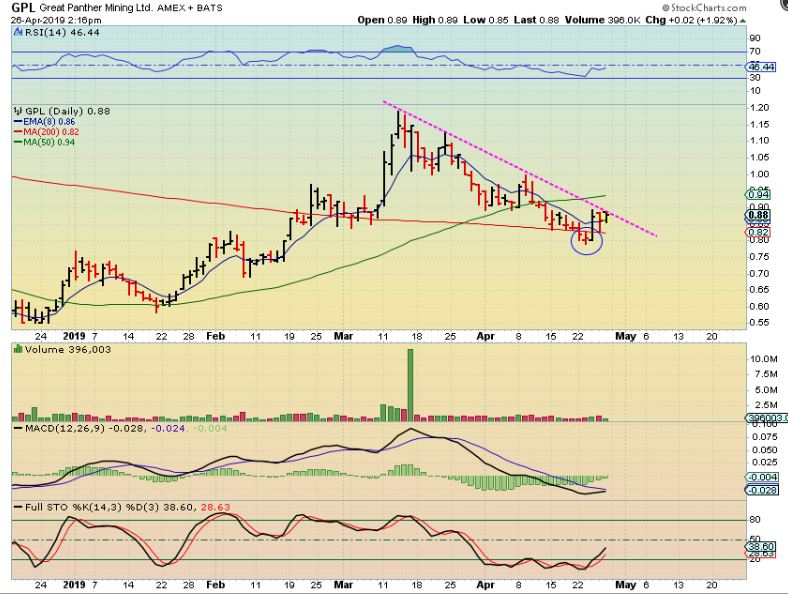
GPL Again – I did notice a pattern here, so we can see if this pattern is broken next week.
1. Each Big up day toward the down trend line is followed by a candle that pauses at that line
2. And then it drops.
3. Look for a break out to change this pattern, it is very oversold.

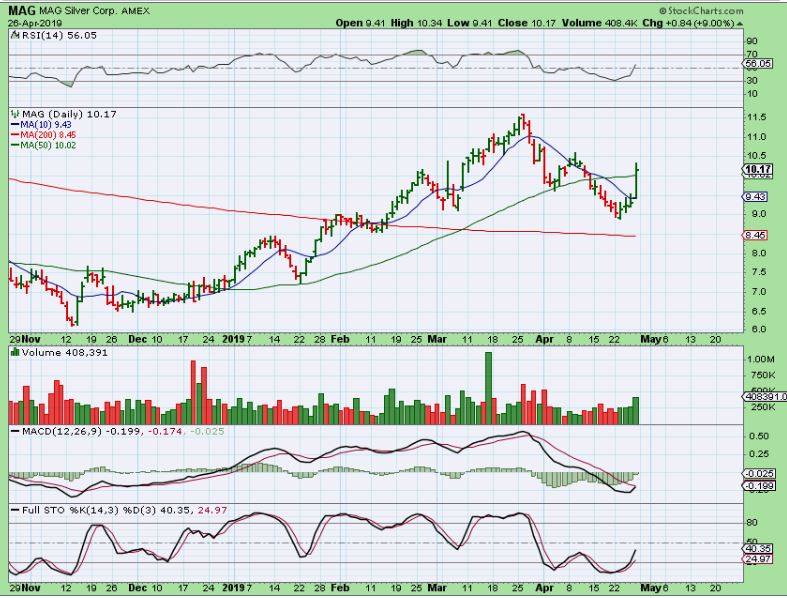
MAG – Mag had a strong move Friday, pushing up over 10% at one point, breaking the down trend, and closing above the 50sma. That has to be viewed as Bullish, right?
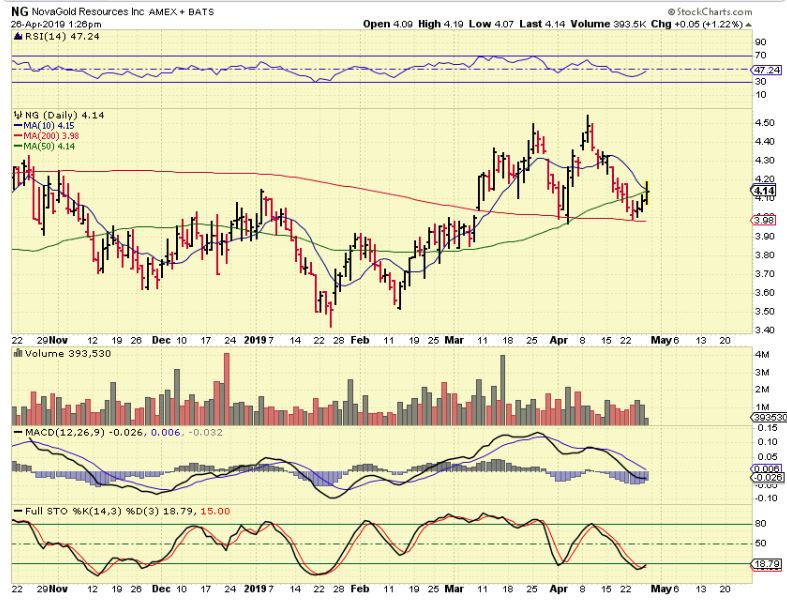
NG – Nova Gold bounced off of the 200sma twice during the 2 month sell off in GDX / GDXJ. It has not broken down and is now oversold, so this could be showing resilience at a time that many Miners are showing weakness.
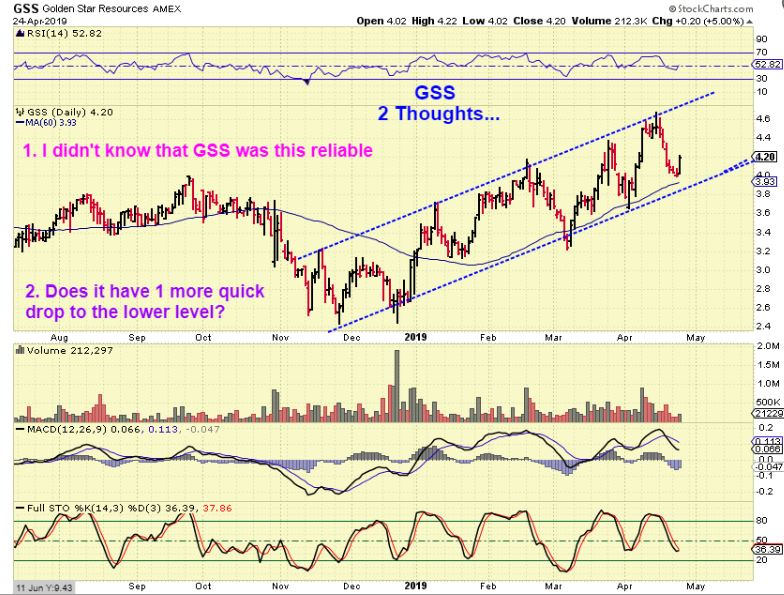
GSS – I posted this chart of GSS the other day to show another stock NOT selling off to new lows during this sell off. It closed over the 10sma at $4.27 Friday, so it remains healthy and in an uptrend too.
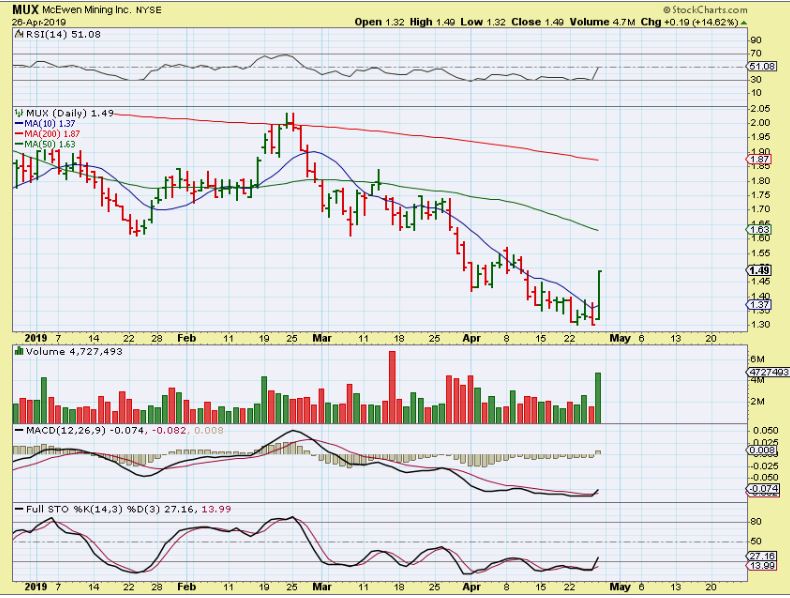
MUX – And even the stock most hated by my chartfreak readers!! The well know ‘dog’ MUX was up 14.6% and closed out the day at those highs. Boom! Volume came in strong (maybe a bit of short cover too?). So when the sector starts moving, this shows you that even some of the real laggers can get some legs. Let THIS SURPRISE MOVE be in your head when you look at CDE near the lows and wonder if it can get any buying 🙂
GOLD DIVERGENCE – It was mentioned to me in an email that we are not seeing divergence at some of these lows. I was asked if that was important to me. My reply was that I DO often look for divergence as a sign of strength, or a sign that the selling has lost momentum, but I’m posting this chart to show that you an example of seeing a lower priced low with lower lows in the RSI & MACD and yet we can still get a move higher out of the lows.
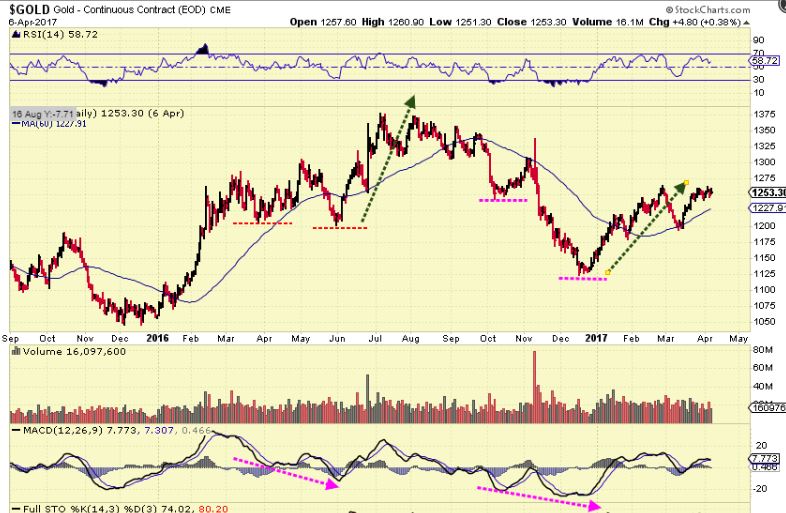
I just figured that I would share this chart in case others had the same question.
GOLDS COT – It is not as low as last August, but that was an EXTREME RELENTLESS Sell off low. This is low enough and Does match prior ICLS.


