April 25th – Staying In Focus
Today I really want to Focus on the precious metals, so after a very brief review of a few other sectors, we’ll get right to it…
.
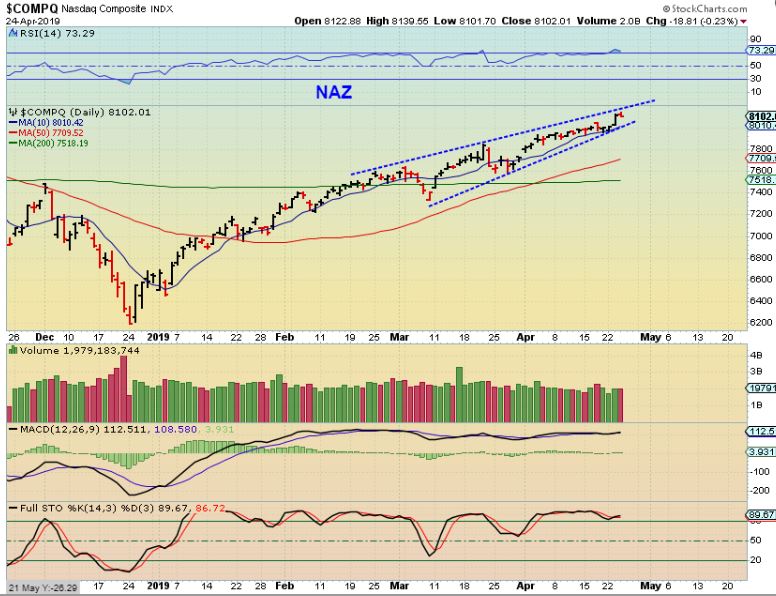
NASDAQ – Nothing changed with the General Markets since yesterdays report.
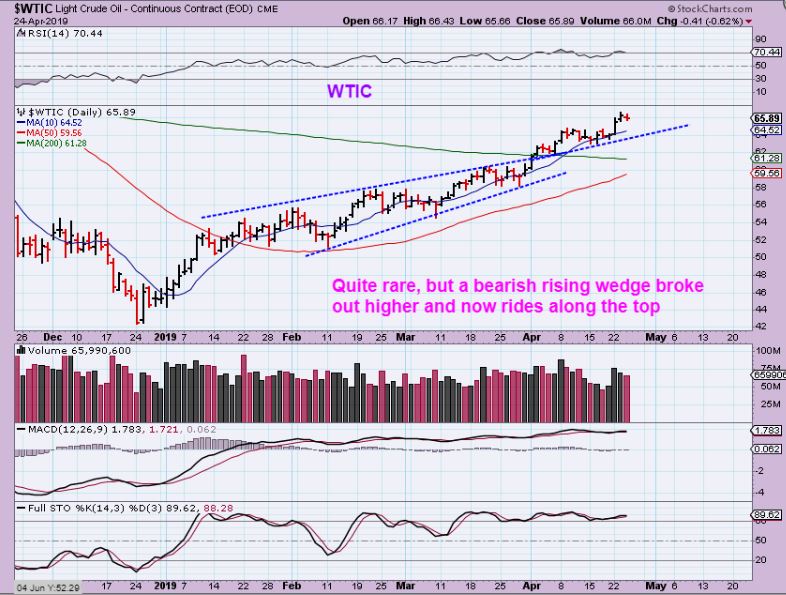
WTIC – Nothing changed here either, but what I did want to show is that on RARE Occasions, a bearish looking rising wedge can break out higher. When it does, often an upward channel forms. Oil looked like a milder form of a rising wedge, and it broke out right at the 200 sma. That was bullish since that was Double resistance.
.
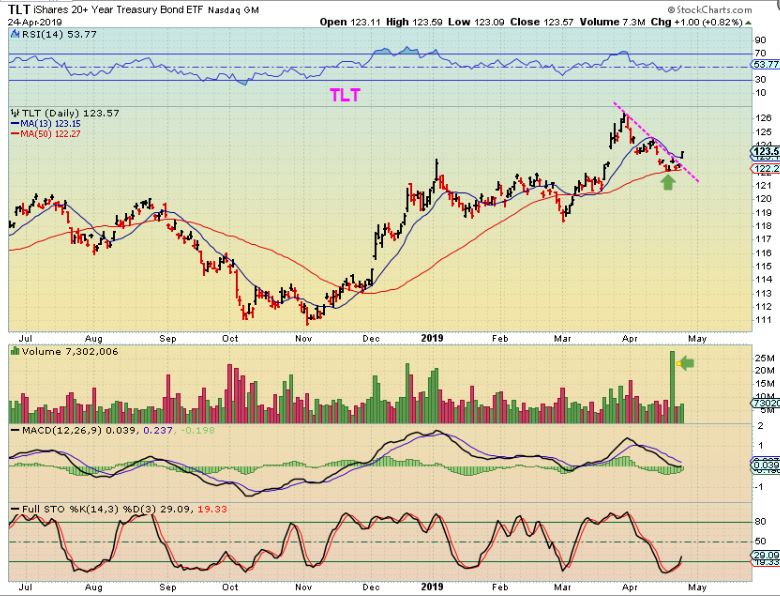
One of my Readers really likes the TLT Set up, and feels that Gold or Miners follows TLT. I see ‘similarities’, but Currently I do not see TLT dropping like Gold or Miners ( They just broke down to make new recent lows), but TLT does look like a buy, so I’ll post a chart, and we can see if Gold follows or not now …
TLT – TLT is a buy after reversing off of the 50sma and breaking a down trend. This is a slow gainer ( $111 to a peak of $125, now at $122 is roughly 10%) and it hasn’t been straight up by any means, but it has been in an uptrend and does look ready to go again. Will Gold follow is the question.
.
LET’S DISCUSS PRECIOUS METALS
.
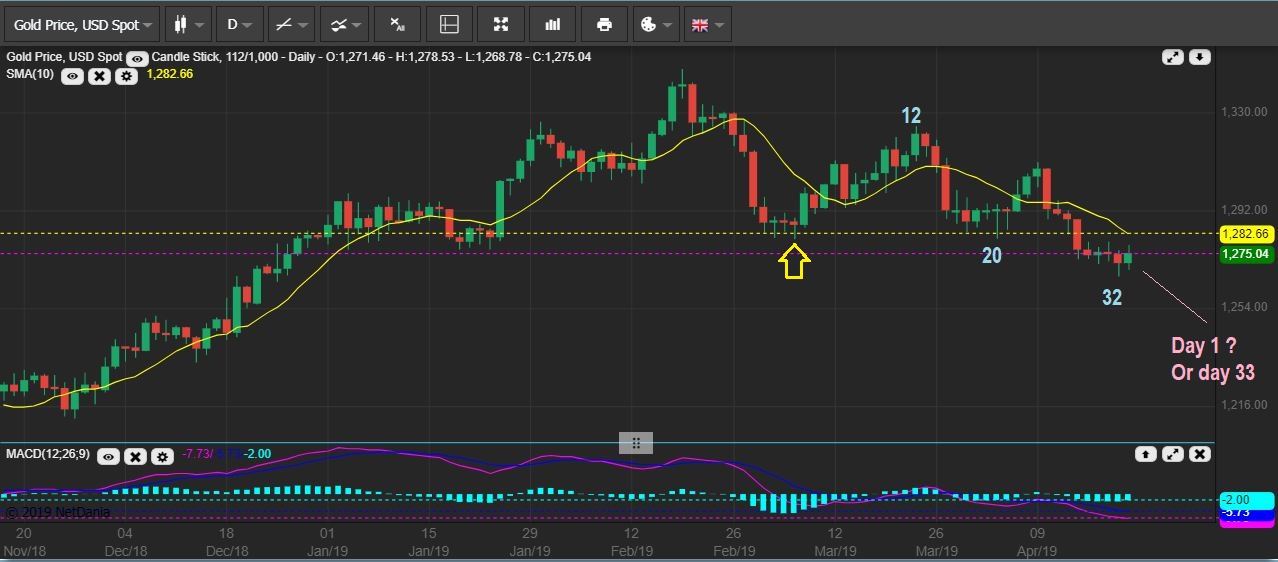
GOLD #1 – Gold did move higher Wednesday and we see a swing low (UNCONFIRMED) in place. This does not look like a typical ICL sell off, but it is day 32 and a DCL ( or ICL) can form here. Is this day 1 or day 33? We will now wait to see if a break of the 10sma happens, and even that can take time. Why?…
.
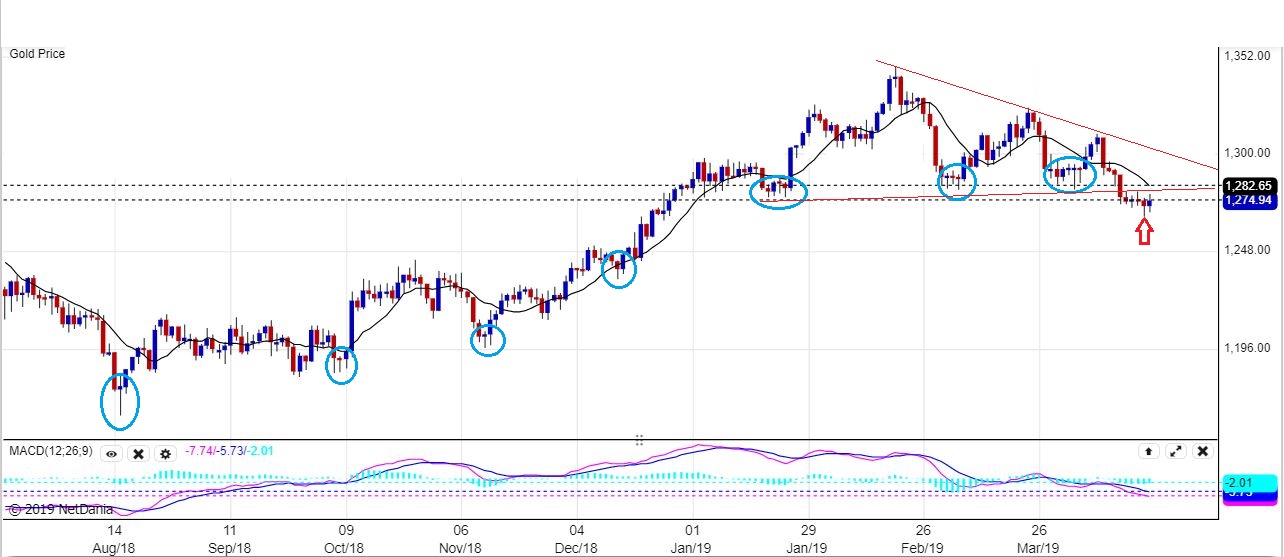
GOLD #2 – Gold had a reversal candle on Tuesday, and I am pointing out other reversal candles so you can see what happened the next day, and 3 days later, and even 4 days later. As you can see, sometimes price just went sideways for days in those blue circles, so we may see that this week too.
.
GOLD #3 – These 2 boxes are equal in size. I posted this to show you that the distance of ‘time’ from the last 2017 ICL to our August 2018 ICL is the blue box. That ‘time’ is equal to the time from the August 2018 ICL to now. So we are in the timing for an ICL, it just doesn’t look like nearly as steep of a drop. I have drawn 2 possibilities that must be considered as still possible ( The purple & the Green line). Please read the chart and then my thoughts below it …
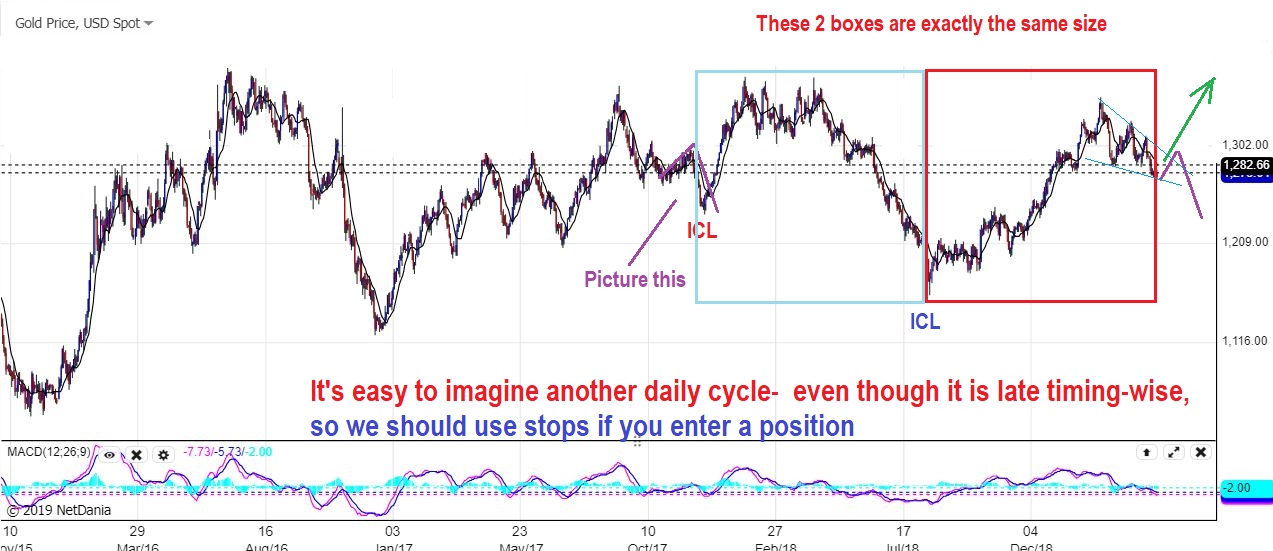
1. Notice that the Blue box move out of the ICL was absolutely straight up for 2 months, so the rest of the ‘time’ was choppy and then an extended selling off. That caused a deeper sell off.
2. Looking at the Red box , the move was choppy at first and formed a base in the first 3 or 4 months. We then saw Gold ramp up higher later and maybe there just isn’t as much time left to sell off deeply?
3. Only time can tell us how this will play out from here, you can see that moves out of an ICL can vary. We do have a plan and a back up plan, and that will be discussed further as we move forward too. Especially in the weekend report now that we are this far into the selling time period.
Finally , let me show you this…
.
The Bullish view: I was looking at past ICL drops, Some are very deep, others are not. I noticed that length-wise, the current one is just slightly shorter than the ICL drop in 2017 (Yellow line), and then Gold ramped higher. That said, there is still a chance that this is all the selling we are going to get, so if our swing low progresses here, I want to be ready, but remain a bit cautious (Stops). This is a weekly chart.

.
SILVER #1– Silver has a bullish looking wedge forming. It continues to hold up at support of the base. In fact, Silver is actually pushing on the 10sma right now after putting in a reversal. Pay attention to Silver as we close out this week.
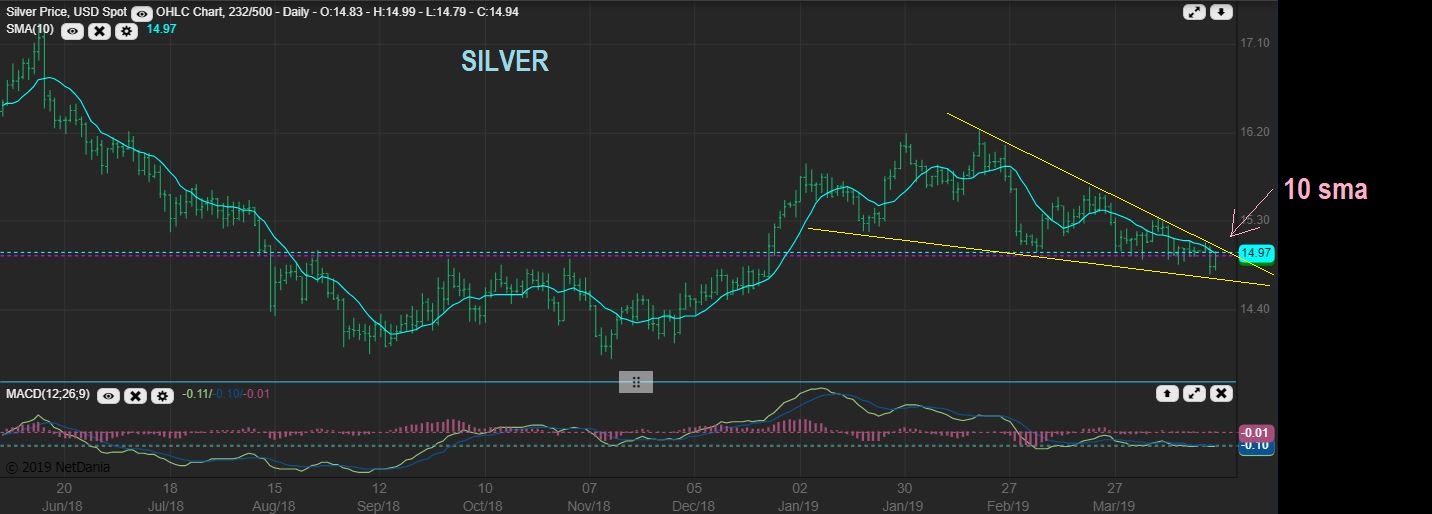
SILVER #2 – A break out is a buy in Technical analysis. IF the ICL is still ahead, it could come in the form of a back test , which could allow for a lower low. EVEN IF THAT HAPPENS, this is a bullish set up and Silver could really be running strong into the 2nd half of 2019.

.
GDXJ – I wrote this in the comments yesterday. I was joking around a little bit, but that doesn’t mean that it isn’t possible. Click to enlarge if it is too small to read. It discusses a Break down by GDXJ, and a stronger GDX to keep people guessing. So this is GDXJ breaking down…

.
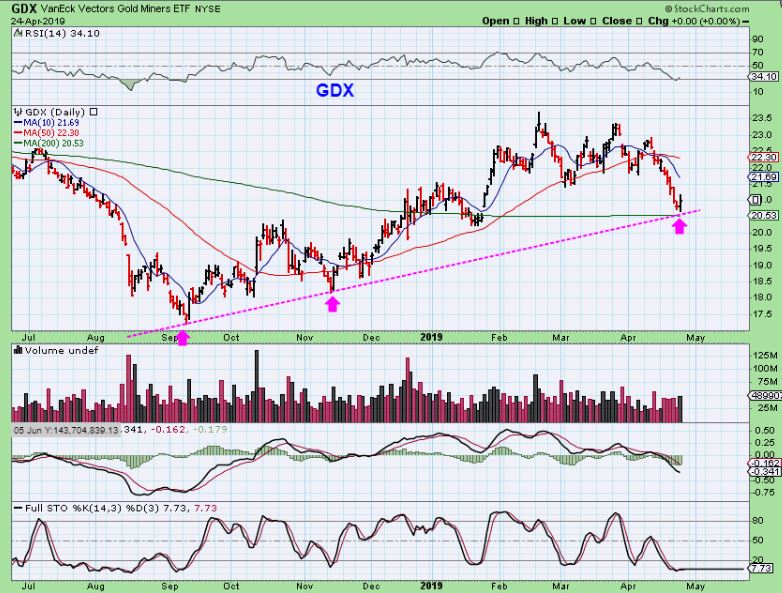
GDX – Notice that GDX never tagged the 200sma and never completely filled that gap, but it did reverse higher Wednesday. In Cycle work, you really want to see a trend line break for an ICL to be confirmed, so this appears to have come up short of that. On the other hand …
GDXJ – GDXJ broke the 200sma and closed under it for a few days. GDXJ looks like it could have been considered an ICL type of a sell off.

GDX – If we expect a trend line break, we may have to expect another daily cycle if this swing low confirms itself. I was also thinking that this daily cycle may just continue lower for a couple more days ( let’s say a day 40 low as shown). I will draw a close up…
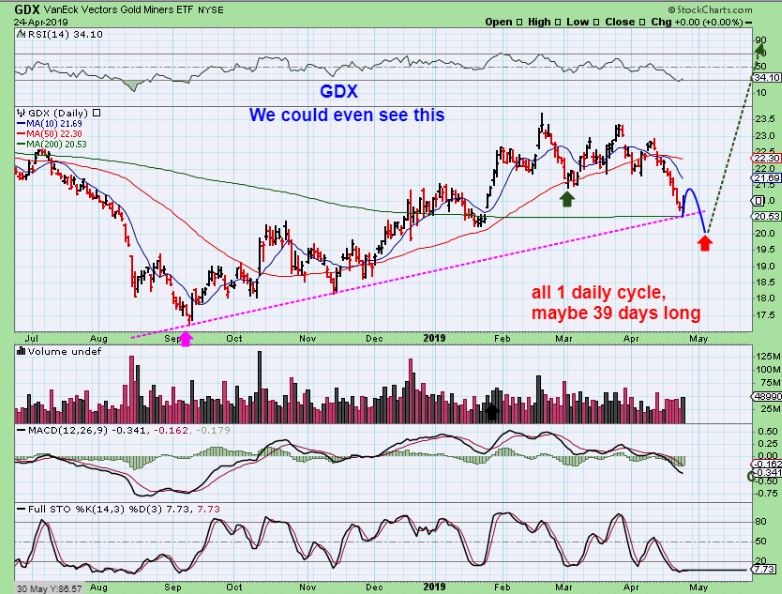
GDX – This is not out of the question and it would satisfy more of the identifying marks of an typical ICL. You can see why anyone buying Wednesdays reversal might get stopped out. They wouldn’t know if this will drop for a day or a week or a month.

.
So that is where we are with the Precious Metals sell off. The reversal on Wednesday would need to have follow through above the 10 sma to be considered a dcl or possible ICL. You could buy that with a stop under that swing low. In the past we have seen some of these reversals go sideways for a couple of days first, so we may need to wait and see how this plays out. The last chart (above) also shows that a small bounce & then a sharp drop is possible too, to shake out any buyers.
.
Let’s see what Thursday brings our way, enjoy your day of trading!
.
~ALEX
.
AG – I was stopped out of my AG position, and it has now closed under the 200 for 3 days, but it does look like it may recover soon, and that would be a shake out. This is one that I already determined that I will own on the next run, but I have not repurchased it yet.

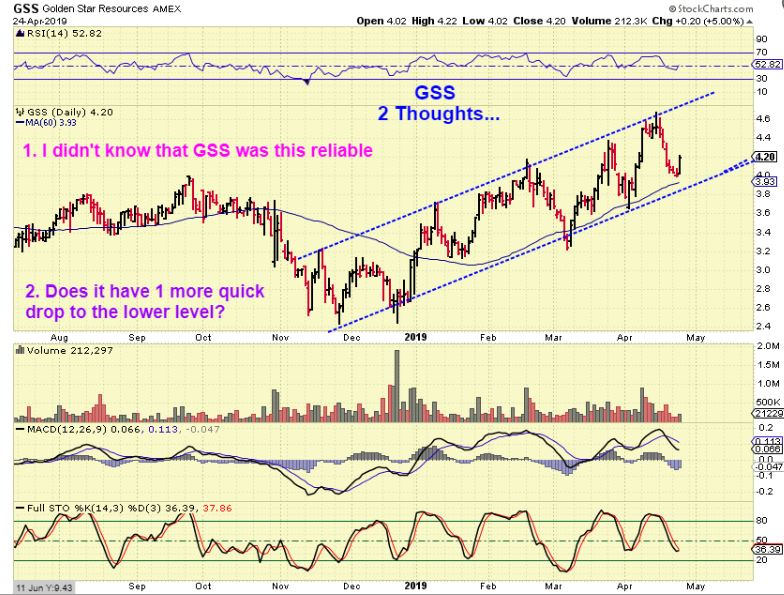
GSS – Though this has been a rather rough ride, it is in an uptrending channel. This sell off stopped just a little short of the lower trend line, so if we see a little more selling in Miners, GSS may become a buy down there. Actually, it could be bought here with a loose stop if you are one that just wants to own it, start a position, and can handle a little downside.
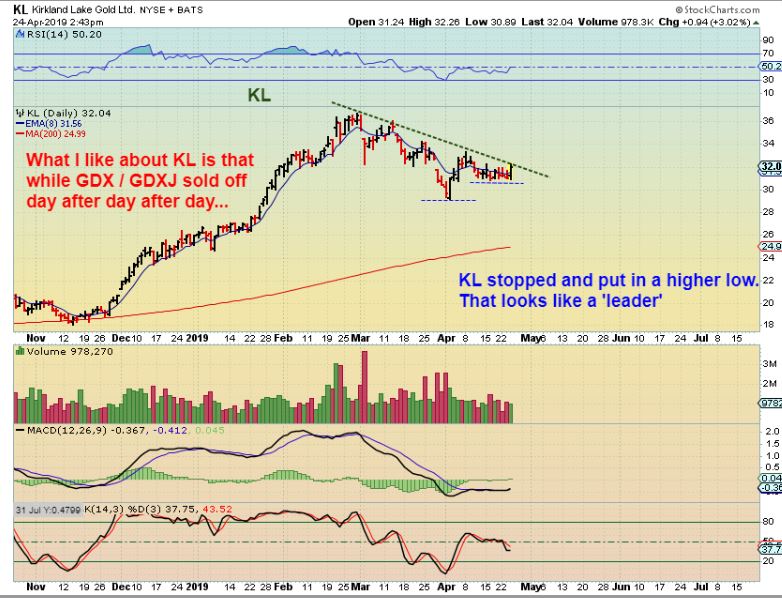
KL – One thing noticeable about KL is that we just saw about 9 days of straight selling in GDX & GDXJ, but KL did not sell off. I would have thought that under those conditions KL could have landed on the 200 sma, but now I am starting to think that the lows might be in for KL. I would go as far as to say that this has resisted recent selling, so a break of this down trend line could be bought with a stop.
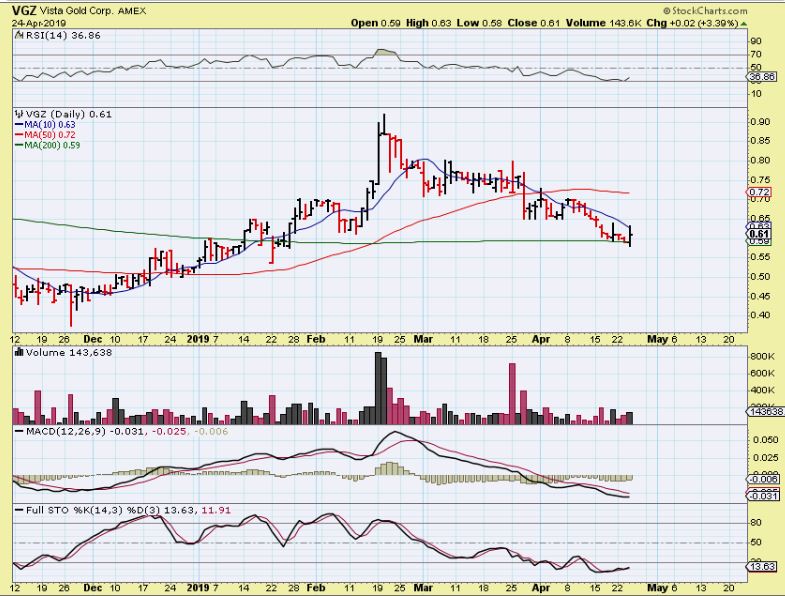
VGZ – Nice reversal at the 200 sma. If selling returns, this one could break lower, but so far it is noteworthy.
.
PARABOLIC IS HARD TO PREDICT
.’
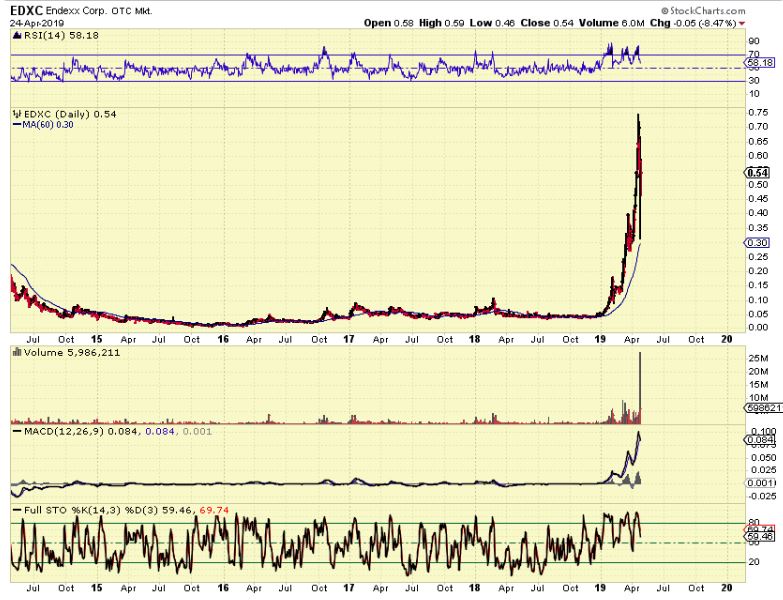
EDXC #1 – I have been asked by more than one person to ” Just give a guess at how this could play out“, so this is a guess that would allow for a longer consolidation and remain bullish with a temporary top in place, rather than a huge blow off top…
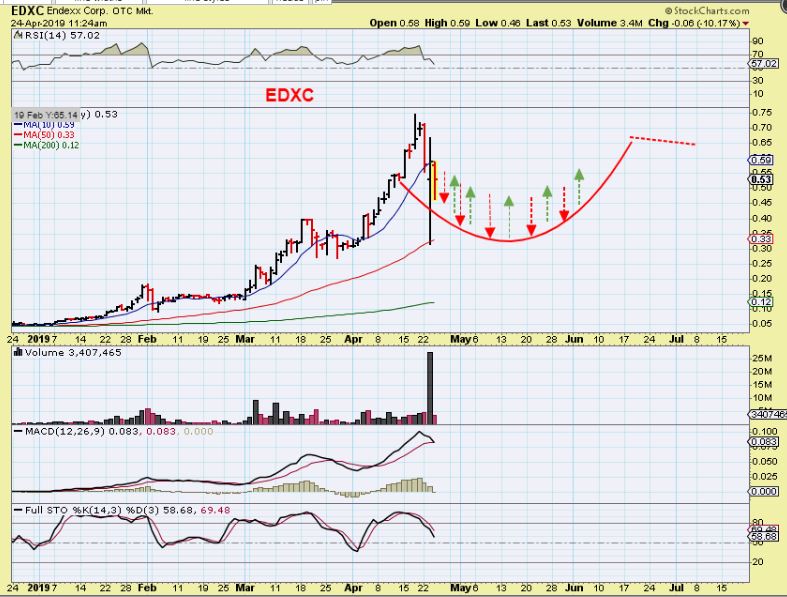
I HAD 1 PERSON SAY TO ME THAT EDXC DOESN’T LOOK STEEP ENOUGH TO THEM TO BE PARABOLIC YET.
.
EDXC #2 – So yes, this also could just rocket higher again and put in a large blow off top. However, is it really not steep enough to be parabolic yet? …

.
AGAIN: I HAD 1 PERSON SAY TO ME THAT EDXC DOESN’T LOOK STEEP ENOUGH TO BE PARABOLIC YET. I SAY TRY STEPPING BACK & TAKE ANOTHER LOOK 🙂 So yes, This may already be the parabolic top in place.