Tuesday April 23rd –
Even though only 1 day passed since the weekend report, we do have a lot to cover, so let’s get right into it…
QQQ – This looks like a Bullish continuation, but it could also be what is known as a ‘last engulfing’. Honestly, I was taught that these were more often than not Bearish. I was taught that they were an exhausting move where price gaps down, closes near the highs, and ends there, but…
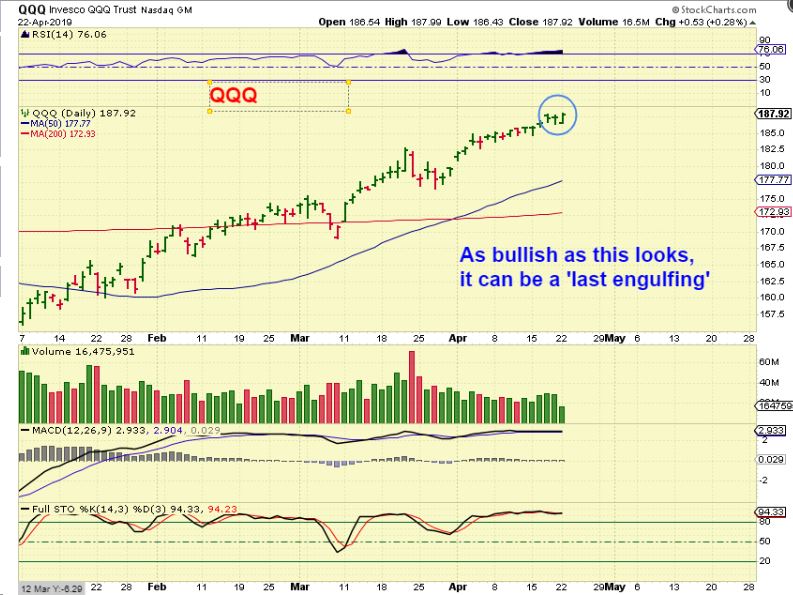
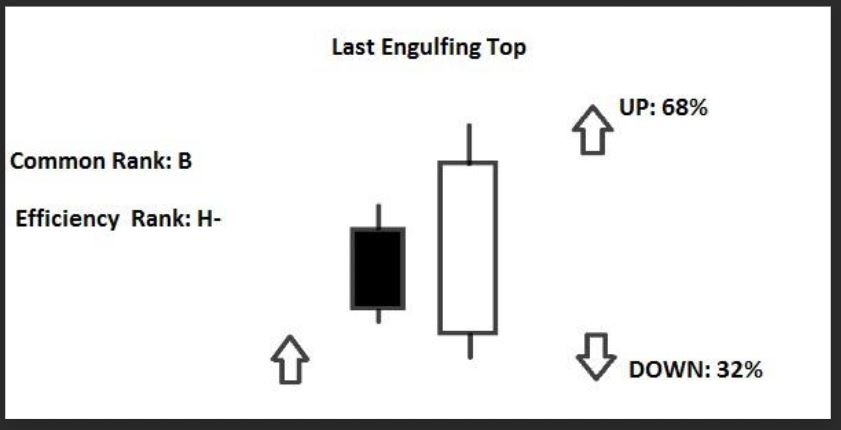
I decided to do some research on Last Engulfing Tops: Seems that they now lean toward a continuation higher 68%, UNLESS THEY FORM AFTER A LONG RUN HIGHER, then 32% of the time they drop. So where are we now?….
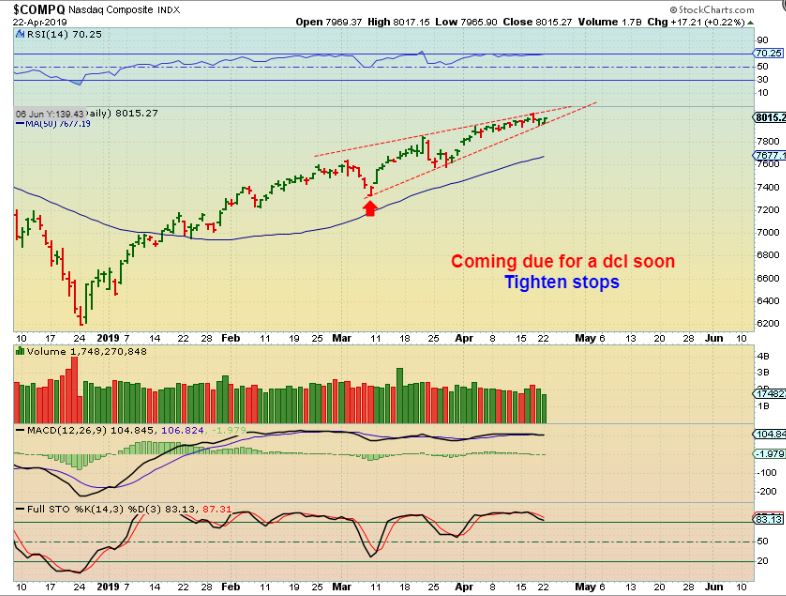
NAZDAQ – I’m just going to go back to what looks like a bearish rising wedge ( temporary bearish), plus we are getting later in the cycle count, and nearing all time highs. All of these can cause a reversal, so keep stops tight.
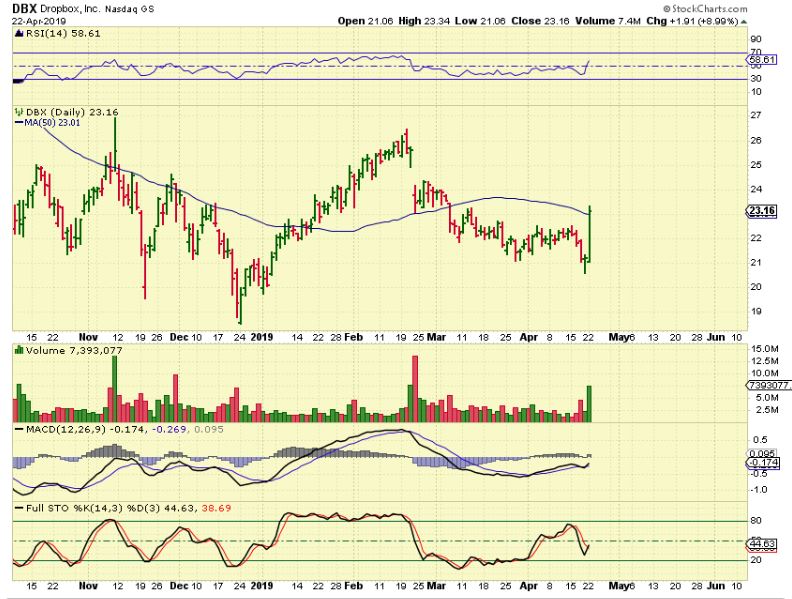
DBX– I did love some action in stocks today though. DROPBOX burst from the lows and closed above the 50sma. This is a bullish set up, and could get some follow through or bull flag. Earnings are due out in 2 weeks.
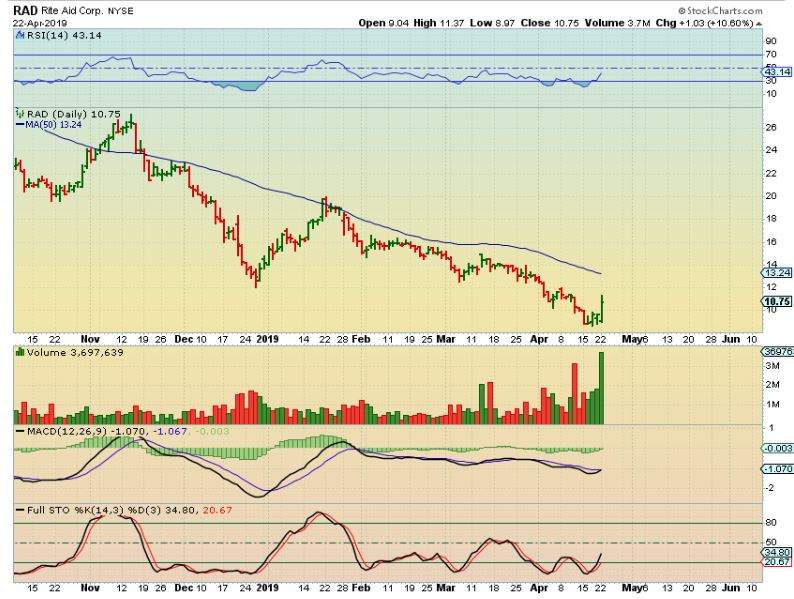
RAD – Look at the accumulating volume right at the lows for the past 4 days, and then the POP Monday. I don’t know if there will be great follow through or not, but a set up like this could be bought with a stop under recent lows. The prior 2 rallies seem to be equal length, and that happens often, so this may rally for a couple of weeks.
.
OIL
.
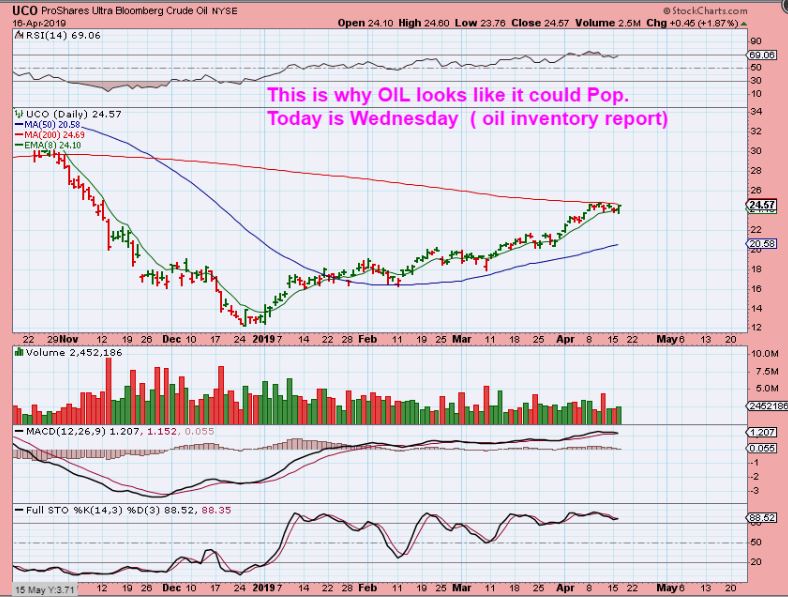
UCO LAST WEEK – I pointed this out last week, and said that I would expect a POP in Oil, with this bullish set up.
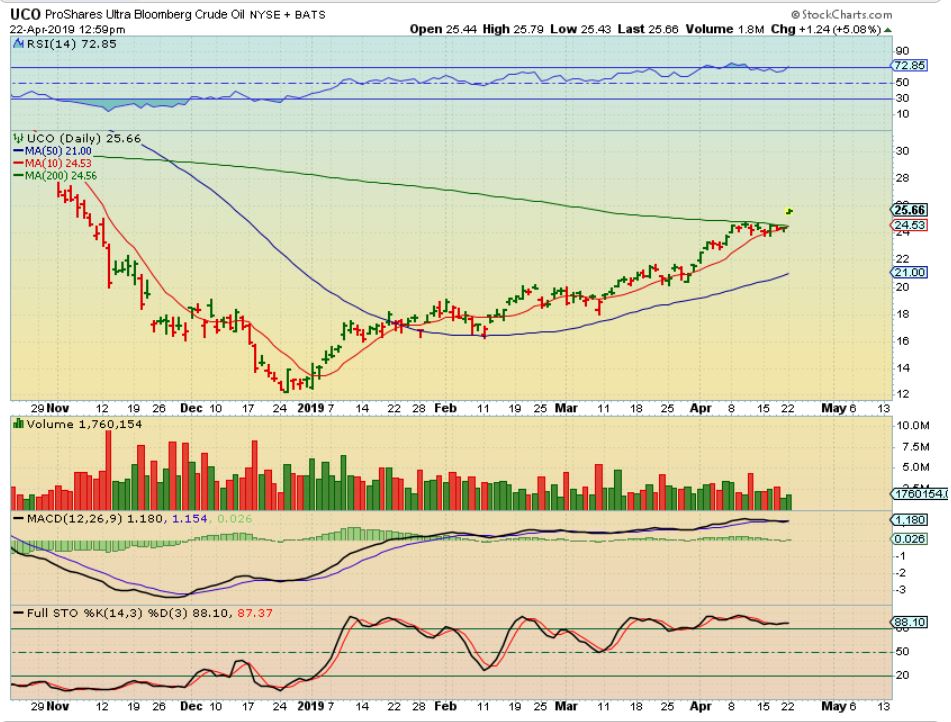
UCO – The POP came in, and with this sideways chop in Oil and XOP, XLE, OIH, we now have many bullish looking set ups in this sector. I will post some at the end of this report, and even if this Gap fills, Energy stocks may continue to move higher..
ALSO WTIC FROM THE WEEKEND REPORT – I mentioned that since Oil dropped straight down, I think that it could continue to run straight up.
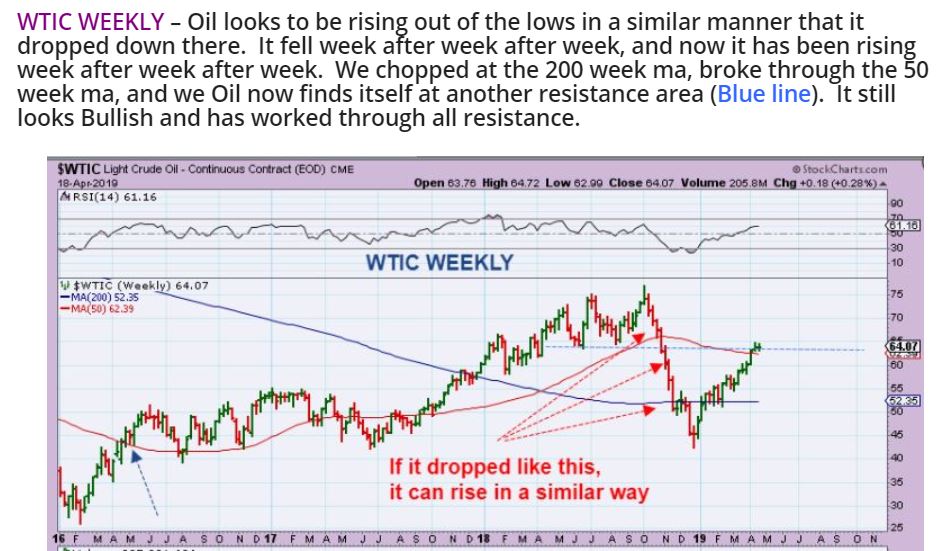
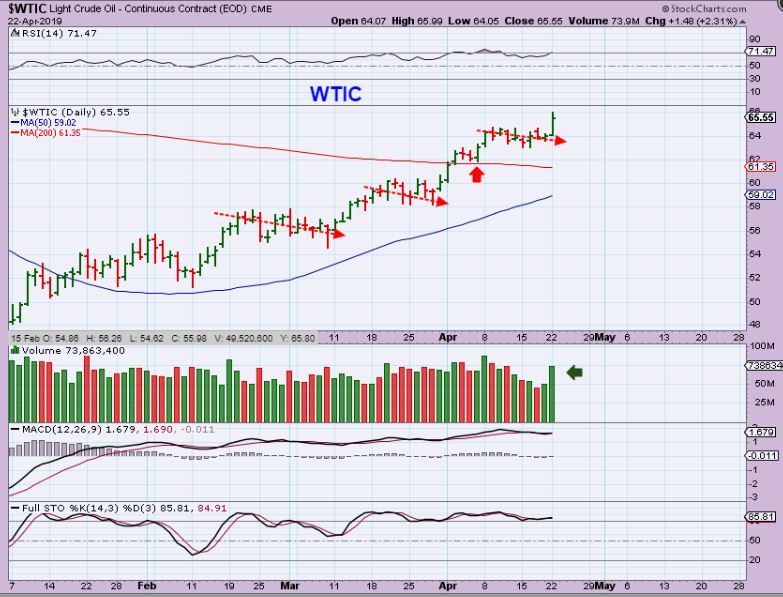
WTIC – OIL Popped 2.3% Monday. We have a pattern of shallow pull backs. It looks more like
– Sideways, Rally, Sideways, Rally, sideways , rally.
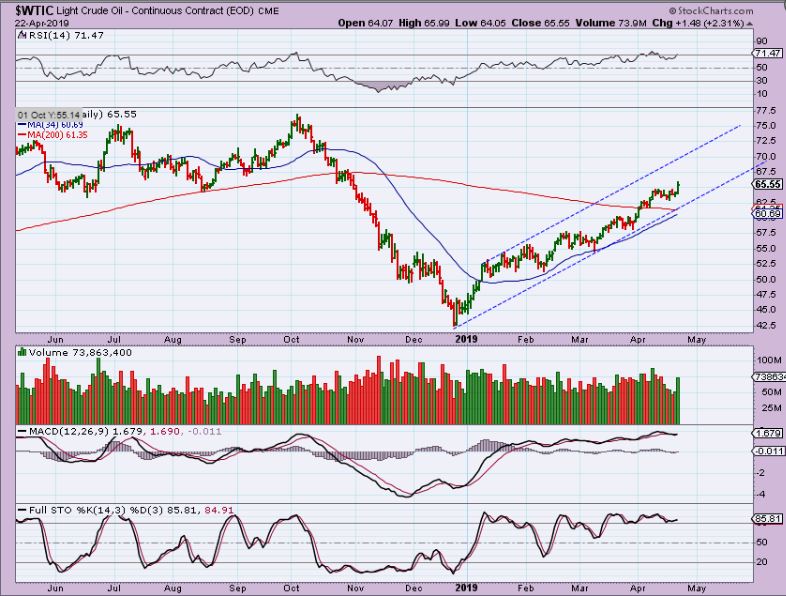
WTIC – At the end of March, I thought that this was possibly forming a bearish wedge, but when they break higher they often form a channel. If so, Oil may be gradually heading back toward those former highs.
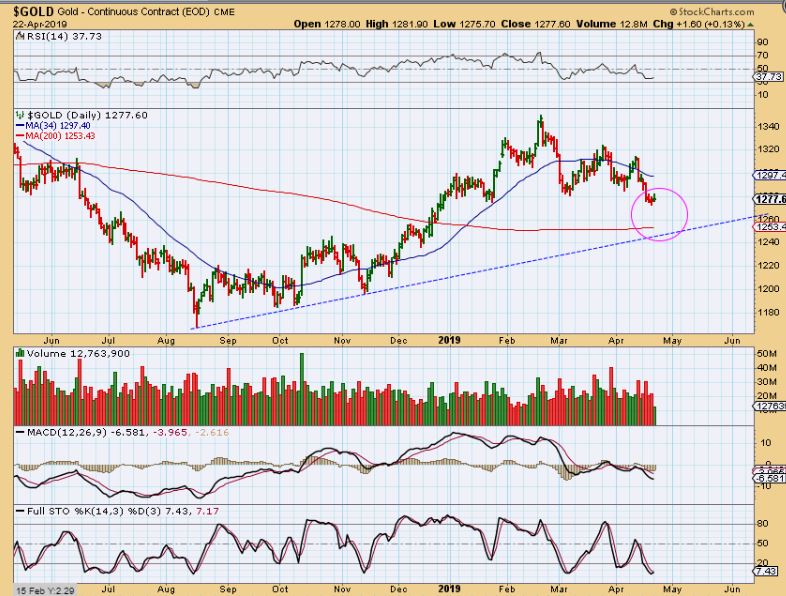
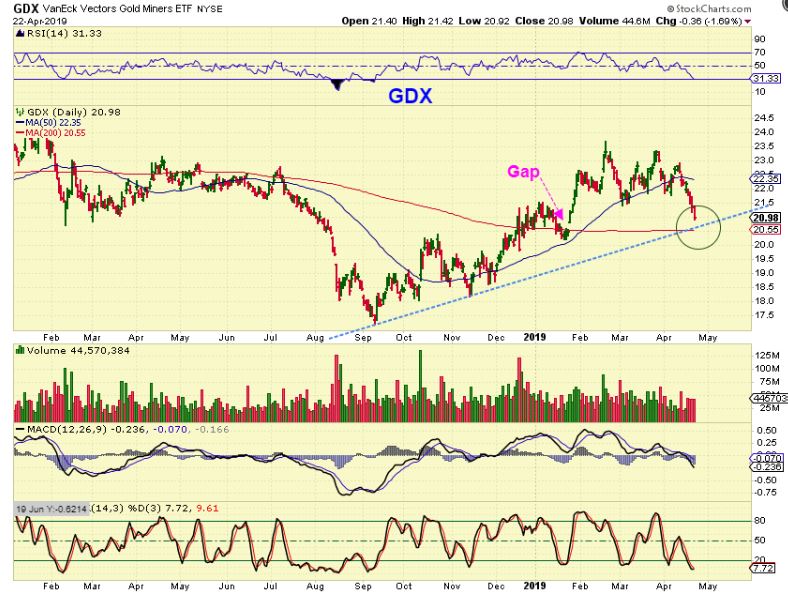
GOLD – Gold did not break down below last weeks lows, but the Miners certainly did…
GDX – We still have that Gap at the 200sma as an Initial target. A TREND LINE BREAK is what we look for in a drop to an ICL.
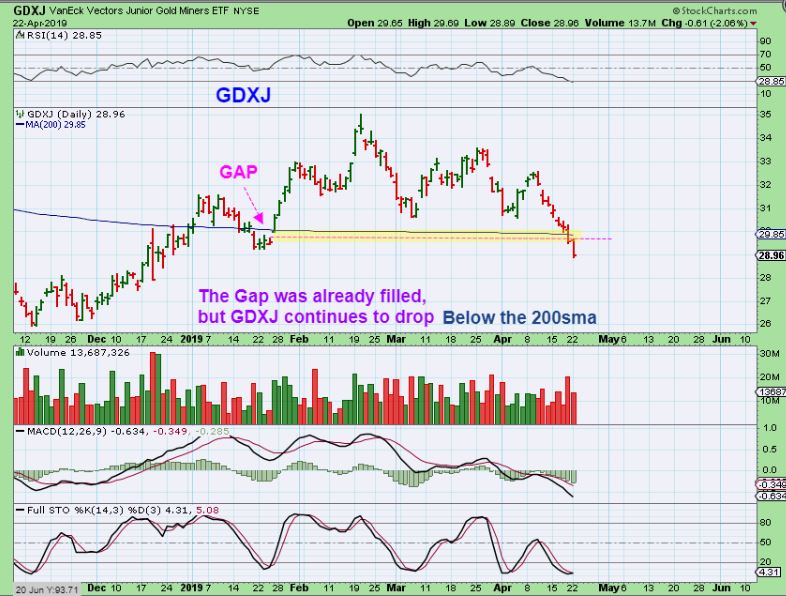
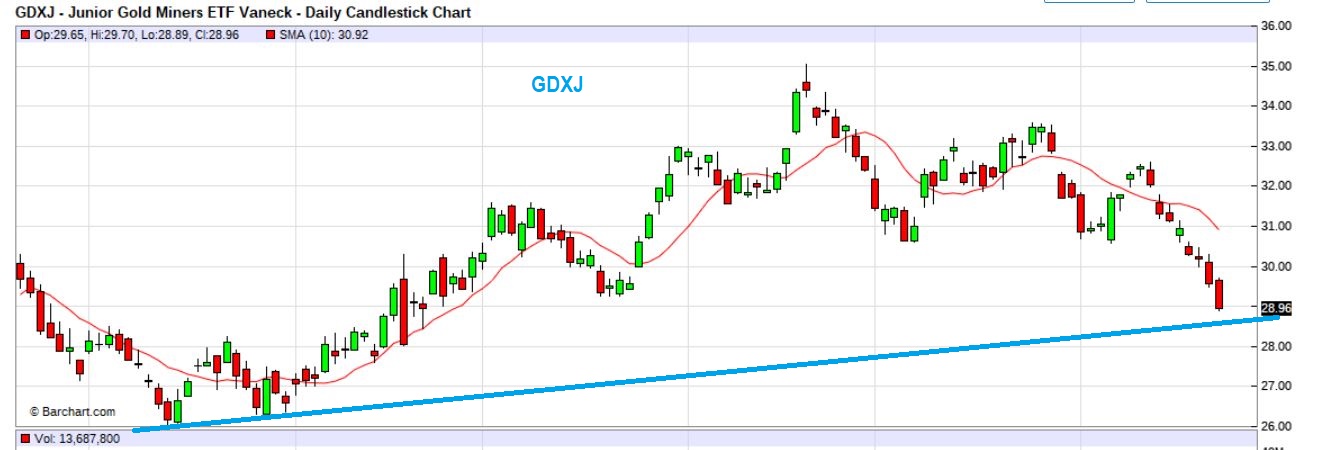
GDXJ – GDXJ filled the gap last week, but just kept dropping. This will begin to convince the technical traders that Miners may be breaking down and turning bearish. Anyone holding Miners over the past 2 weeks has lost some good money- look at this GDXJ drop day after day after day.
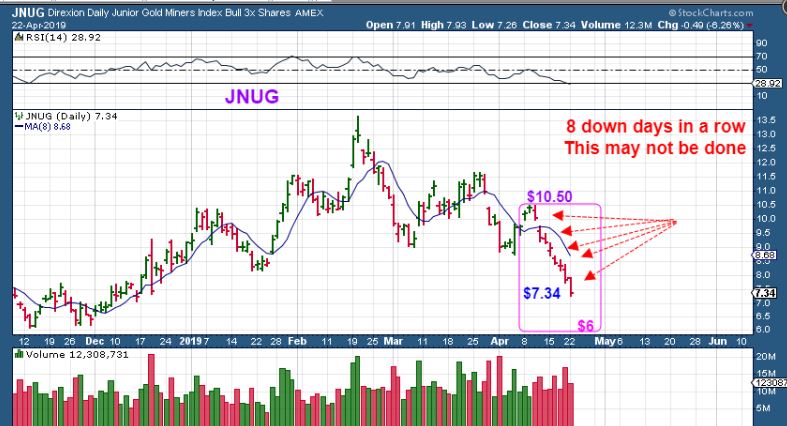
This is why I often beg people not to ‘Just hold on to JNUG during a dip’. It can get ugly fast.
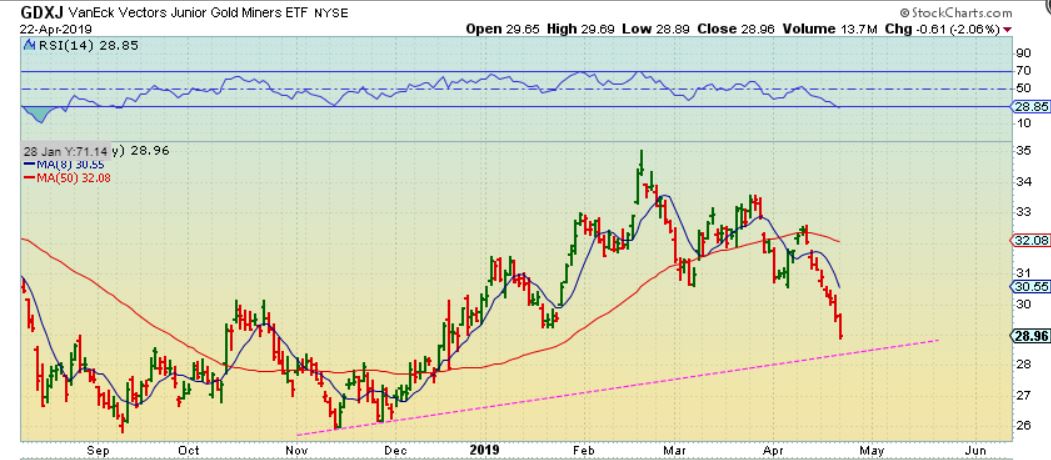
No matter which chart service I use, I still don’t see a trend line break on GDXJ, but we are close. I usually go by GDX anyway.
.
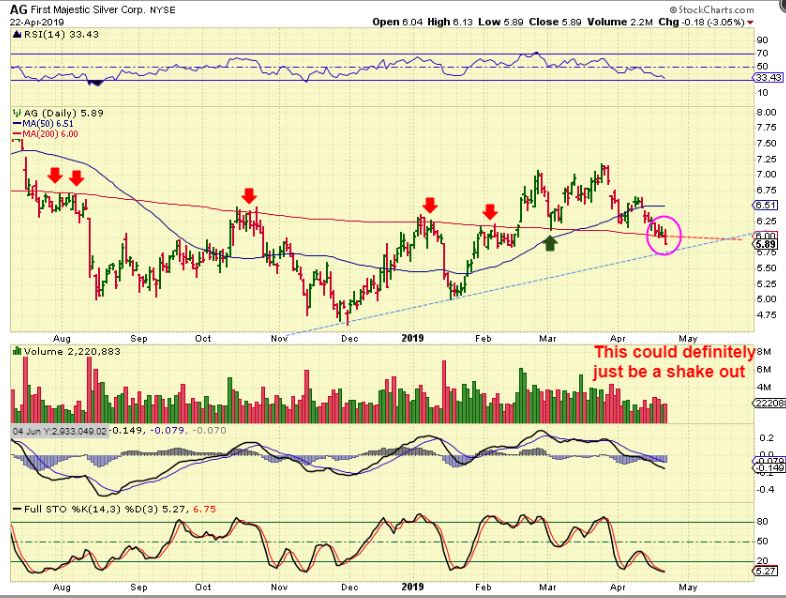
I Bought AG at support and wanted to just BUY & HOLD, but I do not do so without a reasonable ‘stop’. I HATED selling this Monday, because it could just be a shake out as this sell off gets late, but I had to allow myself to get taken out. It is a part of discipline and though selling may be almost finishing up, it has prevented deeper losses for me more often than not. . I can EASILY just get back in later, even if I have to buy above $6 . But what if I held on and it went to $4.75? Let me show you something…
AG – The blue trend line may act as support and price may reverse there, but if that breaks?…
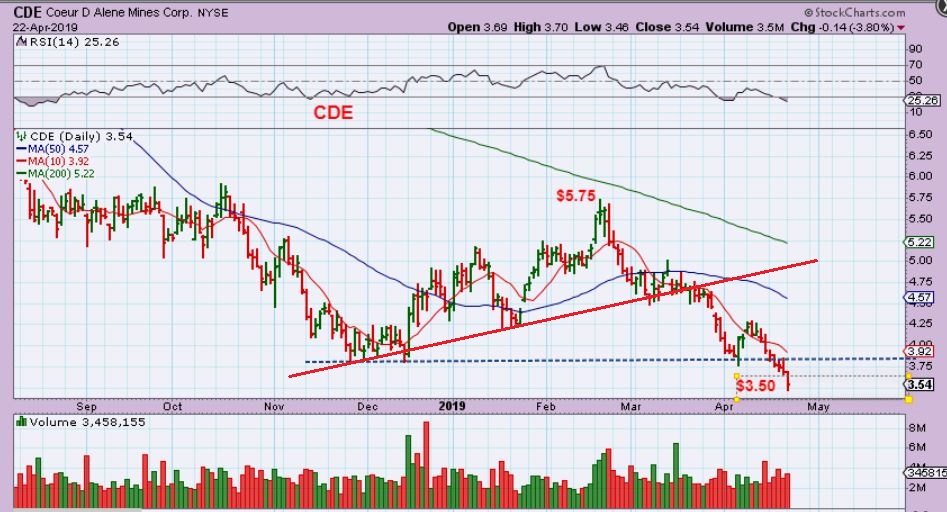
CDE – When CDE broke the trend line, it shot straight down pretty FAST as people bailed out.
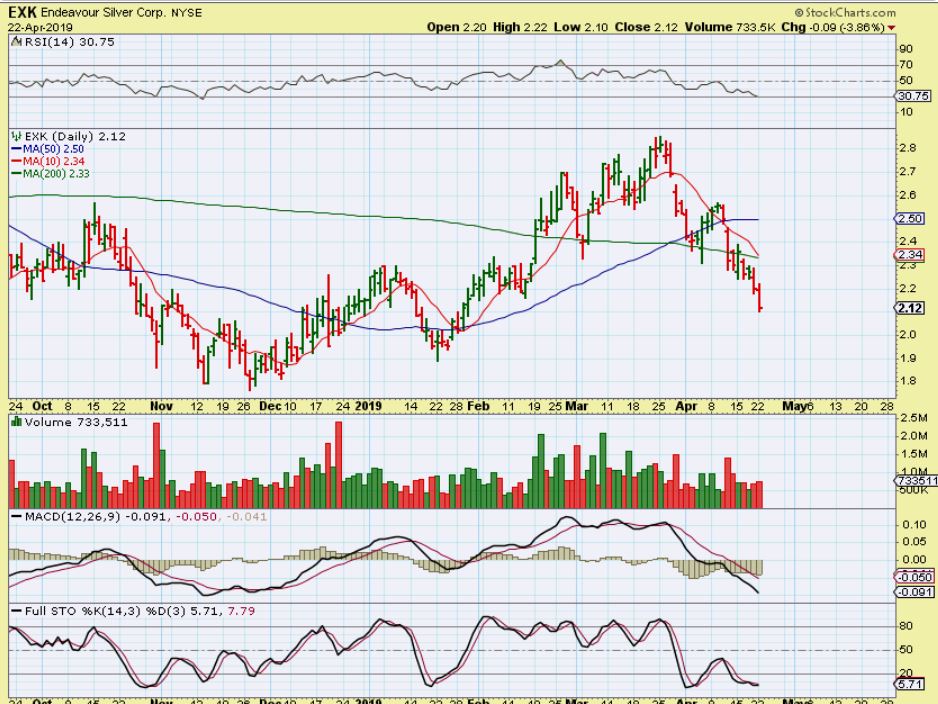
EXK – In the last month EXK has dropped very quickly twice.
FSM – New lows as FSM goes on sale again.
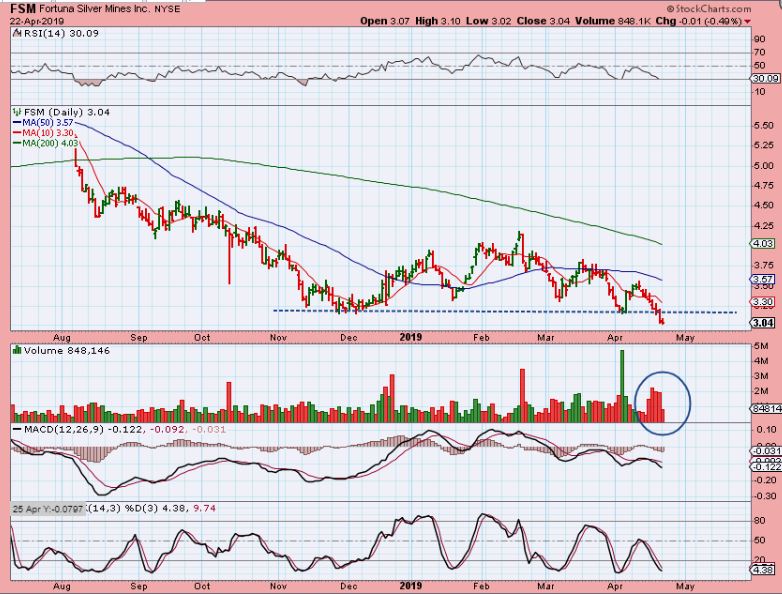
So with several Silver stocks selling off fast, Prices are going on sale. I didn’t want to hold my AG and see if it is just a shake out or not. Maybe I buy it back at $5, maybe at $6, but either way, I have to use stops at support to make it a true ‘low risk entry’.
.
Some here may just be waiting mostly in cash for the Lows in the Miners. I think we are close, as mentioned in the weekend report, but it is best to let the selling finish up, especially if you are a fan of JNUG & NUGT. We need to see a reversal and then CONFIRMATION of a swing low.
Others readers here are still doing a little trading while they wait, and I have mentioned some of the Bullish set ups in MJ trades, Blockchain trades, Energy set ups, Chinese Stocks, etc ( & Biotech with LJPC, ZIOP, LPTX, GH, TWST, etc etc, which I quickly exited all Biotech with IBB crashing down). I am currently in Blockchain, MJ Stocks, and CASH, but now that ENERGY stocks set up rather nicely & are now also popping, I will point some out below.
.
Enjoy your Tuesday trading!
.
~ALEX
.
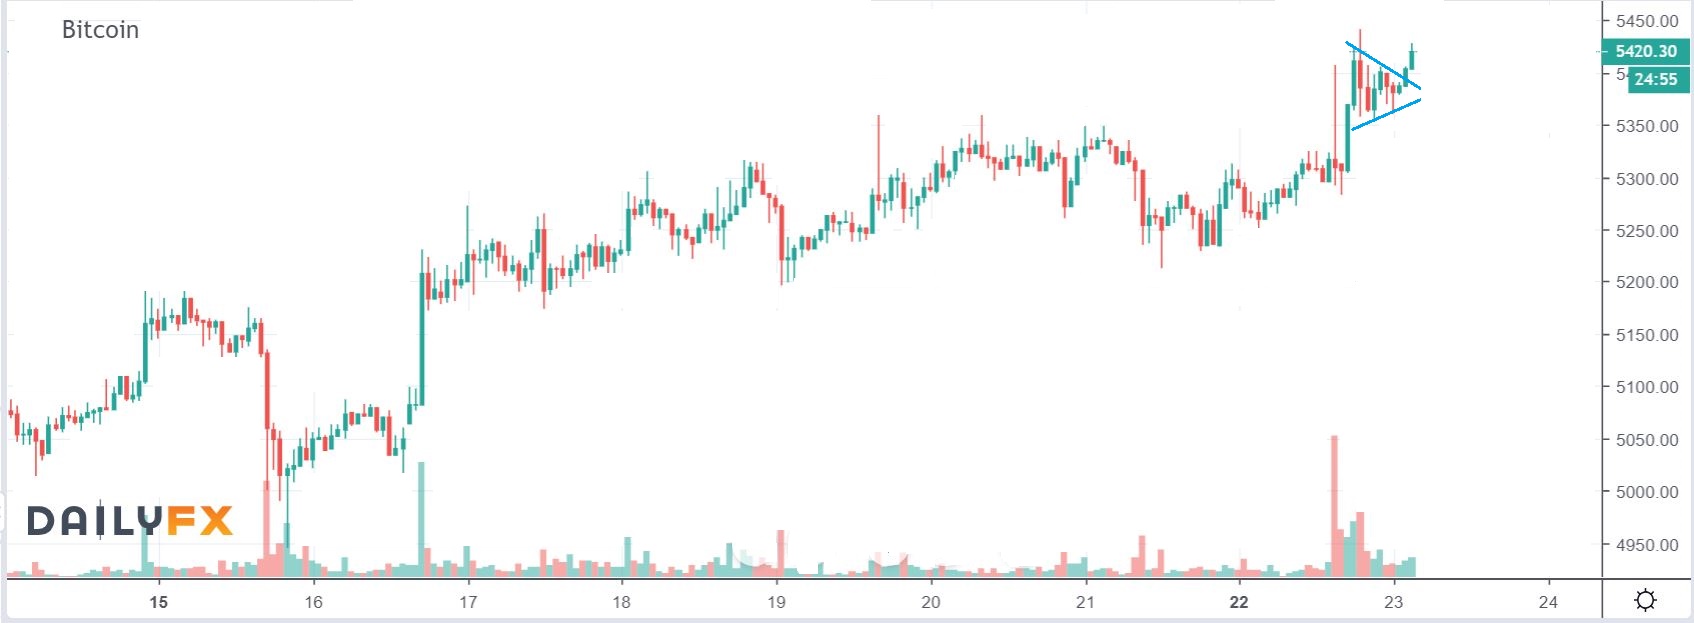
BITCOIN AS OF MIDNIGHT EASTERN TIME : 1 hr chart A Bull Flag has formed and may break price higher overnight.
.
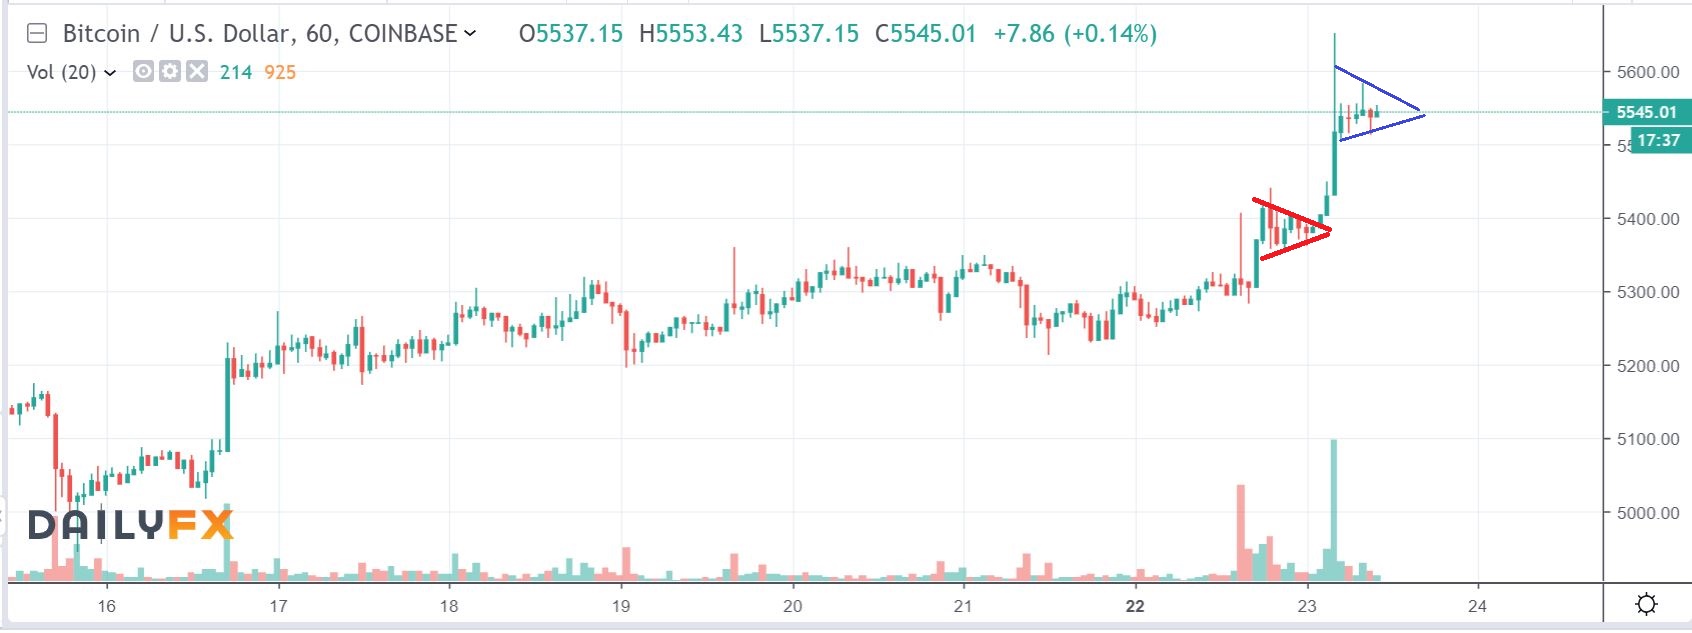
BITCOIN AS OF 6 a.m. EASTERN TIME : And it did 🙂 Now another one may be forming. This should help the blockchain stocks, we’ll see at the open.
.
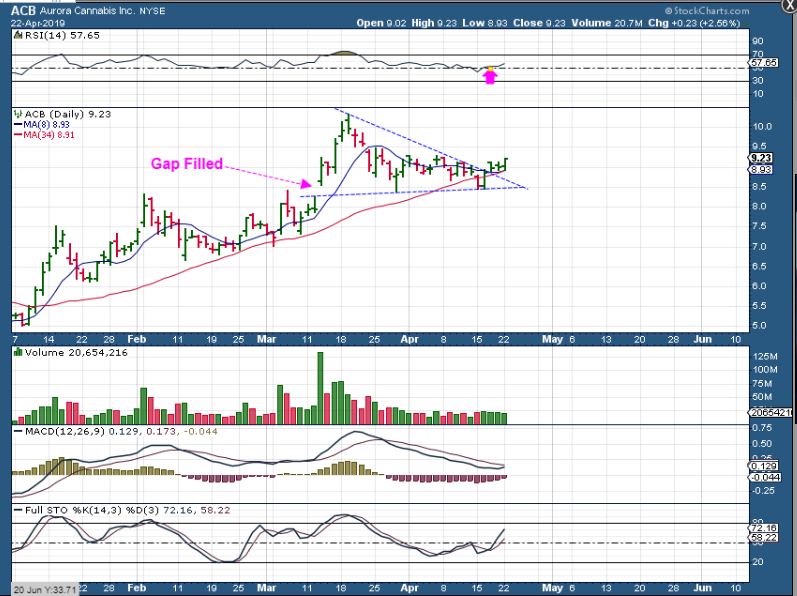
ACB – Recently I pointed out ACB & HEXO together, and said that I chose to buy HEXO. ACB still looks fine, and I captured this at 2:30 eastern time, holding the 10 sma.
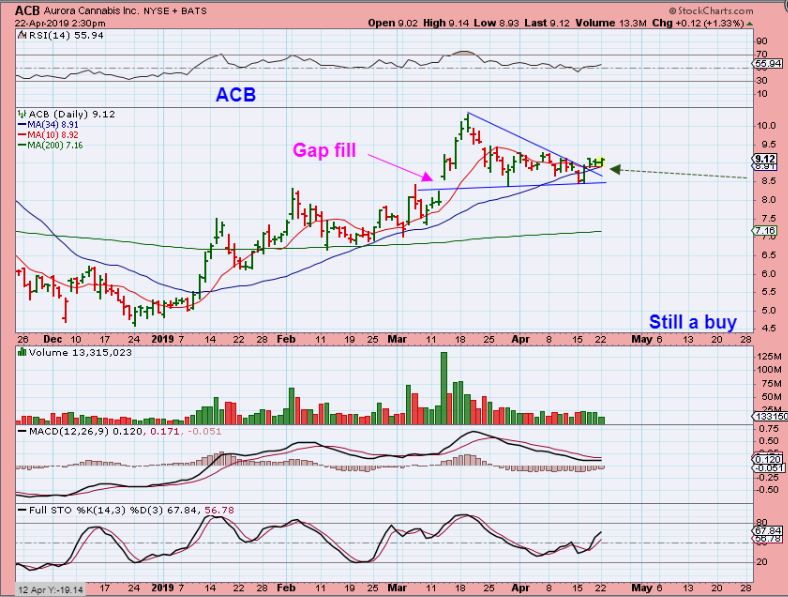
ACB at the close -It ran even higher into the close and this is still a buy. What am I expecting?…
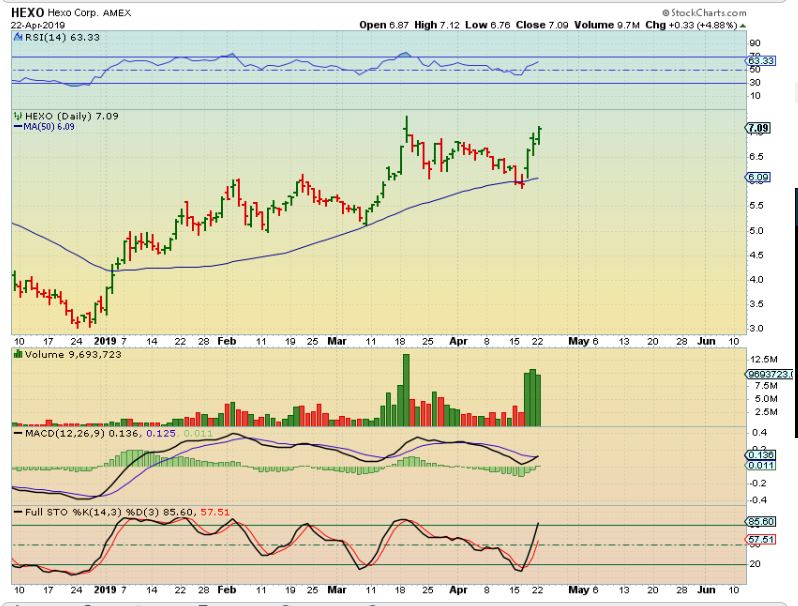
HEXO – This was the set up that I Bought as HEXO broke out, and it is similar to ACB Now. …
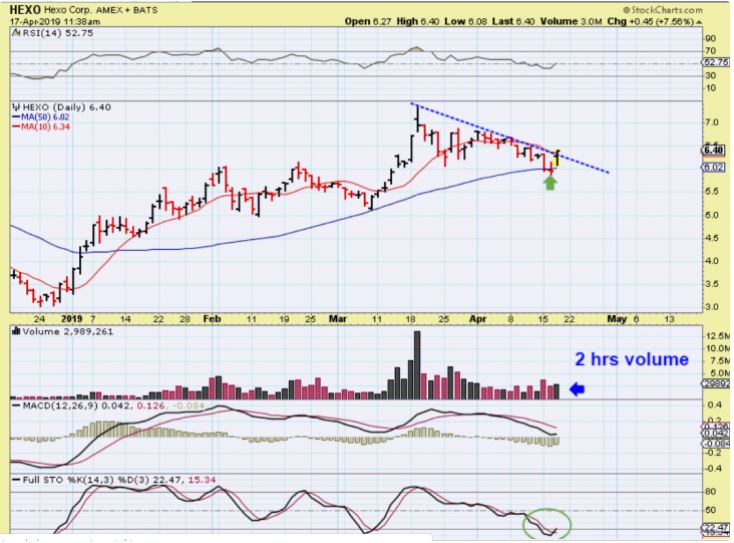
HEXO – So this may be what we get with ACB too. I expect HEXO to break out with that volume, so I still own it.
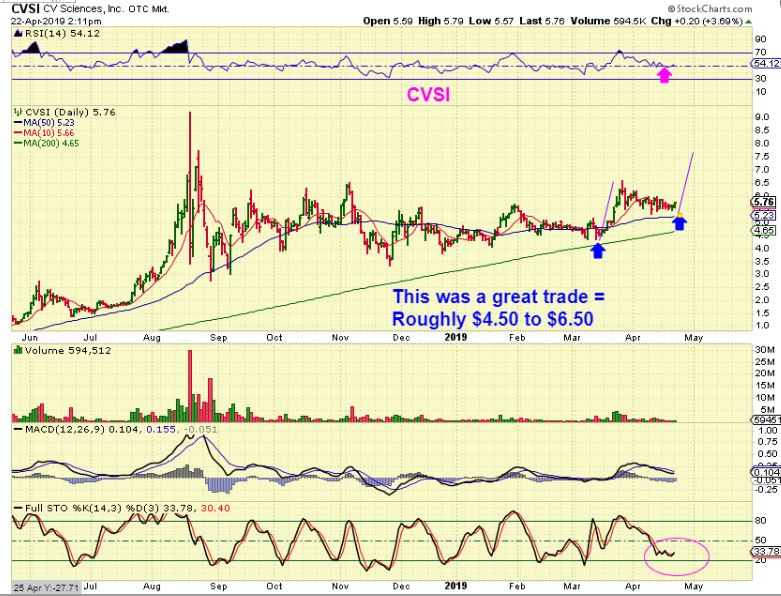
CVSI – CVSI is similar also, so this sector RUNS STRONG, Pulls back or consolidates, and then continues higher. The volume almost doubled into the close ( this was at 2 p.m. too).
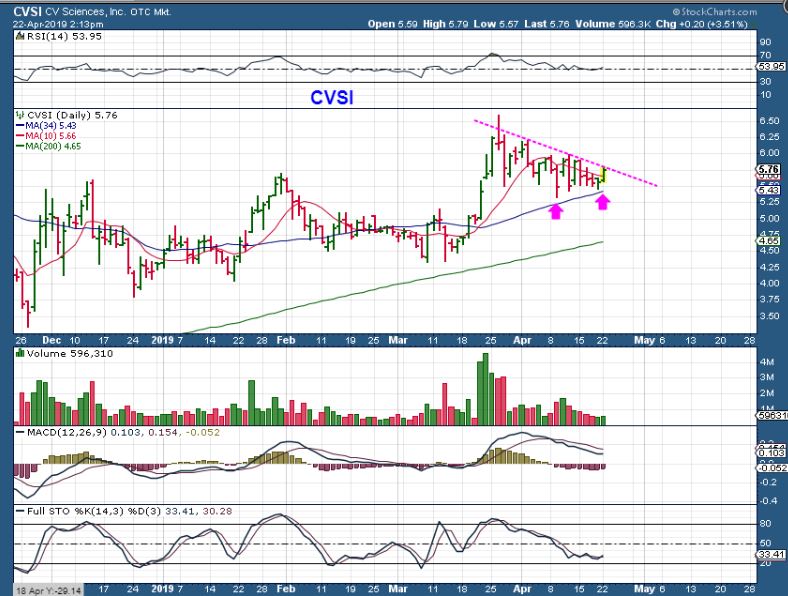
CVSI – Bigger Picture potential, so this is a low risk buy too.
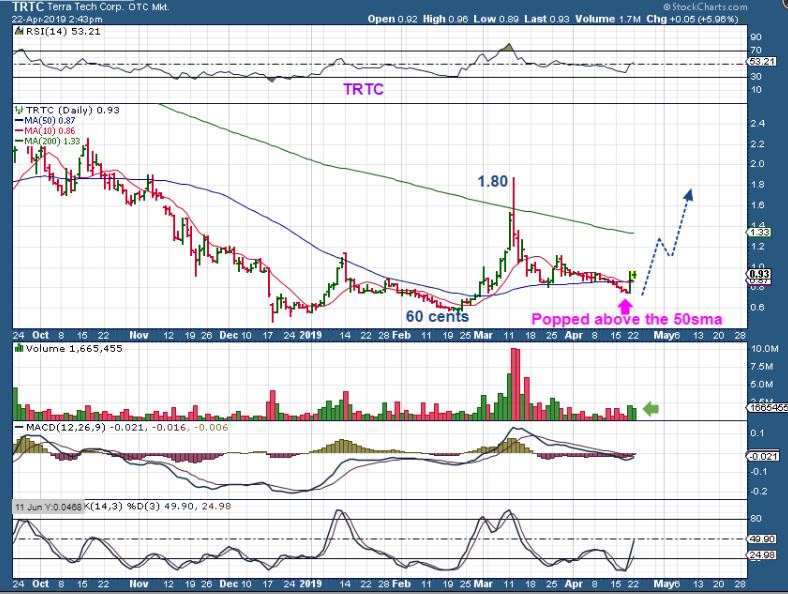
TRTC – This is a buy above the 50sma. It has popped and stalled, but in February it tripled from just below these levels.
.
ENERGY STOCKS – NOTICE HOW THESE STOCKS HAVE BEEN BASING OUT, BUT MANY HAVE REMAINED BULLISH ABOVE OR AROUND THE 50 SMA
.
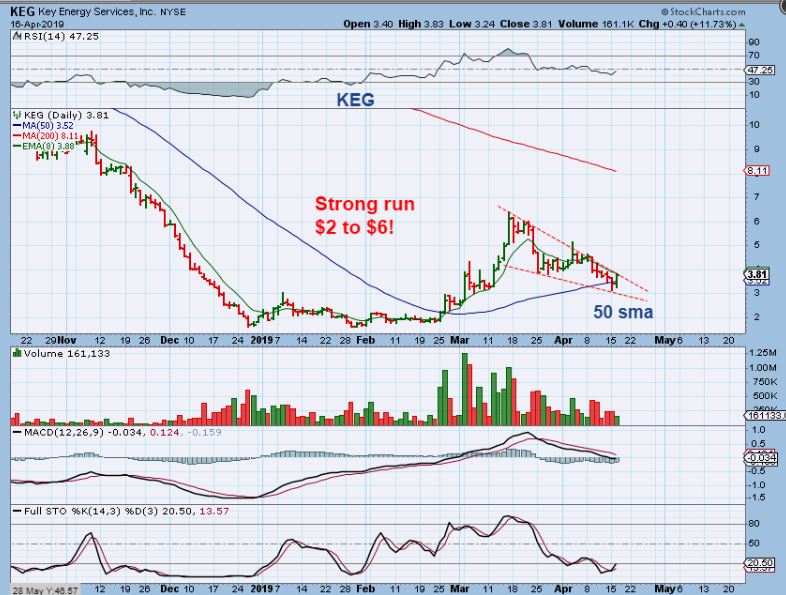
KEG – LAST WEEK I POSTED THIS AS A BUY ON THE 50 SMA. I pointed out the massive run in March and said that it could repeat with a run to the 200 sma, but I DID NOT TAKE THIS TRADE 🙁
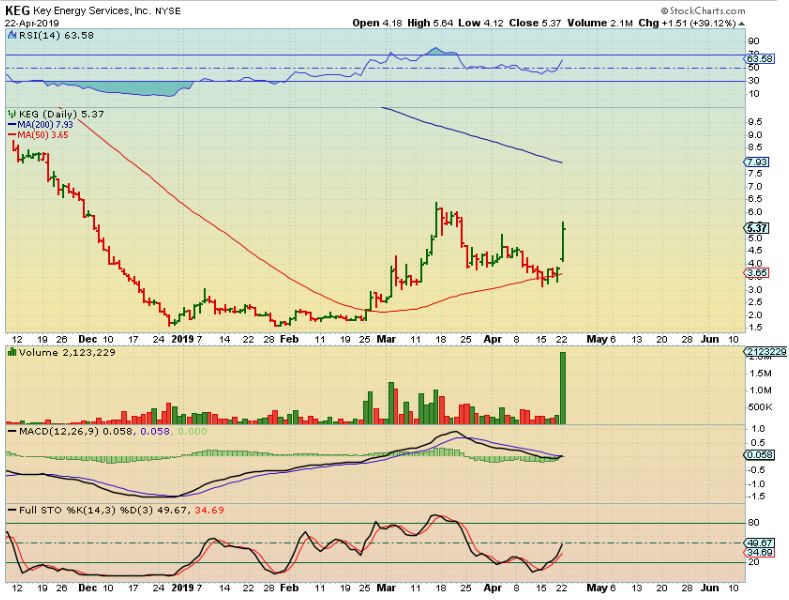
KEG – Boy do I regret that! I hope SOMEONE took it. Keg Popped 40%.
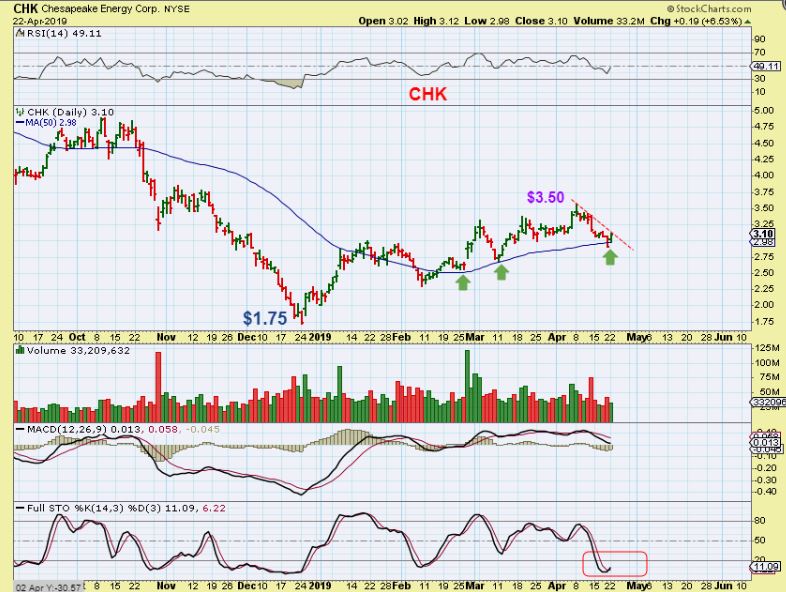
CHK- CHK sits & reversed on the 50sma (Support), so it is a low risk entry. Think about this, Just a simple move back to $3.50 would be a great % -Gain, but I think this could run even higher. $3.00 to $3.60 = 20% gains.
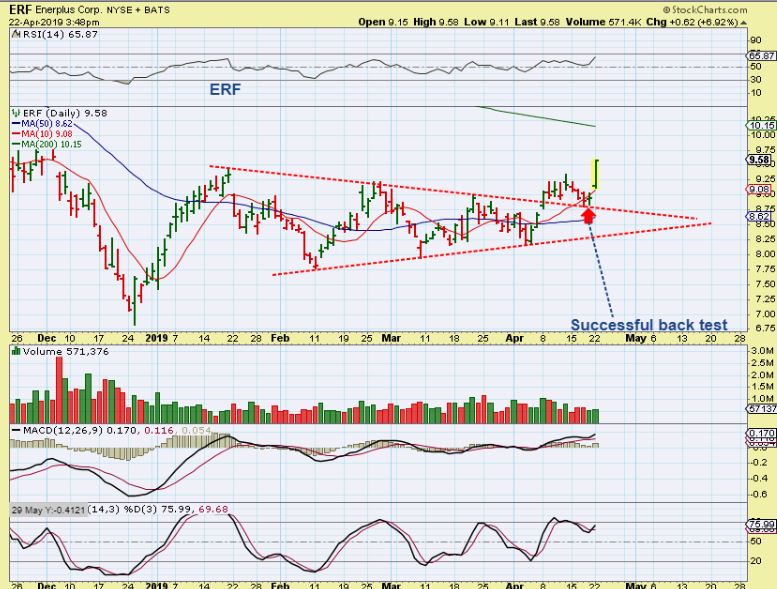
ERF – After a break out & back test, ERF is ready to go. I wouldn’t buy this one, it may stall at the 200sma, I’m using it to show how this sectors sideways consolidation period has been productive.
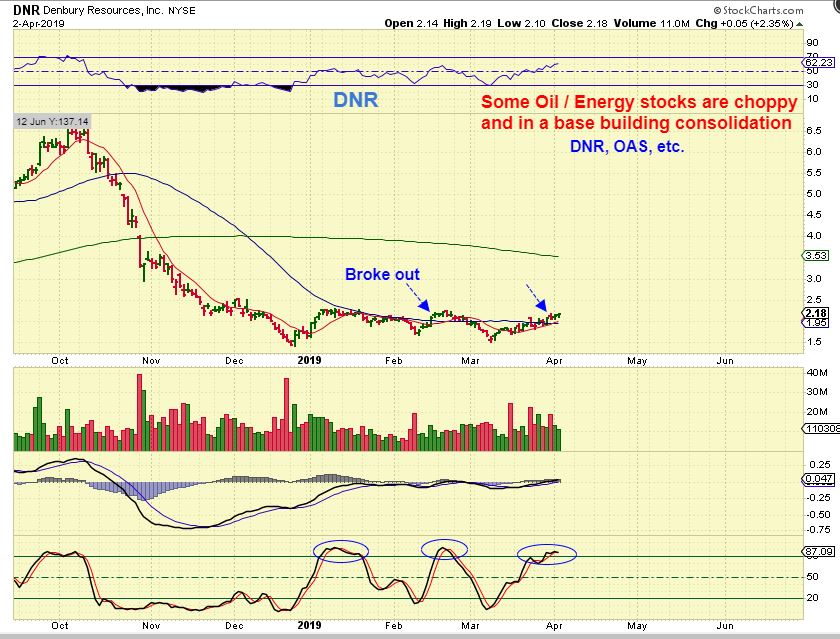
DNR – DNR broke above the 50 sma in early April, so I posted this ‘base’ on April 2.
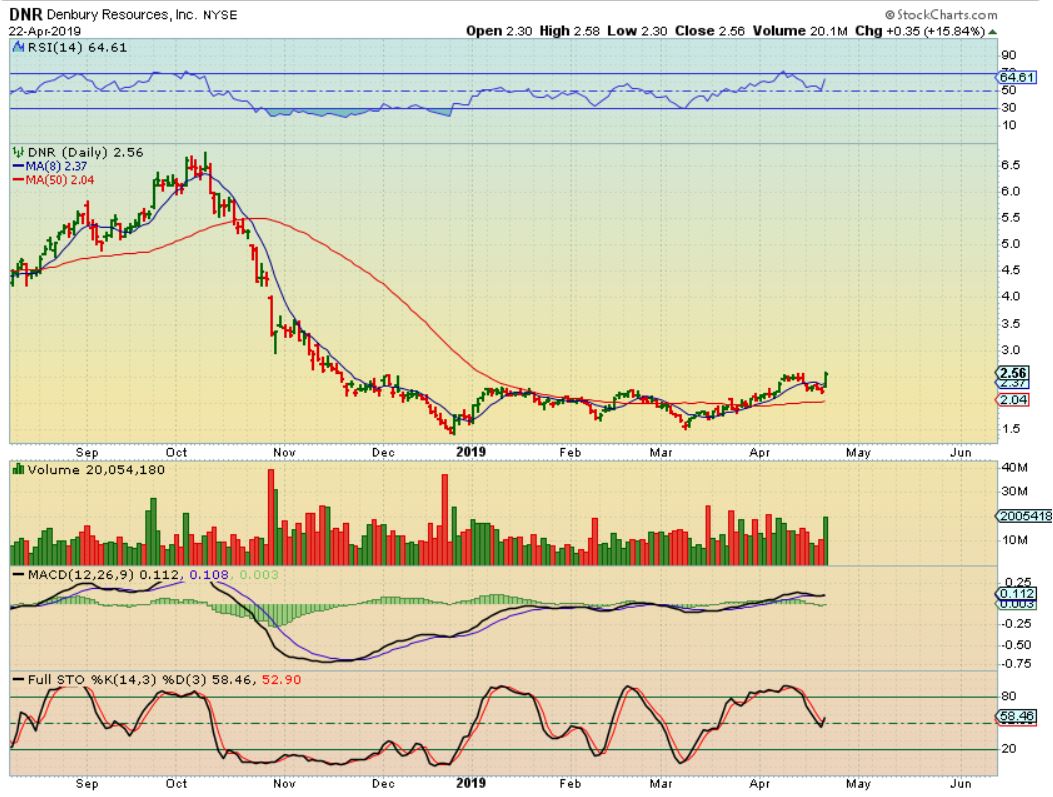
DNR – It ran higher, dipped down in an attempted back test, and Popped 16% with OIL Monday. So these ENERGY STOCKS remain bullish. This was a 16% Pop, but it can still continue to run higher.
OAS – OAS was recommended a few times as it crawled along the 50sma, and it is gaining too. LOOK FOR STOCKS CRAWLING ALONG THAT 50 sma…

LPI – I posted this Energy stock last week- This was a buy too, as it crawled under the 50sma Bullishly.
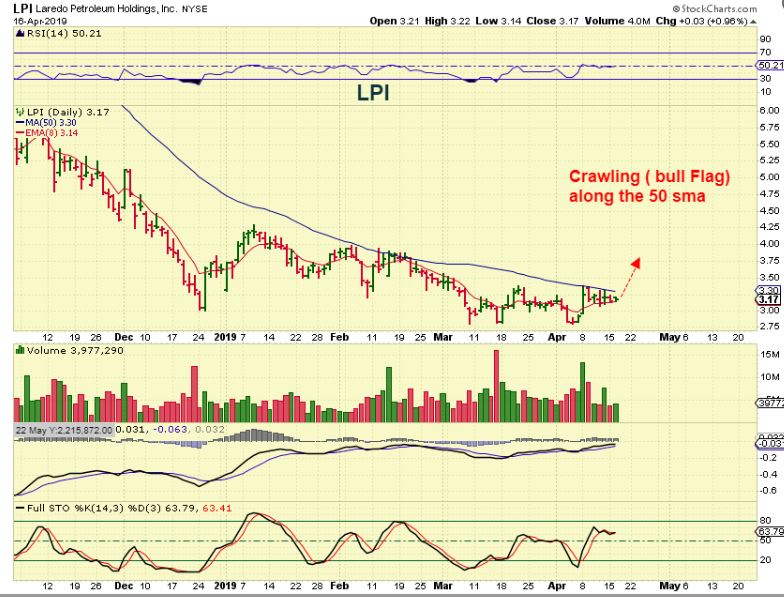
LPI – Monday it just started to ‘Popped’ above that 50sma, so it is a BUY again, and let me show you what I really like about this…
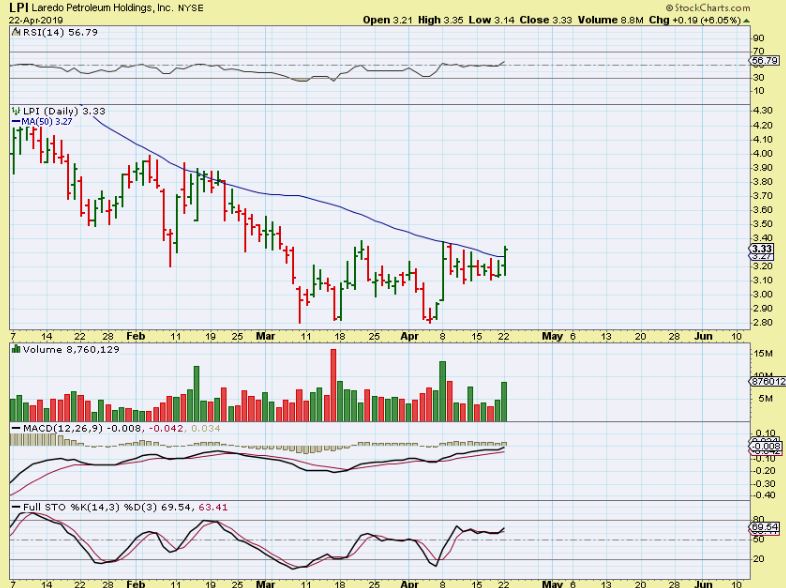
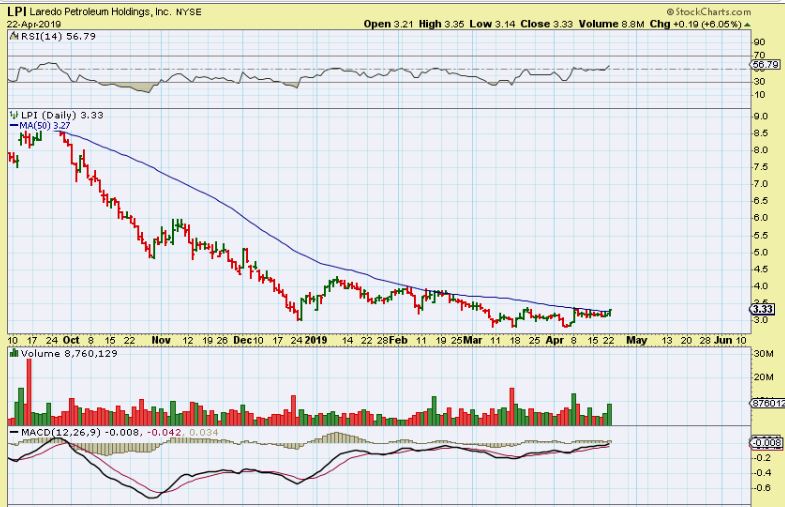
LPI – Upside potential is great. I think that LPI will make a good run, and low risk with a stop below that 50.
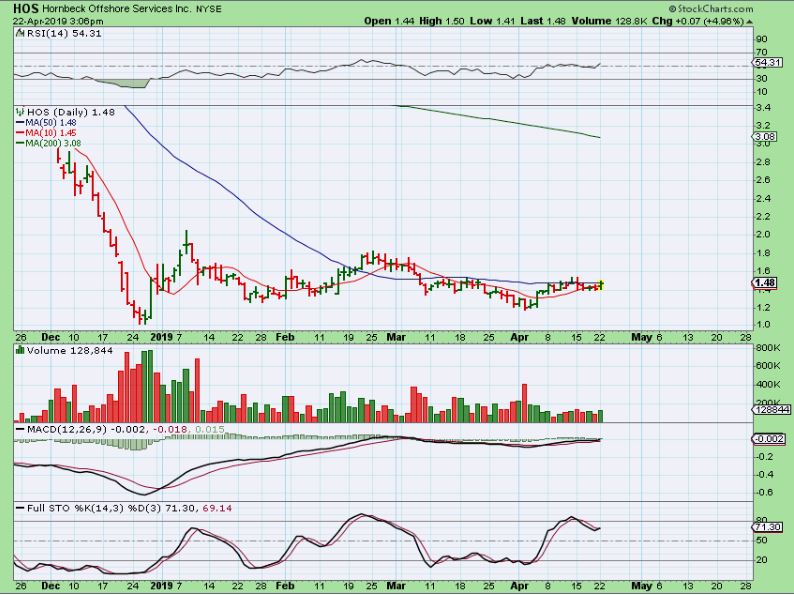
HOS – This is the same set up as LPI, as it crawls along the 50sma. OAS did this too, remember?.
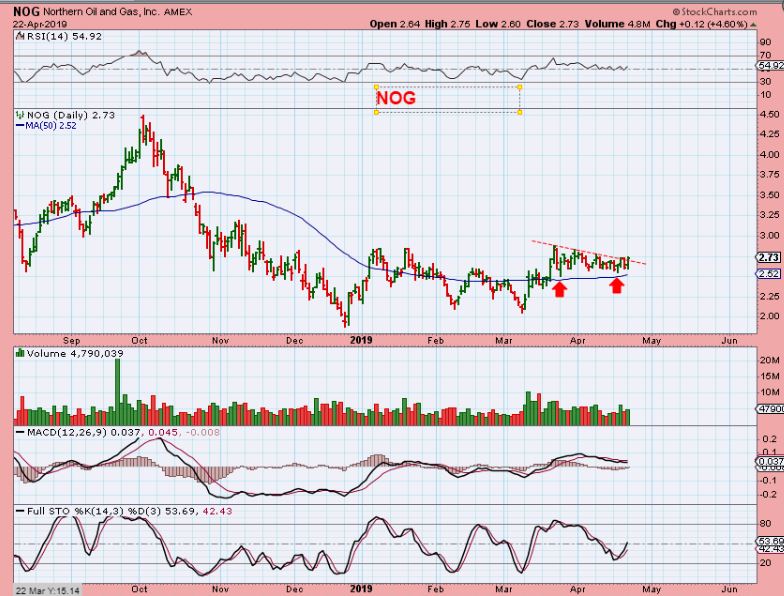
NOG – NOG has crawled along ABOVE the 50sma. This is a buy with a stop too, especially as it breaks above the red line..
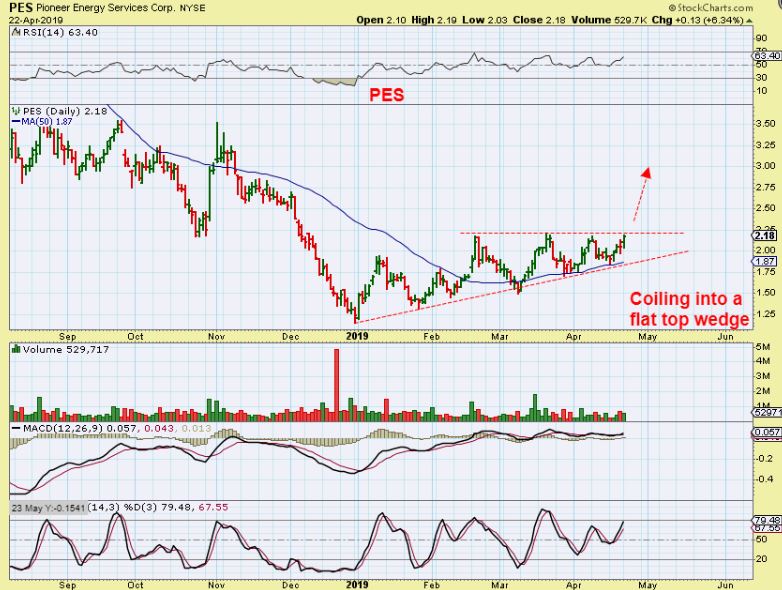
PES – Another bullish set up in Energy.
HK – Crawling along the underside of the 50 sma too. Volume started to rise Monday, a POP & Break out could lead to a run higher.
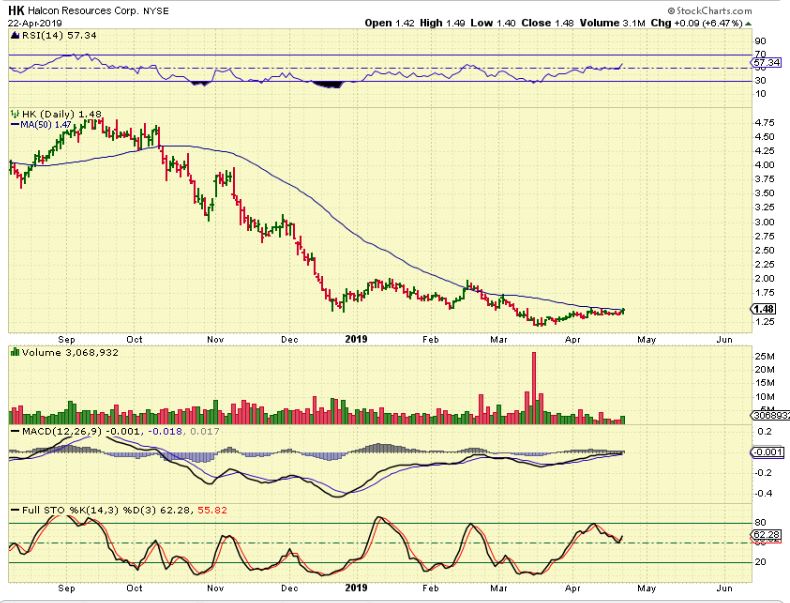
When I see this many set ups in 1 sector, it usually means that the sector is ready to go higher. You may want to run through this list and make some notes ( on a post-it note) as to which ones you like best. Which are just about to break out above the 50sma? HK, HOS, LPI for example. You can watch them as the day goes by.
Which are tightly coiling sideways (Like NOG)? Watch for a break out above an overhead trend line, and so on.

