
April 13th Weekend Wrap Up
Lets get our Big Picture View in the weekend report, the weekly wrap up.
.
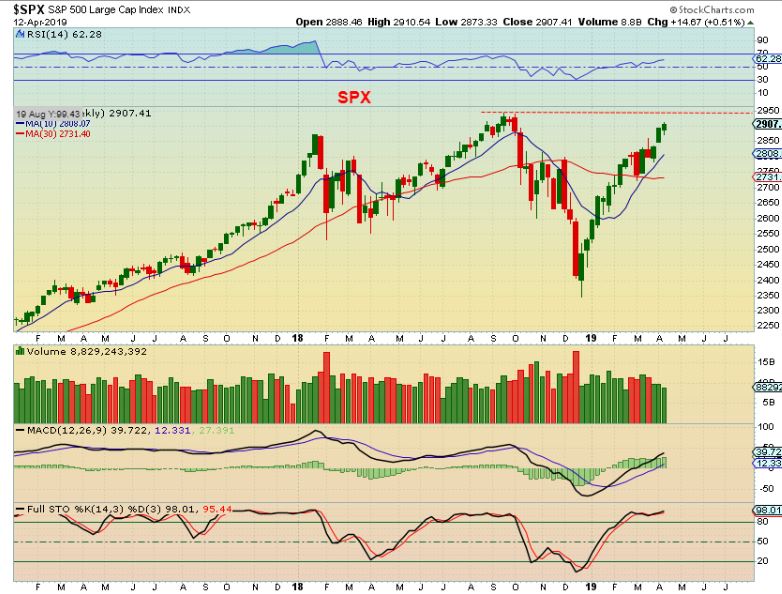
SPX WEEKLY – The SPX continues higher, and will likely meet the 2018 highs, whether that happens now or whether we get a pull back to a dcl first, and it happens on the next daily cycle. This current daily cycle seems to be a right translated Daily Cycle, so the next should pop to new highs again. So far, this remains set up bullishly in the big picture, even if we get a short term dip.
RUT WEEKLY – As for our Laggers (the Russell 2000 & Transports for example), they have now recovered that 10 weekly ma , bounced off of it again this week, and are bullishly aligned at this point.

WTIC WEEKLY – In the past, Oil met resistance & paused at the red 30 weekly ma, and eventually broke higher. On this run out of the ICL, Oil broke right through and continues higher. This may be a reversal candle on the weekly chart, so we may pause and back test the top of that area as the timing on a daily chart gets closer to a drop into a dcl. Volume has been very good and supports this move higher.

USD WEEKLY -The USD dropped for the week, but remains above the 10 & 30 weekly ma. This is a multi-week sideways move above support so far.

.
Precious Metals:
.
I feel that this week, this Sector needs to be discussed with all 3 areas in mind, Gold, Silver, and GDX. In other words, “What are Gold,Silver, & The Miners doing with regard to each other?” Remember that during this run out of the 2018 ICL, Gold was leading, Silver was lagging, Miners were mixed. This week we will see if they all have something in common yet.
.
GOLD WEEKLY #1 – A triangle has been forming in GOLD & The Miners. If you have been with me over the years, you know that personally for me in my experience, when Triangles form, I PAY ATTENTION TO THEM. Many times I have personally seen that TRIANGLES CAN OVERRULE CYCLES, and I have proven that here , showing past examples. Can this break down? Yes, let’s see chart #2.
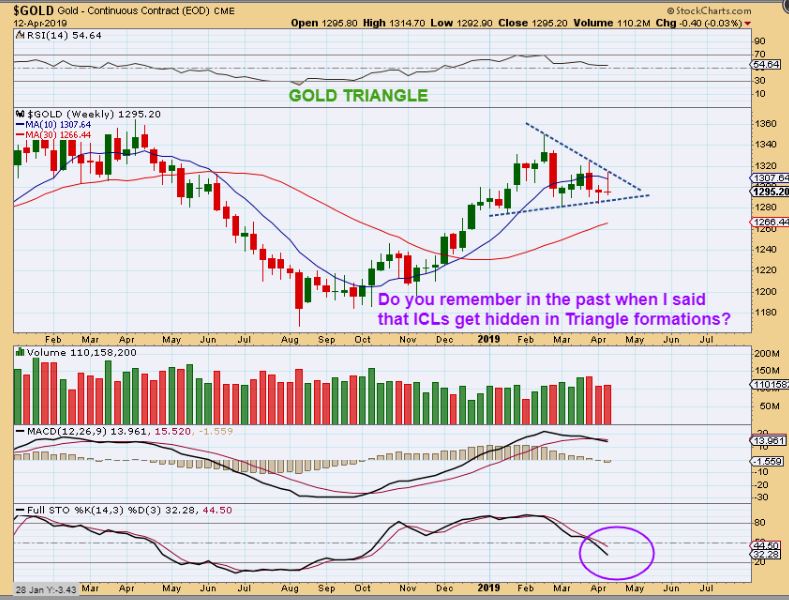
Can this break down? Yes, and we are due for a drop into an ICL, HOWEVER, don’t be surprised if it breaks out higher instead.
.
GOLD WEEKLY #2 – I would love to see this, because it would look more like an ICL & reversal. It also might shake off the current bulls, lowering sentiment. The haziness of this sector would become clearer, and we could buy this as a low risk entry. Since we have kind of a bullish looking Triangle in GOLD, let’s look at SILVER.

SILVER WEEKLY – Silver is sitting on support and has a bullish looking descending wedge. Can this break down? Sure, but let’s be mindful of the bullishness of this set up too. A break higher usually runs strong. Let’s say a break of Silver $15.50 is Bullish. What about Miners?

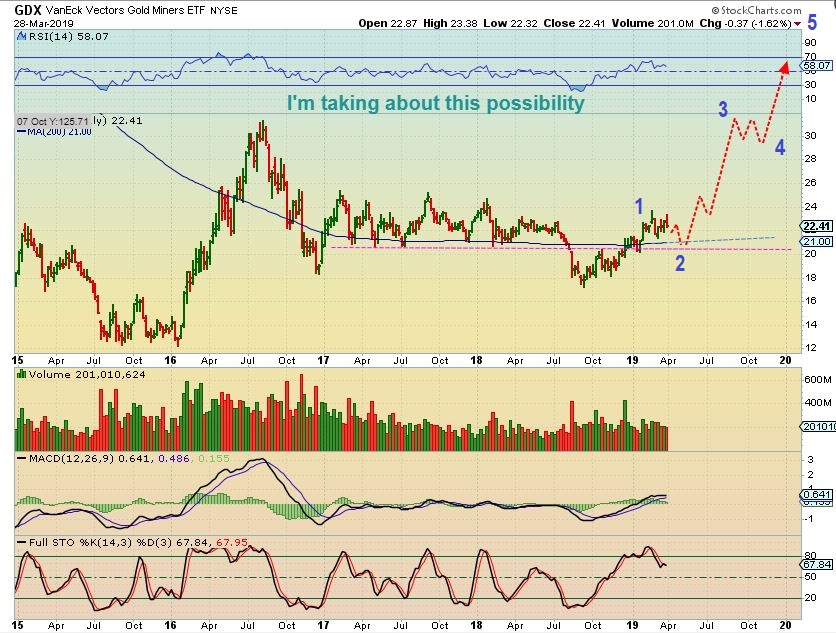
GDX WEEKLY – GDX has gone sideways since January and I have been expecting a dip or back test as a part of a ‘shake out’ and back test. Now I am seeing a flag or triangle form on this weekly chart too. Can it break down, as expected in the past? Yes, but let’s be mindful of the Triangle.

So this was my chart from March 28, and this drop is what I was expecting, and it is still possible. In Cycles, you would expect it as an ICL and this would be a nice buying opportunity. If this breaks higher, however, we want to be mentally ready for that. I expect this to run to the $30 area.
GDXJ WEEKLY – This is the only one that still looks possibly ready to break lower and back tests the 30 weekly ma. I don’t see a bullish looking triangle here. So far, GDXJ does look to be playing out within prior expectations, but tlet’s see what happens next week.

.
To summarize the precious metals sector I would have to present it this way:
What we see in the GDXJ is still looking like what we have expected for weeks. as the 2018 run took place Gold really took the lead, Silver lagged and Miners were mixed individually. I was thinking that that they would possibly all ‘SYNC UP’ in a drop to the next ICL. Then after they all bottom, they could run together. THAT STILL MAY BE THE CASE, but now it also looks a little like they may be synced up already. How? …
.
– Gold has formed a Bullish looking Triangle after a strong run and consolidation.
– Silver has formed a Bullish descending wedge landing on Support after a mediocre run and sideways chop.
– GDX also looks like a Bullish Triangle formed after a shake out & bullish recovery.
Though I still want to be aware that we should be due for a drop into an ICL, this also leads me to put in the back of my mind that GOLD, SILVER, and Miners may already be ‘Synced’ or even Bullishly Aligned after this sideways chop. Triangles have formed, and that catches my attention. This is just an observation that I am making when I look at all 3 sectors of the precious metals. So far we’ve had weeks of Pops & drops / sideways choppiness, but time will eventually run out and a solid move will unfold. We need to be ready for both the outcome that we have expected all along ( ICL drop) , and also be ready for the unexpected ( A Triangle ICL may be in place) .
Triangles are forming, Stay Frosty my friends! 🙂 And of course I will continue to cover the important changes or events in the daily reports.
.
Enjoy the rest of your weekend!
.
~ALEX
.
Thursday saw a sell off in Bitcoin, taking it from a flag or Pennant, to more of a sideways channel. I wrote this in Fridays morning report.
.
Bitcoin 6:45 a.m. Eastern Friday morning from the report: After Thursdays sell off, We are bouncing back over $5000. It is hopeful that Bitcoin holds that support area. This could be a mini inverse H&S .

.
BITCOIN– And the update for BITCOIN Saturday Night is that after that sell off Thursday and the quick little shake out Friday, it has continued to chop sideways along the Magenta support line. I’d like to see it continue to hold the Magenta or Blue support line this weekend. So far, So Good!


