April 6th Weekend Update
Last weeks markets were active, so let’s take a look at what happened and see what that means to the Big Picture in various sectors.
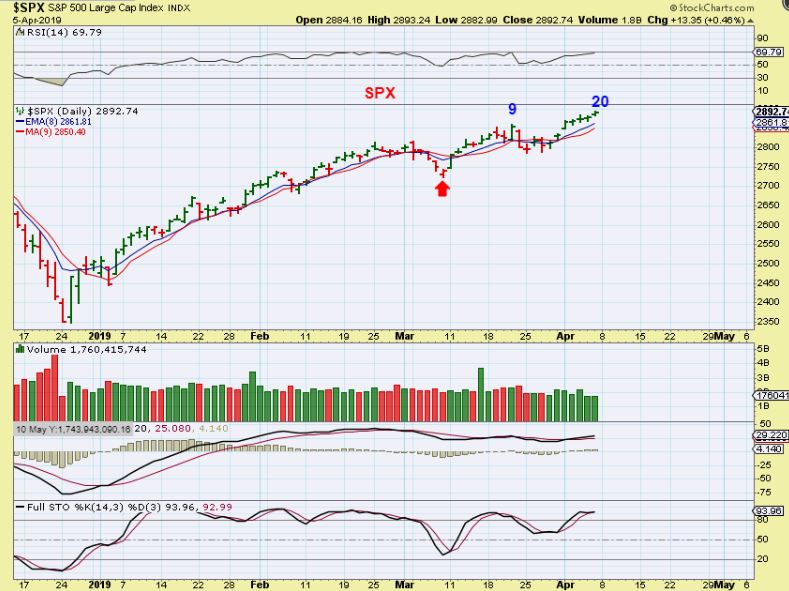
SPX DAILY – Friday was day 20 and the SPX reached a new high. This is a bullish run and is beginning to lean toward it being a right translated daily cycle too.
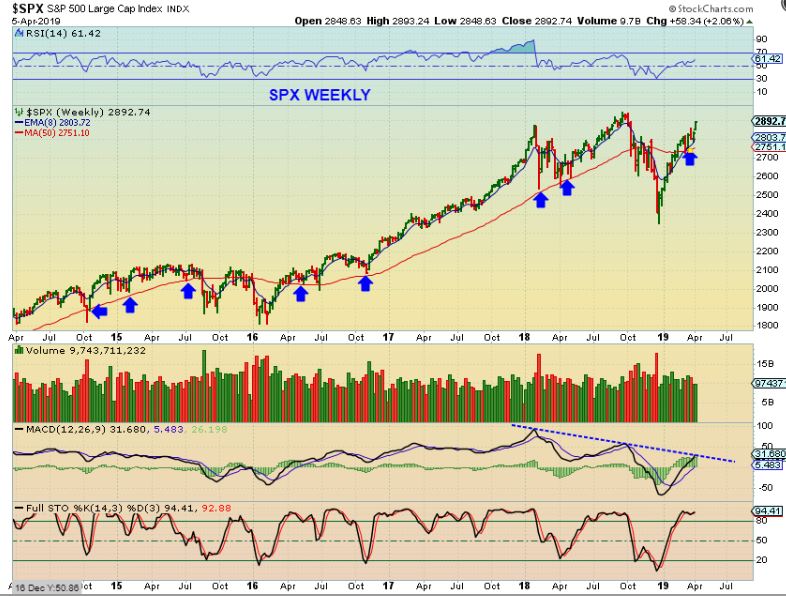
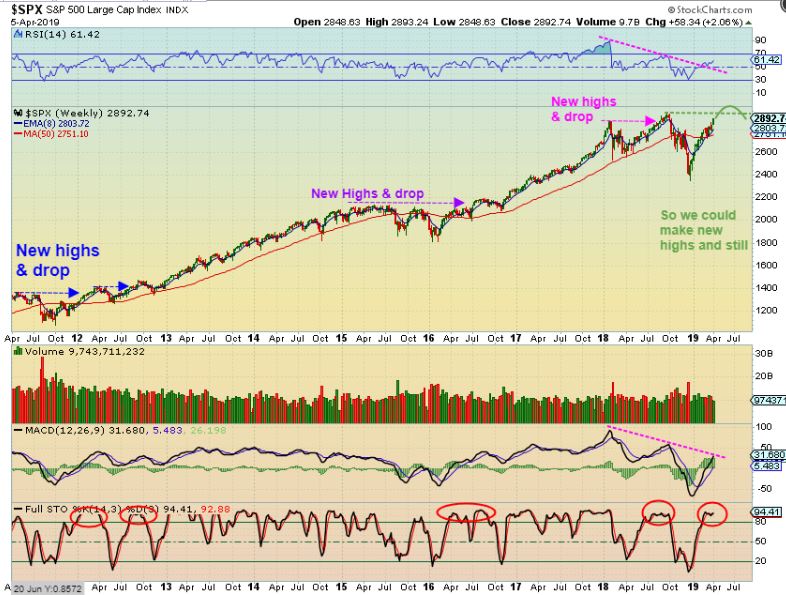
SPX WEEKLY – The SPX is almost now back at prior highs. It looks bullish but the RSI & MACD do look like we have Divergence. This could lead to long period of consolidation and choppy markets similar to 2016, or even a triple top. It would still be played as Bullish with a stop, and NOT shorted at this point.
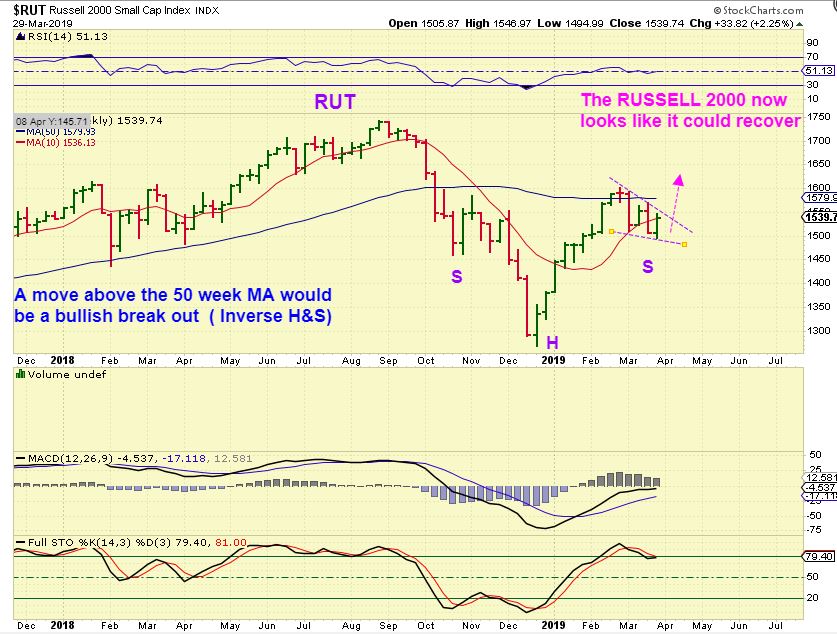
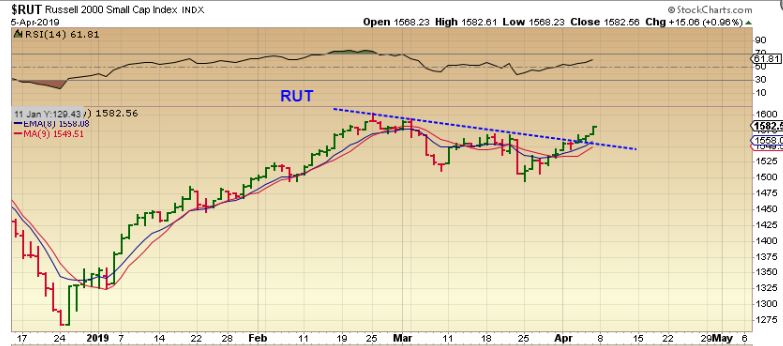
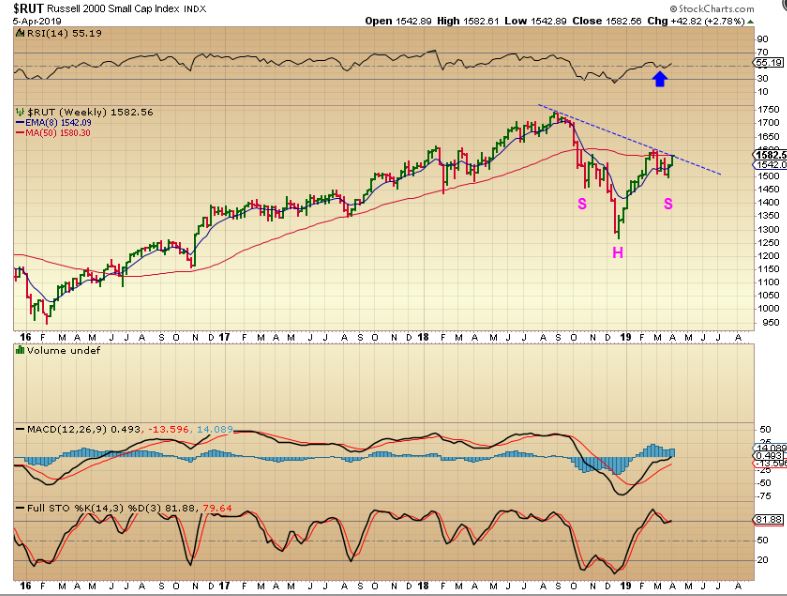
RUT WEEKLY LAST WEEK – We discussed the break down in the RUT and the TRAN also not running bullishly with the SPX. So going into the Week, this was starting to look like it could recover. I drew the RUT as a bullish inverse head & shoulders & a Bull wedge. A break higher could be bought as a bullish break out ( read the chart).
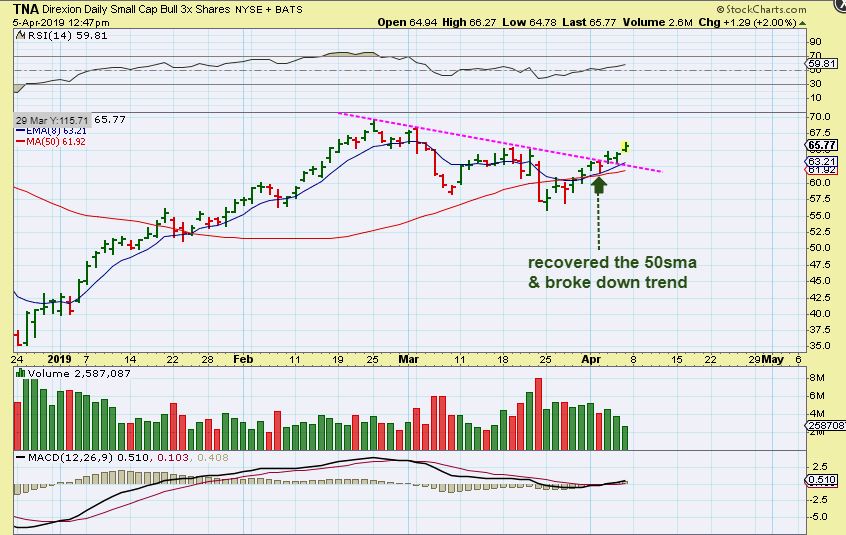
RUT DAILY – The RUT broke out last week & had follow through, so TNA was pointed out as a buy.
TNA – A buy early in the week with follow through. Small Caps look to be trying to play catch up.
RUT WEEKLY – As of right now, the RUT WEEKLY also looks like it could break out further next week. This is now a bullish weekly chart, especially if it breaks higher next week.
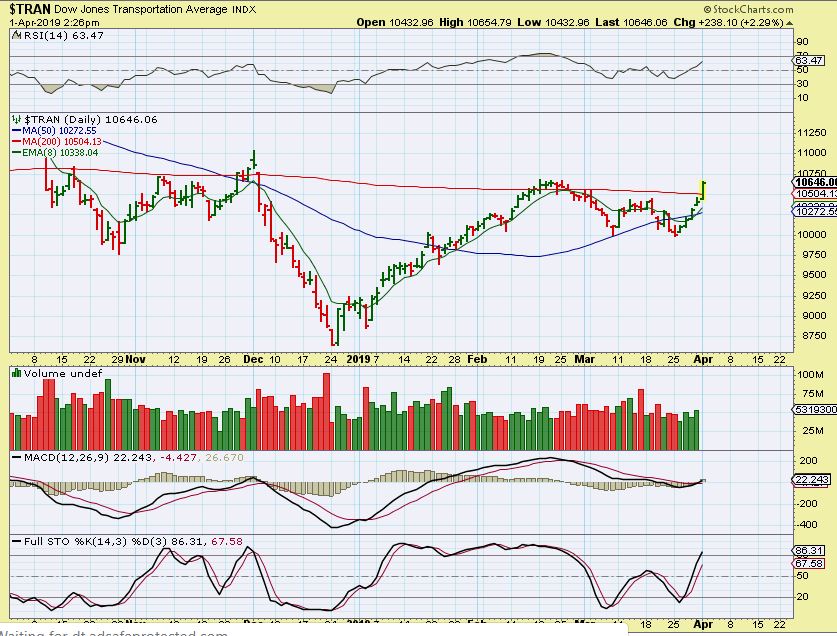
TRAN DAILY FROM MONDAY APRIL 1 – This was another break out for the TRAN. After breaking back above the 50 sma, it also broke the 200 sma Monday. The Transports could now easily be bought above the 50sma & the 200sma with a stop.
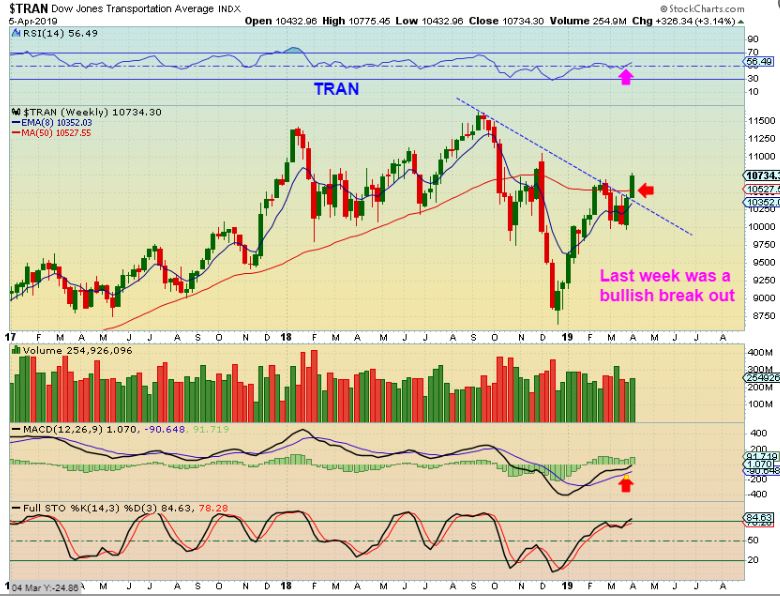
TRAN WEEKLY – As the week went by, there was follow through and this weekly RSI & MACD look good.
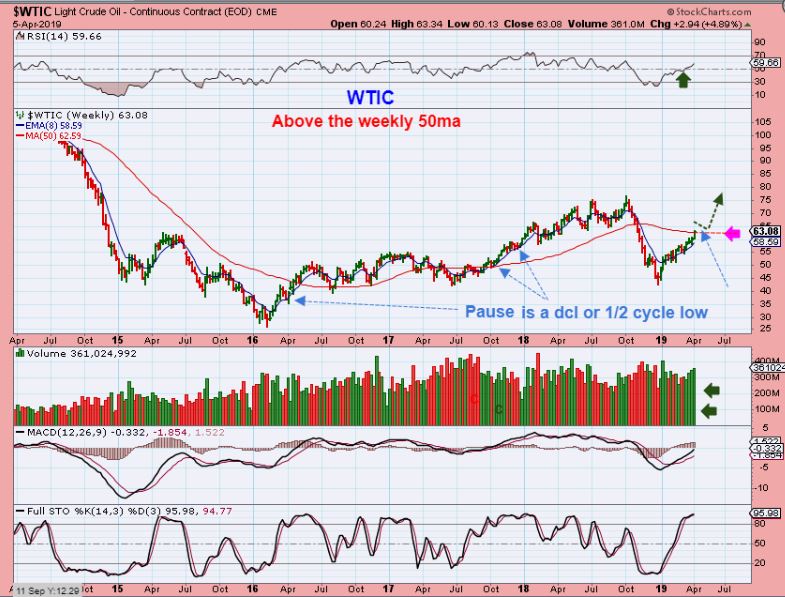
WTIC WEEKLY – Oil remains Bullish, breaking the daily 200 sma, and the weekly 50 ma. See the chart – Oil could ‘pause’ above the 200 sma, but I still expect that Oil can continue higher.
.
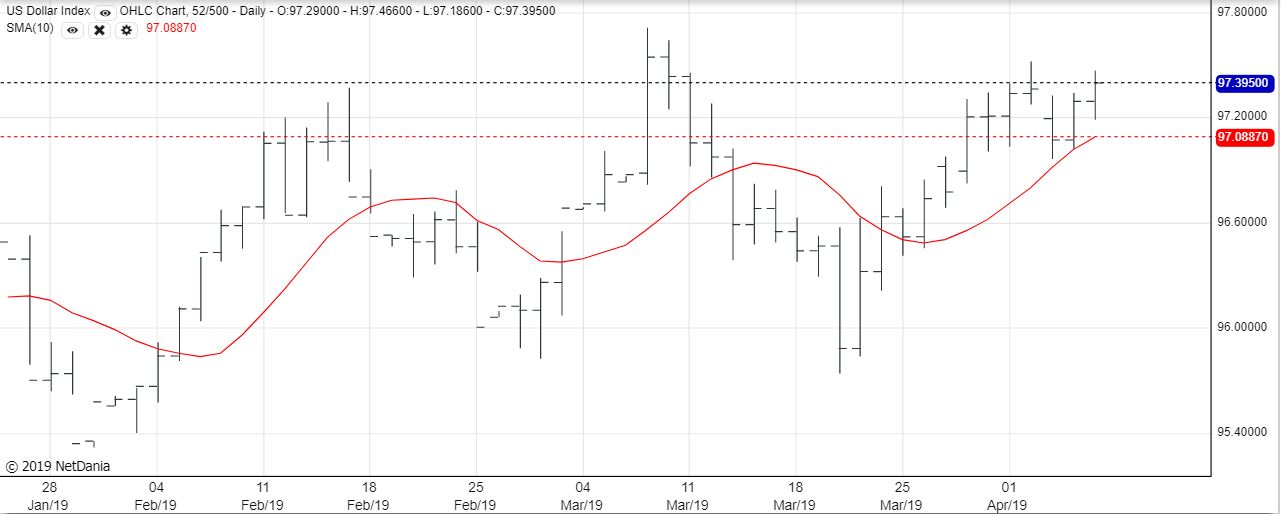
THE USD DAILY – The USD continued higher after reversing on the 10sma, but it did not affect precious metals.
,
PRECIOUS METALS
.
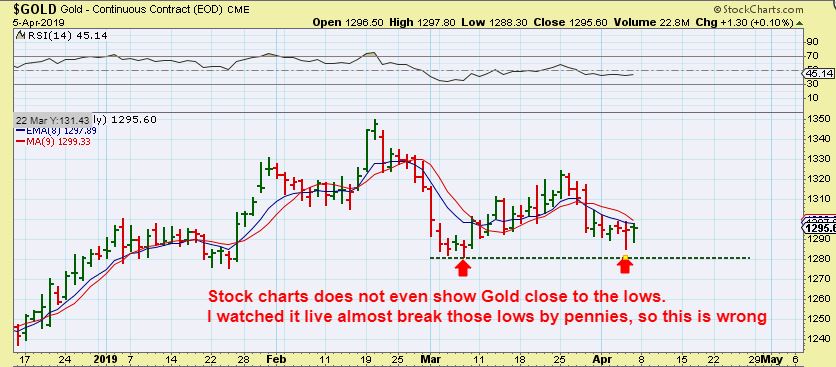
GOLD – I just want to point out that on this chart that I captured real time Thursday, notice that Gold did not break the March lows. It was very close with both days tagging 1280, but it missed the lows by pennies & reversed. However…
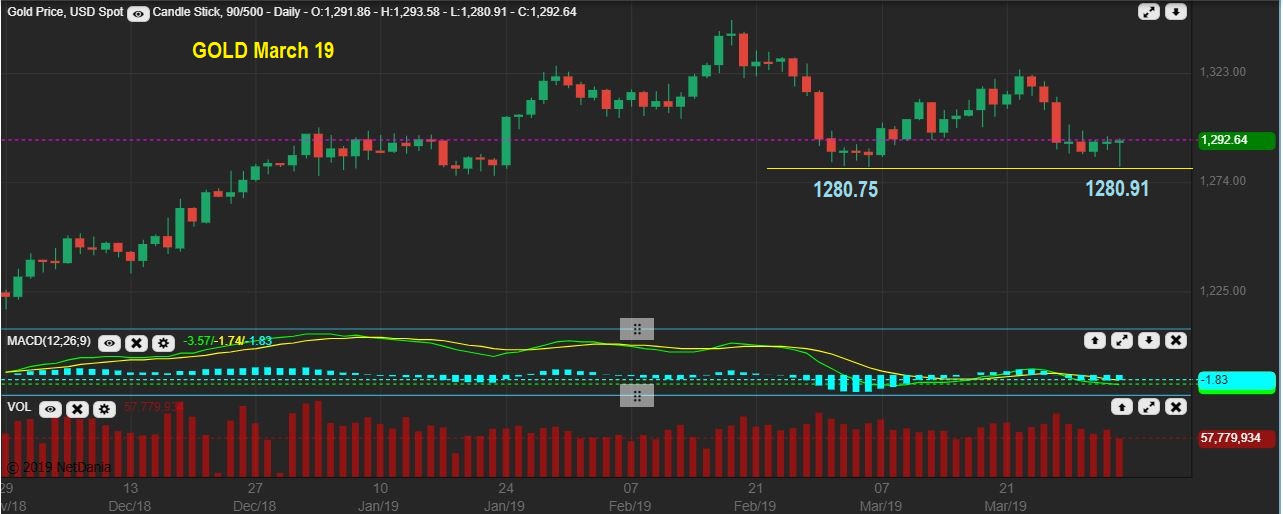
GOLD NOTE – If you look at ‘stockcharts’, their daily & weekly charts show a higher low not tagging 1280, so I will not use Golds charts from this source. Also the USD chart on stockcharts is not even close to accurate at all.
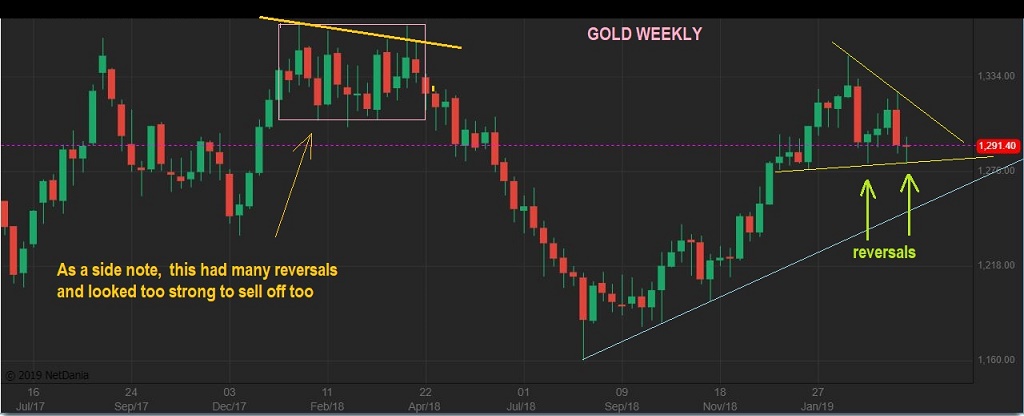
GOLD WEEKLY #1 – So here we see another weekly reversal for Gold. It is still ‘holding up well’ with a possible flag consolidation, which is often bullish. When I Look to the left of the chart, I remember that we have seen Gold ‘Holding up well’ in the past before a sell off, so I still can’t say that because Gold is holding up well and is too strong to sell off. It still may.
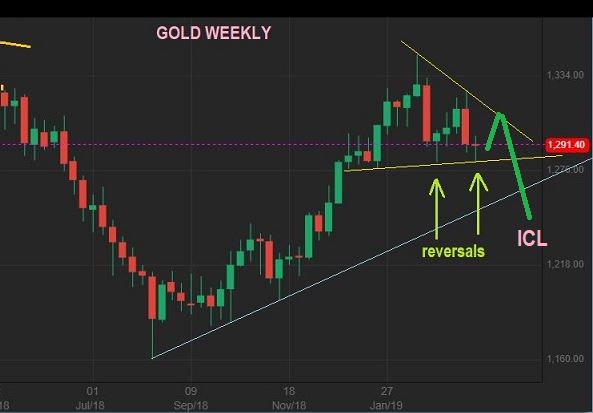
GOLD WEEKLY #2 – So we COULD still see Golds reversal bounce & then sell off to an ICL. When I get to GDX, you will see something very interesting about these ‘reversal candles’. Let’s look at Silver & Miners.
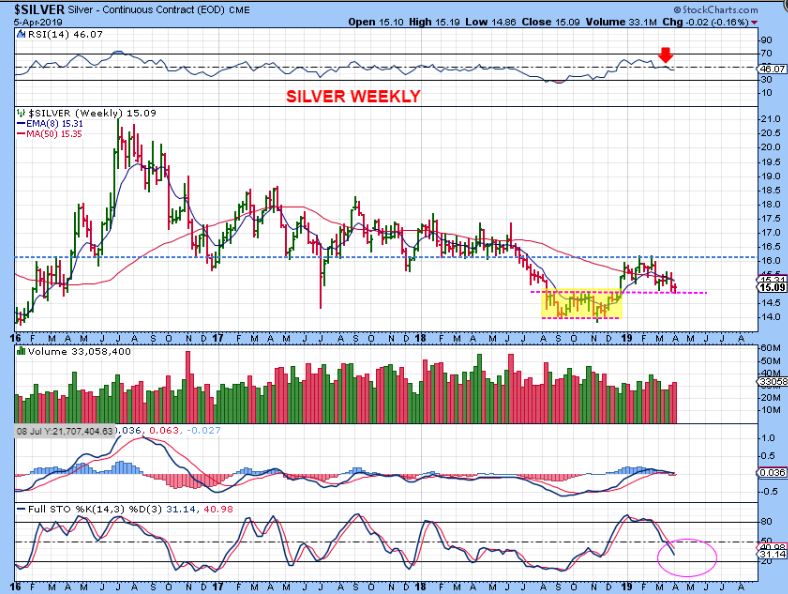
SILVER WEEKLY – Sitting on support, Silver also reversed. Silver has lagged Gold, it lost the 50 weekly MA, and the RSI is turned down under 50%. Silver is weaker than Gold.
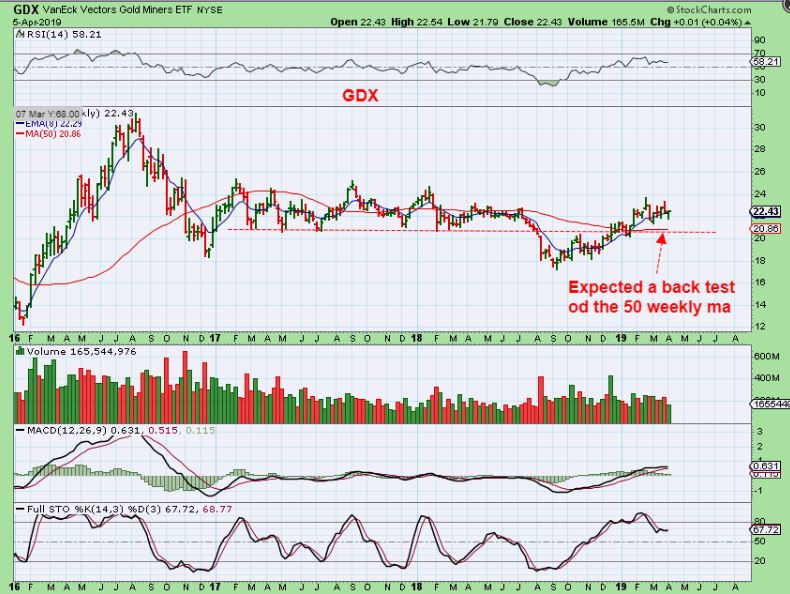
GDX WEEKLY – GDX has a weekly reversal candle. I expected a back test of the 50 weekly ma, but so far Miners sell off and pause. Let’s zoom in…
.
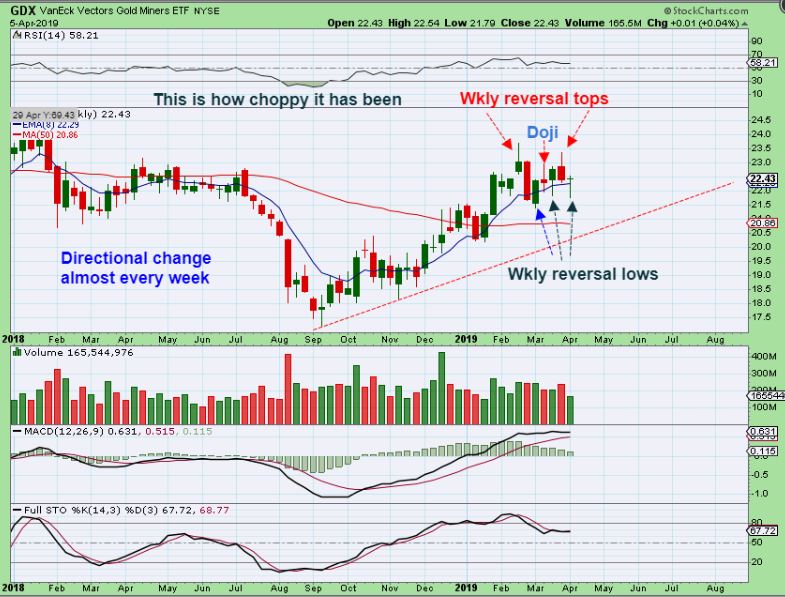
Reversal Candles- Look how choppy the Miners really have been lately.
.
GDX WEEKLY CLOSE UP – On this weekly chart, we see ‘Reversal Candle’s & a ‘Doji Candle’ almost every week.
1. A topping candle
2. A bottoming candle
3. A topping candle
4. A bottoming candle.
This is just very choppy and directionless. That said, at this point Miners are back above the 10 weekly MA with a reversal candle and you have to view it as more bullish than bearish right now. This is now 10 choppy weeks of trading.
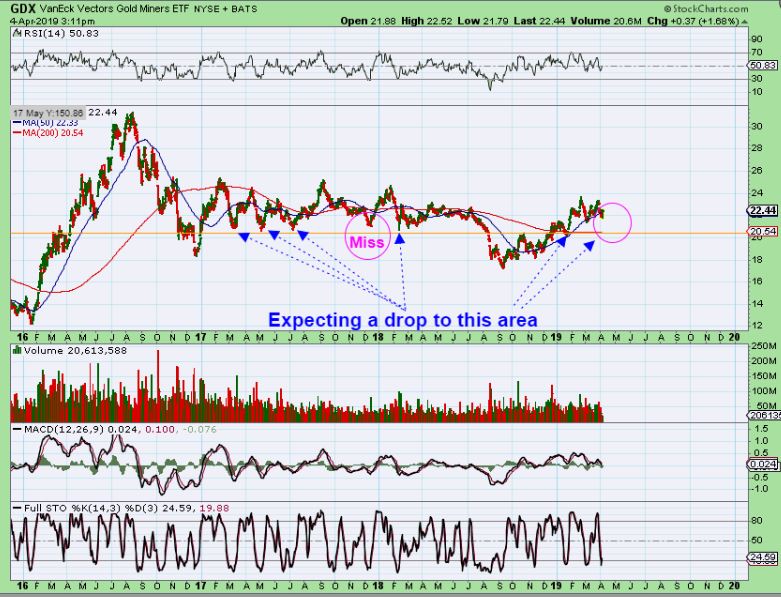
GDX WEEKLY – This was from Fridays report. I expect a drop, but 1 time in the past (at the Dec 2017 ICL), that lower support was never tagged. Stay tuned.
.
The General Markets and Oil have been climbing higher, except for the TRAN & RUT which now look like they are playing catch up. I want to remind you of something that I mentioned in the past. We have seen the markets recover after a deep sell off, and recover to new highs, only to roll over and drop shortly after. So as the RUT & TRAN play catch up, the SPX, DJIA, and NASDAQ could make new highs and then drop, since they are overbought and divergence is appearing.
The Precious Metals sector remains choppy and GDX has gone sideways for weeks with one reversal candle after another. We are due for an ICL in this sector, and as mentioned in Fridays report, there is a slight possibility that we saw a MILD ICL sell off in March. The way these markets act going forward will clarify that. if you need a refresher on what I am talking about, re-read Fridays special Precious Metals coverage.
.
That is our weekly wrap up, enjoy the rest of your weekend!
.
~ALEX
.
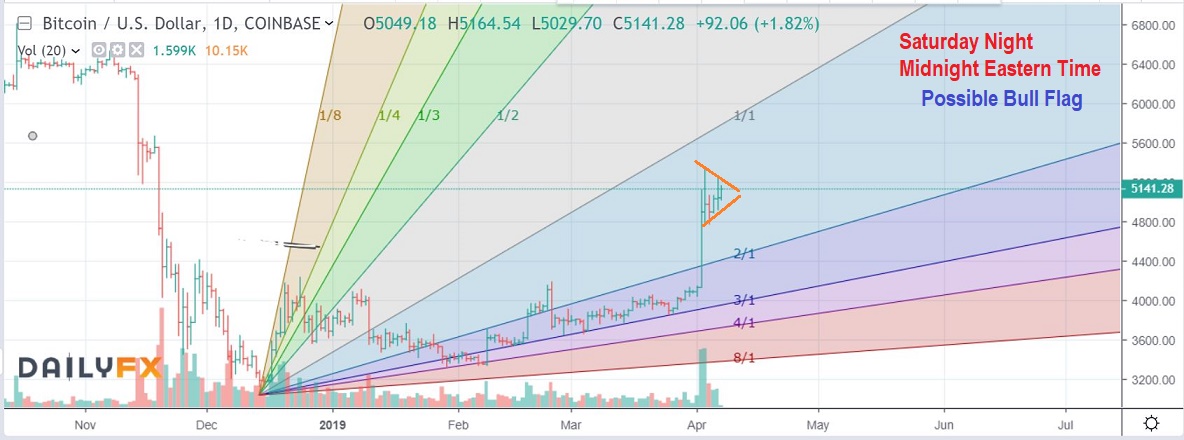
BITCOIN UPDATE – As of Midnight Eastern Time, BITCOIN is trading higher, but it could still form a bull flag. They usually break higher, but at this point the lower trend line also could be back tested if it breaks down. I am expecting a run to $6000 either way and have mentioned some Blockchain trades for the upside.