Wednesday March 13th – Fast Trades
Some of the trade set ups that we have been reviewing are resolving quickly to the upside, so it may require pouncing on the set up before it breaks out, and it also may involve jumping off of the trade or cashing in, before it pulls back. Well, that is if you are in it as a short term trade. Some can be held for longer periods of time and allow them to play out. We will discuss that at the end of the report. Let’s review the markets.
.
SPX – The SPX closed above the 10sma again, but it is also back in that resistance area. It got choppy here at the end of February, and that may happen again if it can’t break through resistance. The MACD is not breaking as strongly as price- usually indicates short term choppy.
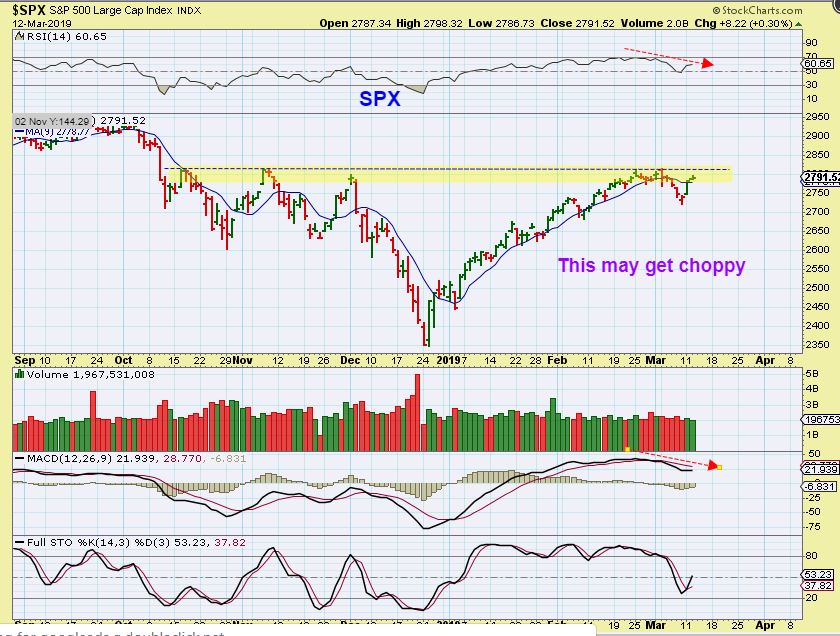
General Markets: I have a longer term ‘Cautionary’ signal for the General markets. They seem strong, but as I have been saying all along, we’ll see how they do after 2 daily cycles out of the lows and see if ‘weakness’ shows up. This could form a Big H&S and begin a bearish pull back. I just keep this in the back of my mind.
.
WTIC – I’ve mentioned that Oil looked fine, even something like a bullish flag, while the XOP, XLE, OIH dropped sharply and did not look good. Tuesday, the Energy Stocks popped and look much better, but Oil remains the same. It really needs to break higher from this apex.
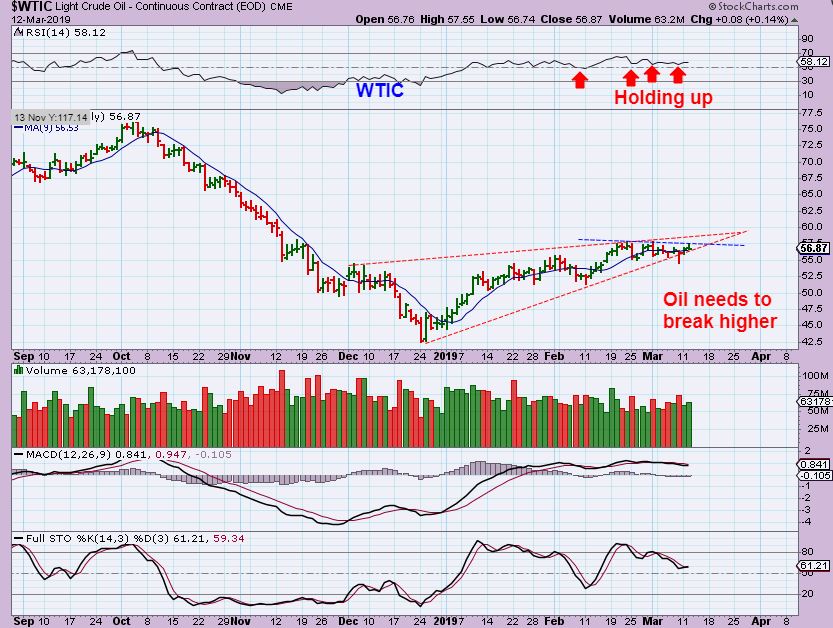
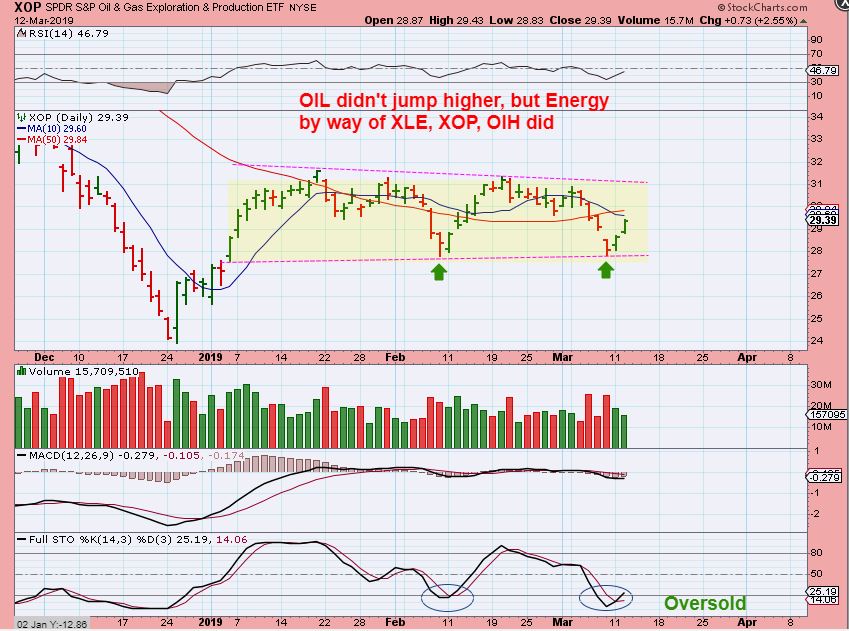
XOP – As you saw from the above Oil chart, Oil didn’t do very much Tuesday, but the Oil & Energy stocks came to life. I am starting to think that they seem to be following the General Markets rather than Oil. They dipped down in the same place that the General Markets did.
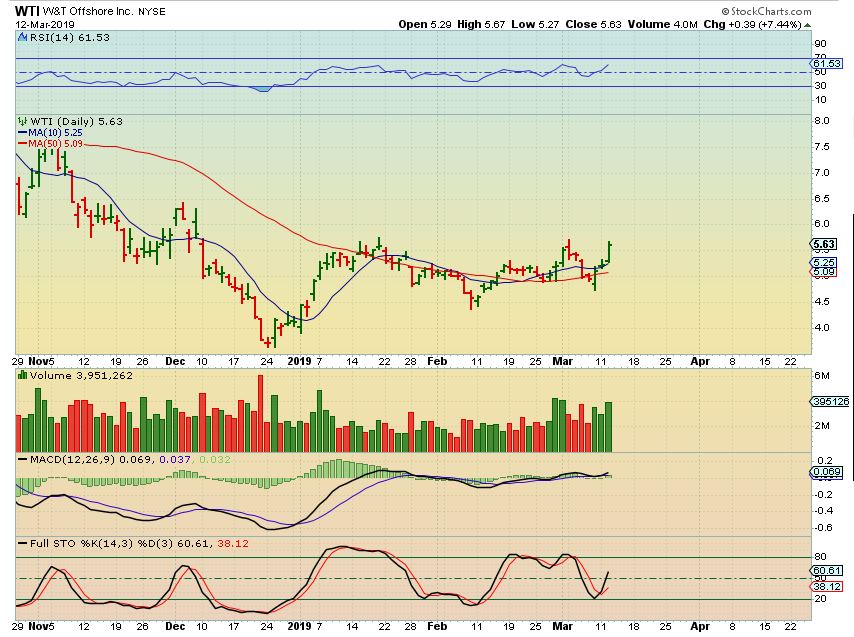
WTI – So some of these choppy energy stocks now look like a buy again. WTI is a buy with a stop LOOSELY under the 50sma, and I will mention a few more at the end of the report. This does NOT really respect the 50sma, so a tight stop is ineffective.
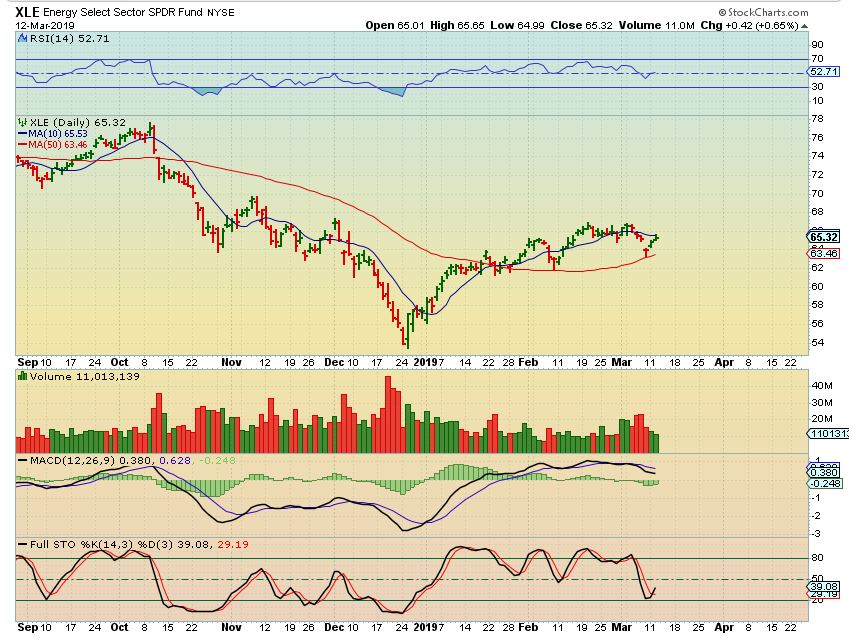
XLE – And the XLE bounced off of the 200sma and is oversold, so I do like ENERGY for at least a good bounce, many individual stocks are set up nicely. This has been acting bullishly with the 200sma, it just isn’t moving a lot higher yet, it has been choppy.
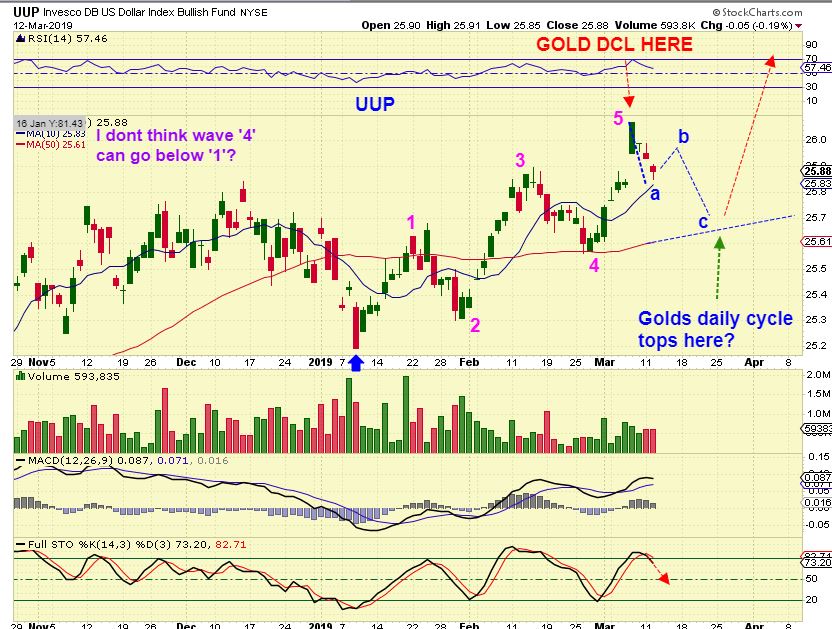
UUP – I do not think that a wave 4 can undercut the peak of wave 1, so this isn’t proper E.W., but I am just showing 3 waves up occurred and now a possible a-b-c down or maybe just a straight drop to the 50sma in UUP. Gold bottomed right where the USD peaked. The USD pulled back and Gold popped higher. This is just an idea of how this might play out.
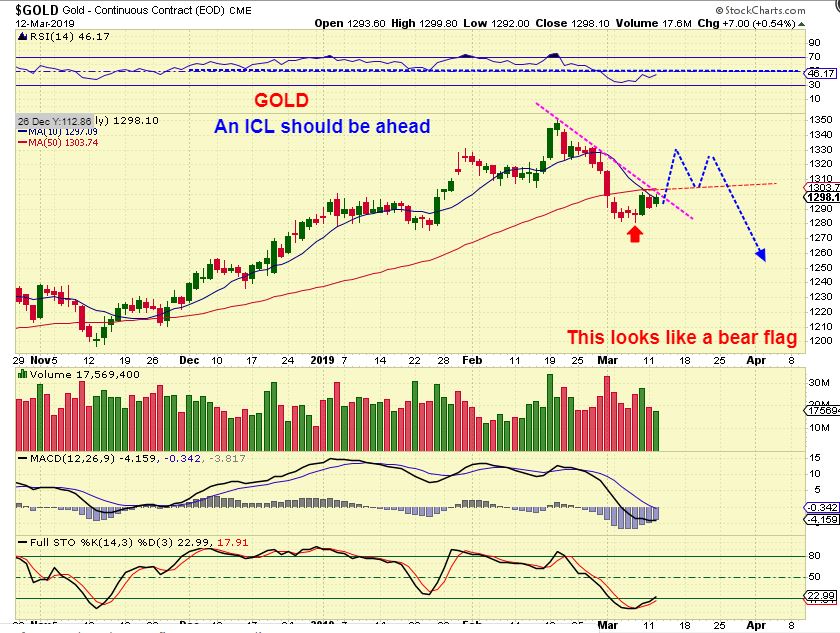
GOLD – Gold looks like a bear flag, but I would expect it to break out soon, since GDX already has. It is likely coiling under that 50sma to break through it and then we’ll see if it has strength or rolls over from there ( I am expecting an ICL) .
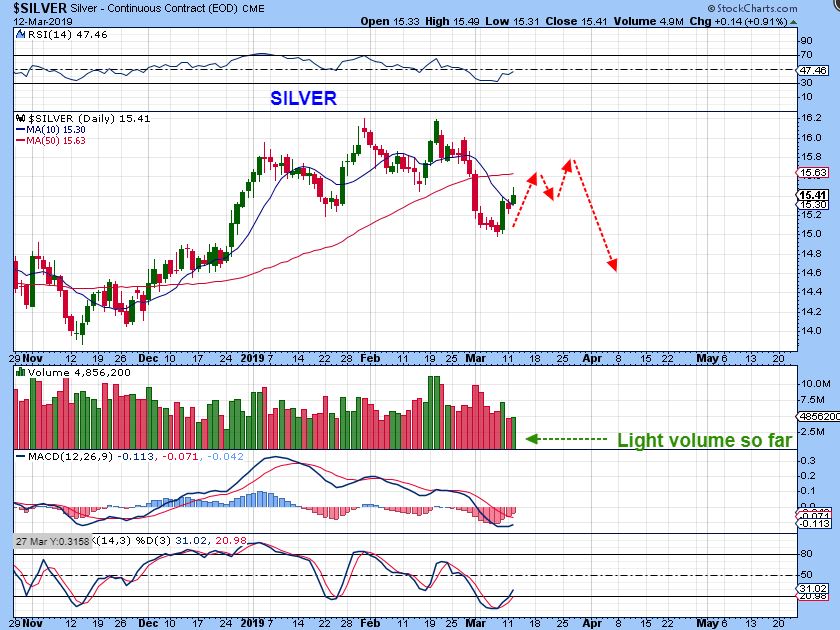
SILVER – Silver remains under the 50sma, it may not even recover until after the ICL.
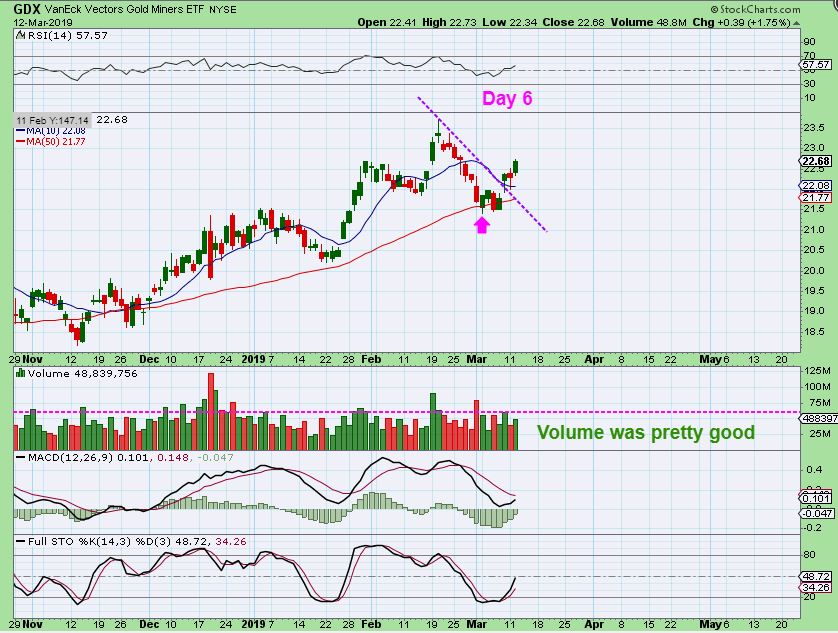
GDX – GDX & GDXJ pushed above their 10sma and the trend line, marking a dcl. GDX held the 50sma and overall I see the GDX chart as fairly bullish, wheres GOLD & SILVER are not yet.
.
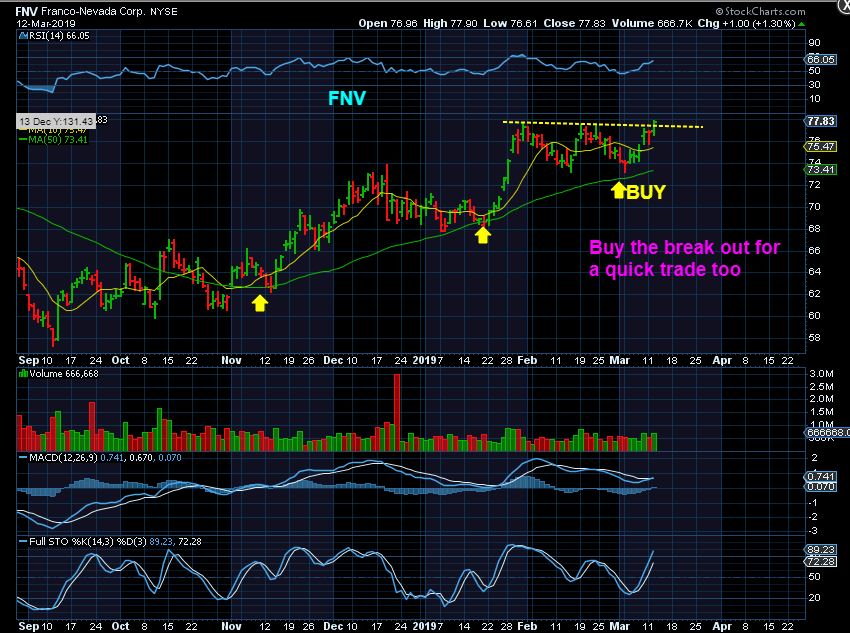
MINERS LEADING HIGHER IS GOOD. I posted GPL as a buy and it is running strong, and FNV is a similar buy now
.
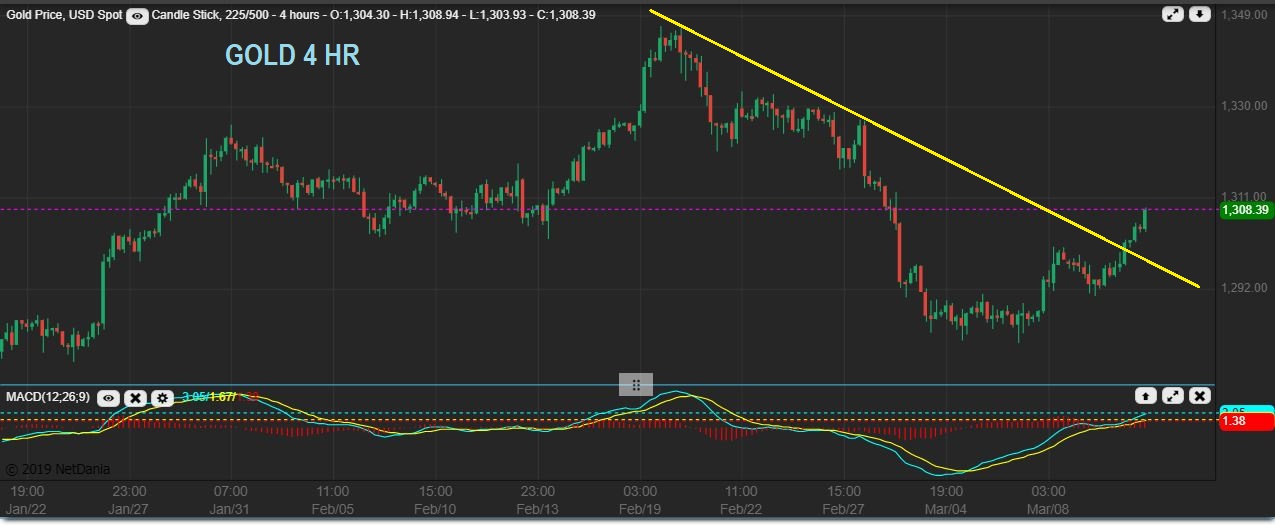
EDIT UPDATE 6:30 A.M. Eastern March 13 – Gold has broken above the 10sma overnight.
This is a 4 hr chart showing the trend line break
This is GOLDS daily chart pointing out the DCL has been confirmed ( Day 4 for Gold)
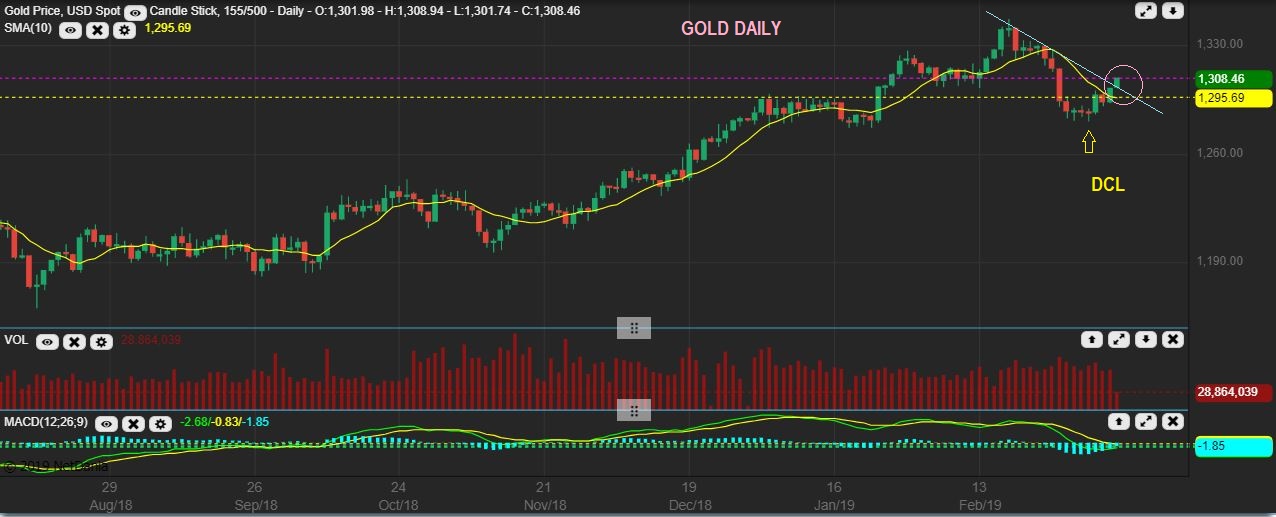
I am expecting a drop into an ICL in Gold, so I continue to watch how this plays out. I usually look for a peak by day 12 for it to become Left Translated. As for the regular trading? There was a LOT of market action in various stocks yesterday, we discussed MANY trades in the live comments, so I want to discuss just a few trades below. Remember that the Oil inventory report is released on Wednesday mornings, so this could move Oil.
.
Enjoy your Wednesday trading!!
.
~ALEX
.
Let’s start with Energy
.
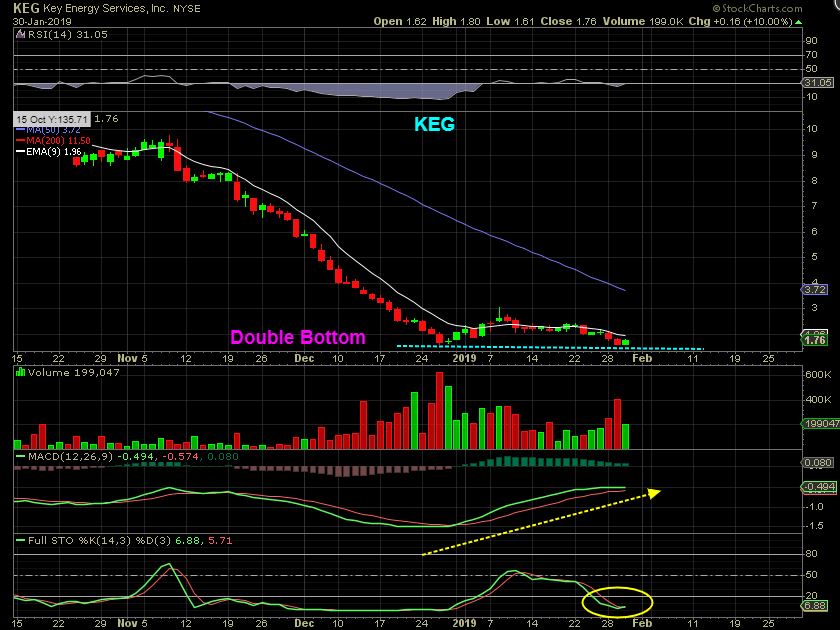
To see how these can play out longer term, lets go back to KEG.
KEG – This was pointed out as a double bottom in January. The MACD was VERY bullish as well as the RSI and it was oversold. Buy it if it pops above the 10sma.
KEG – Earnings came out & KEG popped as a buy above the 10sma at the end of Feb. It then flagged at the 10 sma. This was a buy yesterday too, and it closed up 20%. This may be long term BUY & HOLD, because it can continue to climb the 10 sma like this. In fact, this chart looks like KEG can run from that $1 to $10 again. With that in mind, lets examine some others double bottoms …
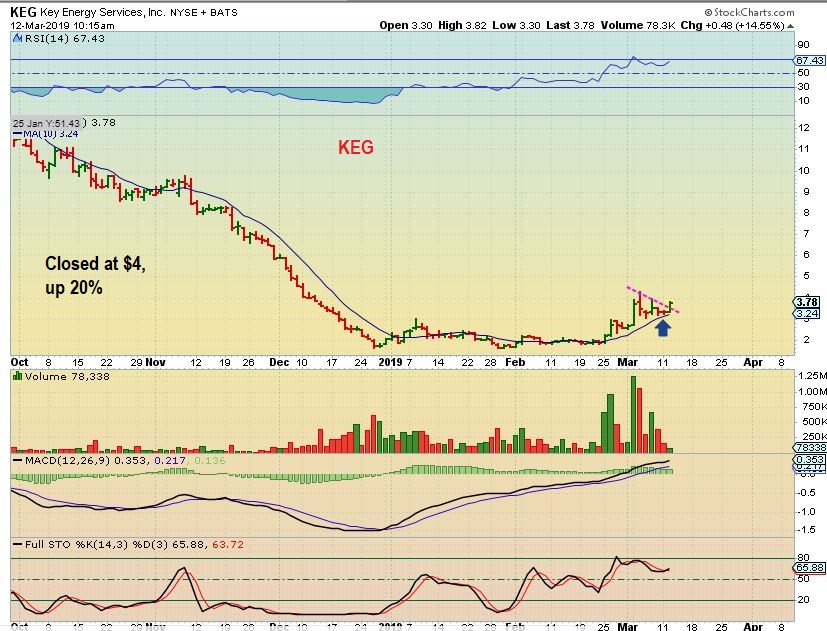
With that in mind, lets examine some others double bottoms …
.
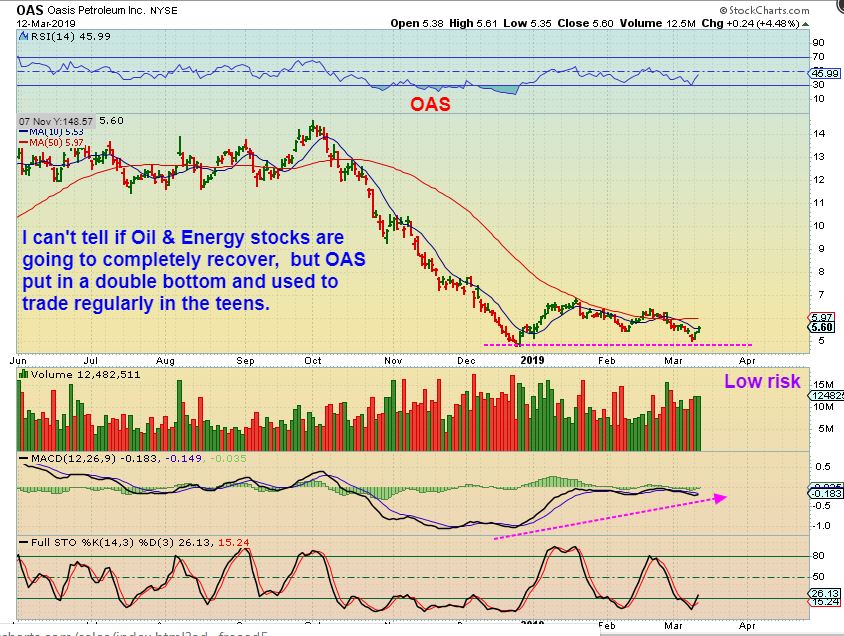
OAS March 12 – This had FEB 27 earnings release, so that is behind them. This is oversold, has strong divergence, and I used to trade OAS in the $10 are for a long time. It may go back there if Oil & Energy stay healthy.
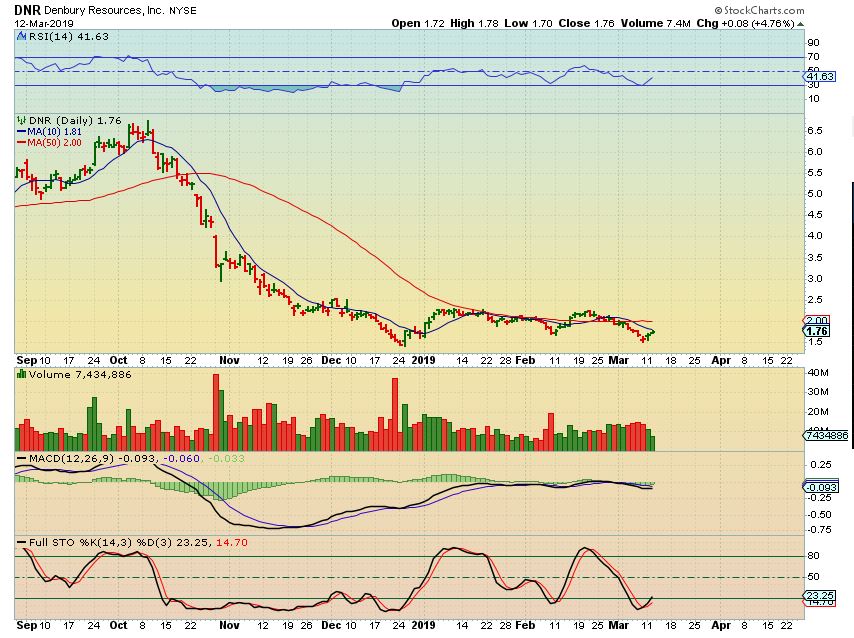
DNR – DNR released earnings Feb 27th also, and this is an oversold double bottom too. I is turning up, and just needs to push above the 10sma as a buy (Maybe the 50sma for those that want further confirmation) to put on a more bullish look, but the RSI is not dropping to new lows and the MACD has been steady.
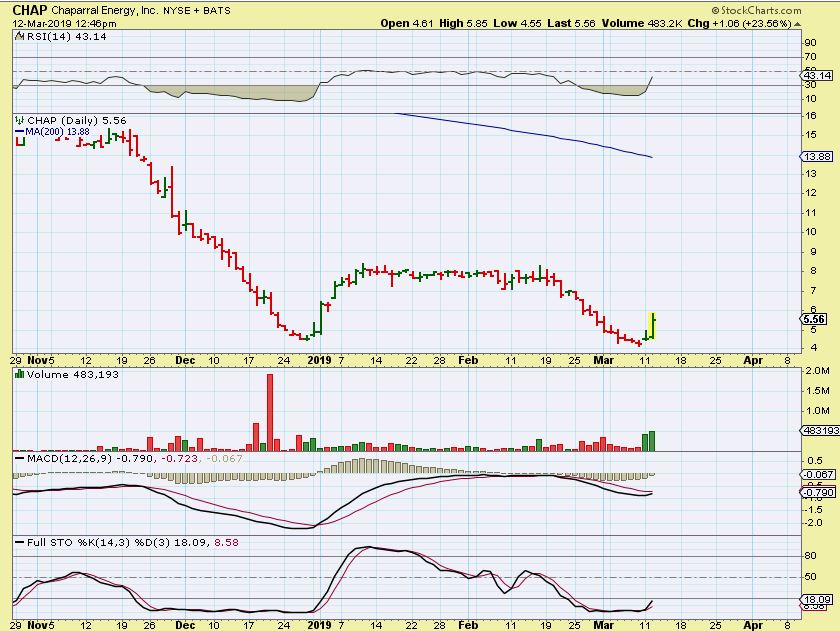
CHAP – What a nice double bottom Pop of 23% on Tuesday. When it popped in December, it then followed through to $8. That was $4 to $8, and this pop was 44 to $6 in 2 days. It looks ready to run higher over time, and this could run much higher. Earnings was in late Feb.
WTI – This has already been holding up well and is a buy with a stop LOOSELY under the 50sma.
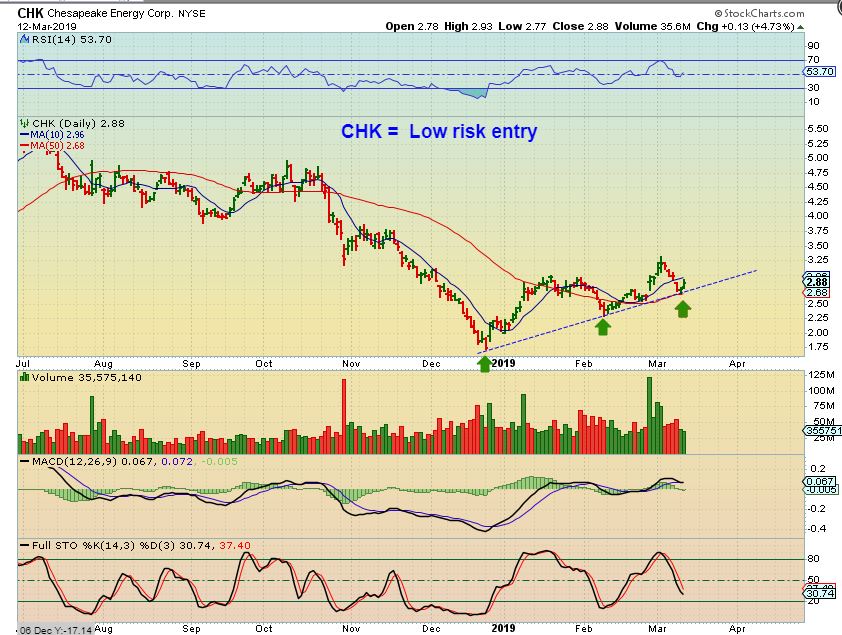
CHK – On the support of a trend line and the 50sma, I would call this a low risk entry ‘buy’ right now.
.
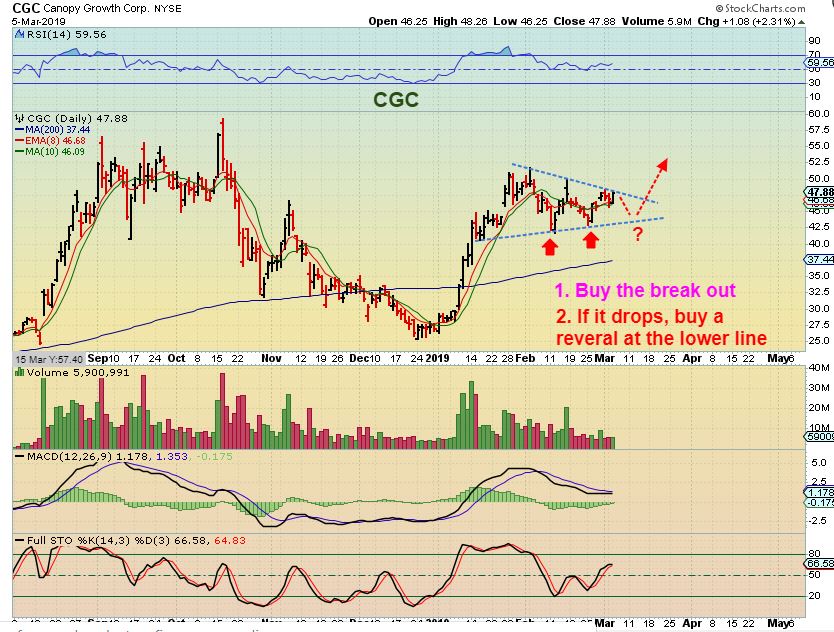
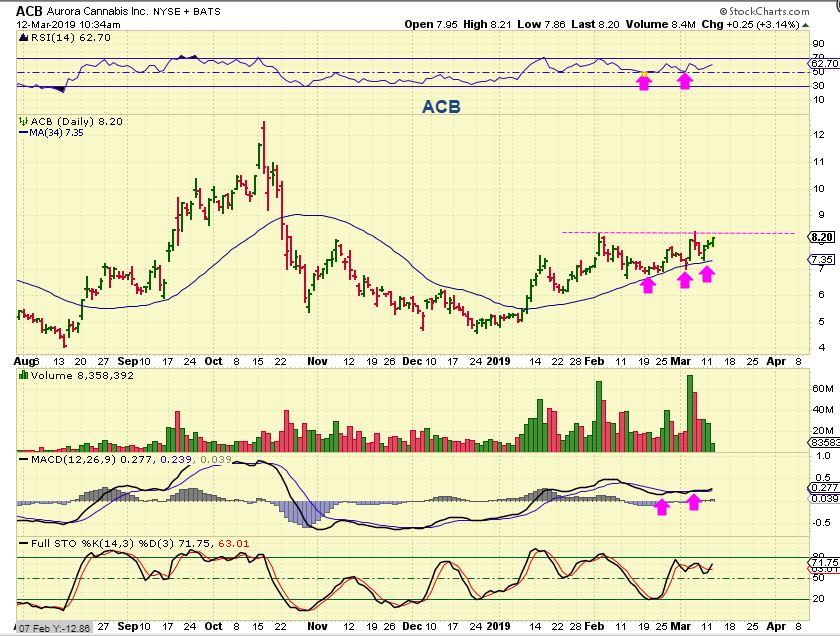
KEEP AN EYE ON CGC– It DID drop as shown here and may be ready to break out NOW. It is a buy if it does.
I also still own ACB. This was yesterday after an hour of trading, it is near its 4 month highs.
PHARMA CONTINUES TO PLAY OUT NICELY
.
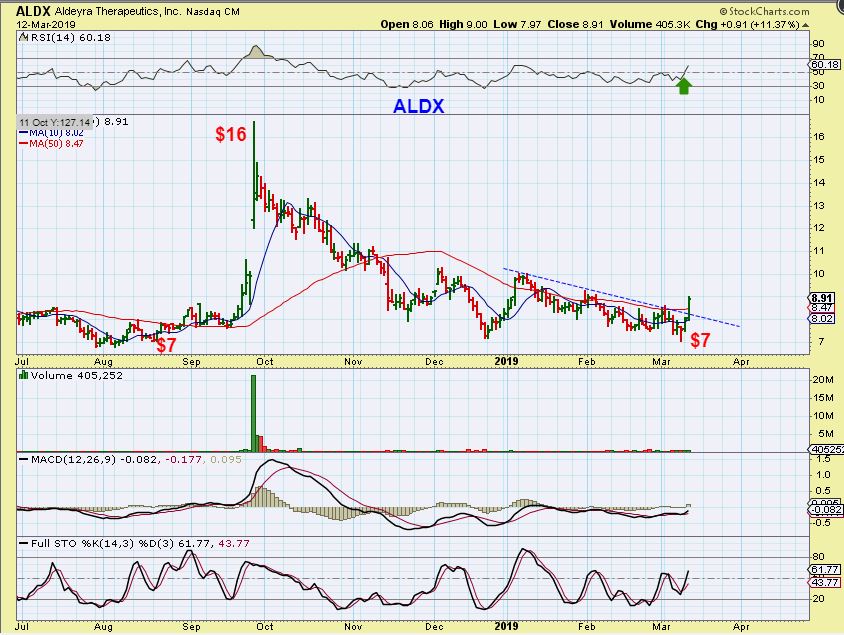
ALDX – Look at this chart and you can’t help but notice how quickly this could double if it runs swiftly. That is a break of the down trend, and earnings already came out last week.
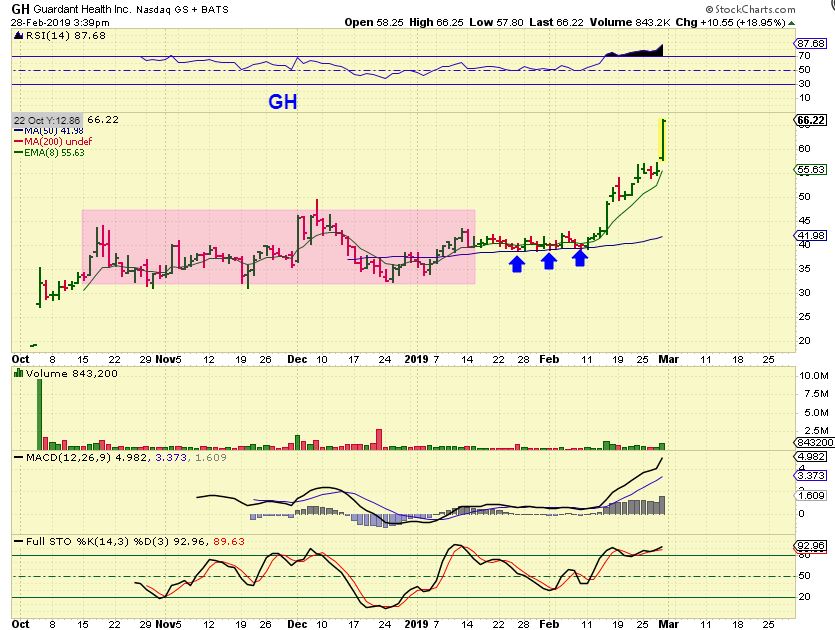
GH – This is worth showing again, and I AM SHOWING THIS FOR A REASON. This BASE broke to new highs in February. That was a very tight consolidation along the 50sma, this was very bullish, and I didn’t hold it long enough. Breaking to all time new highs is bullish, there are no sellers….
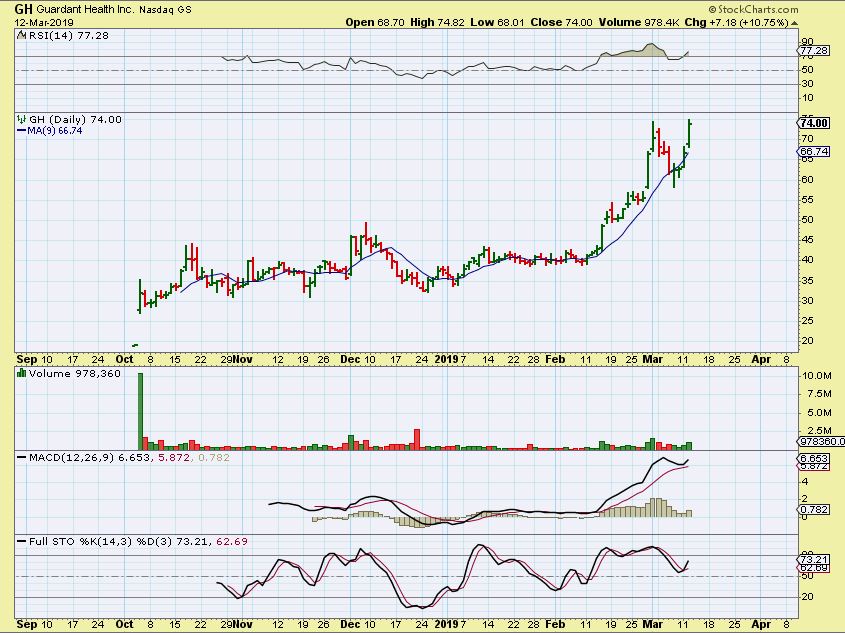
GH – Hello $74. A break to new all time highs, out of a base, with increasing volume, can be a great winner. SO…
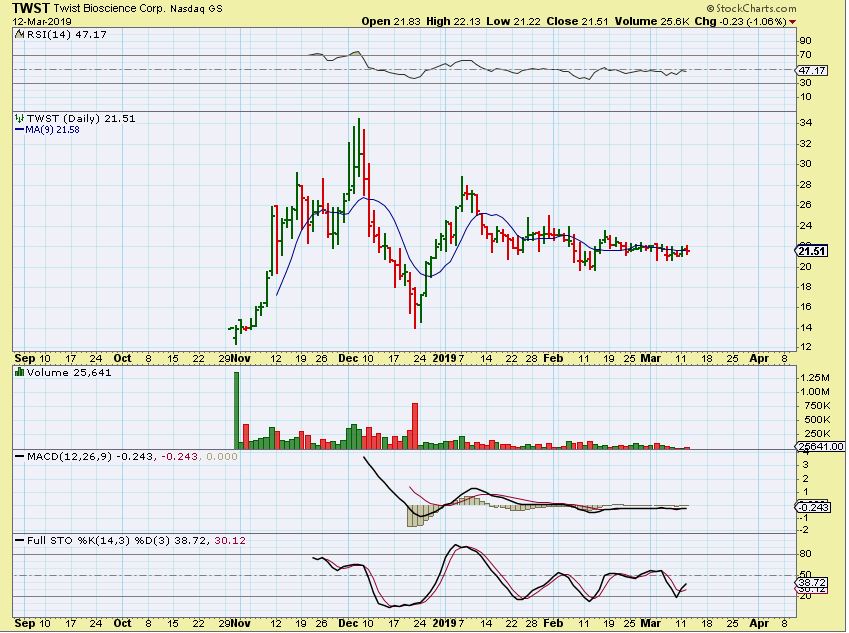
TWST #1 – I check this one out almost daily. $12 to $34 in a month??!! Now coiling. If this Tight consolidation ever breaks this consolidation and I am out to lunch or something, Please let me know please!!! 🙂
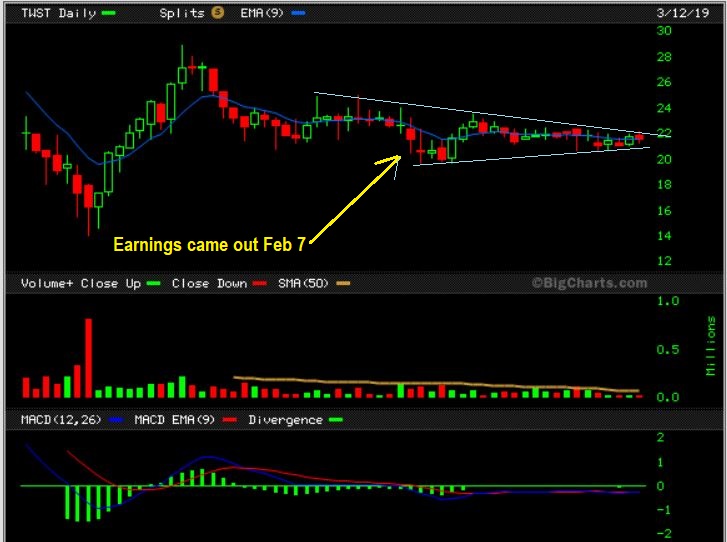
TWST #2– EARNINGS HAVE BEEN RELEASED – THIS COULD POP TODAY, I HOPE TO CATCH IT IF IT POPS HIGHER
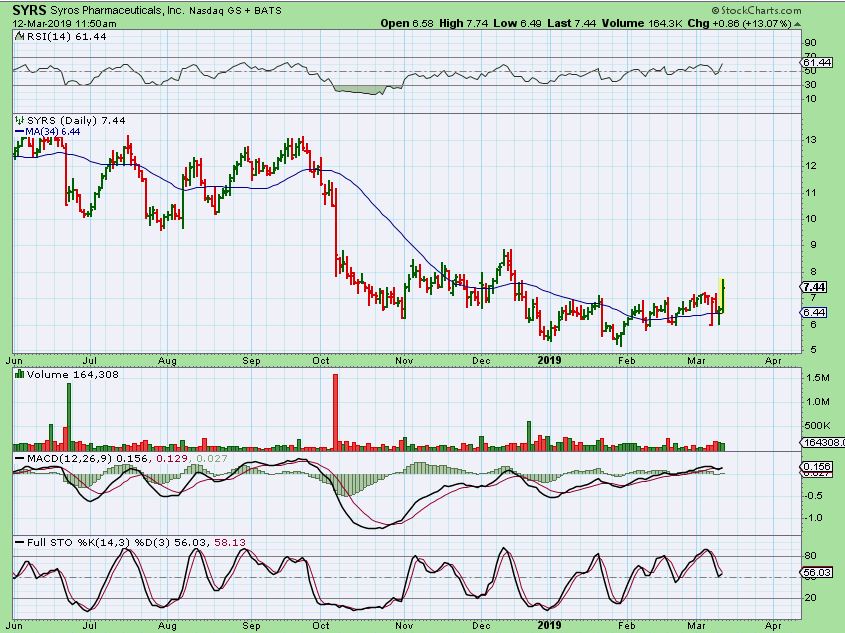
SYRS- Earnings are already out and breaking from this base yesterday. Is it done chopping around or will it base out further? It looks ready to go and could add some nice gains as it does.
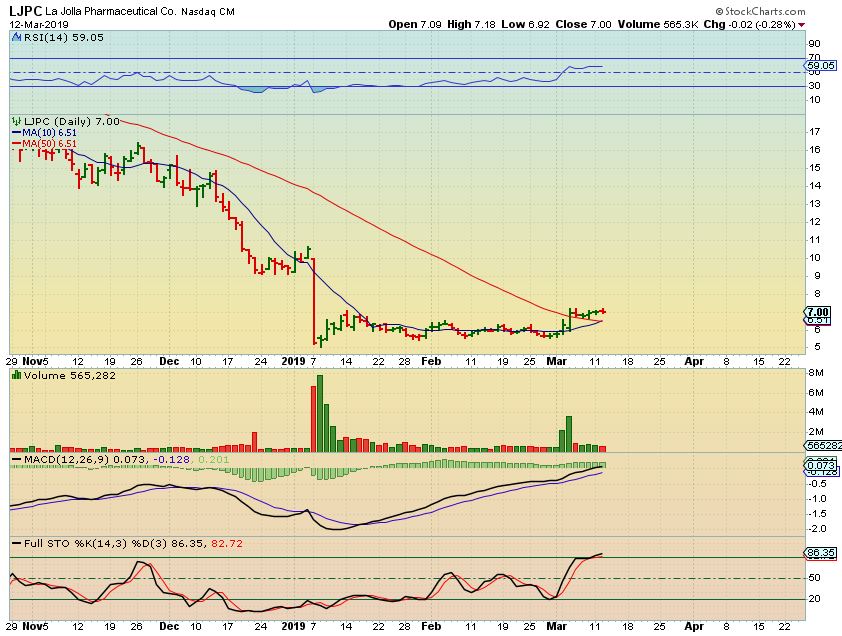
LJPC – Earnings are already released here too, but I have owned this for a while now as it meanders sideways. Just when I get bored and sell, it will break out and run 🙂
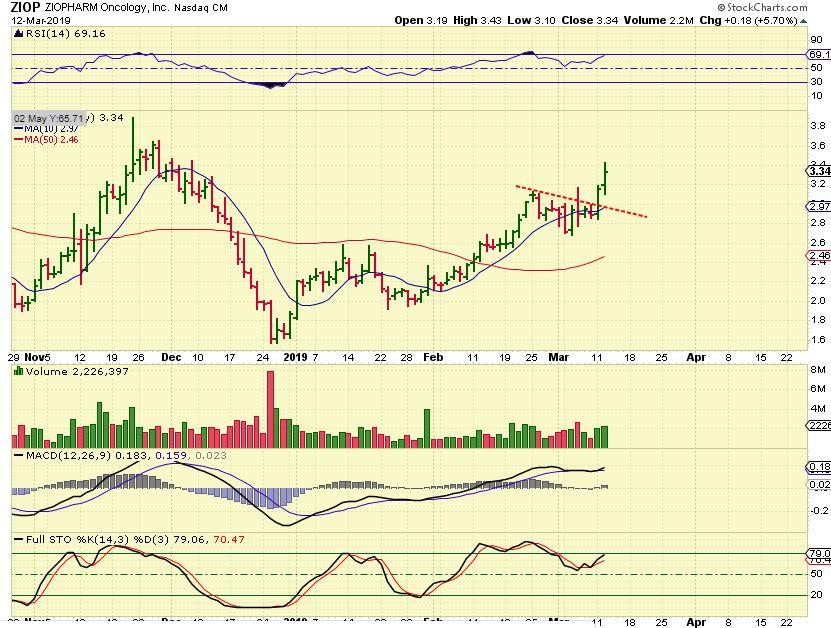
ZIOP – This was in yesterdays report as a buy, Earnings are already out here too
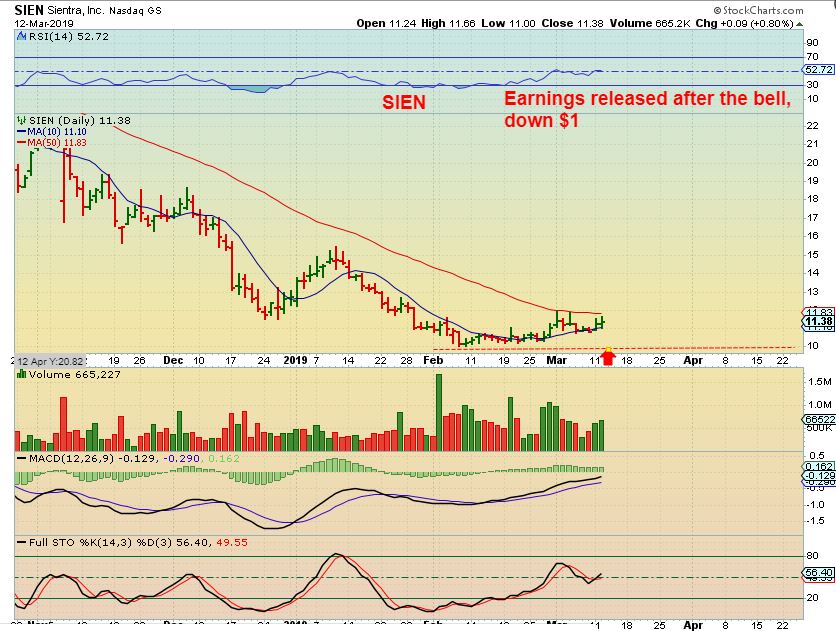
SIEN – Watch this one today. It released earnings & dropped $1 to the lows. Read the chart.
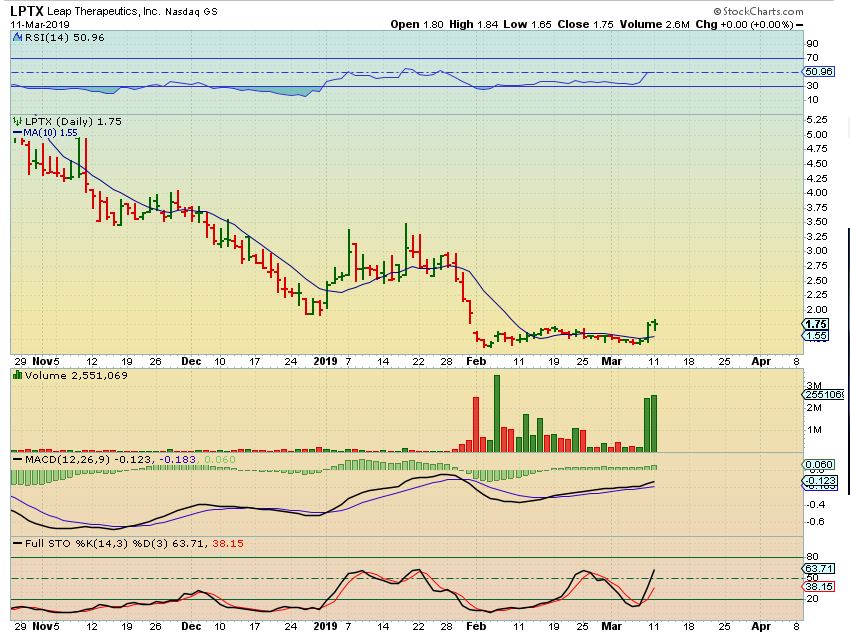
LPTX – I posted this pre-market in the live chat area as one that I have been watching. I liked the volume as it pushed from the base. You know I like a nice base with some solid volume pops and a few other bullish traits. It actually opened up about 5 cents and then ran straight up.
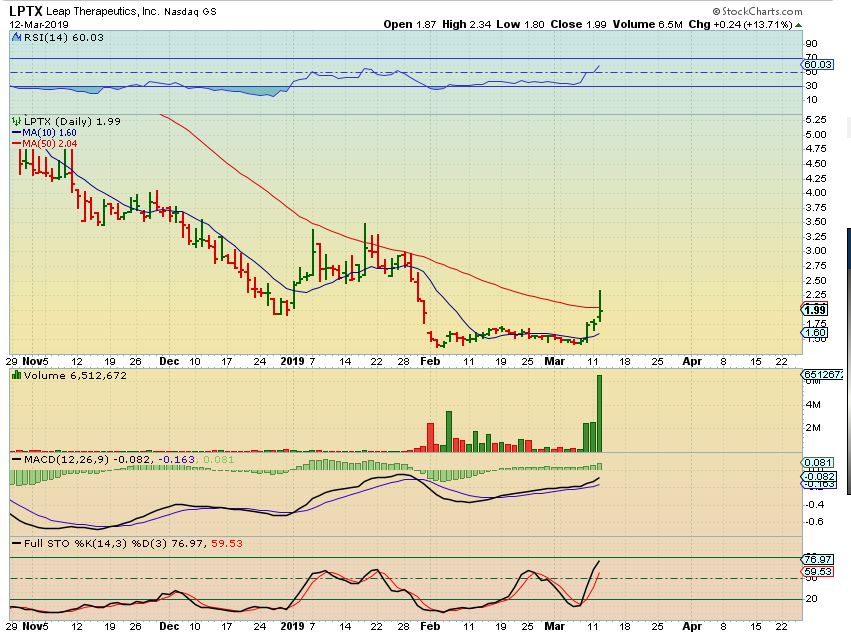
LPTX – Look at that volume now! By the close it dropped back below that 50sma, but I still like this. That volume was massive and it could just continue higher Wednesday.
.
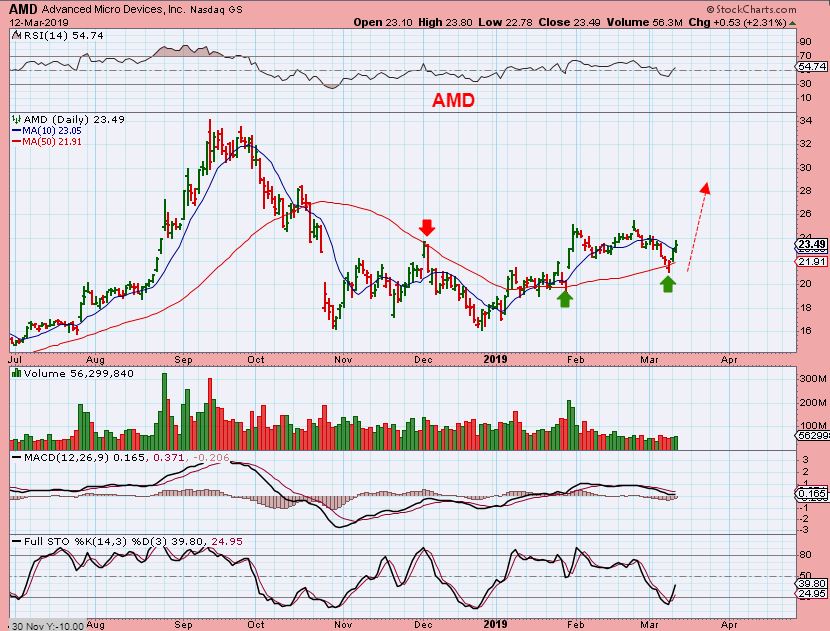
AMD – I’ve mentioned some TECH set ups in past reports, like VIPS, SQ, MU, etc, so let’s throw in 1 Tech set up here too. AMD bounced off of the 50sma and broke that 10sma. This has the potential to run to the $34 area if the markets stay healthy. Find out if earnings came out & this may be ready to buy.