March 7th – Market Thoughts
I want to discuss a few things as we go through our Market Review today, so let’s dig in…
.
These first 2 charts are from yesterdays report:
.
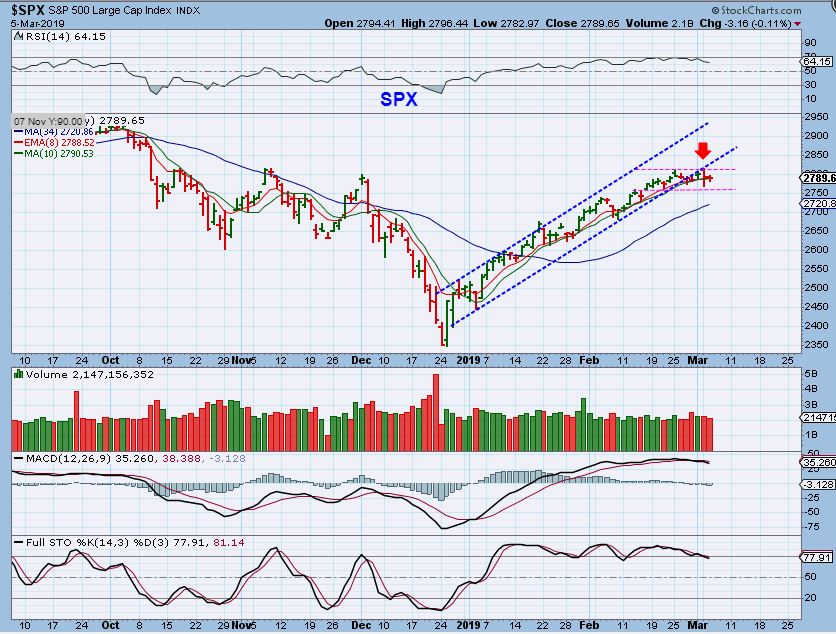
SPX – The SPX has broken down from the channel, the gap open seems to have back-tested it Monday, and I still think that we are coming due for a dip, plus…
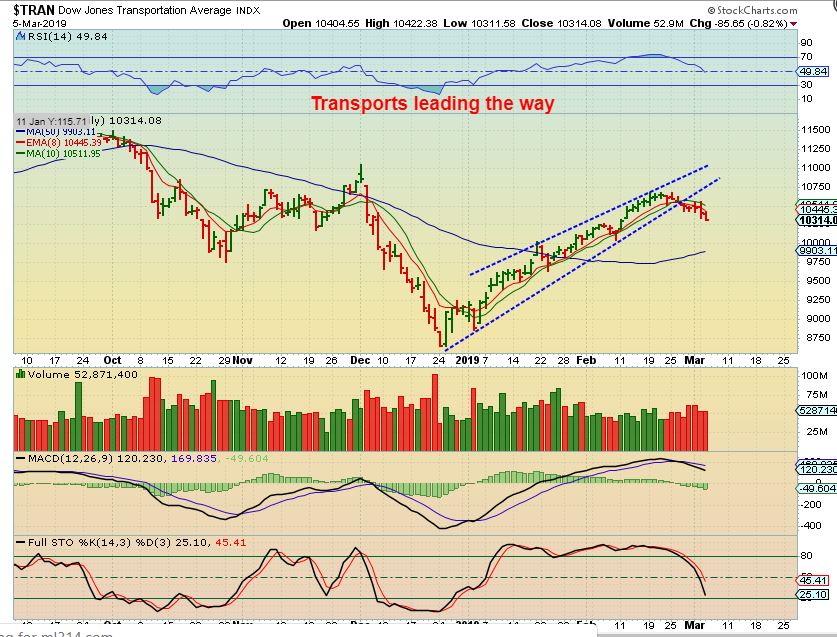
TRAN – The Transports have been leading the way and may eventually drop to the 50sma.
.
AS OF WEDNESDAYS TRADING:
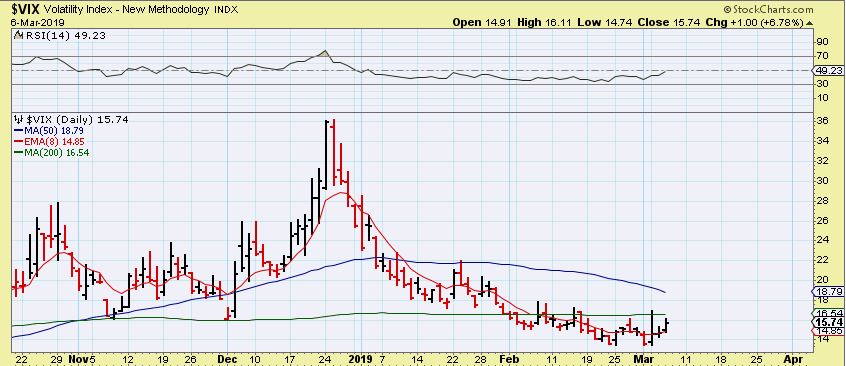
VIX – I also discussed the somewhat steady VIX, and mentioned that I think we are due for Volatility & a drop in the markets as the Vix Pops, so I had started a starter position in SOXS. The Vix looks ready to rise.
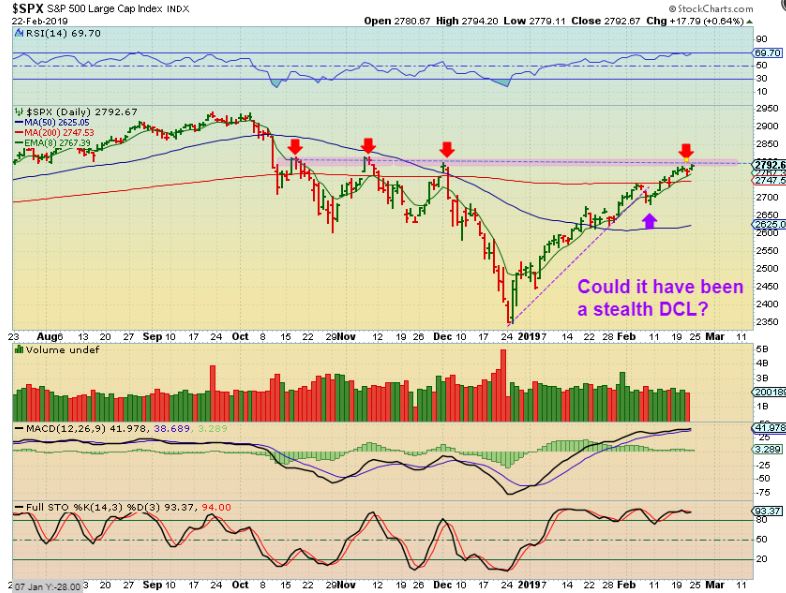
SPX FEB 22– I highlighted resistance, and we have been pushing on this resistance for weeks, and it has resisted upside movement. You may recall that I looked at the DAX & NIKKI and saw a clear drop on those charts & wondered if we saw a dcl midway.
SPX – On Wednesday the SPX closed under the 10sma and should continue lower to a dcl . Is this the long first daily cycle or the second? It isn’t clear on this chart, it looks like all one daily cycle. If it is all one, we are close to timing for a dcl, maybe the 50sma. If this were the 2nd daily cycle, we have a lot of time left in the drop. I’m watching for a swing low to help identify things as time goes on.
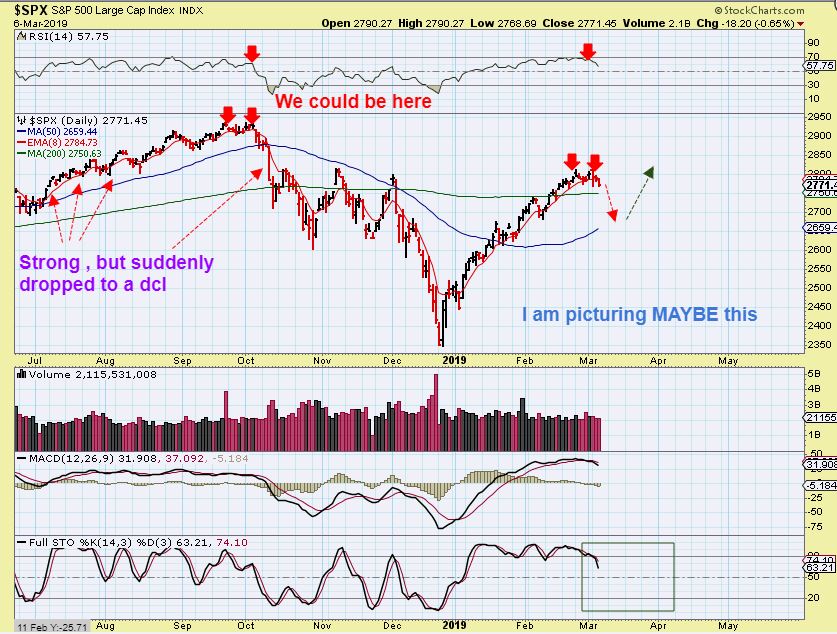
Another reason that I would expect a drop in the SPX is…
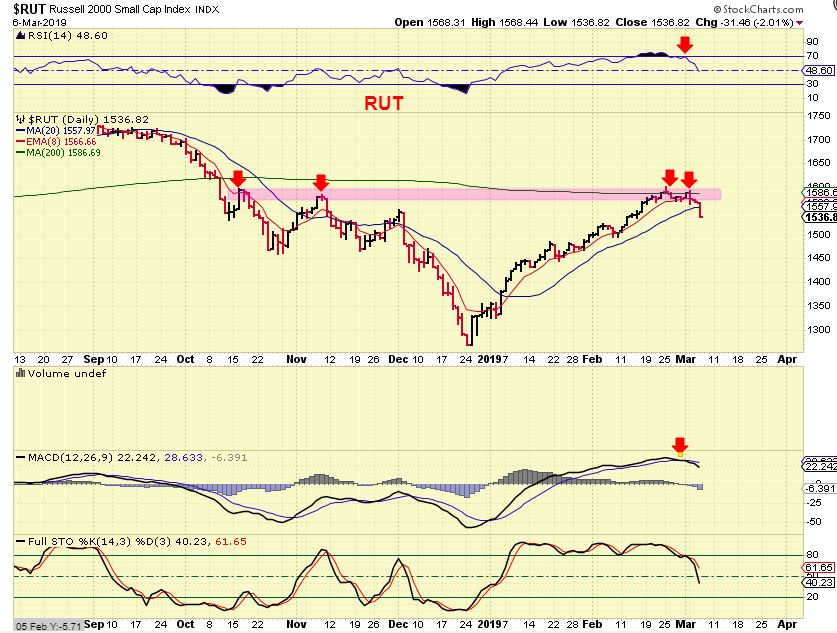
RUT – The Russell 2000 is leading the way down after pushing against resistance too. This also really looks like all one daily cycle.
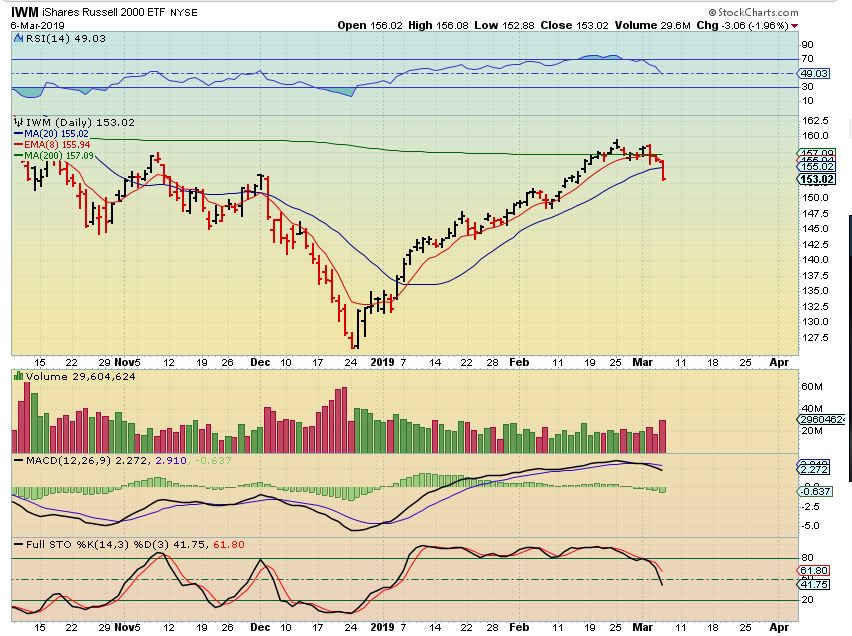
IWM – This shows us the volume and it increased as price dropped sharply. Notice the 200sma was resistance too.
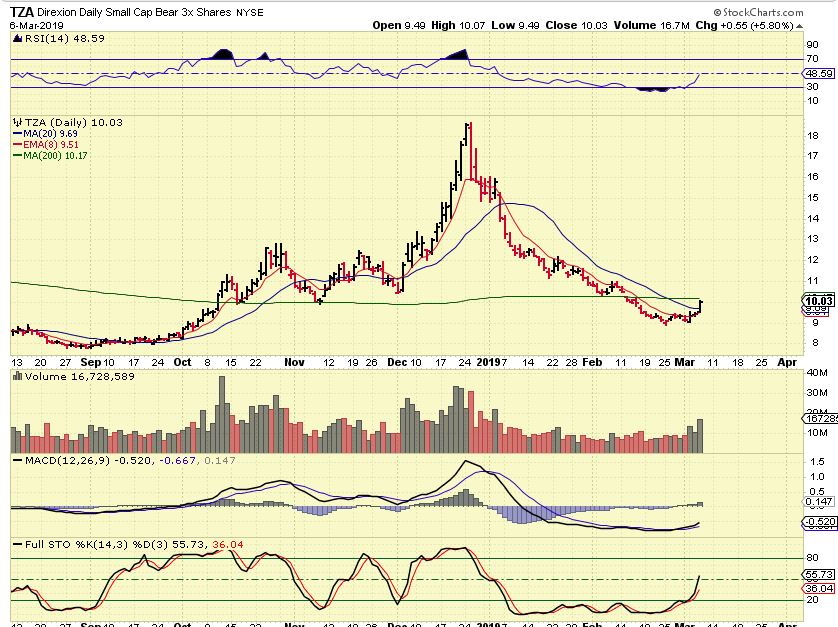
TZA – So you can see what the small caps 3x etf Bear has done. It actually looks like it is going to break out above the 200sma
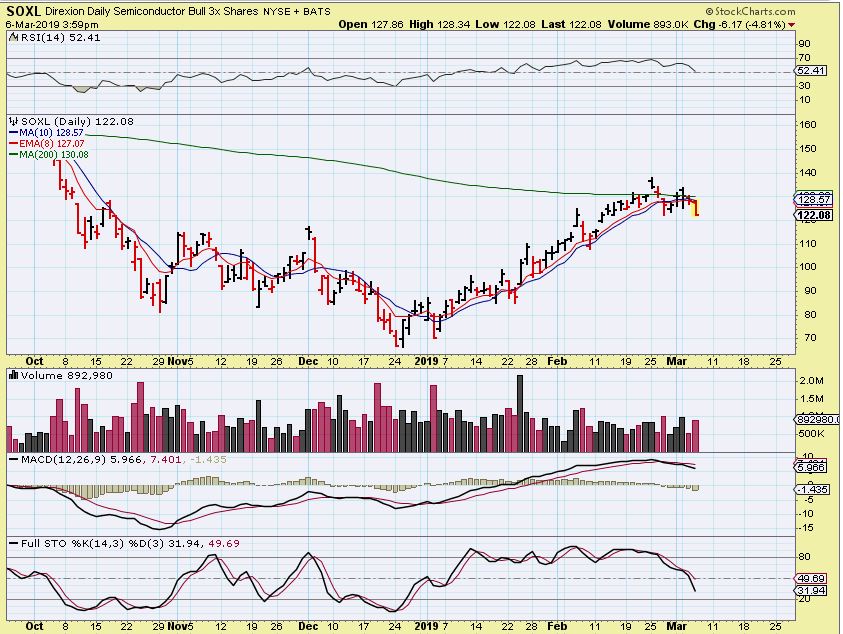
SOXL – I took a look at SOXL and it clearly looks bearish short term, so …
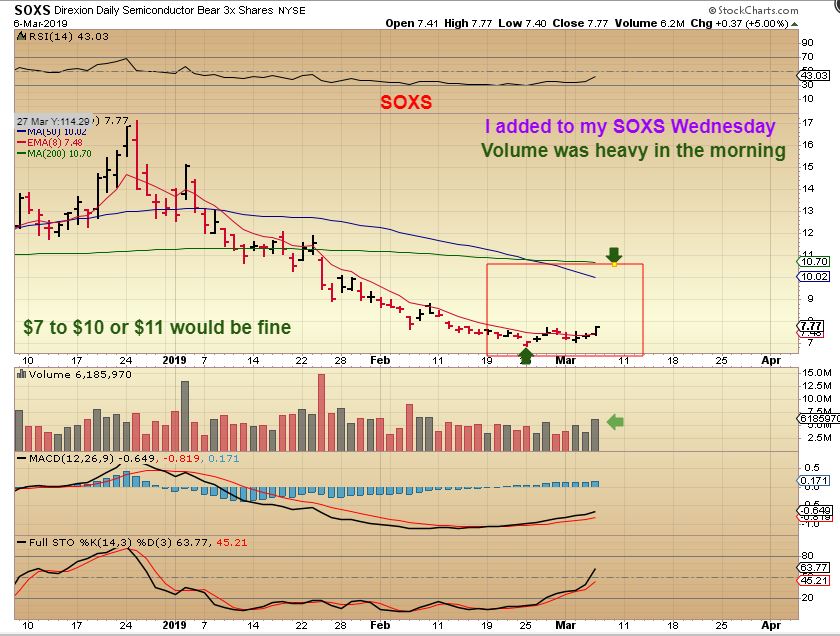
SOXS – Expecting this drop in the general markets, I added to my SOXS and posted that in the live area Wednesday morning. I would love a good run higher, but I’ll be watching the 50sma on the SPX, DJIA, NASDAQ, SOX more than this chart.
.
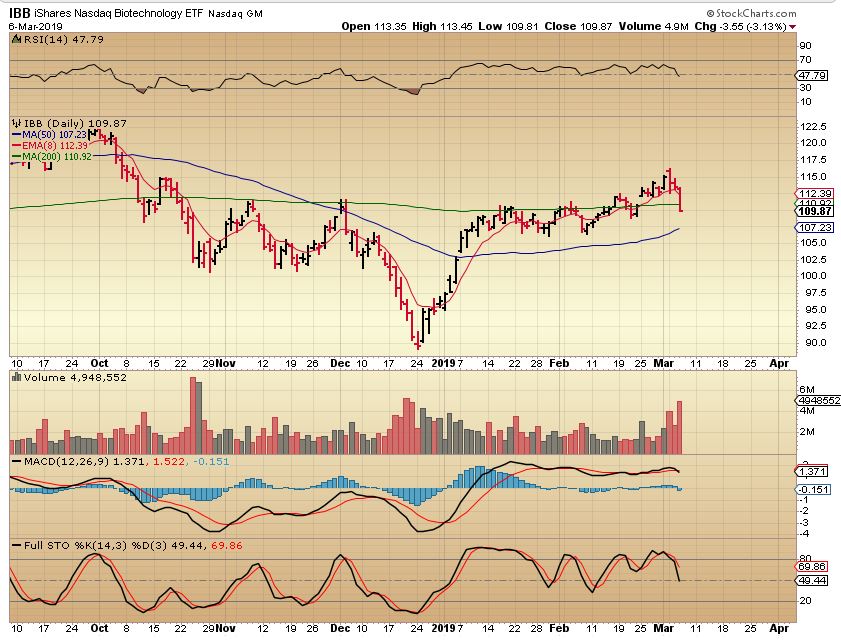
IBB – On March 4th I posted my concern for Biotech with this reversal. I still see INDIVIDUAL Biotech stocks set up Bullishly, but this sector as a whole looks ready to drop.
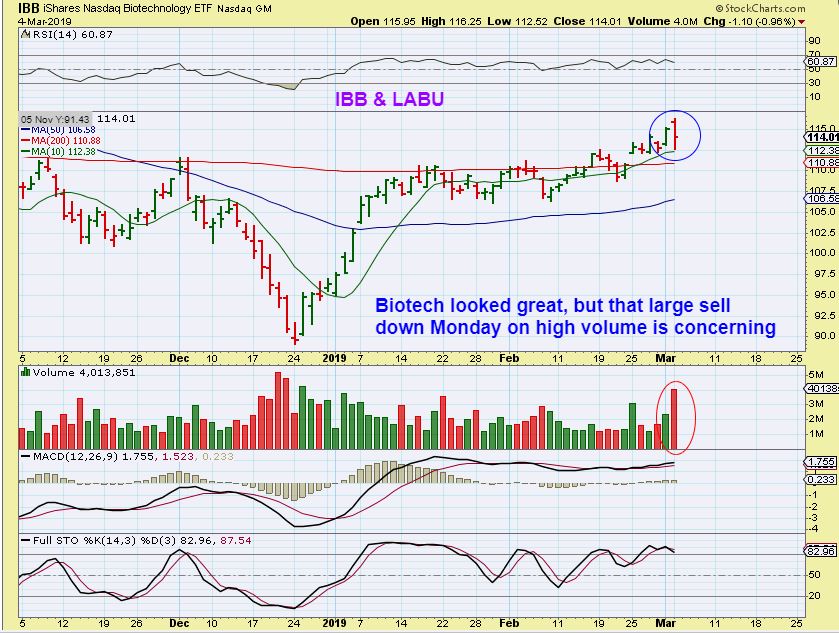
IBB – And it did. Volume was big too. Some individual Biotech Stocks still broke higher, but the ones that dropped dropped pretty sharply after this.
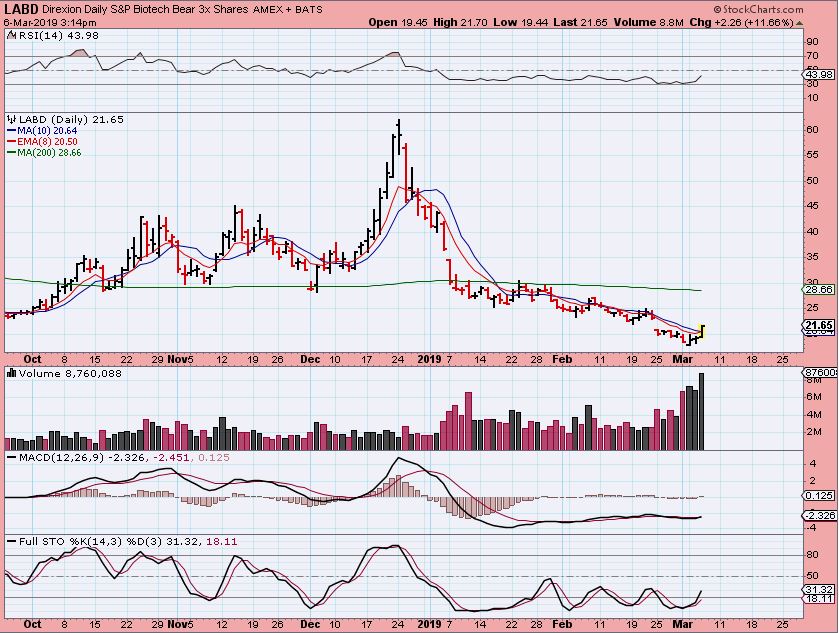
LABD – Look at the volume in LABD. That looks like a bottom. This looks like it could run to $30 (ish)
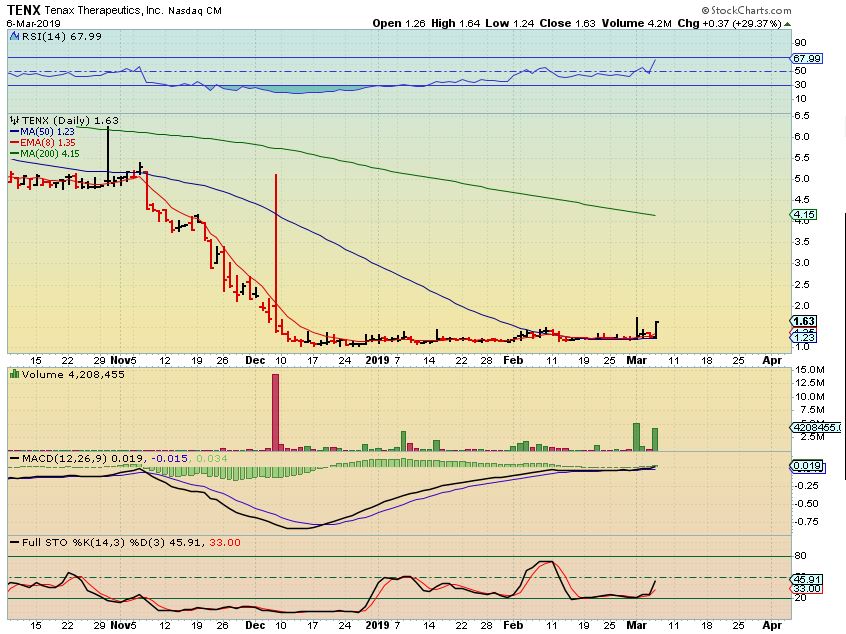
TENX – Oddly enough, I mentioned that I owned this and I added early in the morning Wednesday. It closed up 30%, but the sector seems ready to drop. I love the base, but with IBB dropping, I’m not sure how long I should be letting this one play out. So far TENX Did NOT follow the selling. I also still own LJPC.
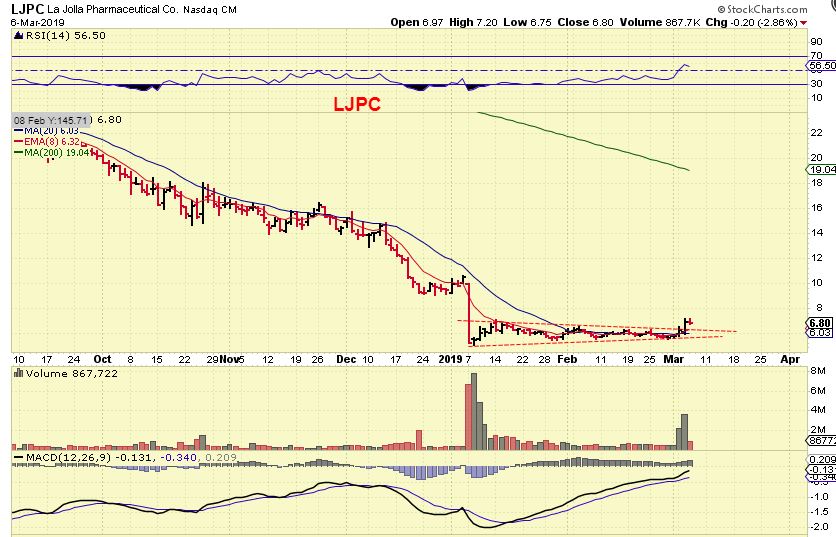
LJPC – After earnings, it had a great Pop and a small drop yesterday. I didn’t sell yesterday, but when I saw those IBB &LABD charts, it certainly looks like this sector will join the markets sell down.
.
I HAVE BEEN CONCERNED ABOUT OIL & ENERGY LATELY, AND MENTIONED THAT I AM OUT.
LET’s TAKE A LOOK…
.
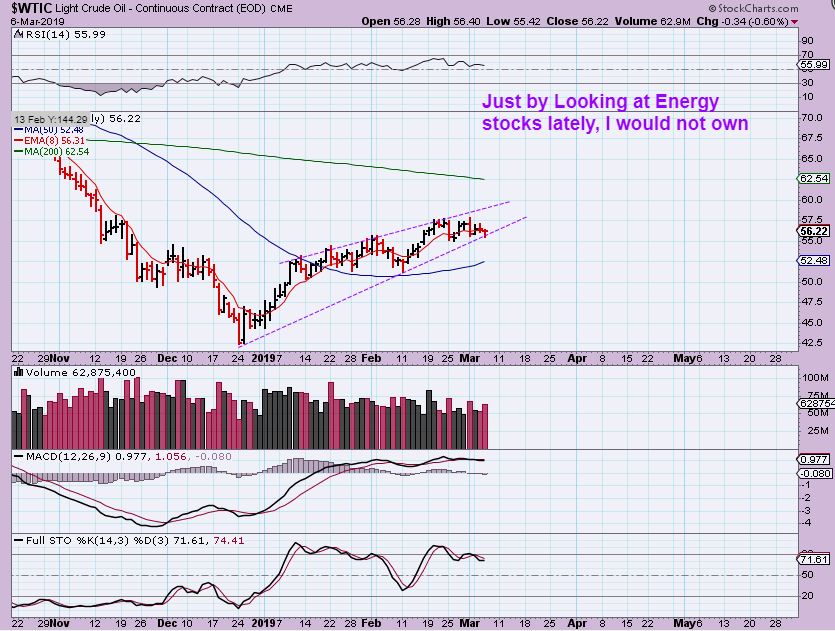
WTIC – The chart of Oil doesn’t look too bad at a glance, it looks like a Bull Flag actually. It can pop higher, but I do see a bear wedge possibly forming in the purple trend lines and the volume in the price drops ( Red volume) are growing. Normally, I would think that this could be a 2 week Bull Flag in oil off of the 50sma , but let’s look at the Oil / Energy Sector…
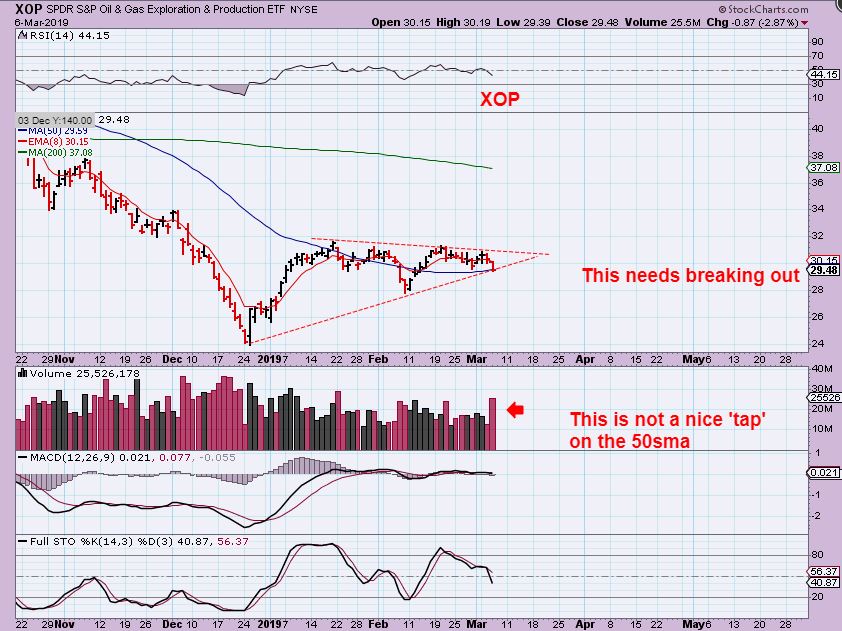
1. XOP – That was a big volume drop Wednesday and the RSI is now sinking below 50%. This looks quite bearish.
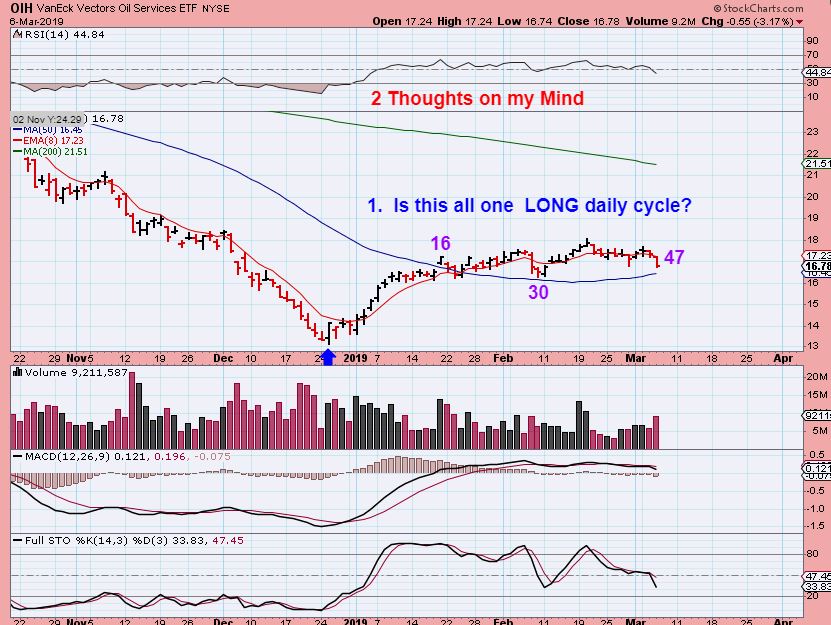
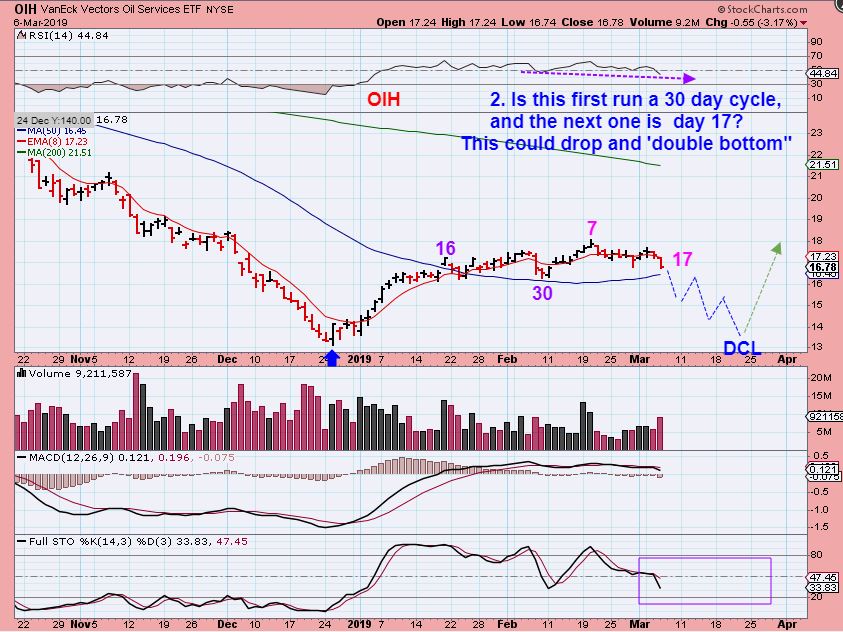
2. OIH #1 – I am wondering- are we on day 47? If so, the drop could be close to done with a dcl near day 50, and we’ll look for a confirmed swing low, however…
3. OIH #2 – What if we have had a dcl on day 30 of a shorter daily cycle after a LONGER sell off? If so, this would have a ‘peak’ on day 7 and we’d only be on day 17. If that is the case…
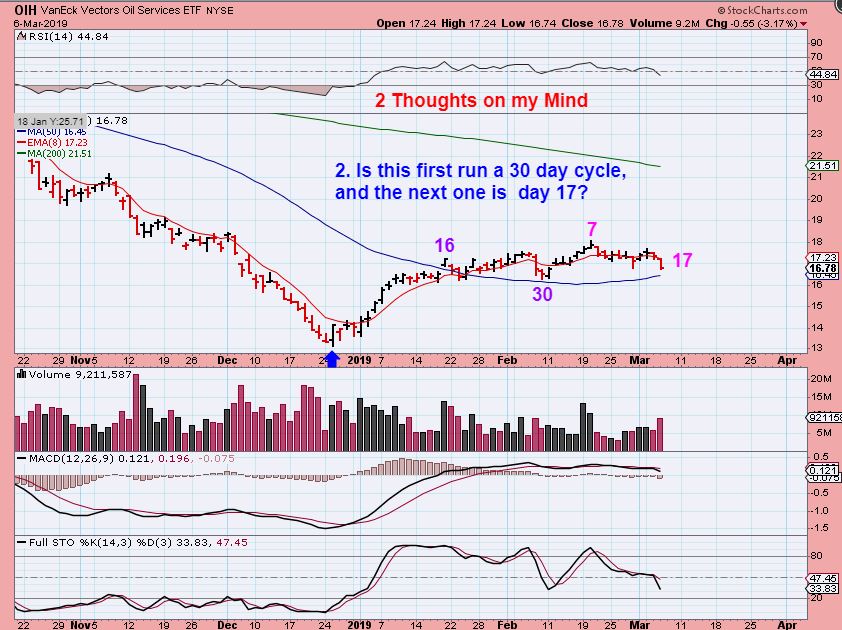
4. OIH #3 – ON day 17, this would have a lot of time left to drop. In other words, instead of seeing a conformed dcl soon, OIH could drop for 2+ more weeks, and even do a double bottom as shown.
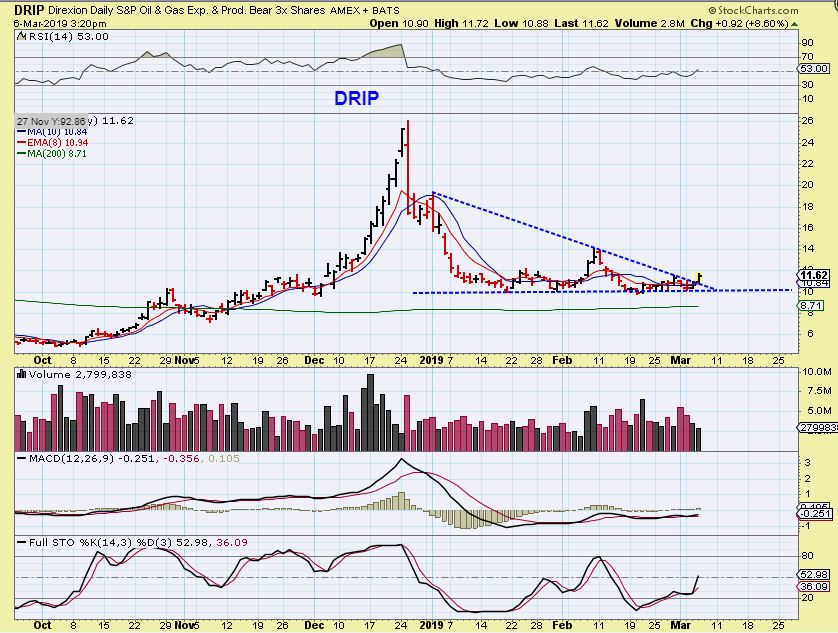
5. DRIP – And look at DRIP ( Bear oil & Gas) . Up almost 9% and it looks like it might just be starting to run higher too.
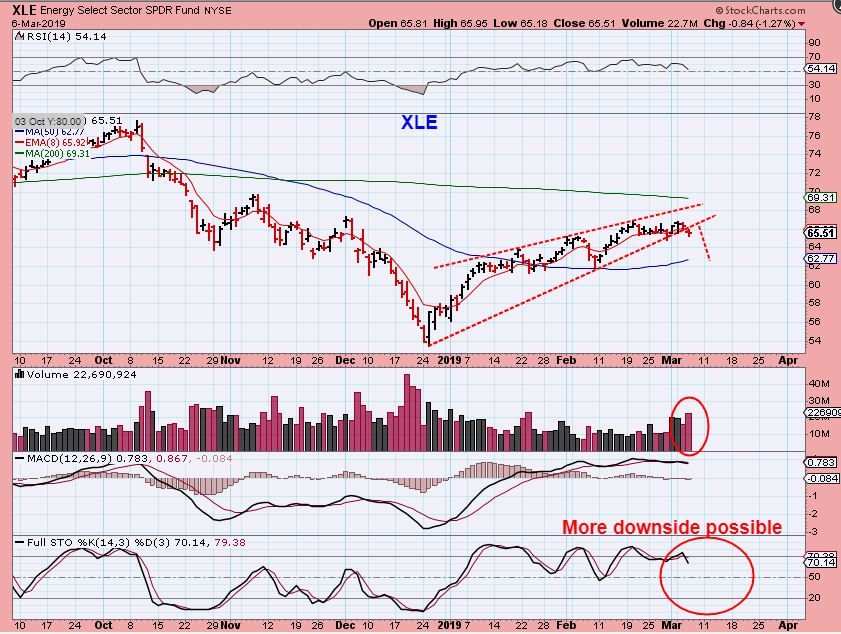
XLE – The XLE also had a higher volume day and looks like it will join in on the sell off. This is why I almost bought…
6. ERY – The ERY. Since the XLE may be just starting to drop and the ERY (3x Bear) also looks like it is starting to move, I captured this chart in the last hour of trading, and I almost bought this too. I was gone for most of the afternoon, so I didn’t want to jump into this trade without digging deeper. It DOES look like a buy.
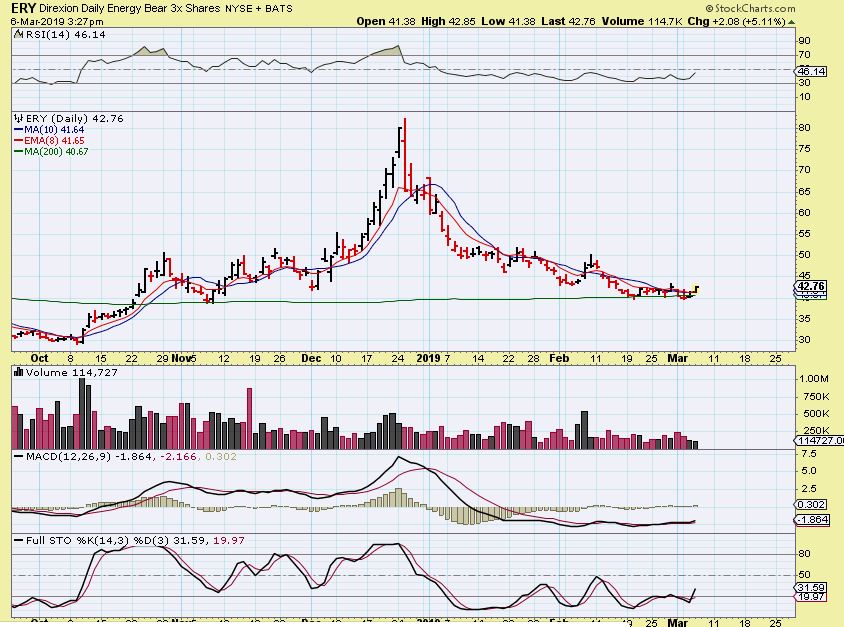
So I exited my Energy trades a little while back and mentioned that this sector was acting a bit odd. It was a great run out of the lows in GUSH, OILU, and other trades, but the sideways chop has been unrewarding lately. My thinking is that Oil & Energy are starting to drop and DRIP & ERY look like they will move even higher, so I may start a small short position today in ERY.
.
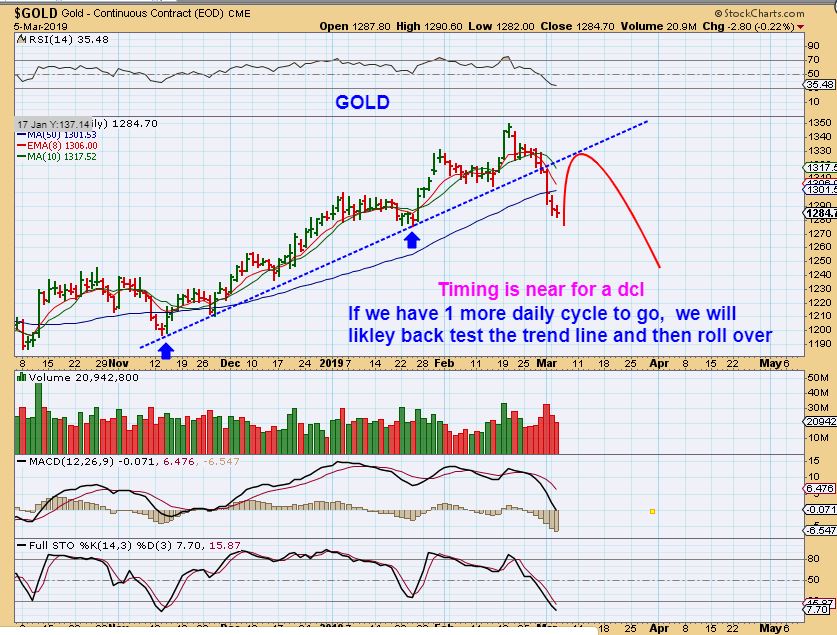
GOLD – Golds 2 week drop has not formed a swing low yet, but it could be ready for a bounce here.
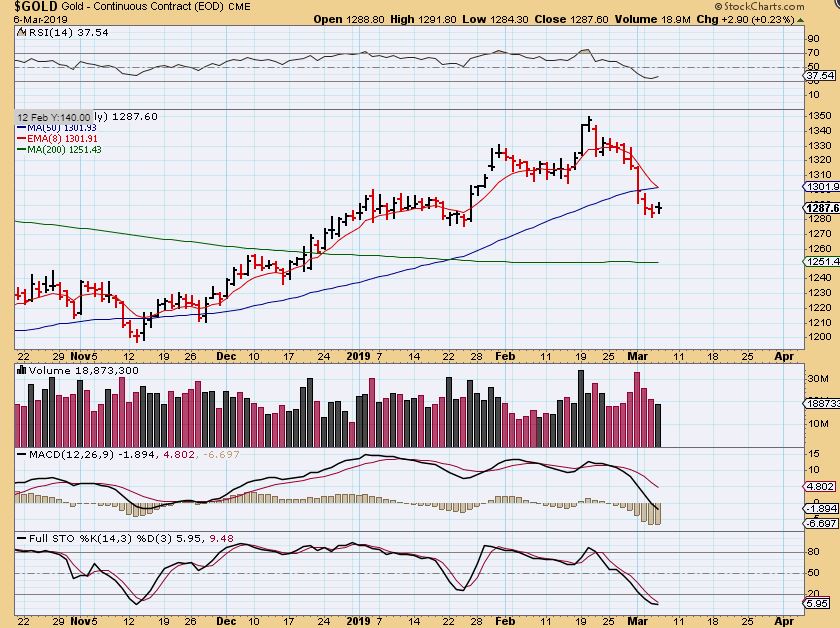
GOLD FROM YESTERDAY – I THINK A BOUNCE MAY EVENTUALLY BE SOLD OFF AGAIN.
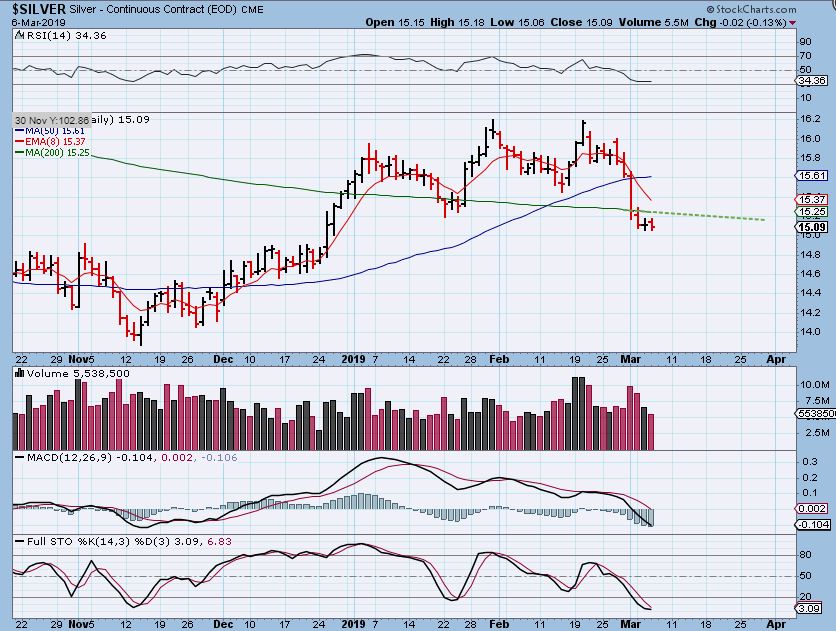
SILVER – Silver paused under the 200 sma, but dropped a bit more Wednesday. This looks more like a bear flag, but if Gold bounces, Silver most likely will too.
GDX – The Selling in Miners continued on Wednesday. GDXJ actually even made a new 1 month lows, and GDX is being rejected at the 8 ema. Wednesday GDX lost & closed BELOW the 50sma for the first time since November.
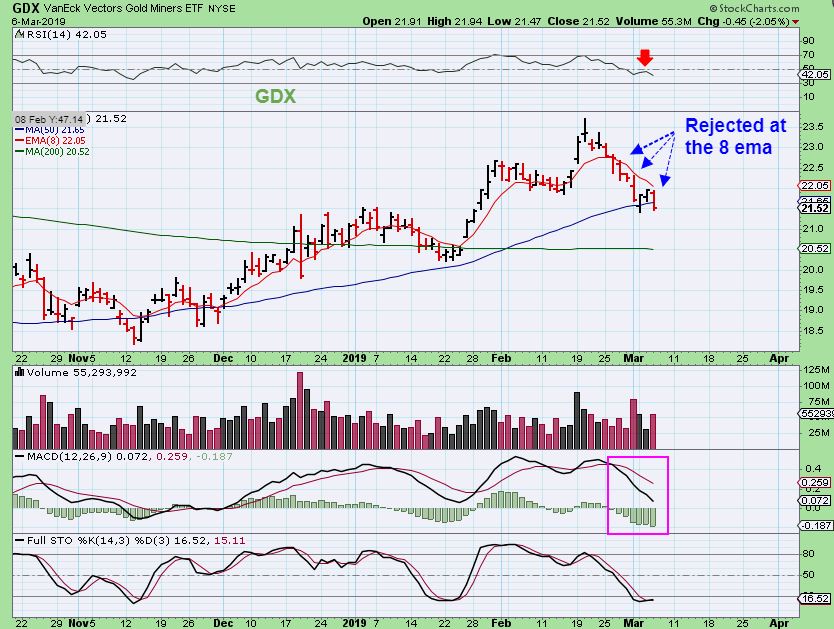
If Gold bounces here, GDX will probably recapture the 50sma and it’ll bounce too. This will draw in the ‘buy the dip’ Bulls, but I am really thinking that we still get some more downside after a bounce. That is why I admonish those that want to trade this, use stops under any new positions or sell the bounce to lock in profits more quickly. Also…
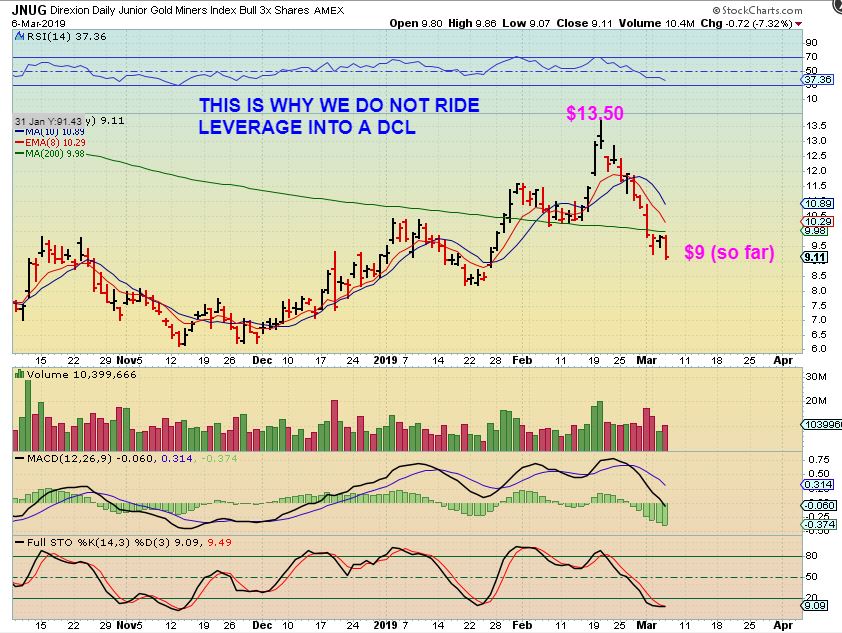
SIDENOTE: JNUG – I always encourage people not to think ,
” Miners are acting like a bull market so it’ll eventually recover, I’ll just ride my leverage out and even add on the way down’.” Ouch. When it comes to Leverage, the losses add up so quickly and we don’t even know how much more selling is left really.
.
General Markets : So with the Volatility index looking like it was stabilizing, and the Markets going sideways at resistance, I have felt that the markets would begin dip. Oil looks ok at a glance, but the Oil and Energy Stocks are really showing signs fatigue, as seen in todays report. Gold has been dropping for 2 weeks, so it could bounce, but I think that we have started a drop leading us eventually into an ICL. If so, the bounce will be temporary, but the buying opportunity ahead should be Excellent! For some, It may be best to just patiently wait for that time. This sector looks to have turned very bullish now.
Others like myself like to trade what they see, so I have entered and added to my SOXS, I’m looking at possibly buying ERY ( maybe if I sell something else). I still own several long positions that include MJ Stocks like ACB, TGODF, and PLNHF along with 2 Biotech stocks and a couple smaller trades that I now may need to exit. If you are patiently waiting for the ICL in Miners, I think you will do well in the near future, if you are trading? Enjoy your Thursday trading!
.
~ALEX
.
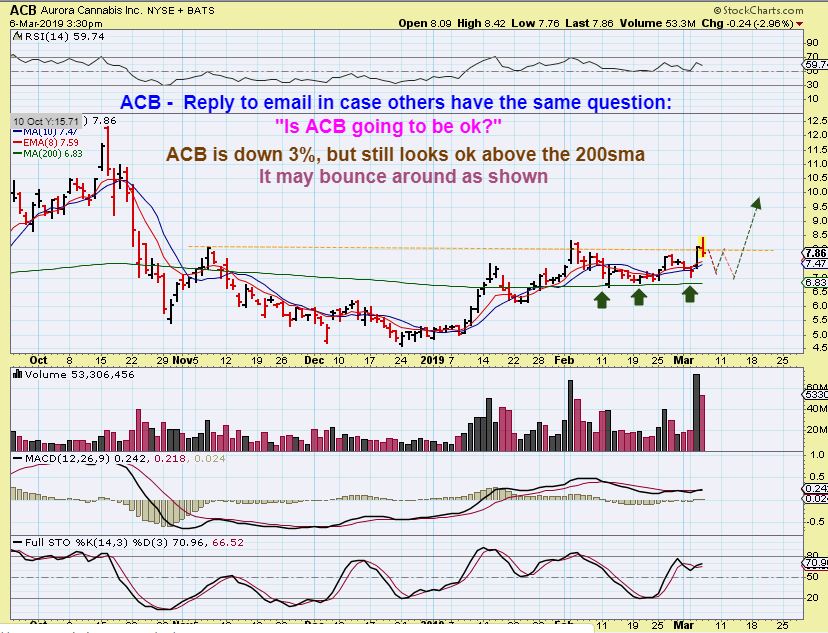
ACB- This is why I am still in the ACB trade, even though it had a reversal. I was using the 200sma for a support area. AS A TRADER, I often just sell a partial position on a ‘false break out’ just in case it drops to support again, but I did not sell.
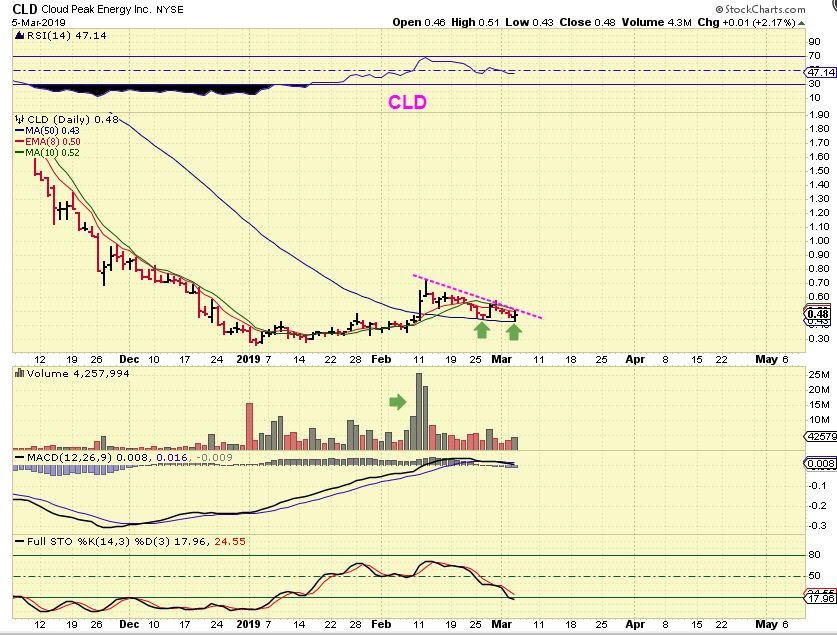
CLD MARCH 5- I liked this set up, though it did Pop higher & close red. It is still above the 50sma, so I am watching it, but only if it breaks out, since most LONG positions will struggle if markets and energy sell off.
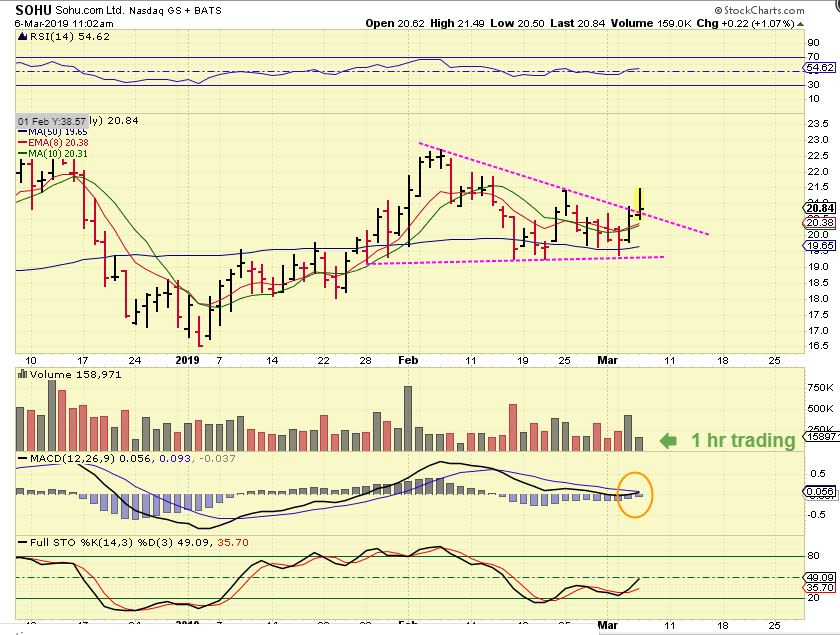
SOHU – Captured in the morning, I was watching this for a break out. It tried and failed and remains on the watch list.