March 5th – Tuesday
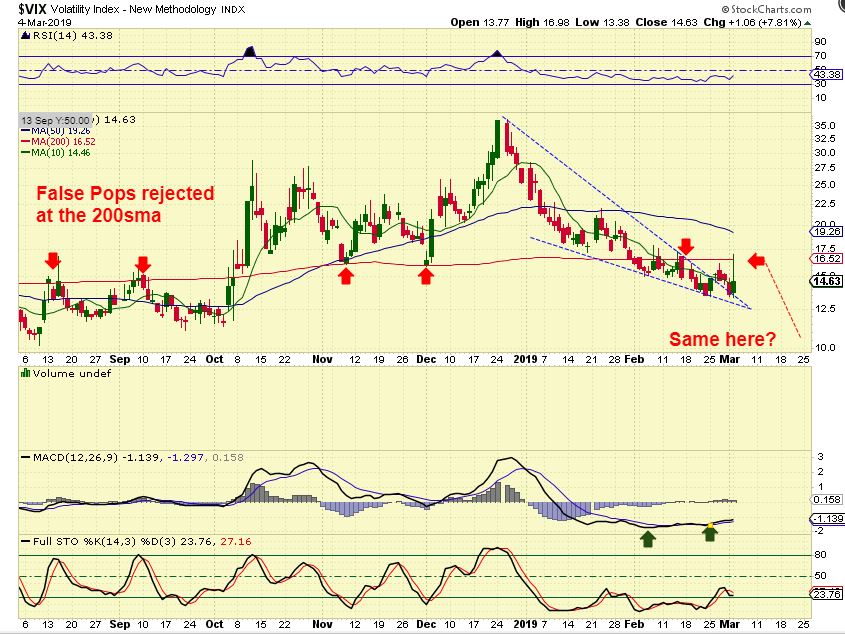
VIX – In reports last week, I mentioned that the General Markets have been moving fairly smoothly up and out of a V-Bottom. I also discussed that the VIX looked as though it could start getting choppy and this would cause volatility in the General Markets too.
.
On Monday, the VIX surged to the 200sma and the markets sold off. The VIX MACD also seems positive for a push higher, but it was capped at the 200sma like it has been in the past. So far the VIX is near recent lows, but I’m keeping an eye on it.
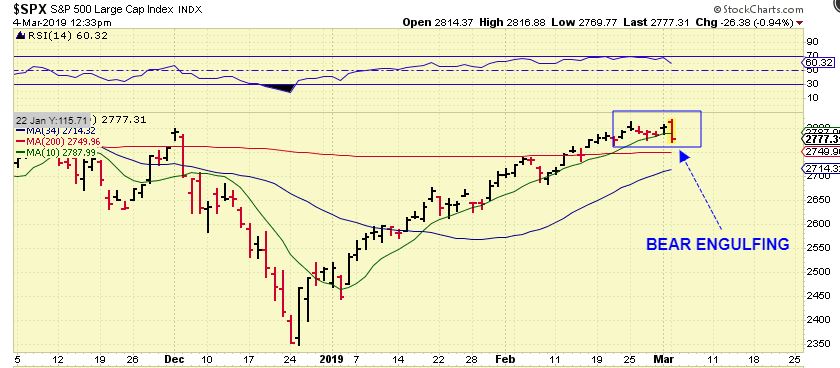
SPX MIDDAY – If the SPX closed like this, it would be a bearish engulfing.This drop took place when the VIX popped to the 200sma, so you can see how the markets can drop if that VIX Pops and runs.
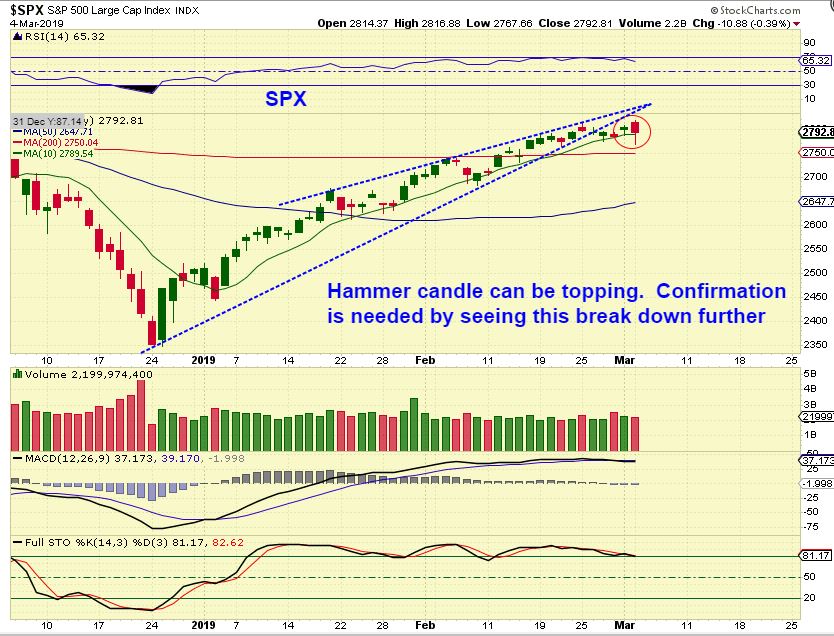
SPX – The SPX closed the day by recovering a bit and the VIX pulled back from the 200sma. I see a hammer formed on the General Markets now and things have become a bit choppy & sideways over the past few days. This can be a topping candle, but we need another day to see either ‘confirmation’ of whether selling is starting or not. Notice that it recovered the 10 sma, and that is viewed as bullish at this point.
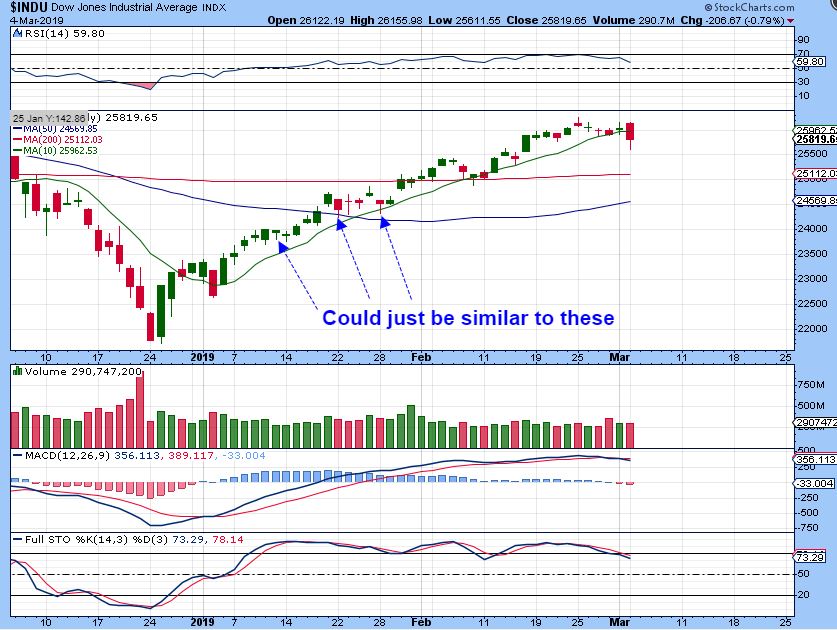
DJIA – I wanted to use the DOW to point out that Dow had ‘hammer’ candles on the climb, but it wasn’t a topping candle then. Price just paused, went sideways, and then continued higher, so it doesn’t have to be a topping candle. That said, at this point The Dow has the RSI dropping and it did not recover the 10sma, and we are going sideways and seeing a little ‘Volatility’ creep in, so we’ll see what happens on Tuesday. First support could be the 50 or 200 sma.
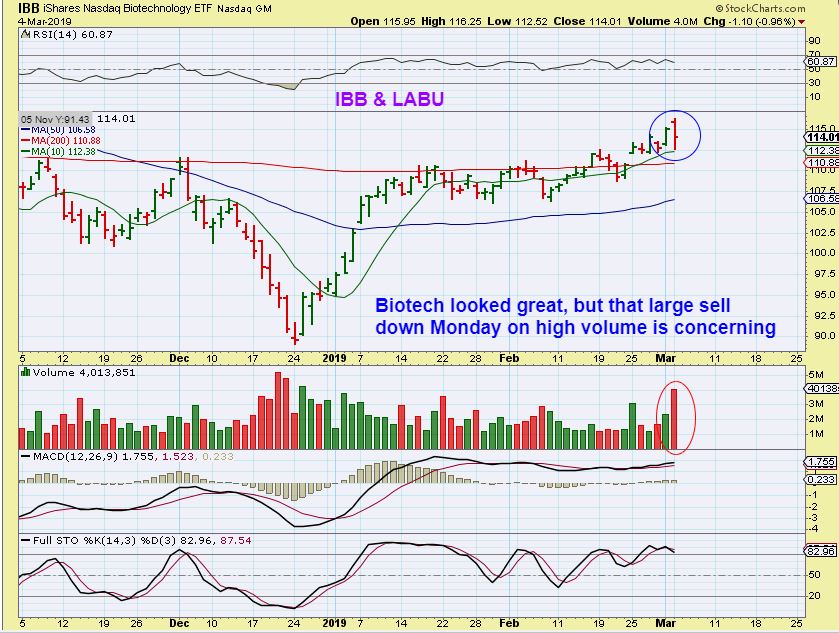
I started trading Biotech, and this sector looked very good. Some individual stocks still do, but this was one of those Gap open, sell off days in Biotech too. Yesterday engulfed Fridays candle too, but it closed as a hammer candle too. The volume was high, so I am interested in seeing what happens here Tuesday too. Was this just a 1 day oddity? Or the start of a sell off of some sort?
.
Same Chart IBB ( LABU also) – I really do still see many good looking set ups in this sector, and since I did buy a few as a trade, I am going to be watching this area & the stocks Tuesday. You see that ‘Gap open – reversal – sell off ‘ type of a move occurred here Monday too. I have mentioned OPHT, NTLA, CRSP, CUR, ABEO, and a few others recently. I will discuss these briefly at the end of the report, but less as ‘recommendations’, and more as an area to watch for clues. I do still own mine.

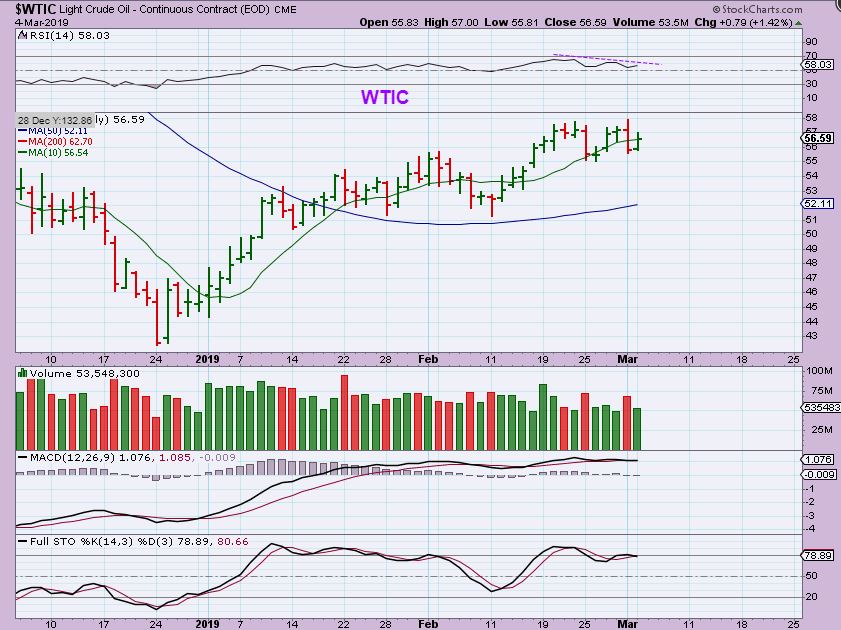
WTIC – Oil has had a couple of sharp 1 day drops and then tries to reverse higher. The RSI is a bit weak, so Oil looks a bit unsteady to me. Notice that Monday & Friday of last week Oil Dropped sharply.
XLE – Notice that Monday & Friday last week the XLE did NOT follow Oil. The Oil & Energy Sector Etfs are still climbing and volume keeps coming in strong, but this could be a wedge here too. It needs to break out as it approaches the APEX or it is in danger of dropping back to the 50sma.
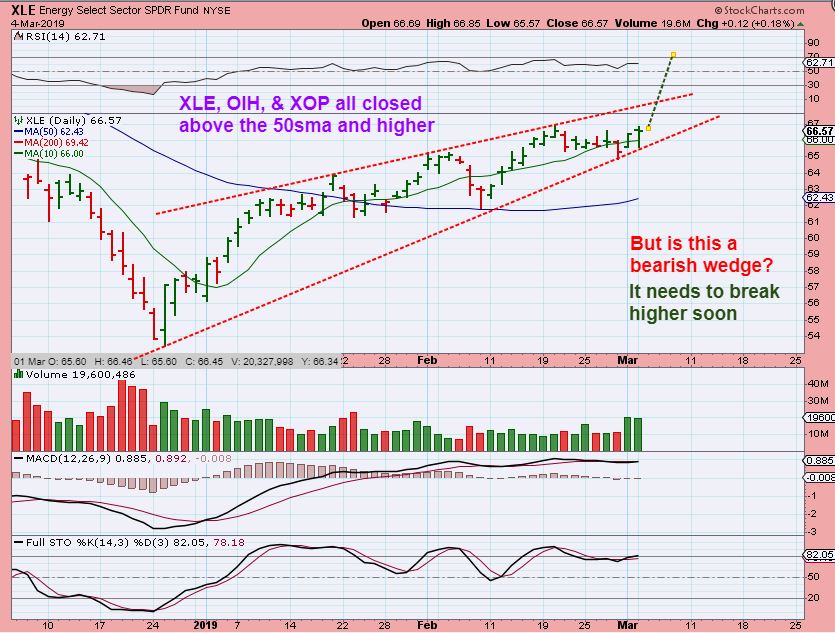
So personally I’m out of the Energy Sector for now. It was definitely a nice run out of the lows for a few weeks, and there are still ways to play it with a stop, but the choppy action now has me on the sidelines for now.
.
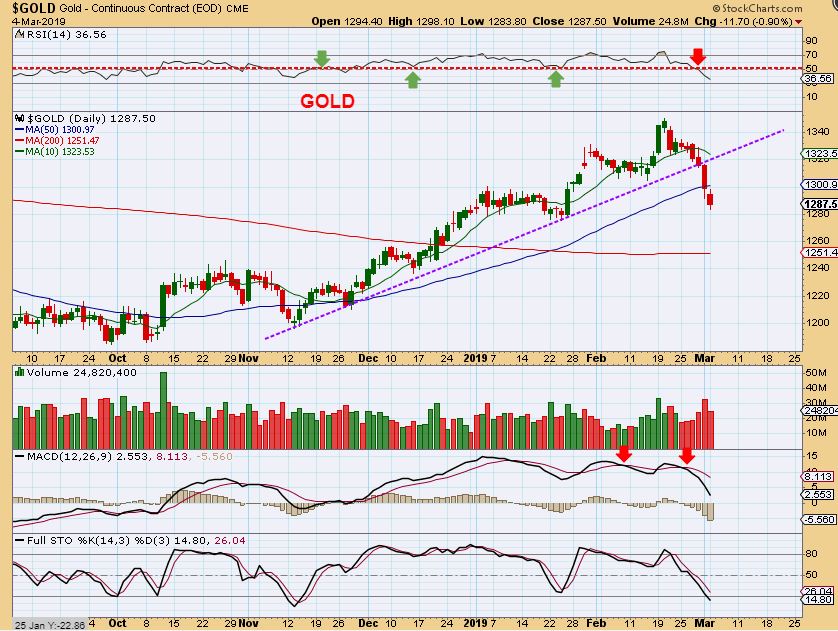
GOLD – Gold continued to sell off on Monday. Notice that we got a small bounce Friday at the 50 sma, but it only lasted 1 day so far. Golds RSI has now broke down also.
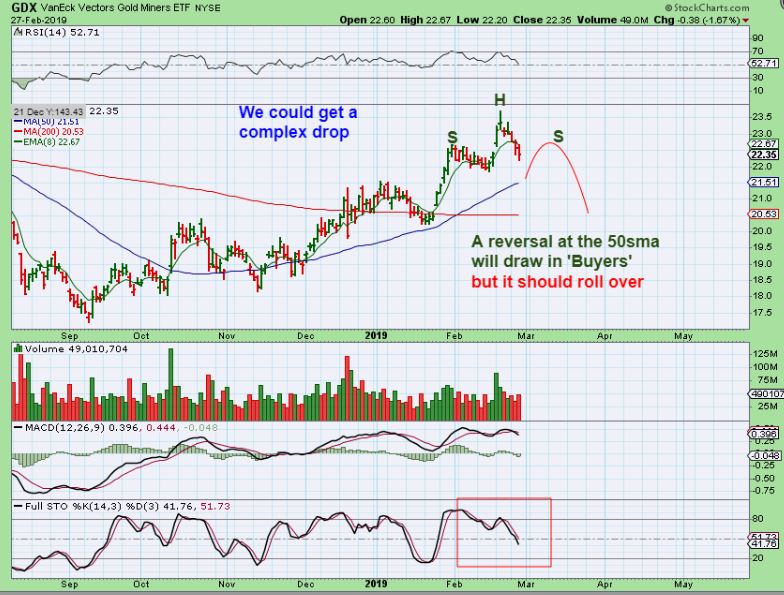
GDX FROM FEB 27- I drew this to show that I expected a drop & a bounce off of the 50sma, but I also cautioned that it could be a short term bounce.
.
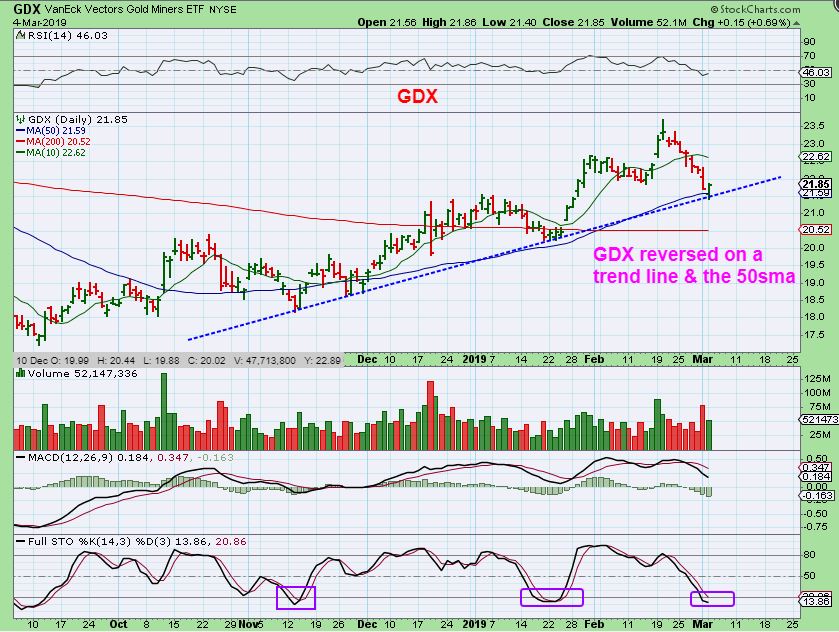
GDX – We have a reversal at the 50sma as of Monday. Miners reversed at the trend line & 50sma, and they are short term oversold. This is actually considered a ‘buy’ in technical analysis, with a stop right under this support.
So take a look at our last 2 rallies, one in January, One in February. They were strong for about a week , so some might want to give this reversal a try. If you buy it, remember the above H&S chart and tighten stops if it starts to roll over.
I went from being almost fully invested a few weeks ago, to currently 1/2 invested, 1/2 cash. How did that happen, since trading was really good over the past few weeks? Gush was a good trade out of the lows as well as a few of the Oil / Energy stocks, but recently OIL & the XLE got out of sync, so I mentioned that I left behind my Oil / Energy trades for now. As of Monday, I was also stopped out of a few more trades with those reversals.
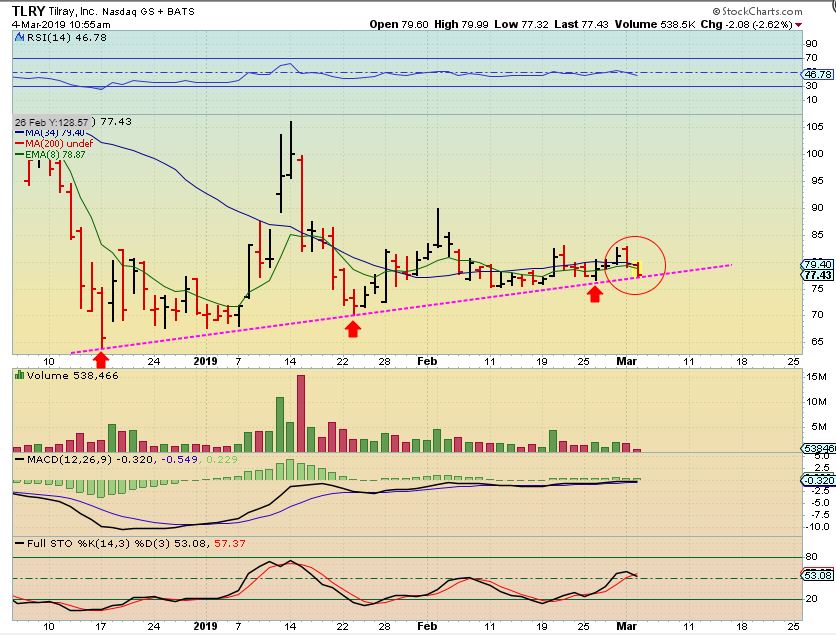
Since I am in front of the screen most of the trading day, I saw the markets at the open yesterday. Every position that I owned gapped open green and I had solid gains right out of the gate. Very shortly after the open, many stocks started to sell off, but I assumed that it could be the normal gap fill and wasn’t overly concerned. Well, my positions all gradually dropped to red and just kept selling down. I had to leave for an hour or so, so I tightened stops on some positions and my account stopped me out of a few stocks ( For example, I am out of XNET & TLRY). My account closed down near 4% after opening up about 3%? That’s quite a big % swing for an account. Tech, Blockchain, Biotech, Energy, etc – it all opened higher & reversed into a sell off.
EXAMPLE: I posted this chart in the live area, and my stop was under this line. That broke yesterday too ( and recovered a bit, but I got stopped out & stayed out for now).
Conclusion: I would say that some of the selling looks normal, but I wasn’t eager to just quickly jump right back in. When every sector sells down at once, and my account feels like volatility, I need to just step back and look at how things are currently set up. This report reviewed various sectors and they all felt the tremors, so Tuesday will show me whether there is selling ‘confirmation’, or was it just choppiness. I will be looking to see if yesterdays sell down in the General Markets will be confirmed with more selling? Will the reversal in the Miners be confirmed with short term buying? Is Biotech still going to do well? I am still invested, but some of my tighter stops did get hit when I had to step away from the screen. Tuesdays trading may help us to see what is happening in these areas.
.
Let’s see what our Tuesday trading brings our way.
.
~ALEX
.
As mentioned, I was going to show some more Biotech, and I do like the set ups, but I think that they may need a little more time to see if they continue to remain bullish. I will show a couple of examples below.
.
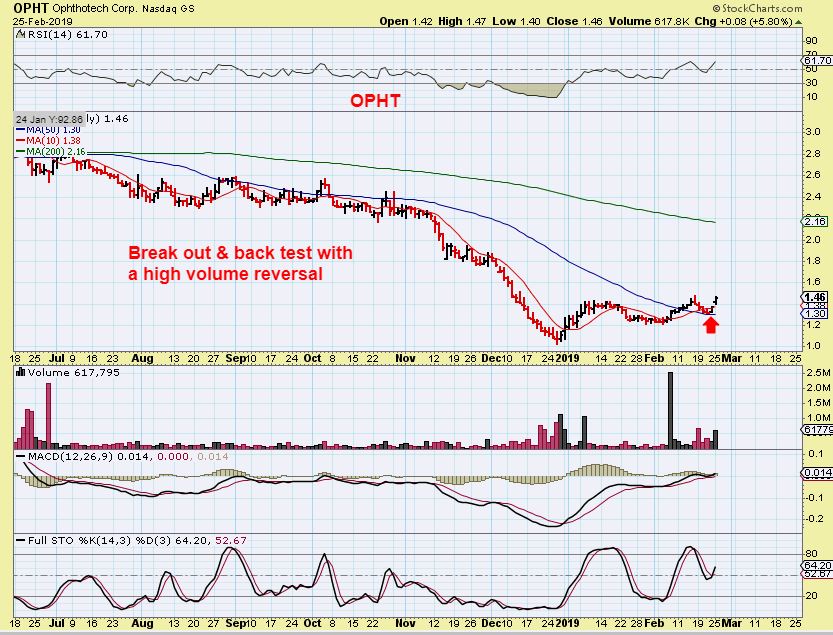
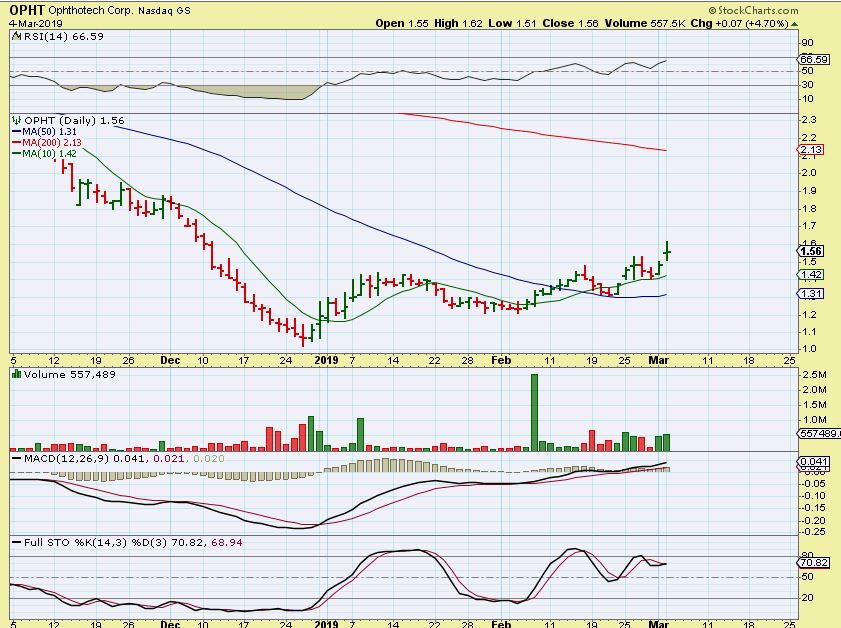
OPHT was recommended, they have already released earnings, and it looks fine. This is OPHT as recommended & Now .
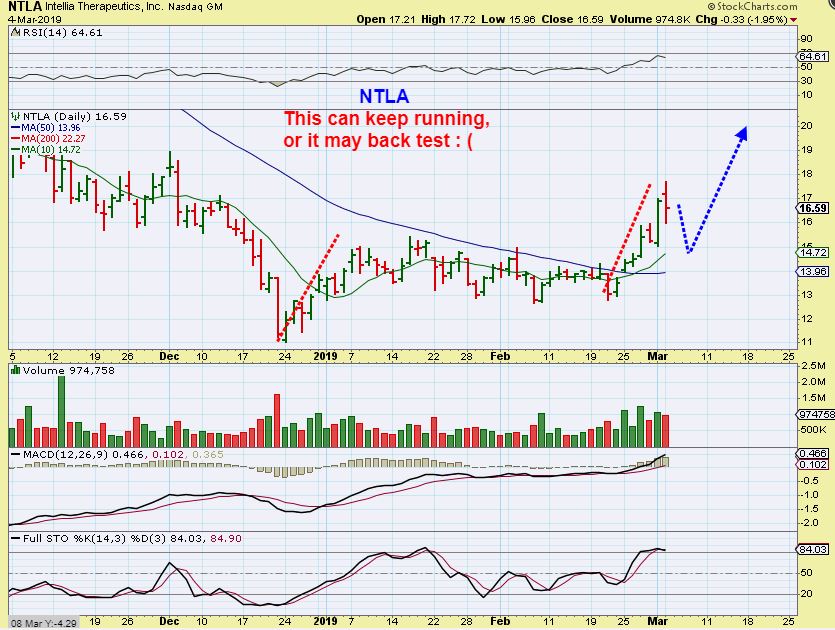
I own NTLA – I am hoping that this was a 1 day reversal and not becoming a back test as shown. It is still OK if it does a back test, but that could be a bit of a ride down to $14 before running higher.
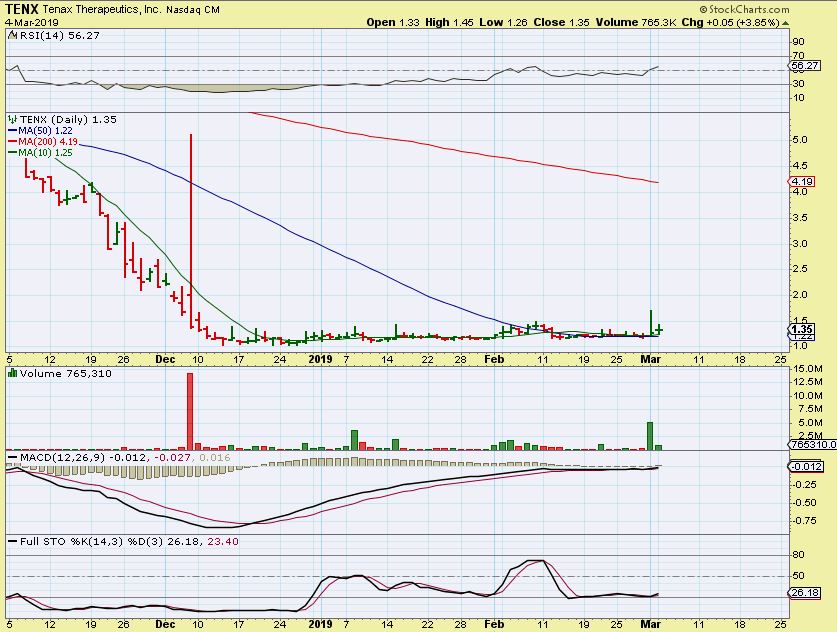
TENX – I may have mentioned TENX, but I didn’t recommend it yet, I wanted it to POP and move higher first. Well, I do own it. I actually saw it Pop and I bought the gap fill yesterday, but I still can’t recommend it now that this sector Gapped open and dropped too ( IBB chart in the report). I will be watching this.
ALSO I liked the chart of LJPC, but it dropped after earnings yesterday. I don’t own it, but I want to see what it does after the earnings release.
ABEO, EYES, TENX, CUR, ATNM, XENE, MYGN, CRSP, EDIT, NLNK, etc are a few of the BASES that I was watching. Some I already mentioned in recent reports, and others I was thinking of putting in this report until I saw all of these reversals. You can write that list down follow them today if you wish. IDRA & the 50sma looks very good if it breaks out today too.
.
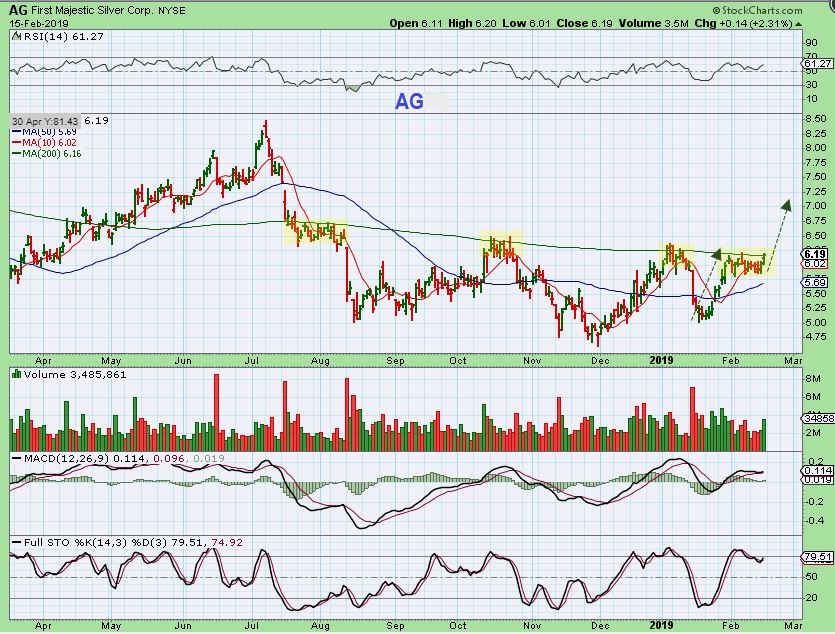
AG– I’m sure that you recall this ‘set up’ in AG on this Feb 15th chart. It was a buy if it breaks out and that resistance area could become support.
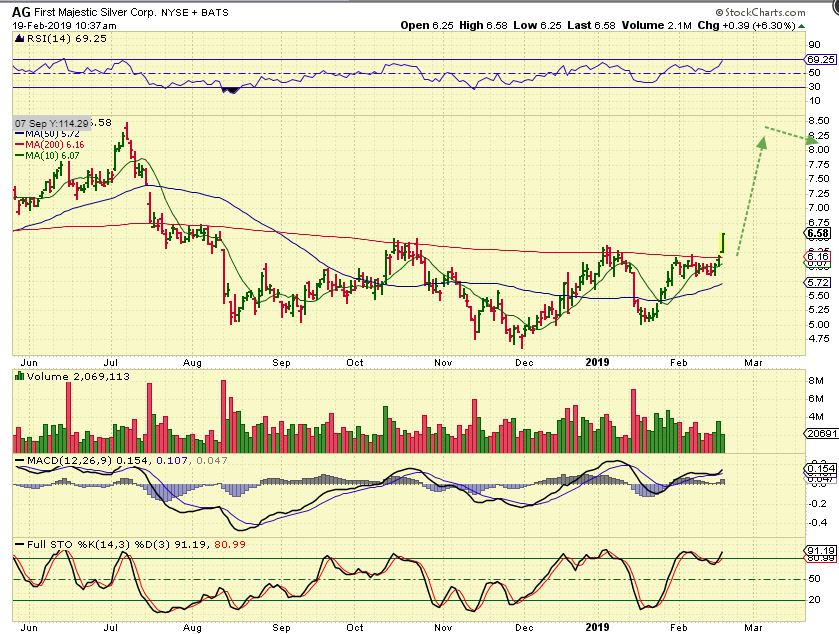
AG- I bought the break out on this morning pop and pointed out that this could run to finish forming a cup, or if it gets caught in a sell off, it may “Back test’ support. A back test is common.
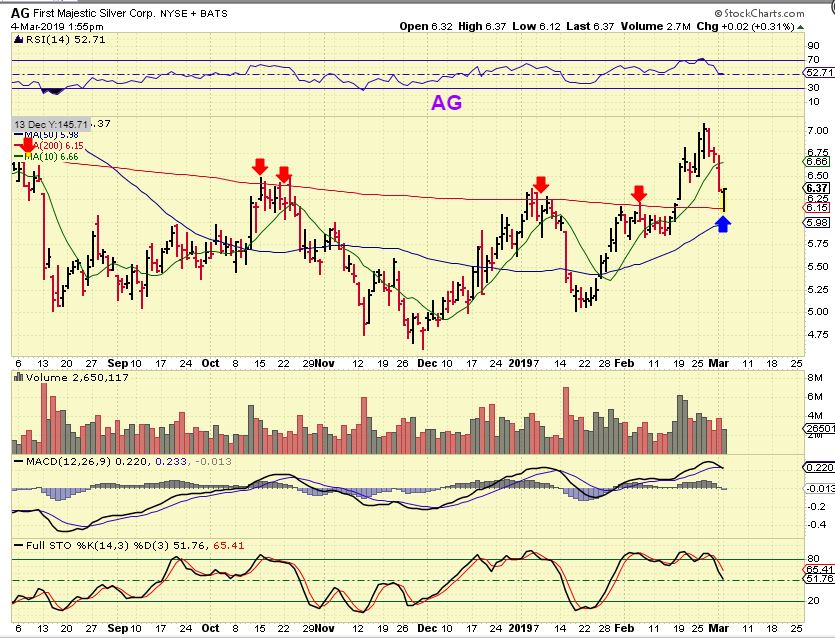
AG – Monday AG reversed at support and this looks like a back test, so now we’ll see if this support holds price longer term too. I do like this type of set up, but it is not oversold, so it may chop around if buyers do not step in.
I like what some individual Miners have been doing, they seem constructive during the pull backs.
.
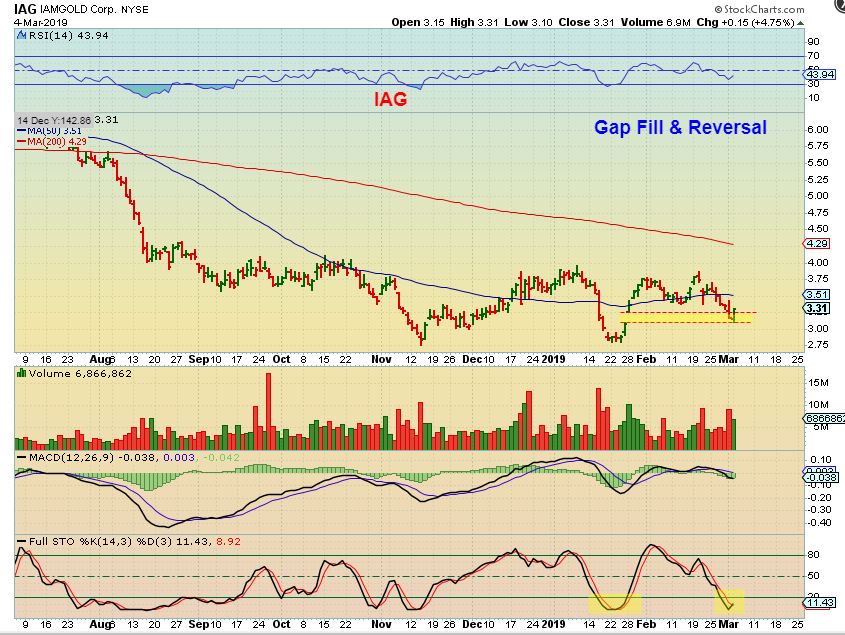
IAG – IAG is actually forming a large base. It gapped open and ran in January and yesterday that gap was filled and IAG reversed when GDX reversed on the 50sma. It hasn’t been the most Bullish of Miners so far, but on the next run this may be a $3 to $6 move, right? They released earnings on Feb 21 and it was a miss, but I think that eventually IAG can break from the base and it will do well if this sector remains on fire.