
Feb 23rd Weekend Market View – 1 Step At A Time
Thanks to Rocky, I found something interesting to share with you this weekend. As one of our faster day traders, Rocky was enjoying some fast Pops higher in the individual stocks of the general market and said, ” Hey CF, are you sure about this market dropping? It just won’t stop.” Well, My immediate answer was that we were due for a dip and that it isn’t really rocketing higher like some stocks, it has been sideways for a few days. That said, I decided to dig deeper, look closer, and I may have stumbled onto something – Thanks Rocky!
.
So I have posted this and the rising wedge and this was in the Thursday & Friday reports. Also ‘timing wise’ we would be late in the first daily cycle. I said that this needs to break out higher or it will break down, but…
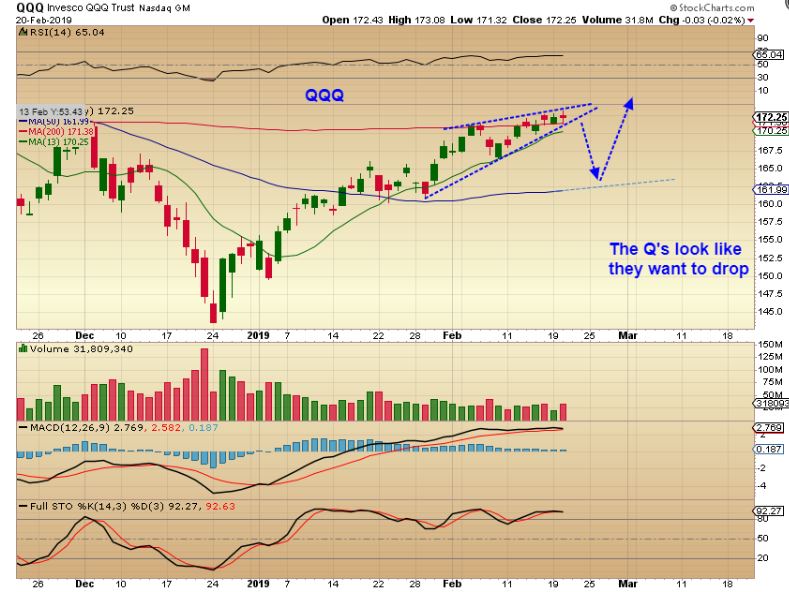
Take a look at this as food for thought…
THIS IDEA WAS IN FRIDAYS REPORT TOO- IT WAS THE DILEMMA THAT THE MARKETS COULD JUST RUN HIGHER IF IT PUT IN A DCL AT THE TIME THAT I THOUGHT OIL MAY HAVE, AROUND DAY 31. THIS IS WHAT I WROTE ABOUT THE GENERAL MARKETS ON FRIDAY :
.
Friday Feb 22: I ACTUALLY FOUND ANOTHER REASON TO BELIEVE THAT WE POSSIBLY DID SEE A DCL ON DAY 31, but I’ll know better after today.
.
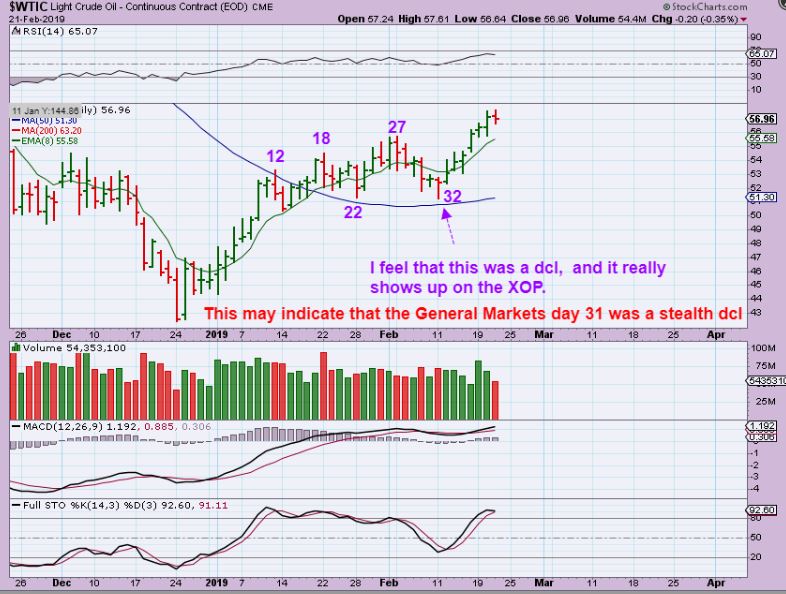
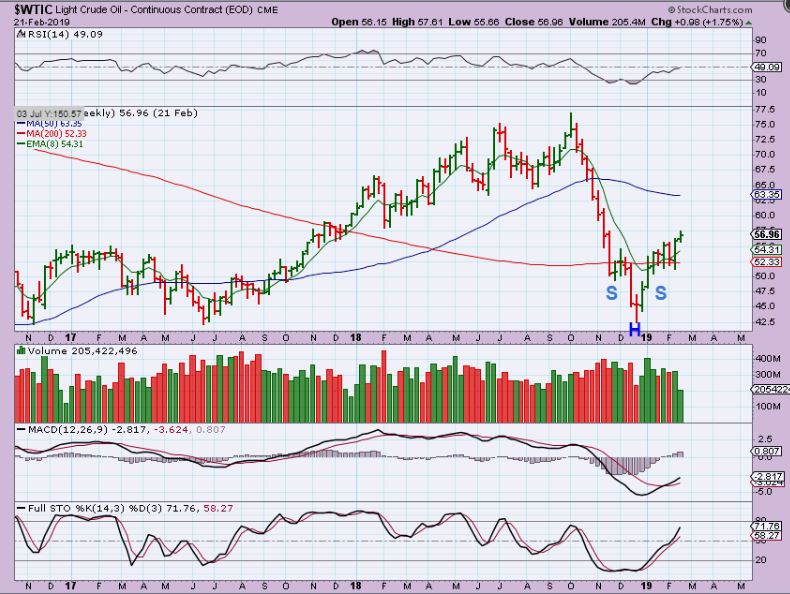
WTIC– Oil had that dip on day 32 that got the stochastics down to oversold. Read what I wrote on the chart in RED.
.
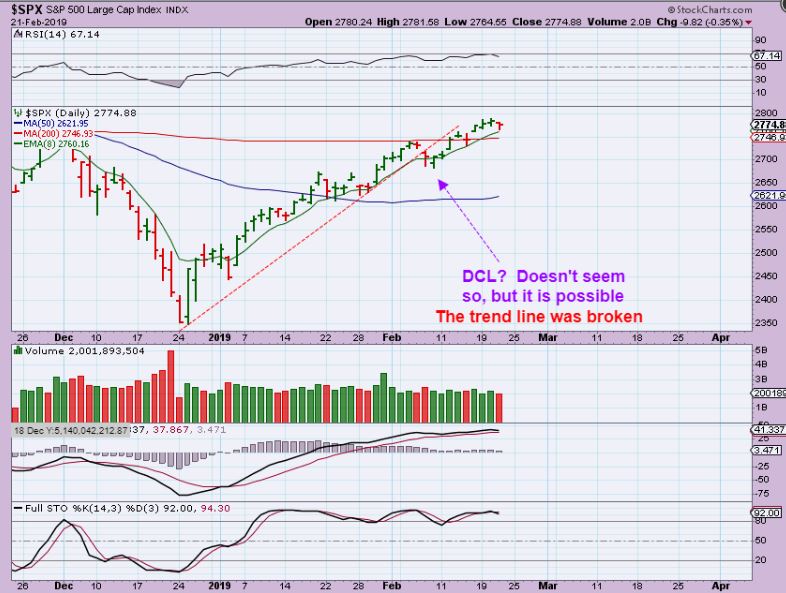
THE DIP IN THE SPX SEEMED MILD COMPARED TO OILS DIP, but the trend line was broken. Was this too mild? My personal feeling are that it seems to be, so I concluded by saying …
So these are the things weighing on my analysis. Timing, A DCL in Oil, a trend line break, but could have only been a 1/2 cycle dip earlier at day 22, wedges forming, etc etc. I want to see if the General Markets run higher or break down from here. It feels to me that a dip is due, but we have seen GOLD continue to avoid a deeper dip, and the markets have been strong since the V-Bottom.
.
So with ROCKYS question, I wanted to take a good look again, and I did find something interesting , let me share it now.
.
This is the SPX Now. With a trend line break and small dip, could it be in line with OIL and gave us a dcl. I thought that it was more likely to be a 1/2 cycle low and we’d roll over soon. So far it has been ‘Maybe”, but I needed more time, so just tighten stops. Why? I wanted to see if we could break higher from the wedge and this resistance line. THAT SAID, I did possibly find another clue…
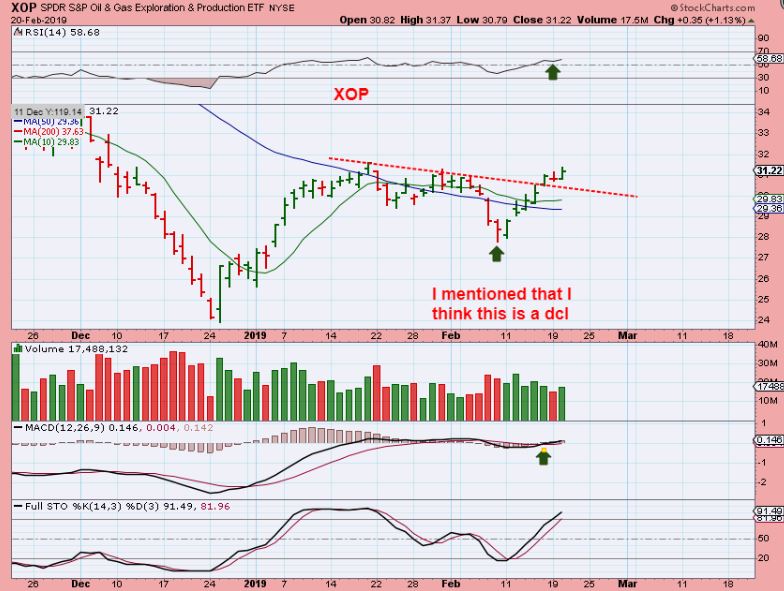
When I wondered about OILs dip as a possible dcl, I took a look at XLE, OIH, and XOP and found a deeper dip there, and that made me feel that OIL probably did have a MILDER dcl. I used this chart on FEB 20 as a reminder.
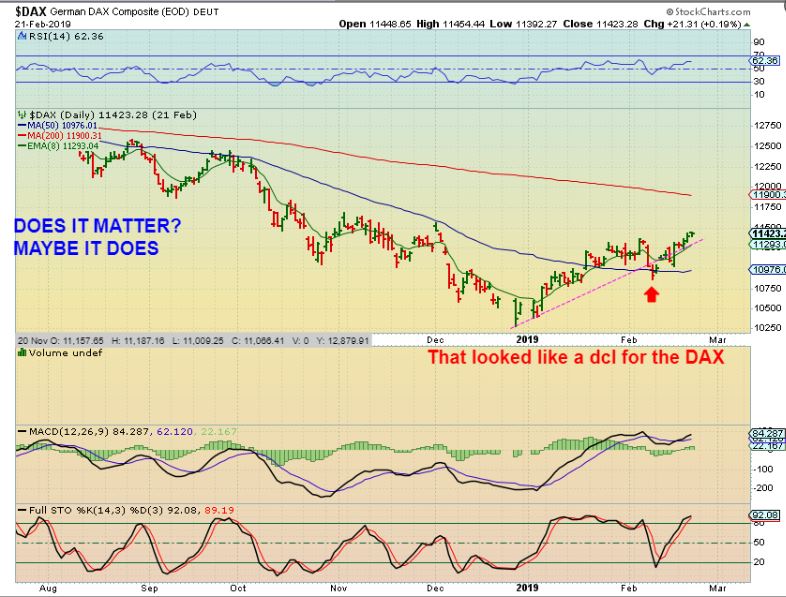
So now take a look at the DAX – This is the German Composite, but it slammed down when the SPX , DJIA, and NASDAQ dipped mildly, and this dip looks like a dcl, doesn’t it? And I DO NOT see a rising wedge here, so The DAX may just run higher. Also …
I went to the NIKKEI and found a similar deeper dip at the same time , and I don’t see a rising wedge here either. NIKK may have a dcl and can now run higher too.
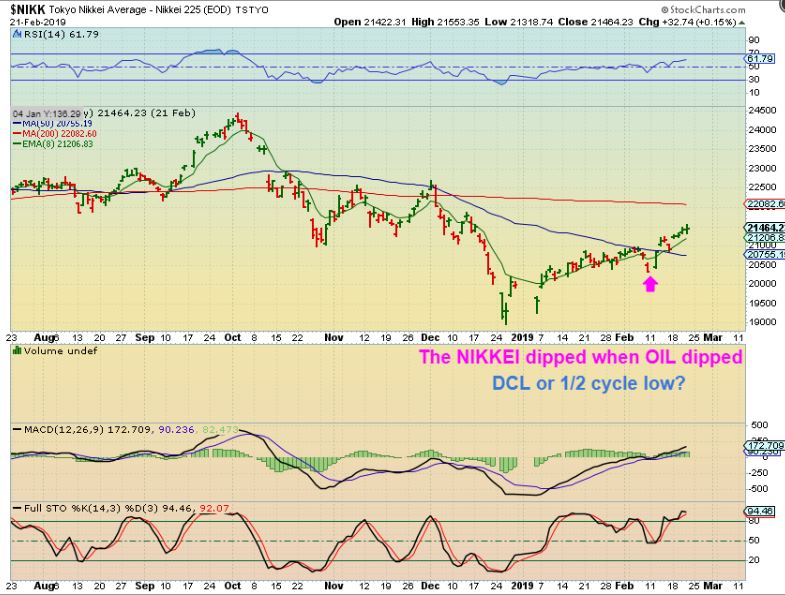
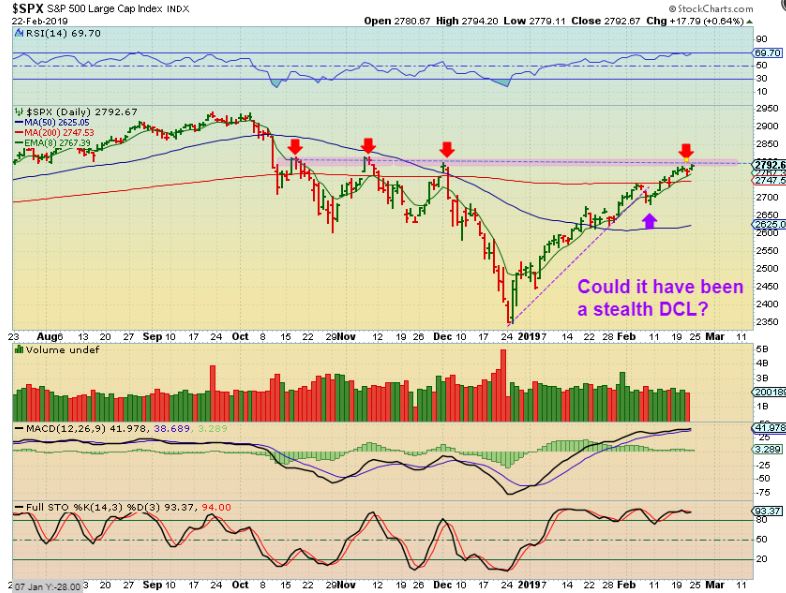
From the above charts of DAX & NIKKI, I see similar dips at the same time as the US markets, except that the US markets had a much milder dip. There is still nothing etched in stone here until the U.S. markets break higher or lower from that rising wedge, but this shows that we might have seen a stealth dcl.
I STILL RECOMMEND USING A STOP JUST IN CASE THE PULL BACK DOES COME IF YOU WANT TO LOCK IN GAINS.
AGAIN – IF THIS WAS STILL THE FIRST DAILY CYCLE, A DIP FROM HERE INTO A DCL WOULD LIKELY BE MILD, MAYBE LANDING ON THE 50 SMA THIS LATE IN A DAILY CYCLE, AS DRAWN HERE ON FEB 20. USE A STOP UNDER THIS WEDGE IF IT BREAKS & RE-BUY A REVERSAL IF YOU WANT.
WTIC – Oil continues to play out as expected (long).
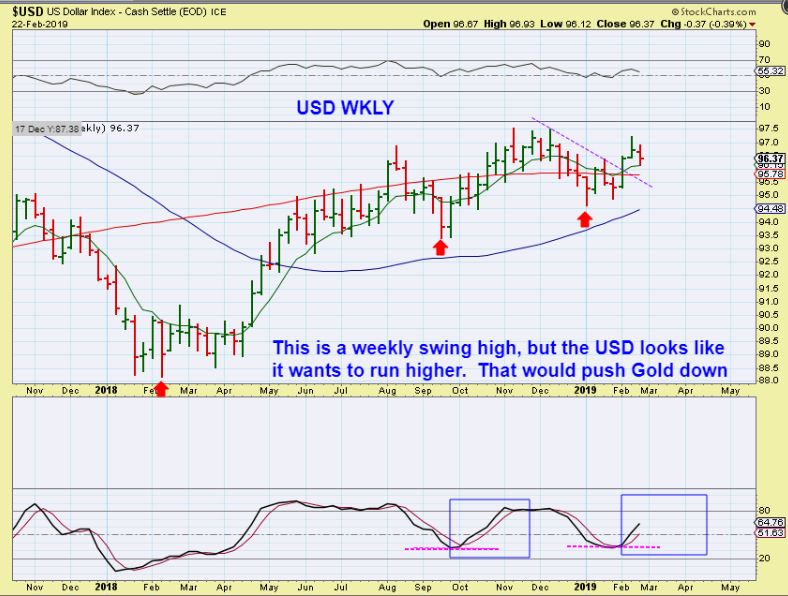
USD – The USD WEEKLY is not overbought and it has more room to run. Even though I see a swing high, I see many other ones that were negated, that is how the USD Moves. We can keep an eye on it, but it looks like it still wants to move higher, and Gold looks like it wants to dip.
GOLD #1 – This looks like a topping candle, it is near a resistance zone, it is quite overbought, and the cycle ‘timing’ is due for an ICL type dip. GOLD has been so strong that a dip to the 50 or 200ma doesn’t feel possible, right?
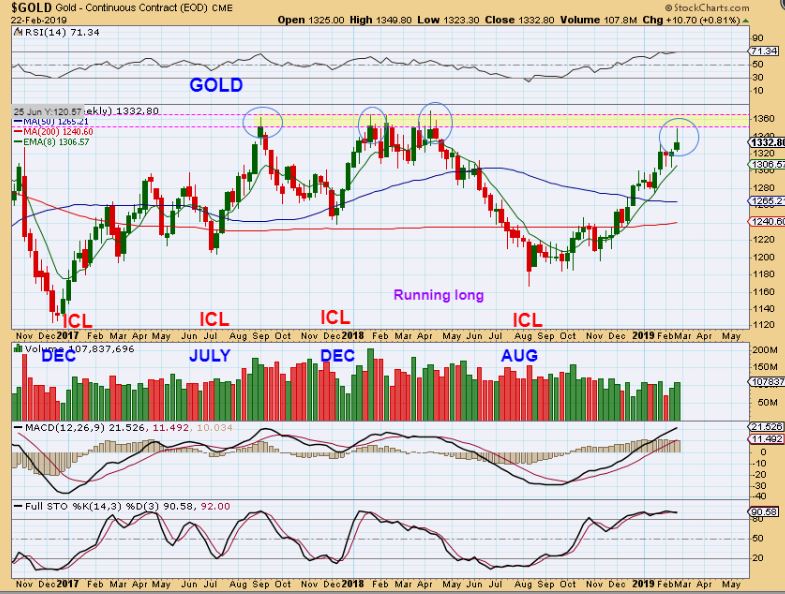
GOLD #2 – Honestly, we could easily see this to the 50 weekly ma, and …
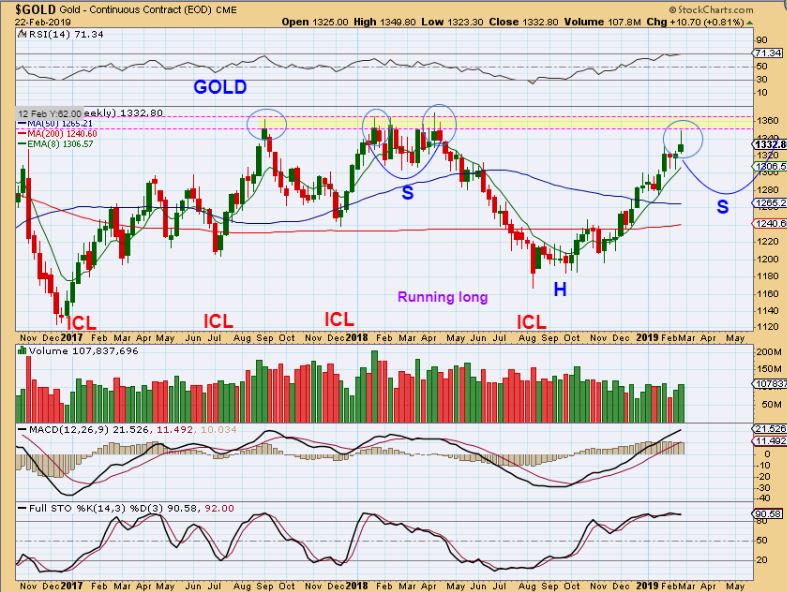
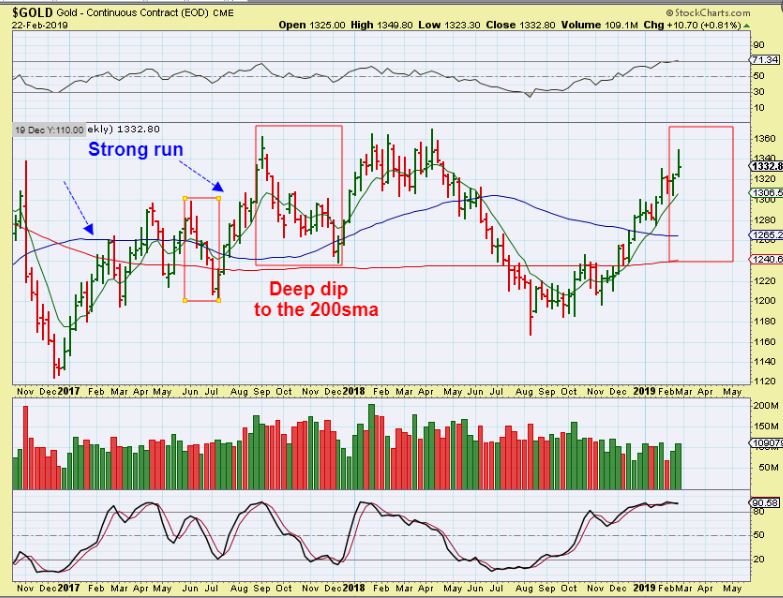
GOLD #3 – In 2017 we saw some strong runs that then dipped quickly lower. The 1st red box was a 3 or 4 week drop. In the 2nd red box I am just showing how a strong run similar to now did drop too. The 3rd red box is to be determined.
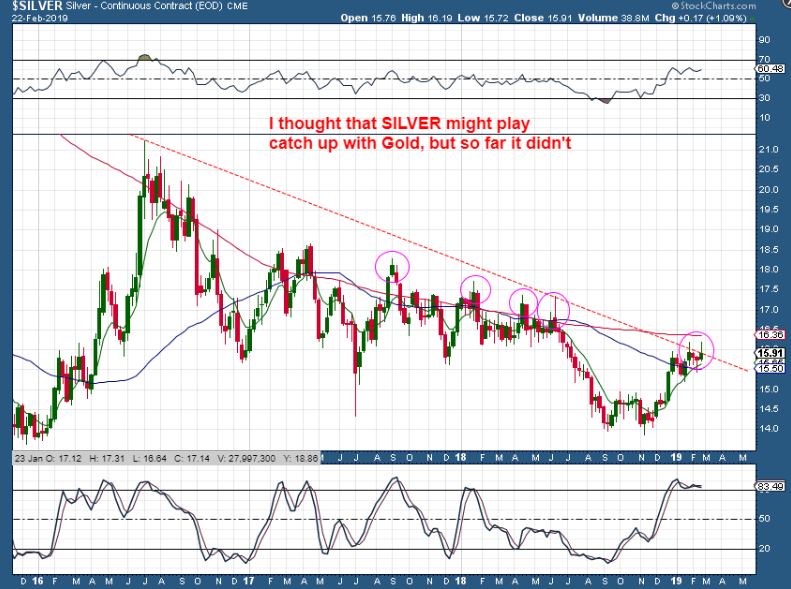
SILVER – Read the chart, we have similar weekly Topping candles.
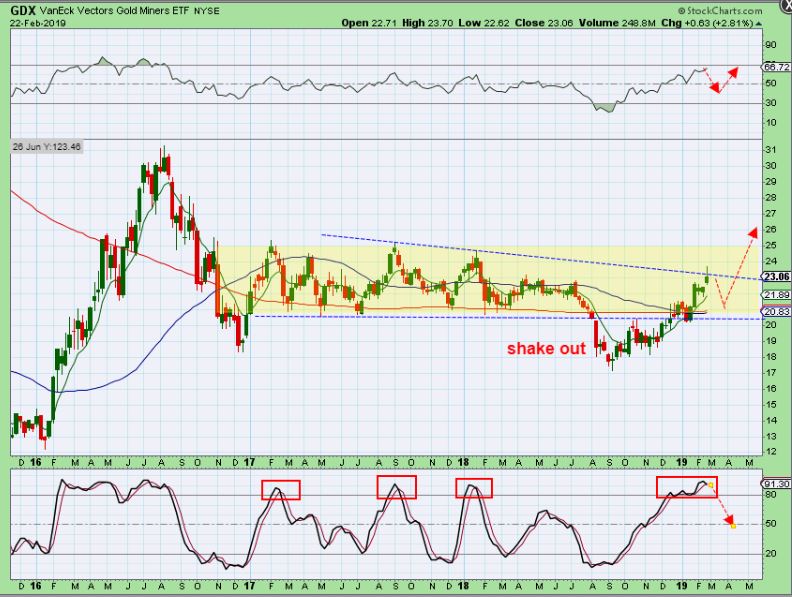
GDX #1 – GDX rallied Friday and gave it back into the close. That shows ‘sellers’ now selling the rally, and leaves a weekly topping candle.
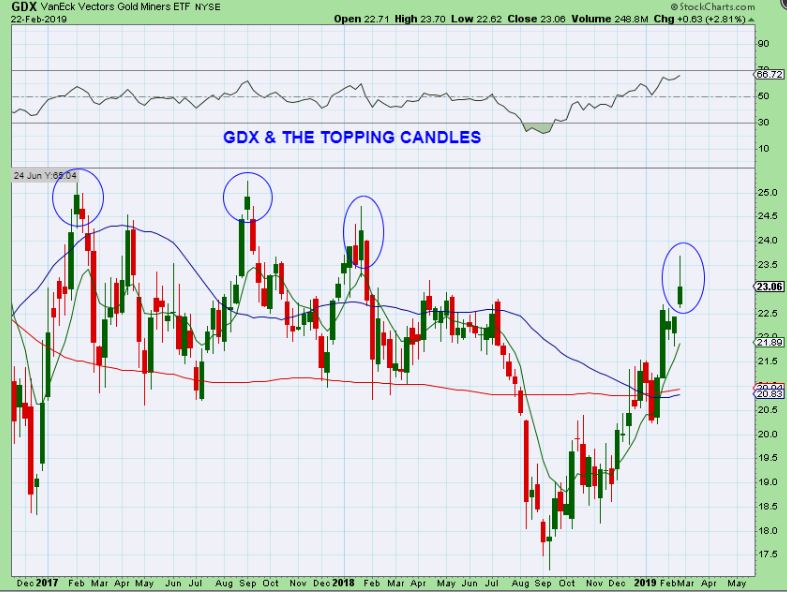
GDX #2– We all know that the Miners can sell off QUICKLY when they want to. Prior circled tops were also strong rallies, weren’t they? The drop was also sharp. We could finally be looking at an ICL sell off coming in Miners.
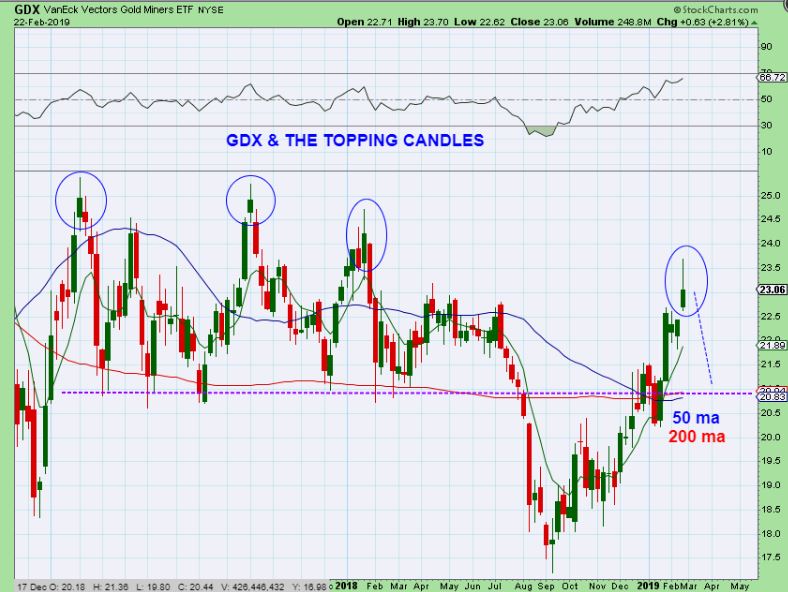
GDX #3 – THAT IS GOING TO BE A BUYING OPPORTUNITY, IN MY OPINION
.
Enjoy your weekend, and I will have a few more thoughts at the bottom of this report.
.
~ALEX
.
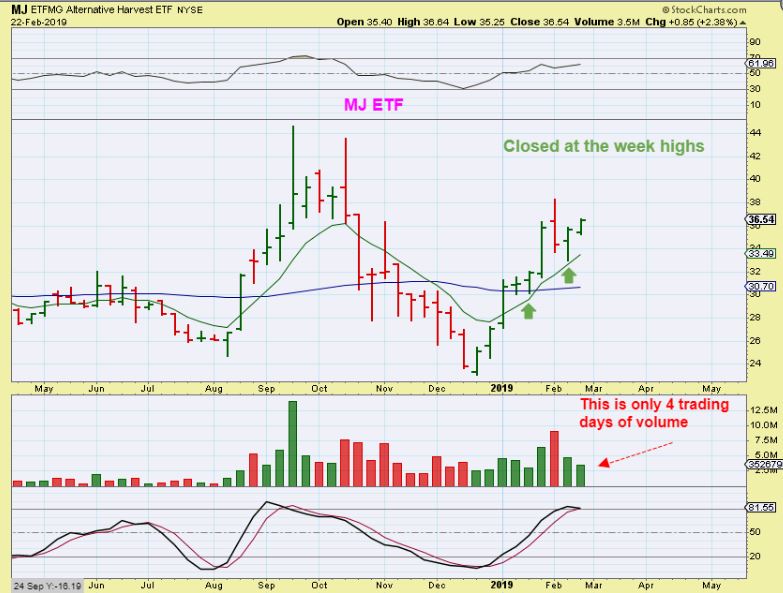
THE MJ ETF closed at weekly highs, and still looks fine at this point.
.
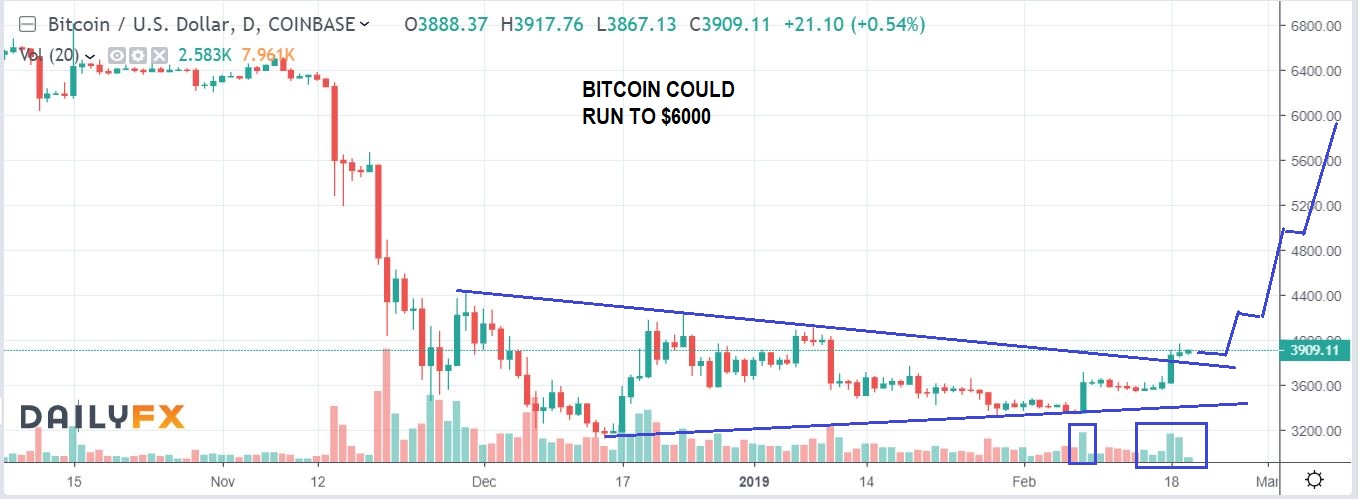
I have been pointing out BLOCKCHAIN STOCKS for the fast traders or those that want to try a SMALL position. We have seen explosive moves, but these are DEFINITELY Not easy to ride. I am thinking that if BITCOIN runs to $6000 like I mentioned, these can become MASSIVE GAINS percentage-wise.
.
BITCOIN – On Feb 9th I posted and pointed out this Bullish set up. BITCOIN $6000 would be a double, but the blockchains stocks that I mentioned tend to put on Massive gains. RIOT, MGTI, MARA, HVBTF, XNET, BTSC & BTCS are just some that I pointed out.
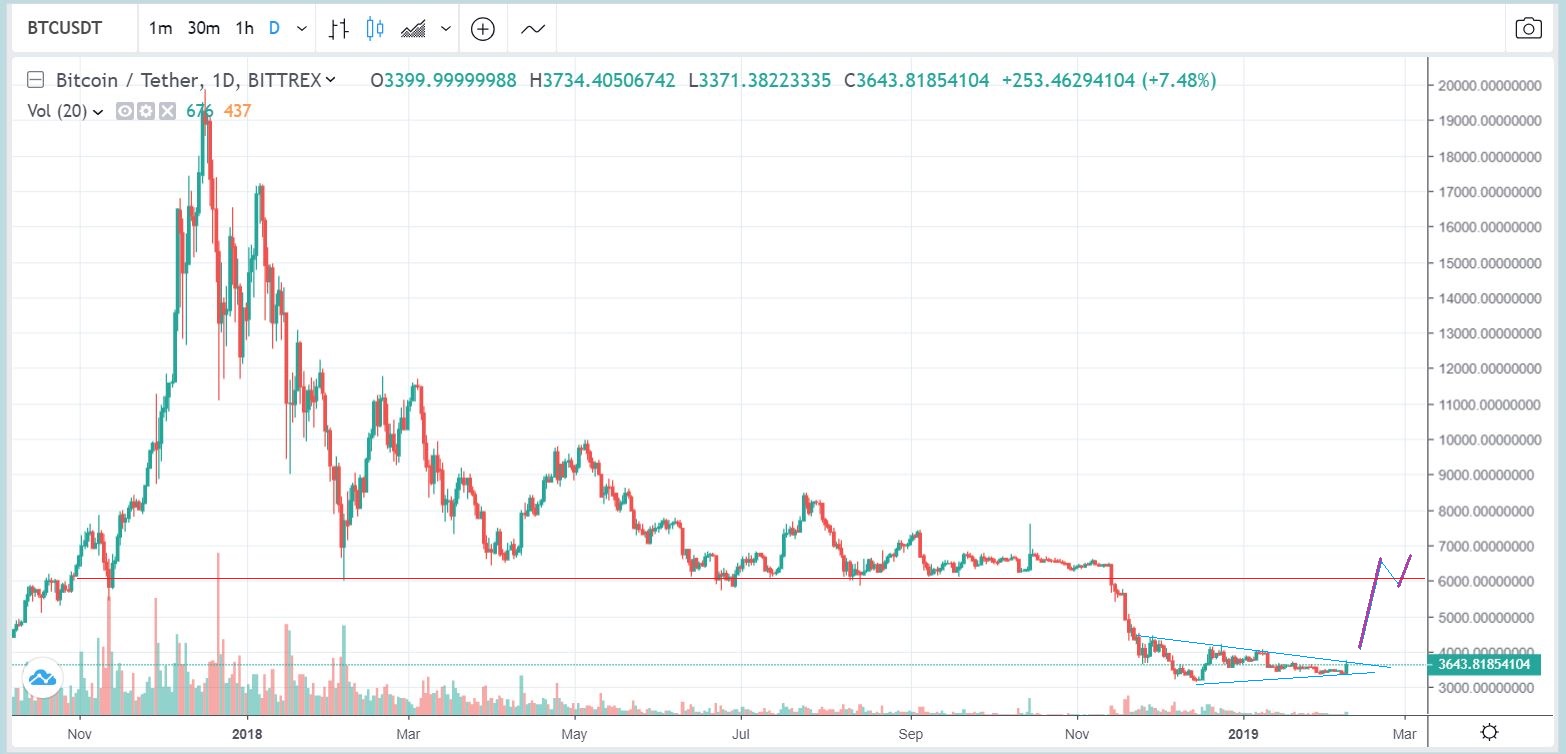
BITCOIN – We got our break out and another bull flag and those blockchain stocks are acting very bullishly.
.
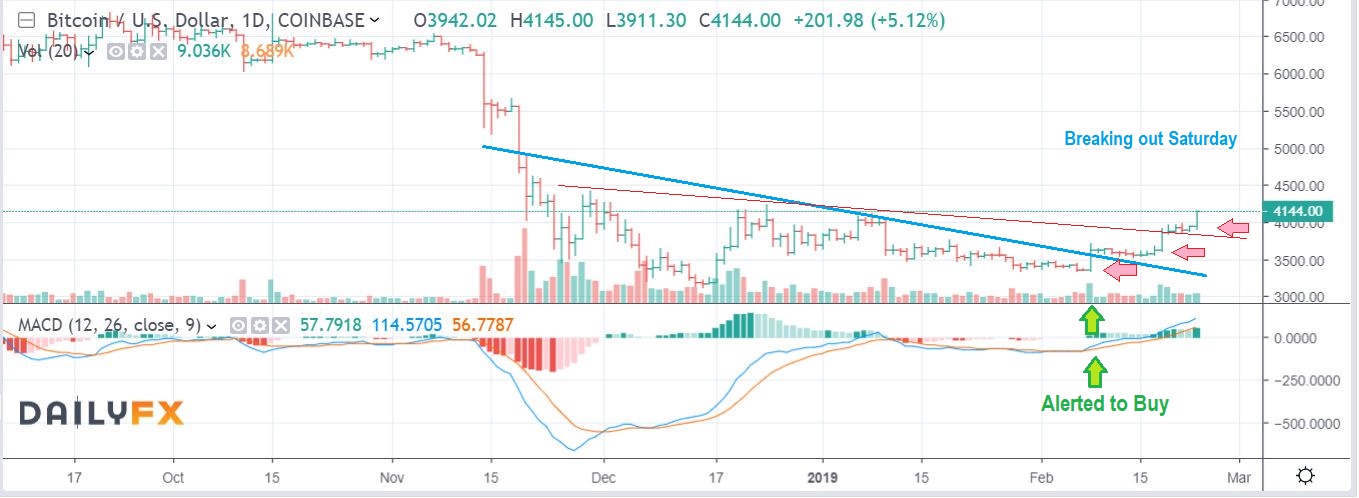
BITCOIN SATURDAY FEB 23 – BITCOIN trades 24 hrs, and as I wrote on Saturday, This is breaking out. T he blockchains stocks could really react going forward.
.
HVBTF FOR EXAMPLE: I have been posting this as one a lot a buy on the 50sma at 25 cents and as it progressed. I said that I own it…
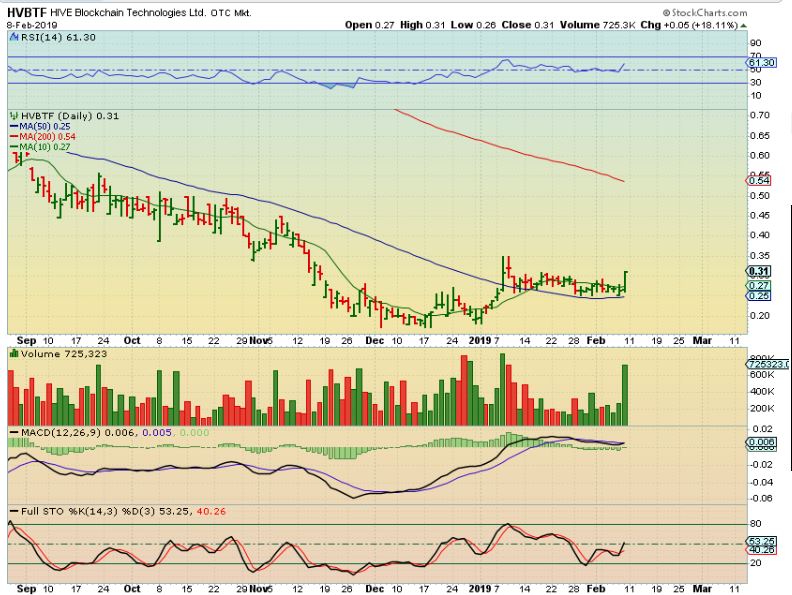
HVBTF : As it progressed, I pointed out the solid volume increase.
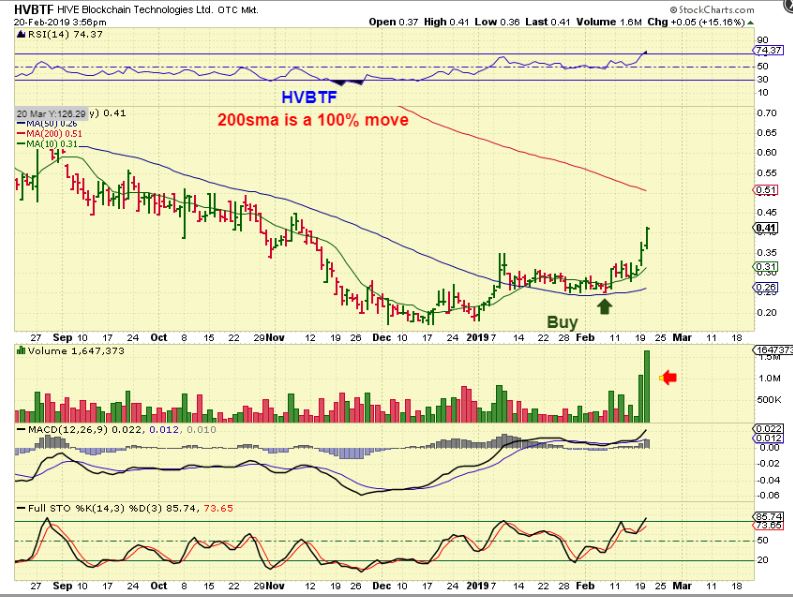
HVBTF : I also posted this on FEB 20 to show that this has huge potential from a 25 cent stock.
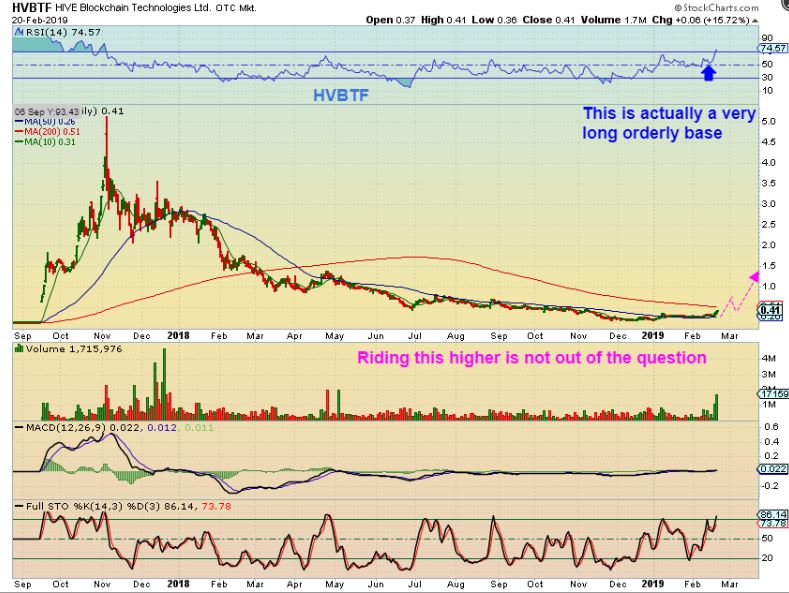
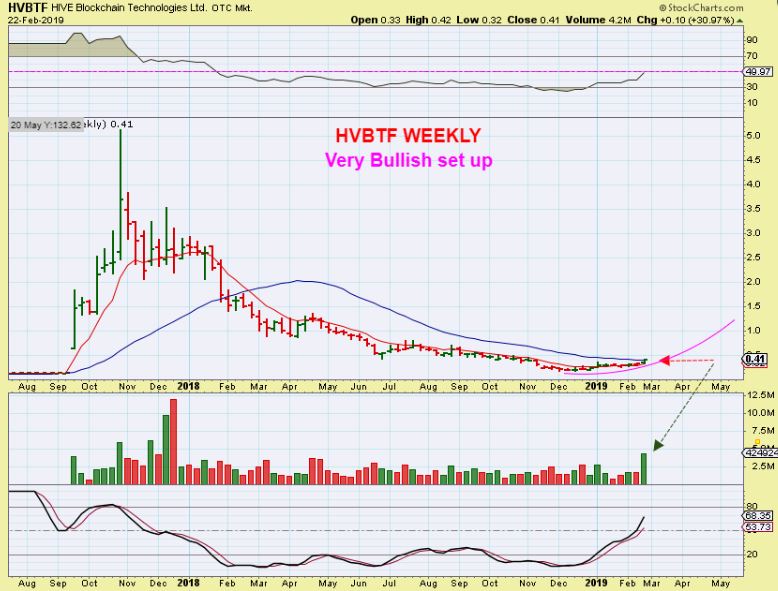
HVBTF : Now look at the weekly chart and you’ll see it breaking with high volume above both the 10 & 30 weekly ma. That can become very bullish. I still own this.
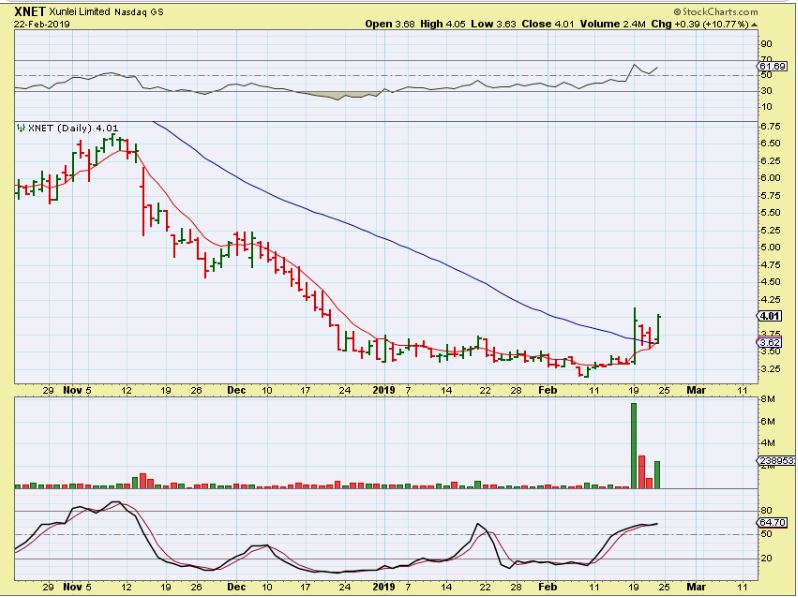
XNET Started to break on FEB 20 – Here it was $3.50
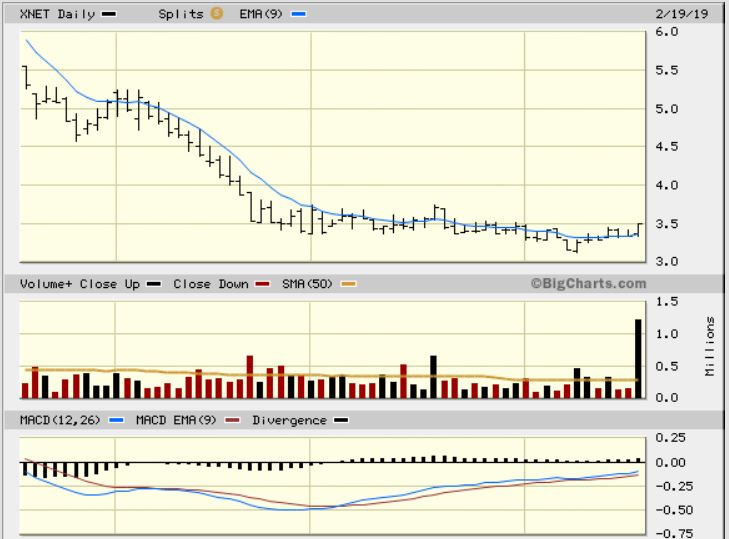
XNET – Sure looks ready to run. After breaking the 50sma, it had a 2 day dip and then Popped Friday again.
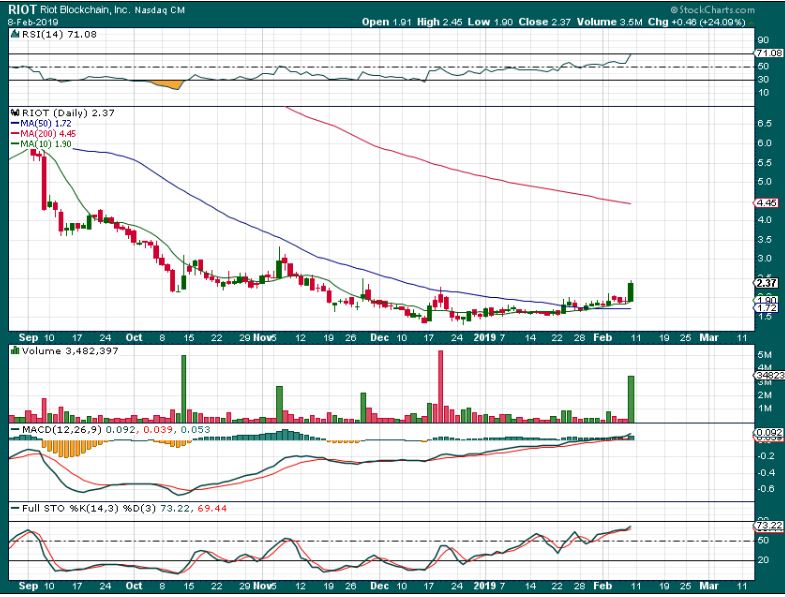
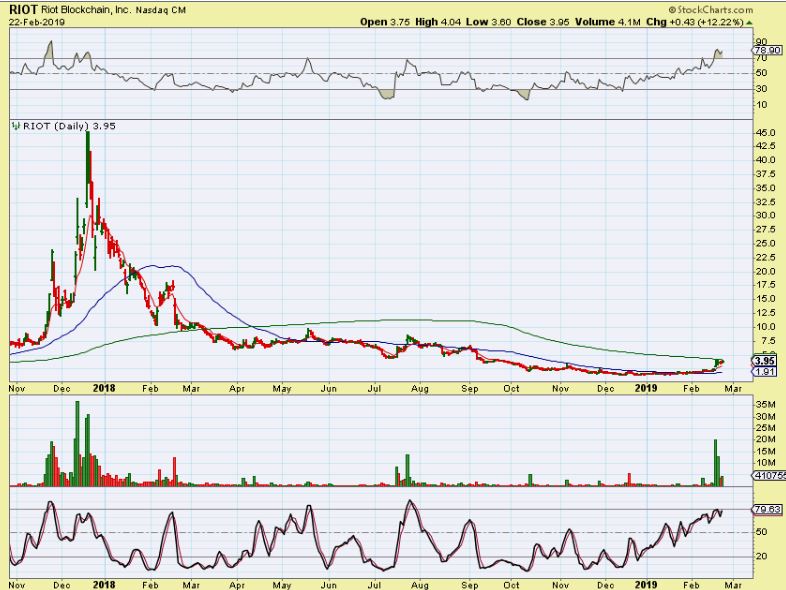
RIOT was posted here as it popped to $2.37 on Feb 8. I love long round bases. Watch for a run to the 200sma…
RIOT – Wow, that was fast! It definitely looks like a bull flag then formed and with Bitcoin Popping Saturday, this may break out above the 200sma on Monday. If it does… 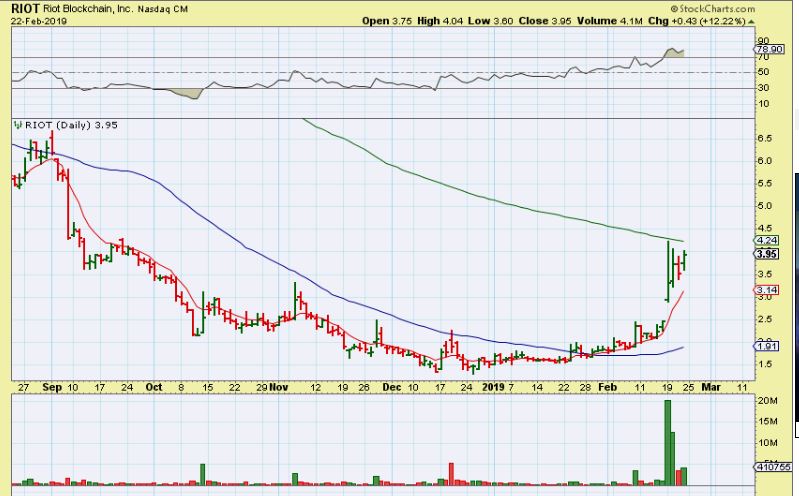
We could definitely be seeing the start of this sector ramping higher. I don’t know if this will continue to be as bullish as it seems, but the potential on these are extremely good.
There are many other Blockchain stocks acting correctly, some where mentioned here when I thought I saw the Bitcoin base set up. Look up LFIN, MGTI, MARA, BTSC & BTCS for starters. These look to be following through, and they are ones that I will discuss and trade going forward , but for now, let’s see what happens next week. It looks very good so far, but I do think we need to see BITCOIN follow through to get a good run on these.
.
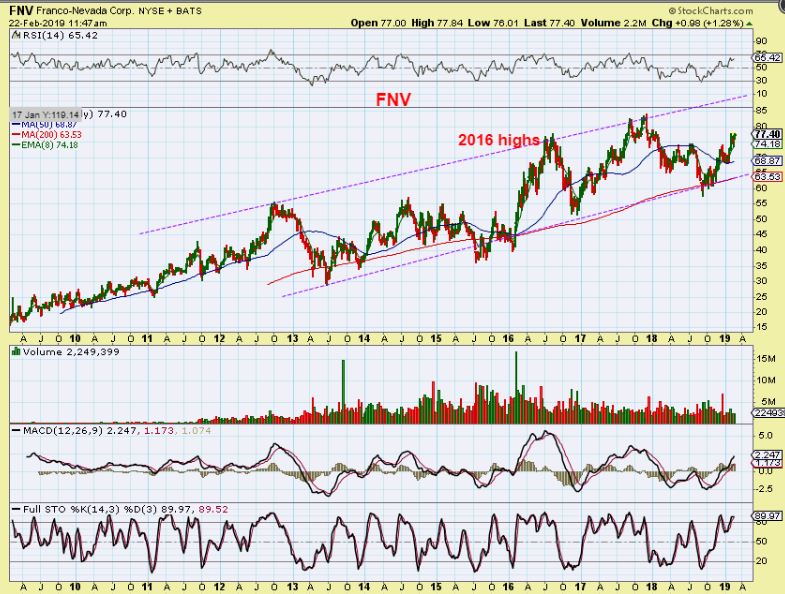
FNV– I just wanted to point out that FNV is near 2016 highs already. That is very bullish, so buying a pull back on FNV could be good for a longer term buy & hold investment. A break to new highs has no resistance, as we’ve seen with KL.
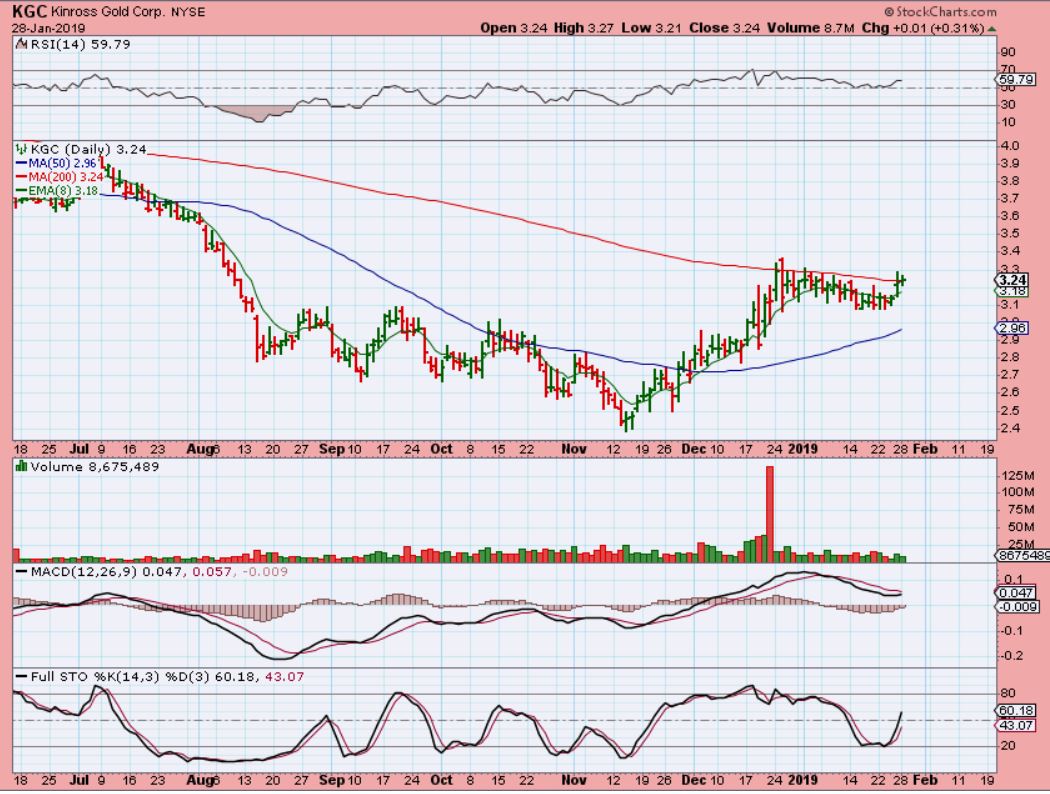
KGC– KGC was a Buy at the 50sma, and then again here at the 200sma in January. It then broke out and ran to $3.80 forming a big cup. Even though we expect a pull back in Miners, this may find support at the 200 sma , and …
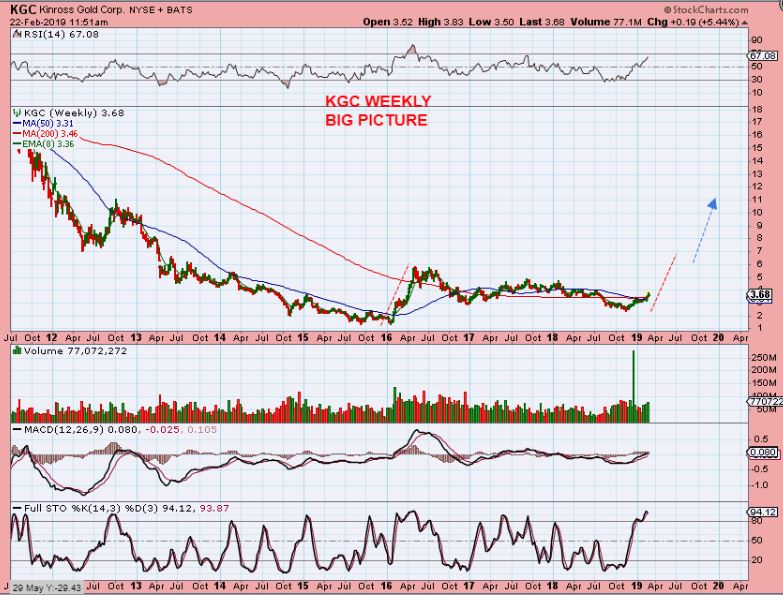
KGC WEEKLY- It may only just be starting the Big Run. IF THIS DIPS, WE WILL LOOK TO BUY THIS OR ADD AT THE 200sma.
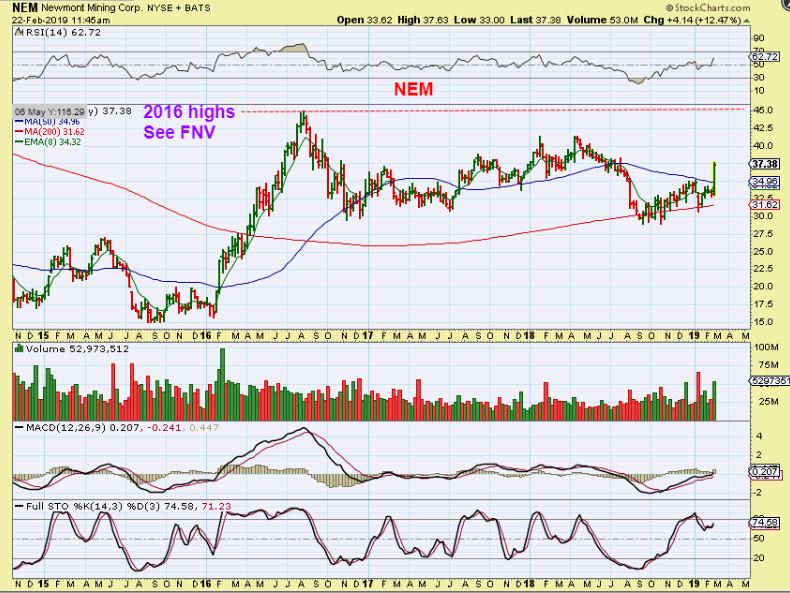
NEM– NEM dropped to the 200 week MA at the last ICL. It has been choppy, but it really Popped this week ( 12%) with news that Barrack admiring a relationship with NEM. Barrack merged with GG recently. After the next ICL, NEM could run to the 2016 highs and break out to new highs. It tripled in 2016, this may make a nice run in 2019 too.
There are many nice set ups in the MINERS. As they pull back, we should get some very nice entries, so I will be watching for that.
.
The solar stocks have still been running bullishly too. Some were pointed out here ( JKS, ENPH, SPWR, CSIQ, VSLR, SOL, etc ) , but I only short term traded them and moved over to trading Miners, MJ stocks, etc.
.
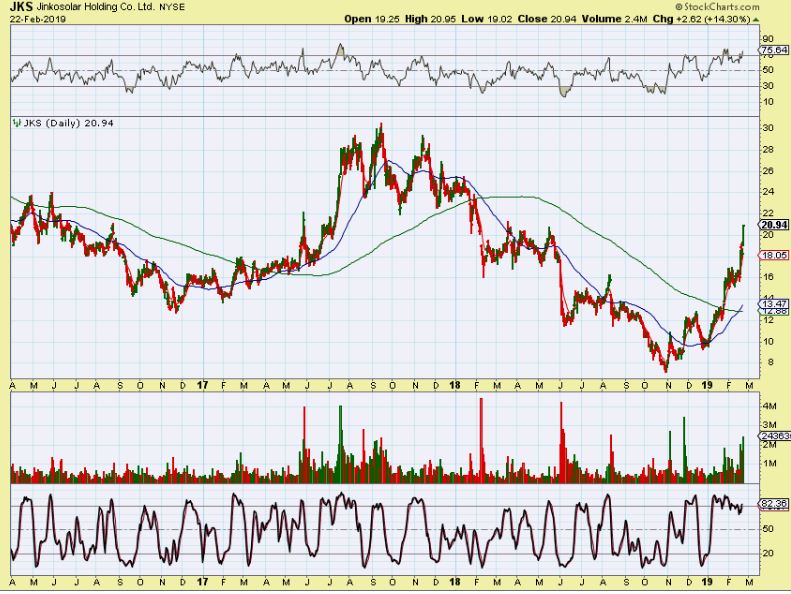
JKS – I was asked about the JKS trade “Should I sell?”. It has really ramped up out of the 1 month consolidation, and look how it hugs the 8 ema. Often I would sell at least some on the way up, maybe with a break of the 10 sma, but when I step back…
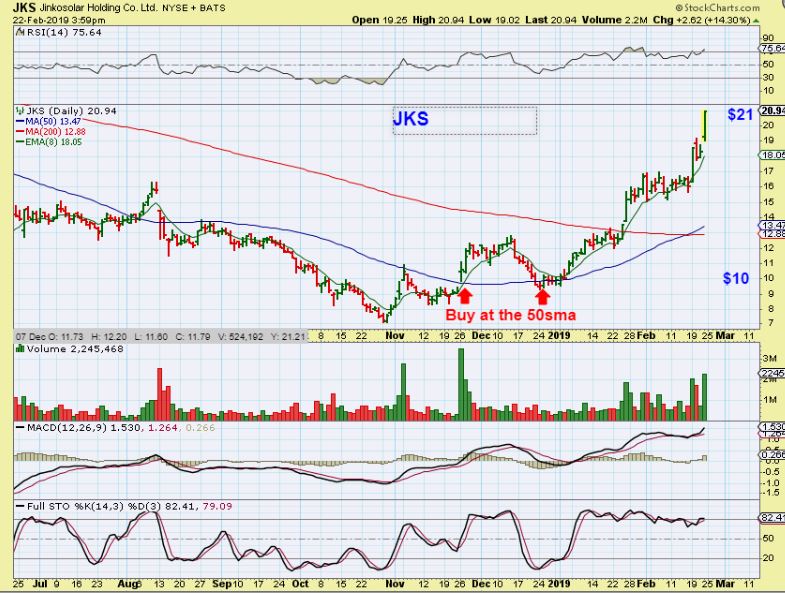
JKS – I step back and look at this ramp up and I think that sooner or later, it will get back up to the prior highs. Sell partial and let it ride? I usually do that because I cannot tell if it will back test the 50sma, or if it will just rise up, bull flag, and rise up again. IT’S A TOUGH CALL.
DIARY OF ENPH – I have so many charts of ENPH, mainly because it has been very good to us. It is a pretty steady gainer in the good times, and was a BUY recently too, so let’s just take a look at a few of those many charts and see the progress, and where we are now.
.
ENPH – In 2017 I loved this base. I accumulated some under $1 and then added in August 2017 near $1 on the first pop above the weekly 30 ma. So on FEB 2018 I posted this as a BUY or good place to add on this back test & reversal. I wanted to just BUY & HOLD this run all the way back to $14 🙂

ENPH – However, I sold mine during all of this choppiness, I didn’t really anticipate this choppiness. Then when it dropped and reversed at the 200sma in September, I posted this as a new buy ($4.50 – $5).
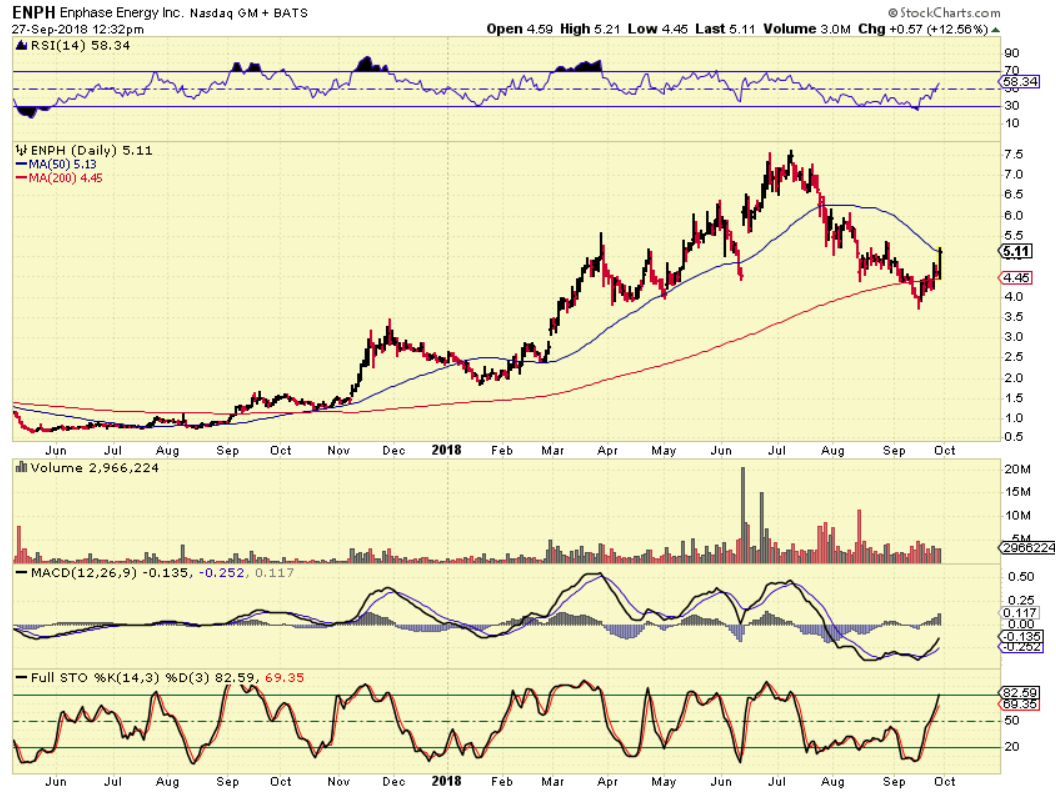
ENPH – I really liked this set up , so it was a buy again. NOW…
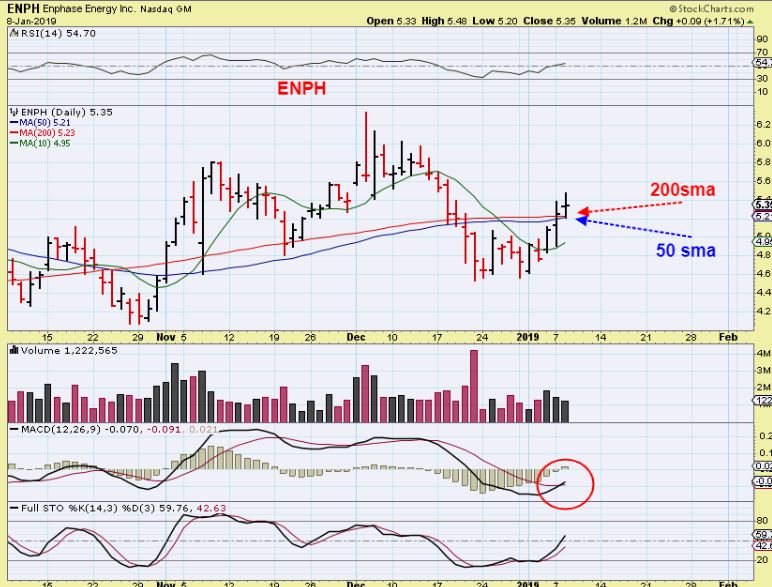
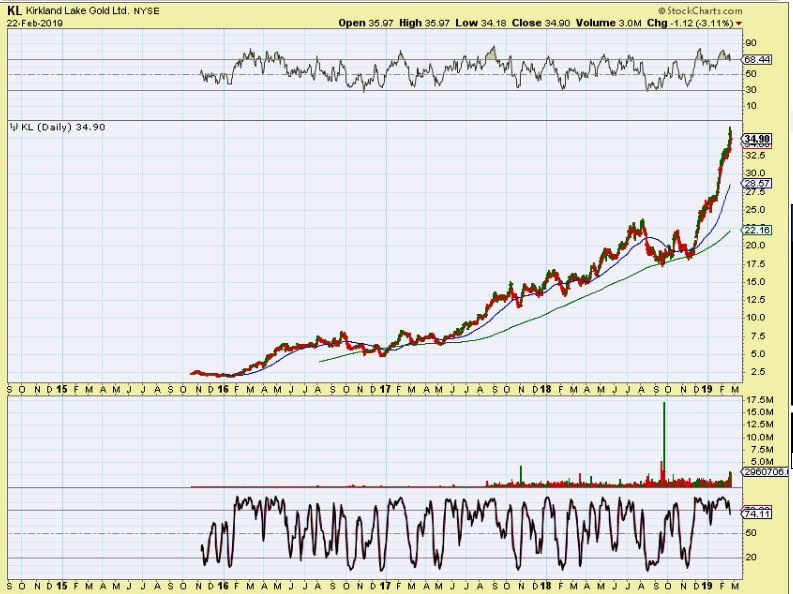
ENPH – Now it has run to $8 and completed the CUP. This does still want to run to $14 in my opinion. This cup could form a handle and become a buy again, OR this also MIGHT JUST KEEP going. Let me show you KL after KL double tagged the 50sma like this. KL took off and never looked back …
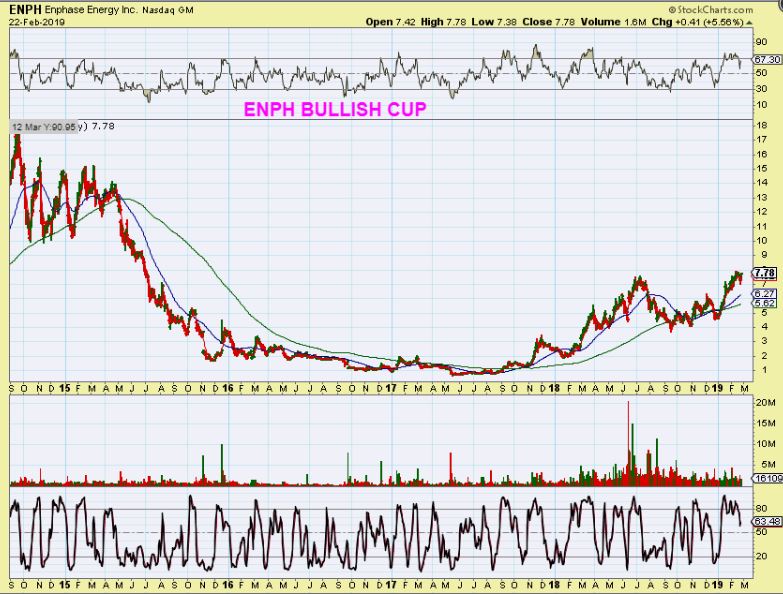
Look at KL after tagging that 50sma with a double bottom. ENPH could do the same thing on its way back to $14.
-If you own it, it may be worth holding on if it breaks higher, and just use a stop.
– Or take some profits, and add back on after a pull back or a break out
S.O.G. Mentioned PLG in the comments. I agree, that is a beautiful Weekly chart, it will be in future reports too.
.’

