February 22 – Just Thinking Ahead
As mentioned in recent reports, I am expecting the markets to pull back soon. There have been some great gains in the run out of the lows for the General Markets, Oil, and Precious metals / miners, but we really are due for a rest. Just because I am expecting a pull back soon, that doesn’t mean that we are finished yet though. The Theme picture may give you an idea of what I am talking about. Lets discuss the markets and do a little thinking ahead…
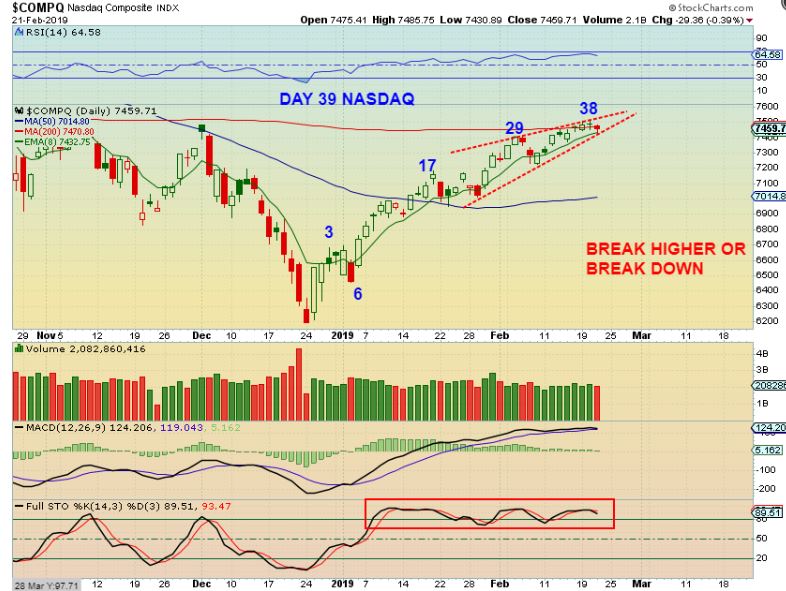
NASDAQ – A strong run out of the lows, not many red candles here, but I still think that this is due for a dip. If this breaks out higher and continues higher, than I may need to consider whether it put in a stealth DCL back when I have been saying Oil put in a dcl ( Oil on Day 32). If so, this would only be day 8.
I wrote this yesterday, and we’ll have to see what happens Friday...
I ACTUALLY FOUND ANOTHER REASON TO BELIEVE THAT WE POSSIBLY DID SEE A DCL ON DAY 31, but I’ll know better after today.
.
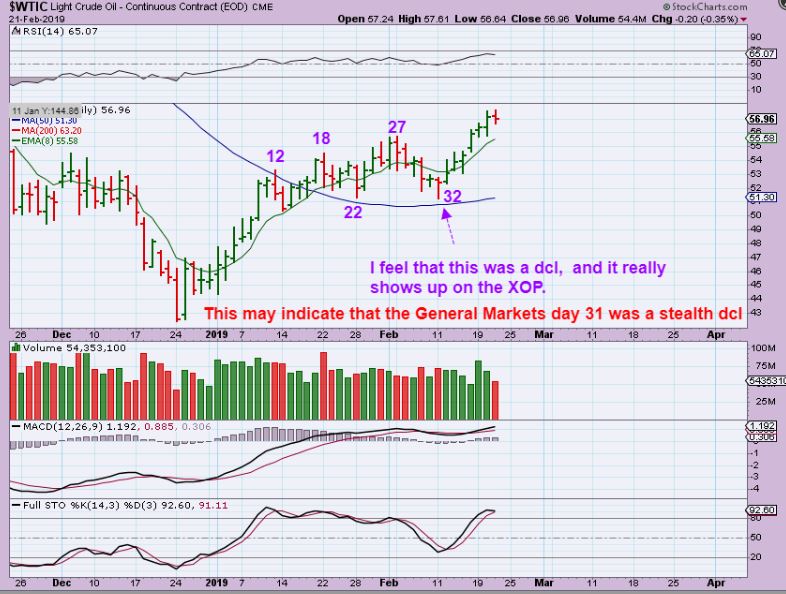
WTIC– And Oil had that dip on day 21 that got the stochastics down to oversold.
.
THE SPX DIP COMPARED TO OILS DIP
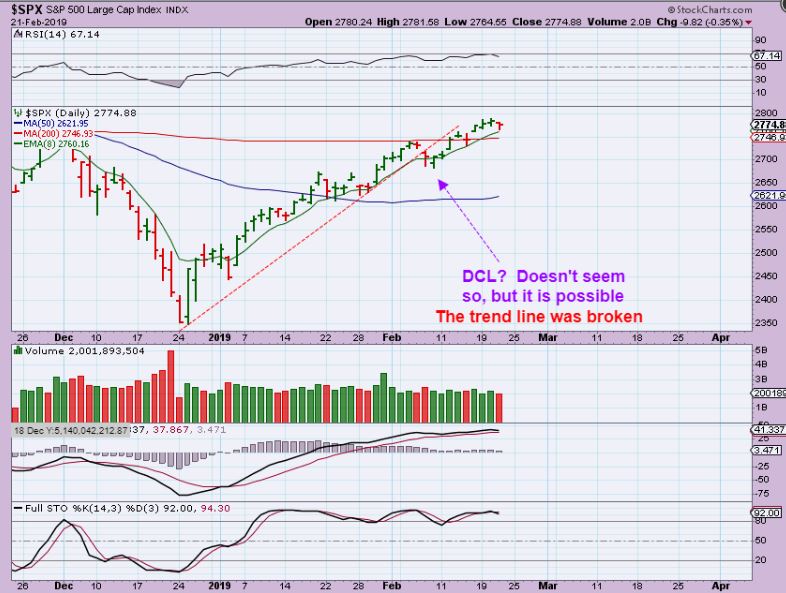
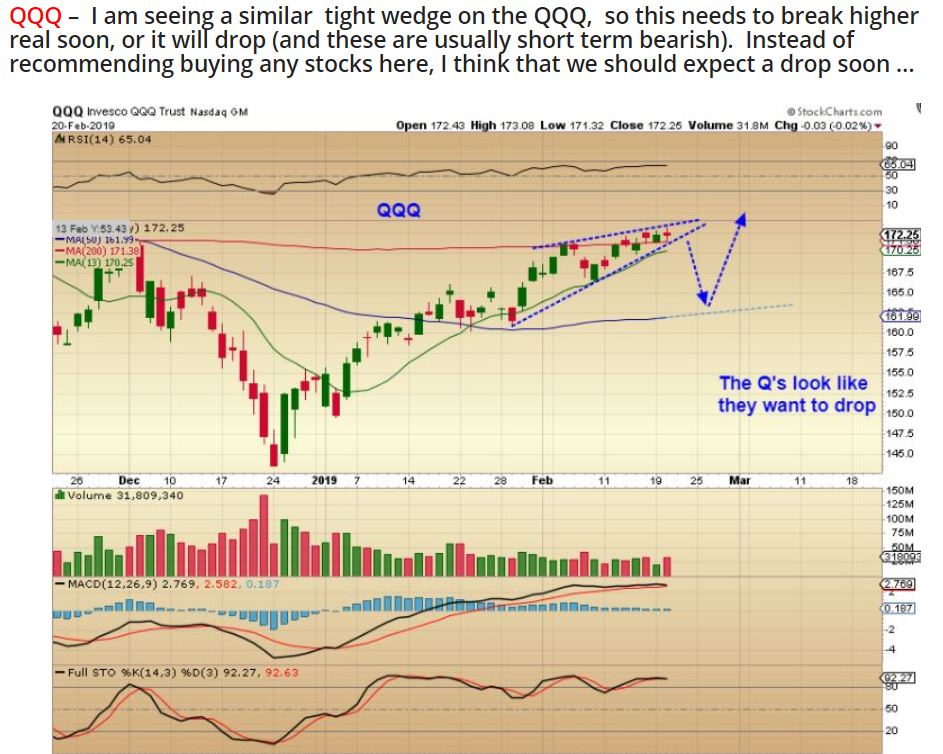
So these are the things weighing on my analysis. Timing, A DCL in Oil, a trend line break, but could have only been a 1/2 cycle dip earlier at day 22, wedges forming, etc etc. I want to see if the General Markets run higher or break down from here. It feels to me that a dip is due, but we have seen GOLD continue to avoid a deeper dip, and the markets have been strong since the V-Bottom.
,
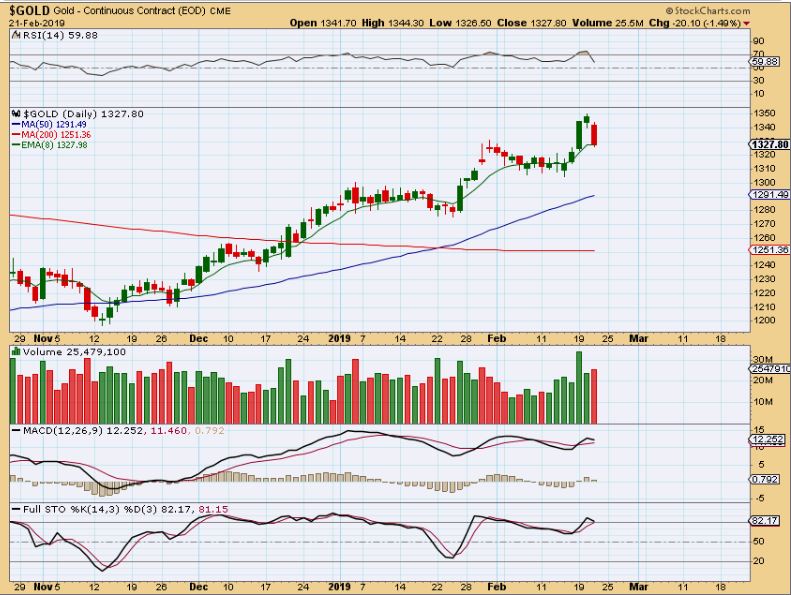
GOLD – Gold has been strong out of the lows too. After a 2 week sideways move in February it popped but it is also getting late in the daily cycle, so we got a dip. Gold dropped to the 8 ema Thursday, and it can get choppy or even just break the 10sma and continue lower…
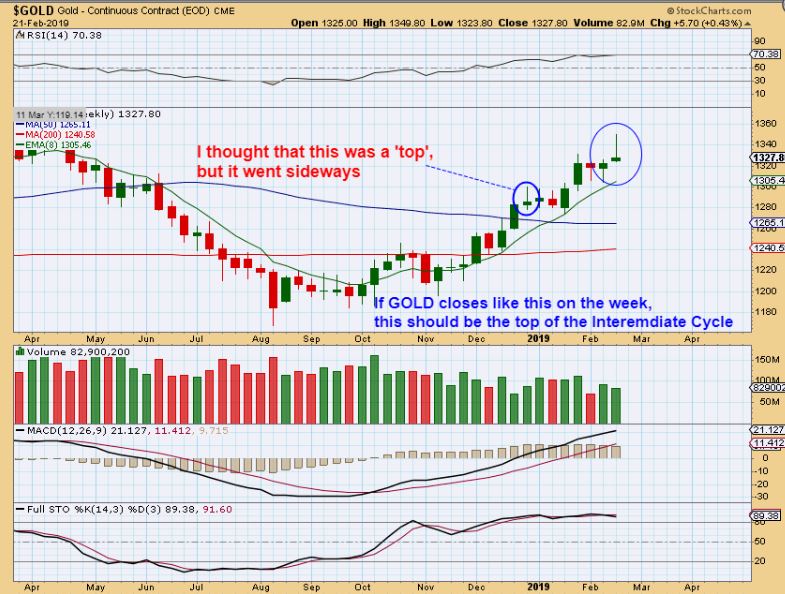
GOLD WEEKLY – I am interested in seeing how Gold , Silver, and the Miners close Friday, because that closes the week. This is a topping candle at this point. Read the chart, we did see one before, but the Intermediate cycle is getting late now – ICL to ICL is ‘roughly’ 6 months, and this is month #6.
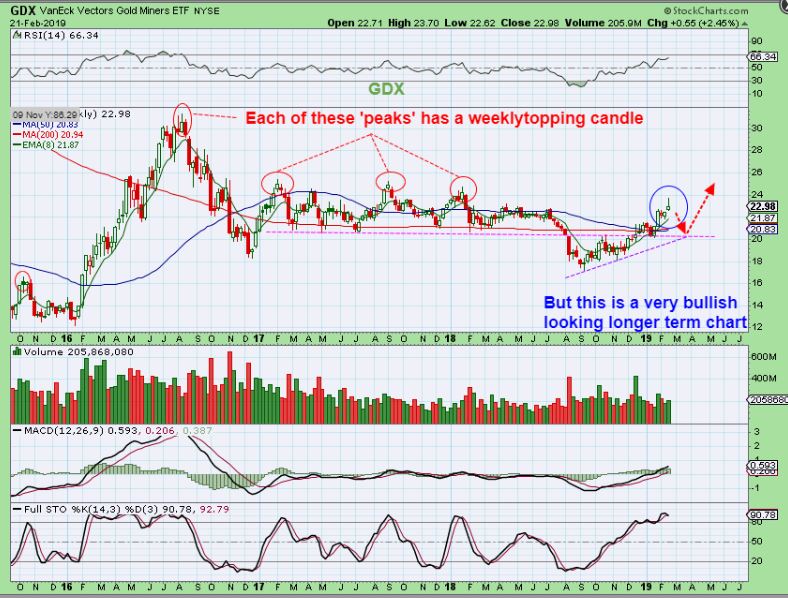
GDX WEEKLY – I’ll just do the same thing here, Fridays close could leave a topping candle, notice that almost each major ‘Peak’ had one. We do have solid support below, so a dip over time may not be all that deep.
.
SOME INDIVIDUAL MINERS DO STILL SEEM TO BE PLAYING OUT THEIR OWN
.
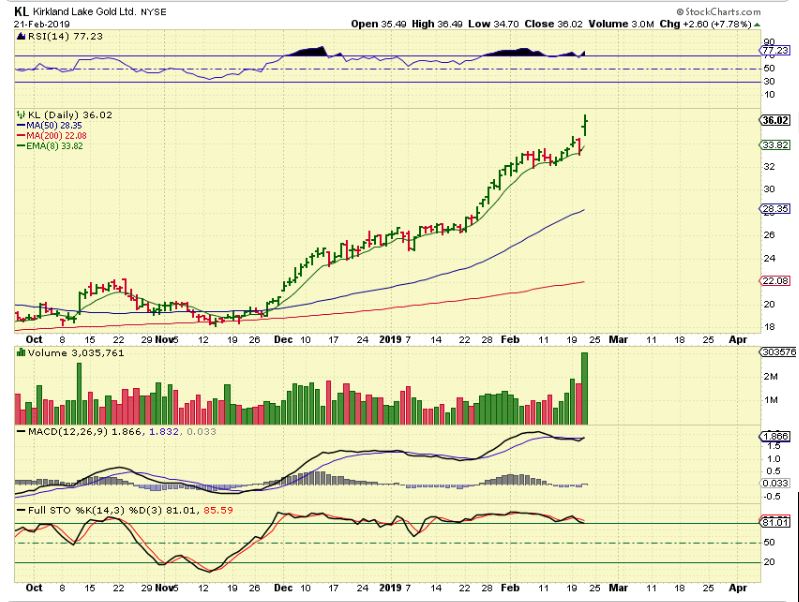
KL continued higher even though Gold dropped for example, thus confirming that some of these may ‘hold up’ better than others as they do their own thing. This could be an exhaustion top for KL, and it is a high volume doji, so I am NOT saying that this won’t pull back, just that Some miners may move higher as Gold dips.
.
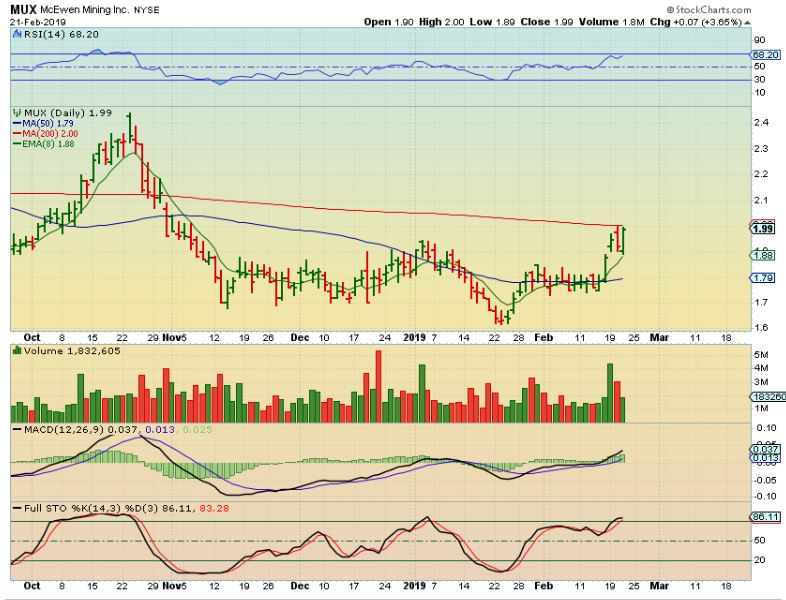
MUX – After an earnings release, MUX sold off, but after filling the gap & tagging the 8 ema, it surged higher. Gold was down, so that is Bullish, this looks like it wants to break out actually. This is called ‘Pushing the 200sma’ and it looks like it wants to break out and run to prior highs near $2.40. It may crawl sideways or just break out, but either way, it seems to signal that the lows are now in and this base should hold for MUX (Finally) .
So at this point, we are awaiting pull backs and that is usually a good time to start thinking ahead. Though there will still be trades for traders, and some investments can continue to rise, a pullback can be an opportunity to add to current positions or start a new one. I usually look for areas that buying the dip will be risk / reward advantageous. I am going to be actively doing that going forward, but I also want to discuss this further below and a trade idea or two.
.
Enjoy your Friday trading & your weekend!
.
~ALEX
.
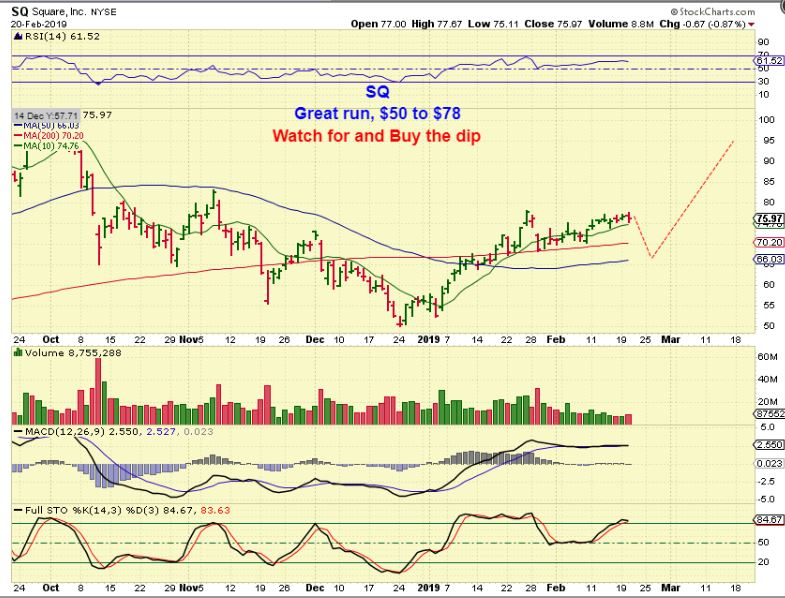
SQ – Yesterday I used this chart of SQ and mentioned that during the pull back, I like to anticipate the drop to a possible support area and be ready to buy or add to current positions.
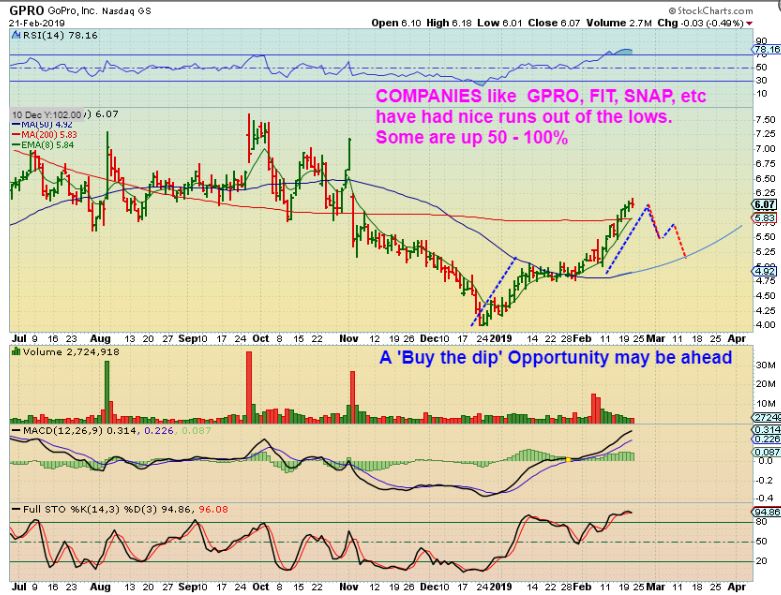
GPRO was posted as a place to add or ‘buy’ here on Jan 24th when it popped above the 50sma.
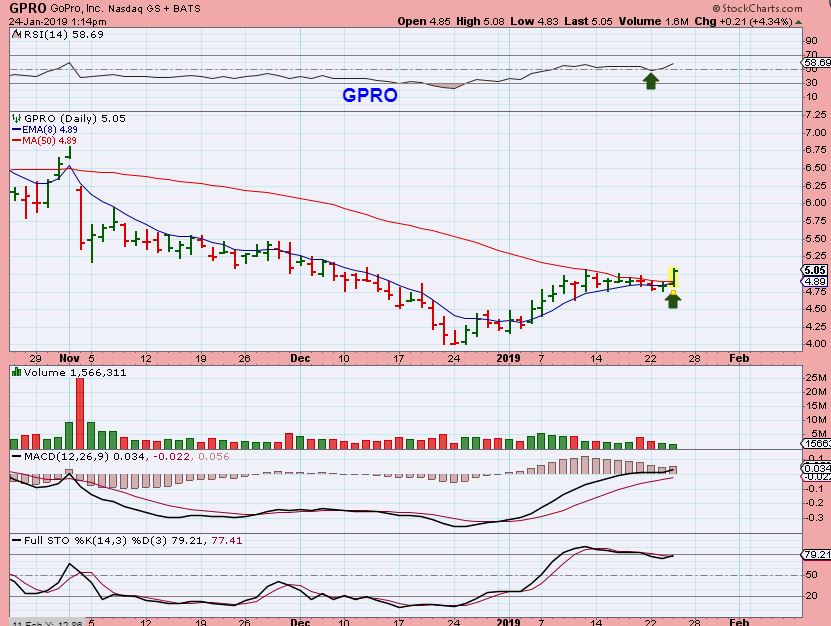
GPRO – It has now run above the 200sma, so if it dips during a market pull back, THIS GOES ON THE POSSIBLE ‘BUY THE DIP’ WATCH LIST.
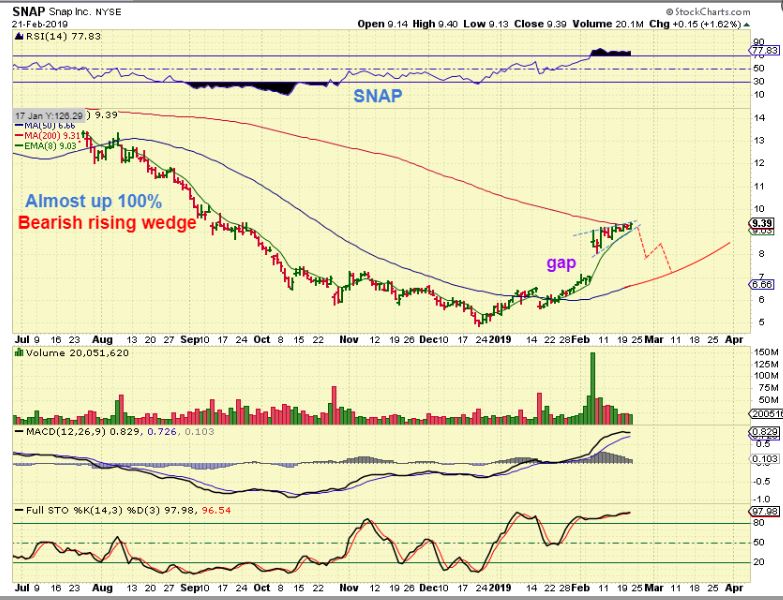
SNAP – SNAP has almost doubled out of the lows $5 to $9.40, but I see a bearish wedge & big Gap, so THIS GOES ON THE POSSIBLE ‘BUY THE DIP’ WATCH LIST.
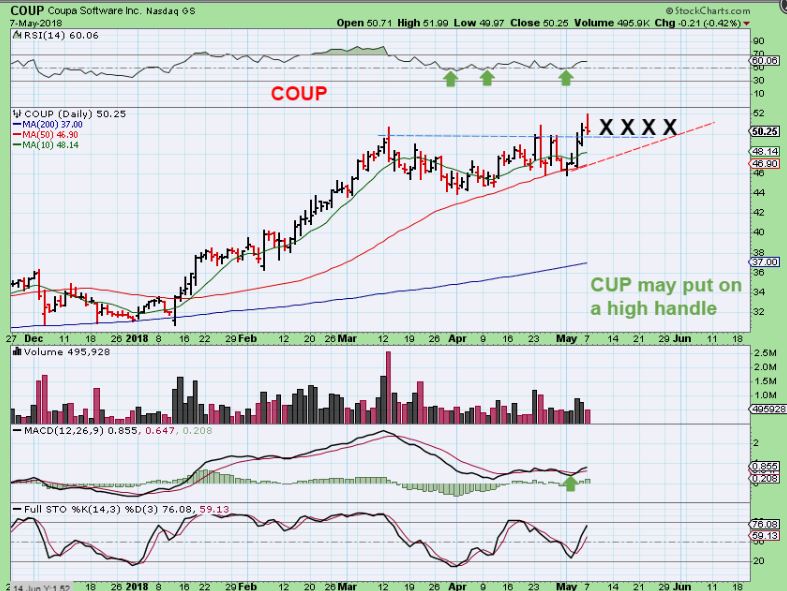
COUP – You may recall trading COUP last spring. Last year it was a buy at $32 in JAN 2018, and then This was a buy at $50 in May. Well…
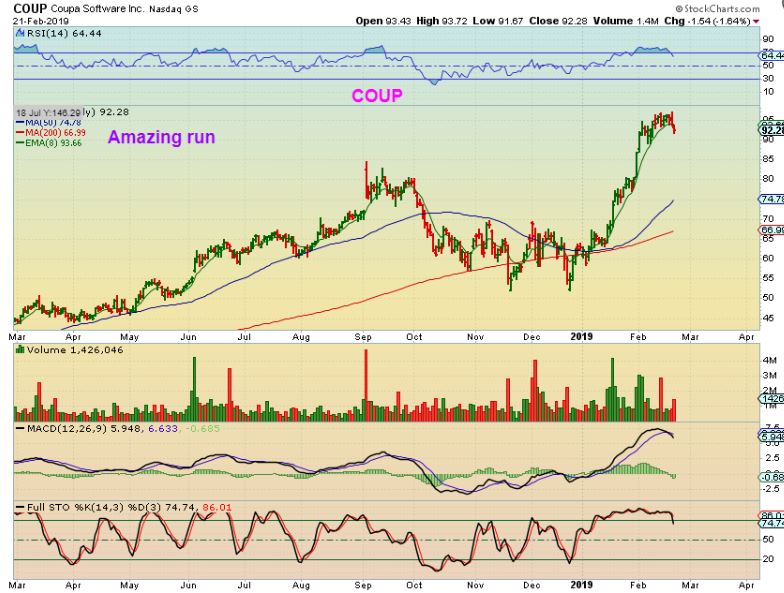
COUP – Coup then ran to $85 into September, crashed down to the 200sma in the market sell off, and JUST RAN from $52 to $92. WOW! THIS has been a real winner, but a really tough ride on the pull backs too. SO, THIS GOES ON THE ‘BUY THE DIP’ POSSIBILITY WATCH LIST. I can see this dipping down to the 50 sma – we’ll see.
Some of my Trade ideas out of the lows were SQ, AMD, CY, MU, GPRO, SAIL, IO, VIPS, VHI, LX, etc etc etc. Many ran well and may do another leg higher after a pull back. We’ll have to wait and see.
.
OTHER WATCHLIST MATERIAL
.
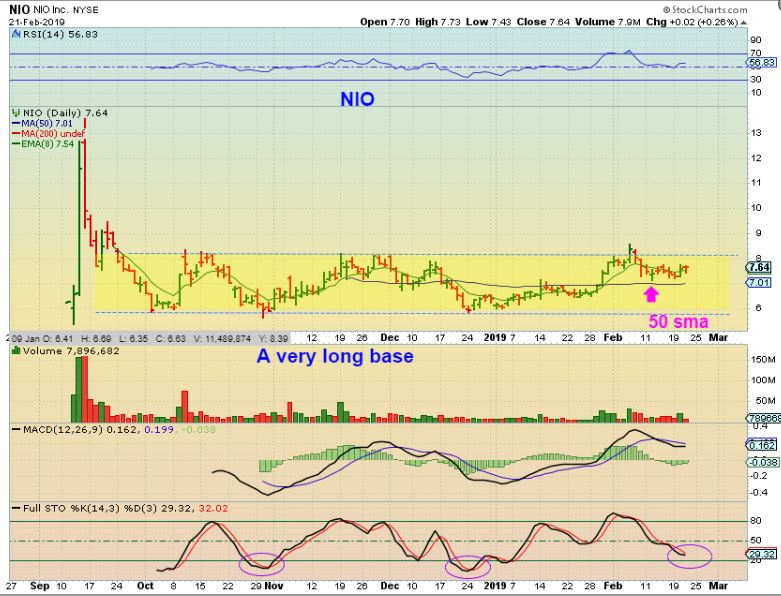
NIO was highlighted as a nice base breaking higher above the 50sma here on Jan 30. I thought that this might be the break & run out of this base, so it was a buy…
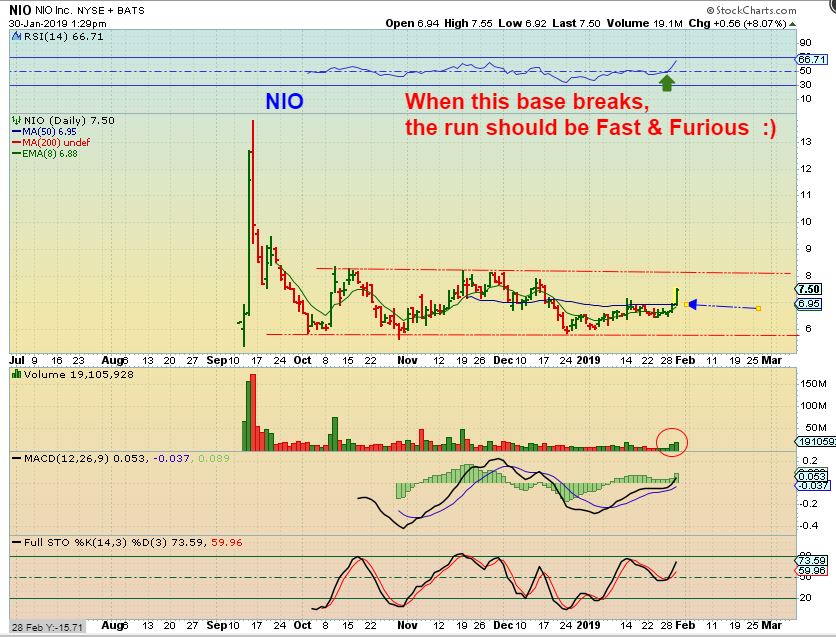
NIO – It did try to break out, but has now pulled back to that 50sma, which DID hold as support. NIO is a different kind of watchlist, because it is still in that giant base, but it could break higher at any time. Earnings for NIO is March 5th.
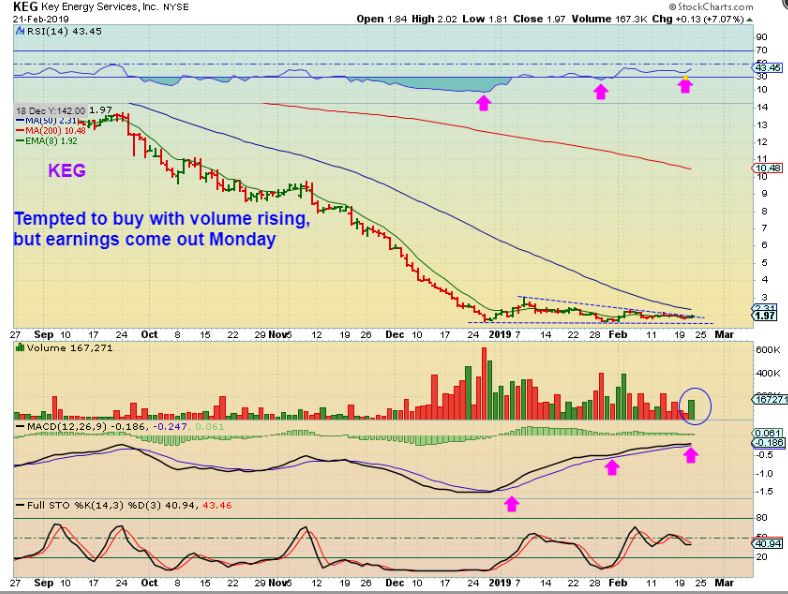
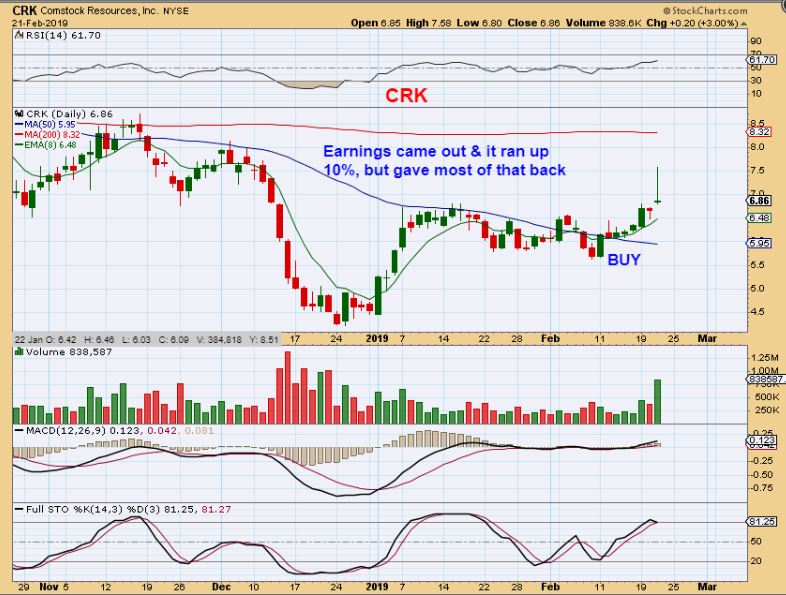
KEG – Volume surged on KEG, and if you zoom in, it POPPED 7% Thursday. I was VERY Tempted to buy it here, but earnings are due this Monday. I will wait, but CRK earnings were this morning, and that went fine. Let’s look at CRK.
CRK – This has been a ‘BUY’ here ( And I bought it) since it pushed under the 50sma. Earnings came out pre-market and it ran 10% higher, and stayed there for most of the day. Then, it turned & gave most of it up : (
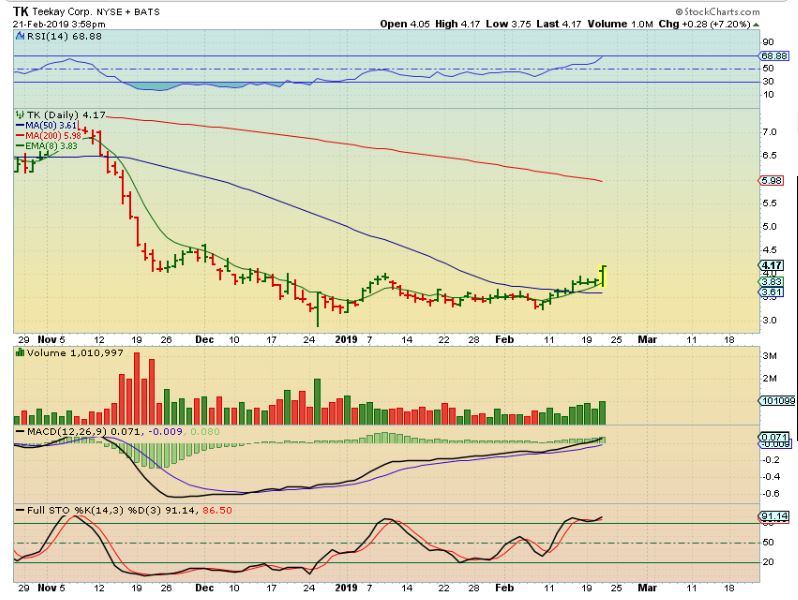
TK – Another buy recently was TK and it also had earnings . It dropped to the 50sma & went red, but then reversed and began to push higher, up 3% midday, so I grabbed this chart. That looks bullish, and my thinking is , ” They couldn’t break it down after earnings“. Read the chart…
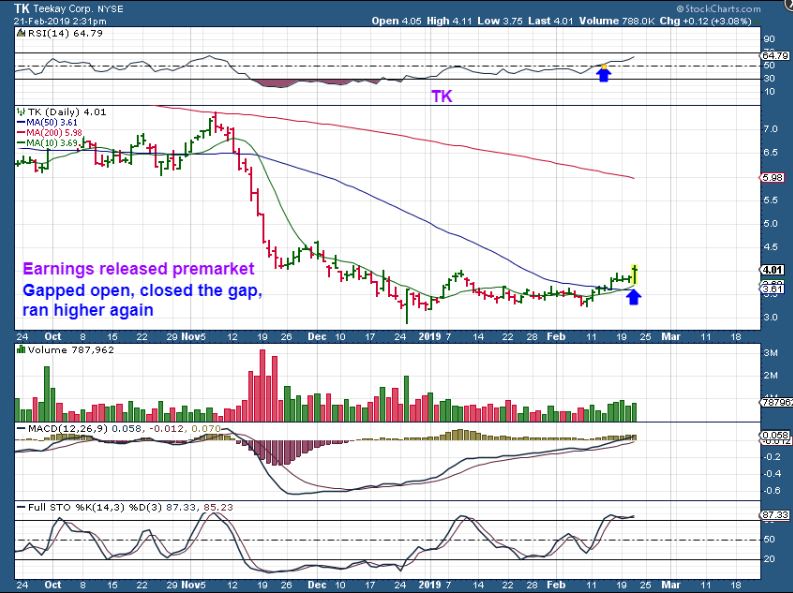
TK – Then it ramped up and closed up near 7%. This could run to the 200sma now, with earnings behind it.
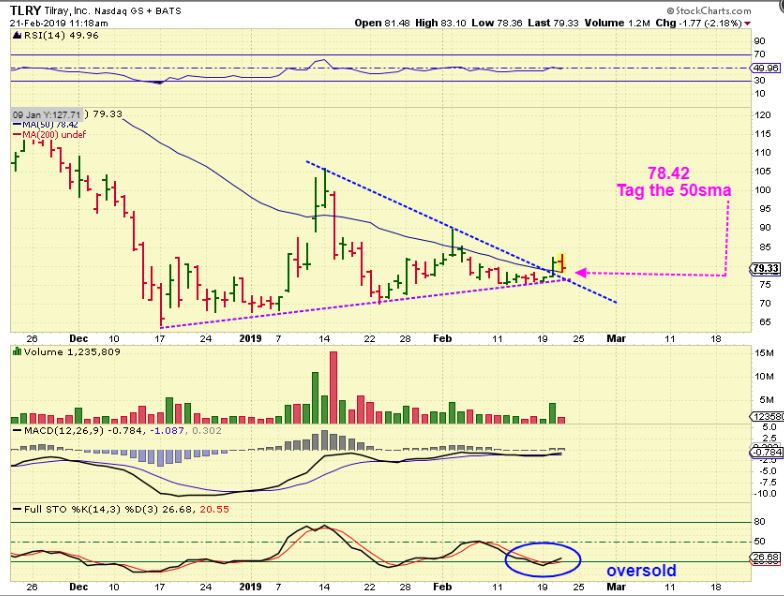
TLRY – I added to TLRY as it dipped to the 50sma. I posted this in the live trading /comments area.
.
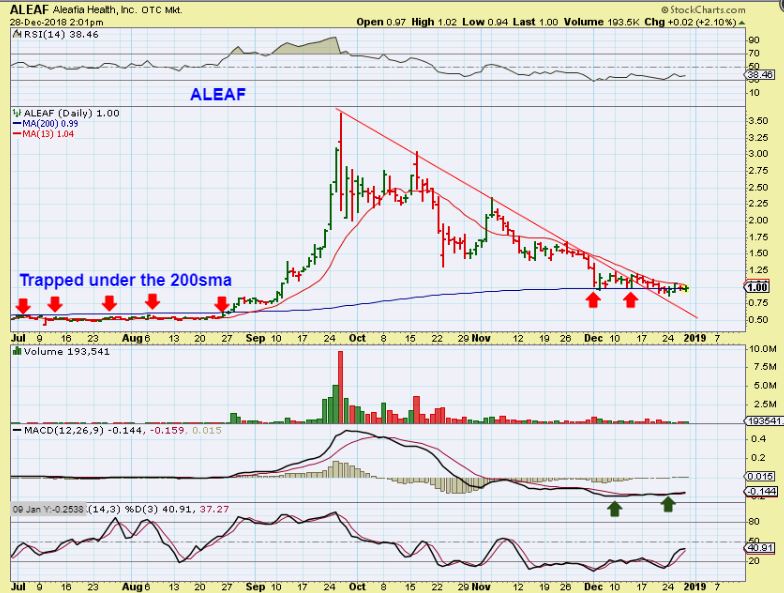
The story of ALEAF continues…
.
ALEAF #1- I was buying ALEAF as it rode along the 200sma forming a base. I know that others joined me at $1.00…
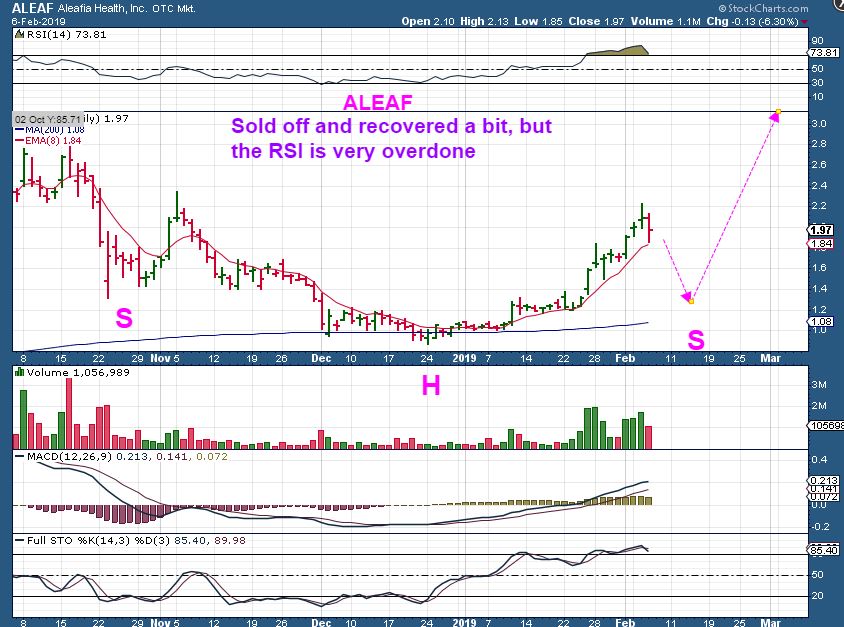
ALEAF #2 – After riding an EXCELLENT RUN from $1 to over $2.20, I predicted that ALEAF could see a pretty good drop back on Feb 6. The intraday charts were showing fatigue and the daily was overdone. I pointed out that I would watch for an inverse H&S, and sold some of my holding for 100% gains. Would we get the right shoulder?
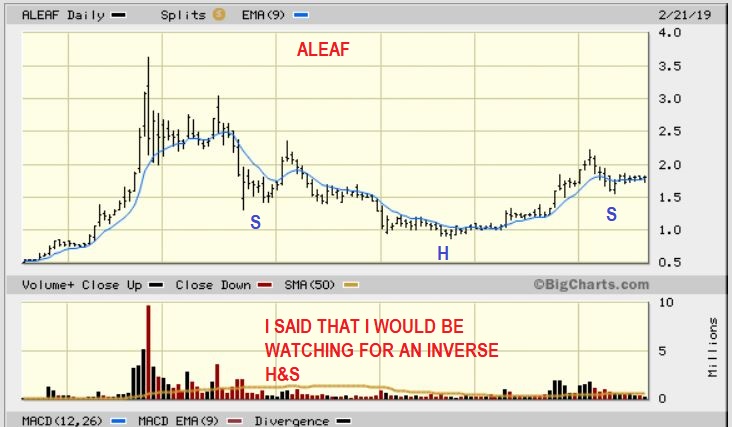
ALEAF #3 – This looks like a right shoulder so I grabbed this chart as it reversed ( I watch this one & many others daily)
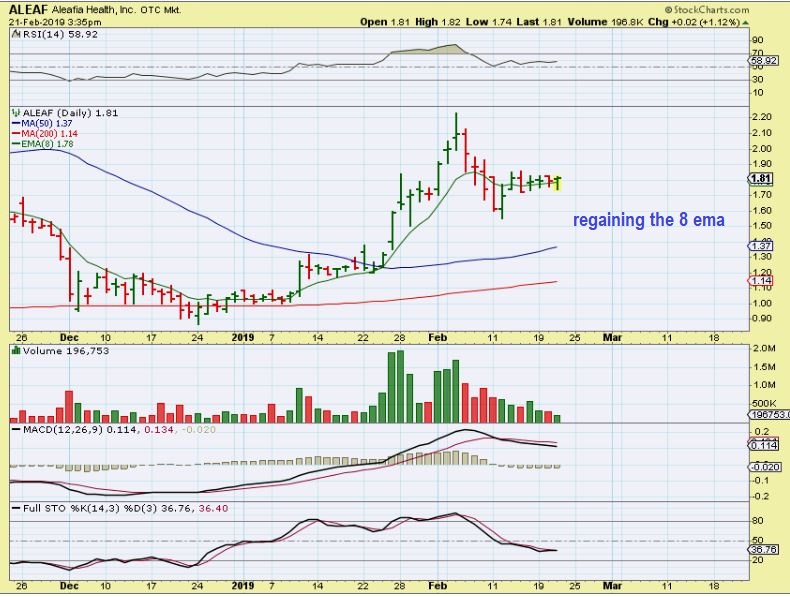
ALEAF #4 – The reversal on Feb 12 looked real, and price was regaining that 8 ema, but why didn’t ALEAF drop to the 50sma?
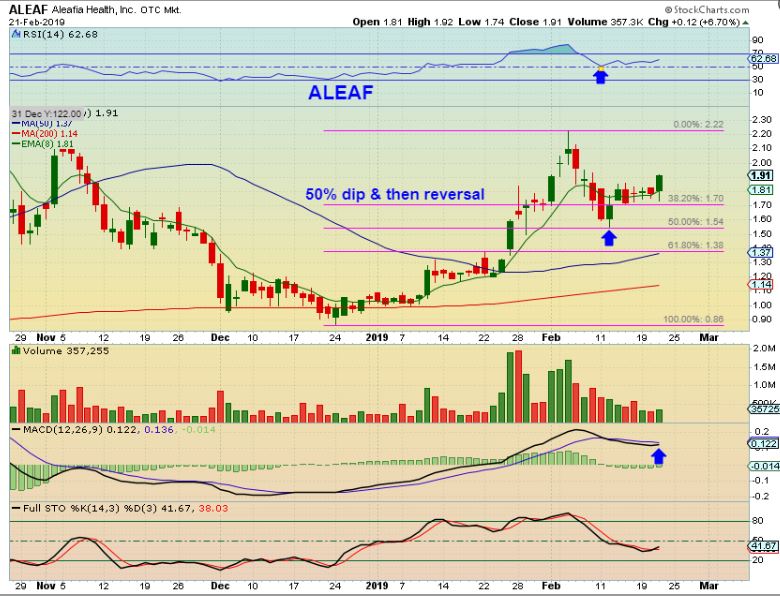
ALEAF #5 – It was actually a perfect tag of the 50% fib line . Suddenly ALEAF shot up and closed up almost 7%. This looks like it may be ready to continue higher
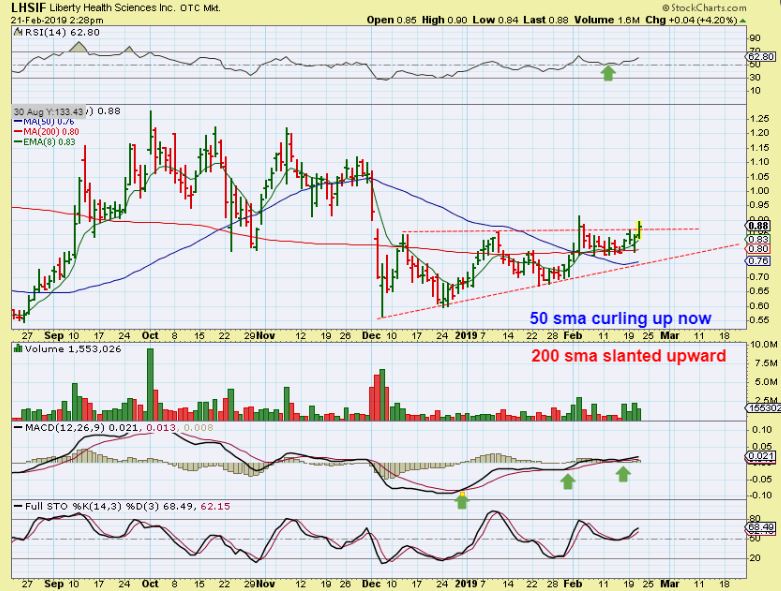
LHSIF – LHSIF is acting ( very slowly) correctly too, so I own this and added to the current position. Price is riding the 200sma, and the 50sma has curled up, my stop will be there.