Wednesday – Juggling Time And Ideas
If you were in front of a screen during trading hours yesterday, you may have also noticed a multitude of trade ideas in various sectors popping up all over the place. It was a lot like juggling for the active trader, and a couple of questions received in emails reflected the fear of missing out on some really good moves in the blockchain trade ideas that I mentioned on Feb 8th, saying,
“ XXXX was up 20% and YYYY was up 50%, my stocks were only up 5%- 7%, am I in the wrong stocks?”. Those blockchain stocks are very hard to just buy & hold and as mentioned, they are NOT for everyone, so I would not chase those. I’ll discuss them more at the end of the report. Let’s take a look at things and answer a few questions…
.
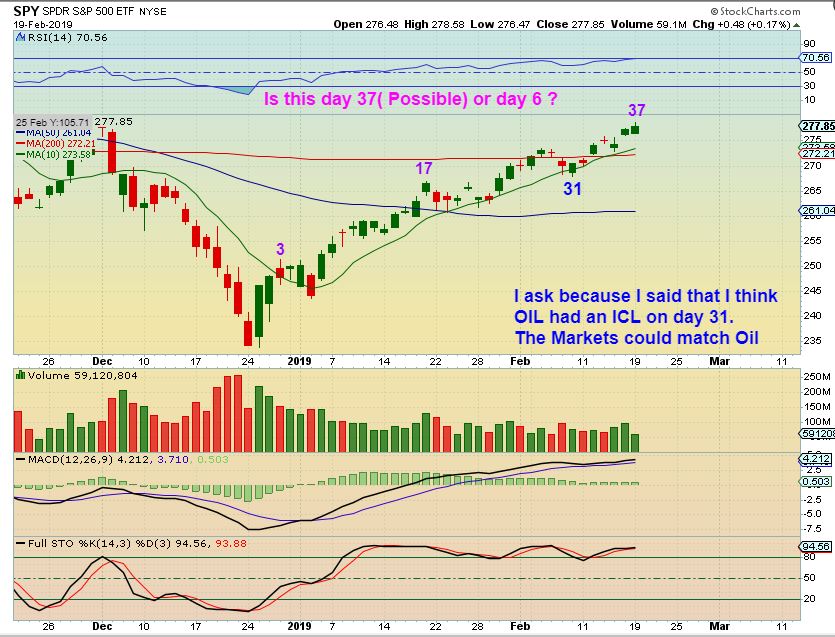
I am going to start by mentioning that though this would look like day 37 in the General Markets, and it may very well be day 37, I have to wonder “COULD this be a day 31 dcl, and the General Markets be on day 6?” It is ‘possible’, and I say this because it would match OILs timing. It will probably take a little more time to know for sure, since there are differences, so lets discuss this a bit further. OIL & THE GENERAL MARKETS.
.
SPX – The General Markets marched bullishly higher out of the ICL as expected. I then expected a possible ‘false break out’ above the 200sma followed by a dip to a dcl. I was saying that we could tag the 50sma, that would be normal. Here we see a very shallow dip, but was that it? MAYBE. Let’s now look at Oil.
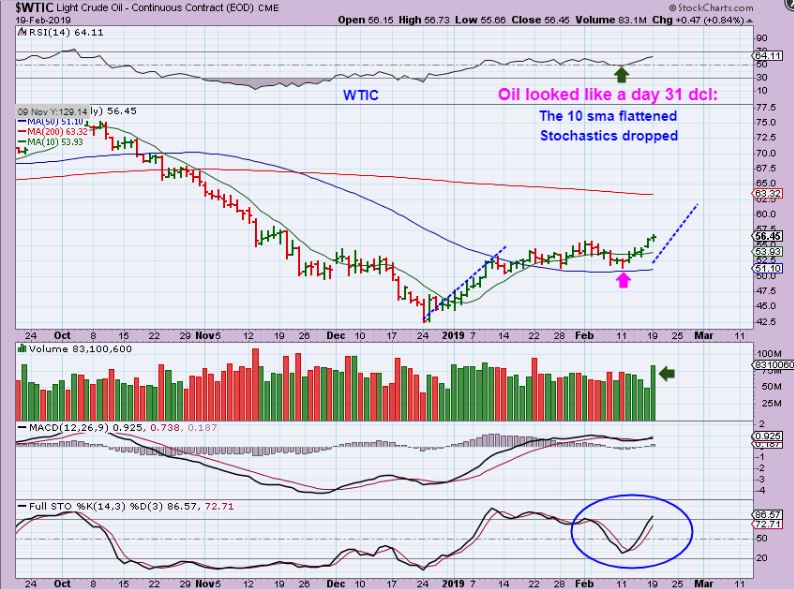
WTIC – I called this a possible DCL on day 31 because the dip tagged the 50sma and flattened out the 10sma. Notice that it also made the stochastics drop near 20 again. That did NOT happen with SPX. So Oil looks like more of a dip than SPX, and the SPX stayed over bought. Since this could be a dcl for Oil however, it is possible that the SPX put in a very shallow dcl. We’ll look for clues along the way, but…
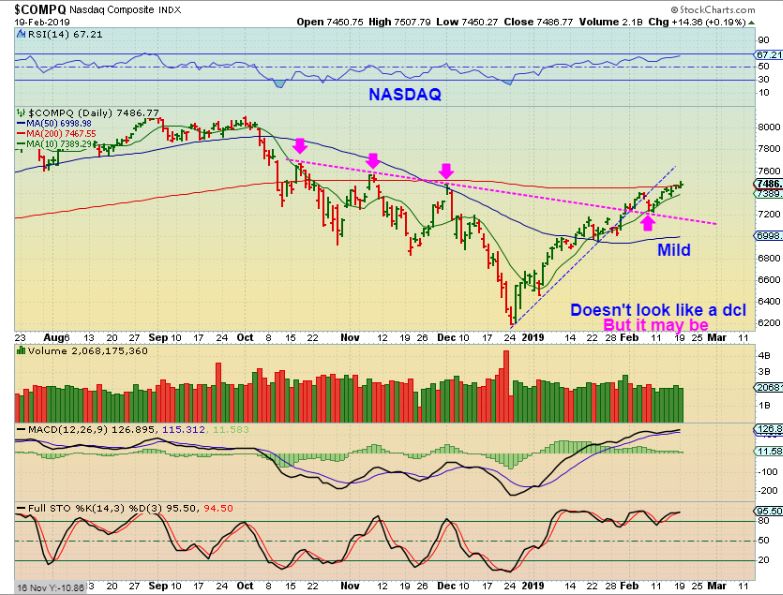
That said… I do not ‘feel’ that the dip in the General Markets looked like a dcl as much as Oil did. So far that pull back is shallow. Since a drop to the SPX 50sma was more what I was looking for, I would just continue to trade it for now understanding that it may get choppy if a dcl is close by. Trading stocks like AMD, SQ, MU,CY, TSEM, etc. with a stop has been working out. I would say as long as the SPX / QQQ , etc stay above the 200sma, it is fine.
.
WTIC – So, I called this a possible DCL on day 31 and said that even if it was really just a 1/2 cycle low, “Either is buy-able”. So far it continues higher.
OIL & ENERGY Stocks do remain in bullish set ups. XLE & OIH was green, OIH was slightly red, but the ‘set up’ is still fine. Some felt that because they didn’t race higher today, something is ‘wrong’. I was asked, “Should I jump in Blockchain and dunp all my energy stocks?” I do not see anything wrong with the Energy Stocks right now. They are still above the 50sma , so they remain bullish that way.
.
CRK – Last week CRK was just crawling around the 50sma, but it also remained bullish. Tuesday at 11 a.m. I posted that it started to move higher ( up 15 cents or 2.37%).
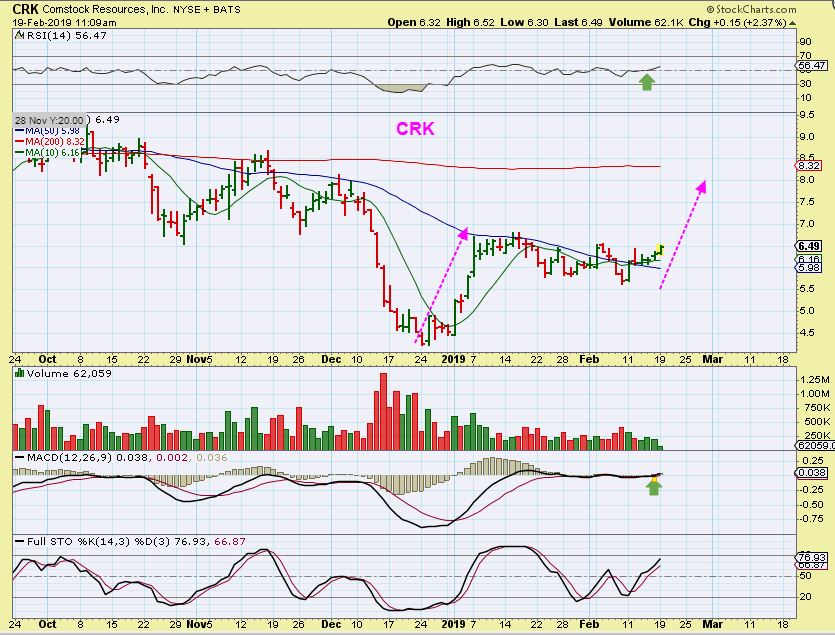
CRK – As the day moved on, it was up 37 cents or 5.9% , so I posted the progress. You can see the risk reward, so this would still be a buy as it leaves the 50sma. It has a target near the 200sma above $8.30. That is 35% from the 50sma.
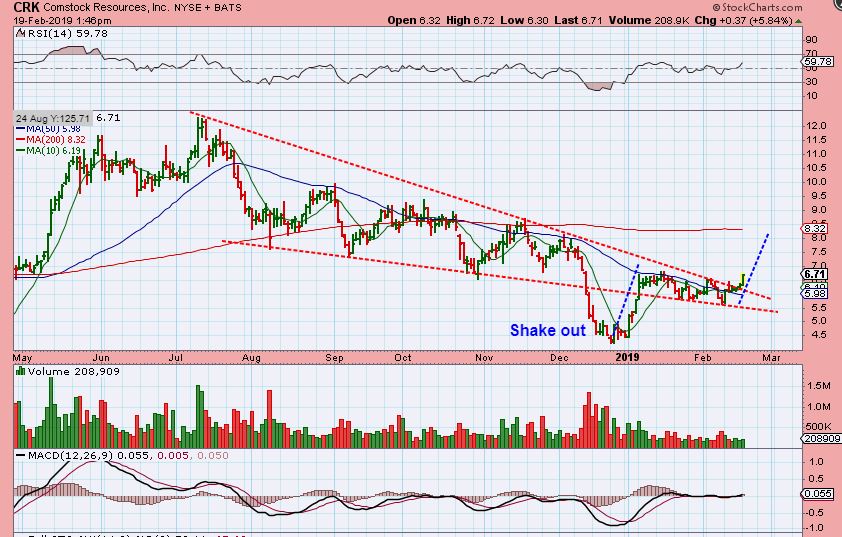
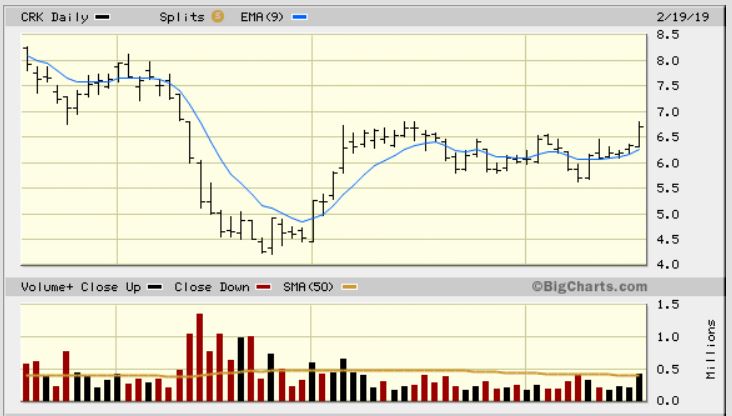
CRK – I like this chart, it closed at $6.71. I still view it as a buy, HOWEVER, Earnings are due out Thursday morning. The problem would be a gap down, but I may take my chances and hold it through earnings. If you bought this with me, you must make that decision for yourself, I do not know how earnings will go here.
OAS – Other OIL / ENERGY Stocks stalled, so some felt that they were in the wrong stocks. This is still a bullish set up after breaking above the 50sma, they just don’t always run the same.
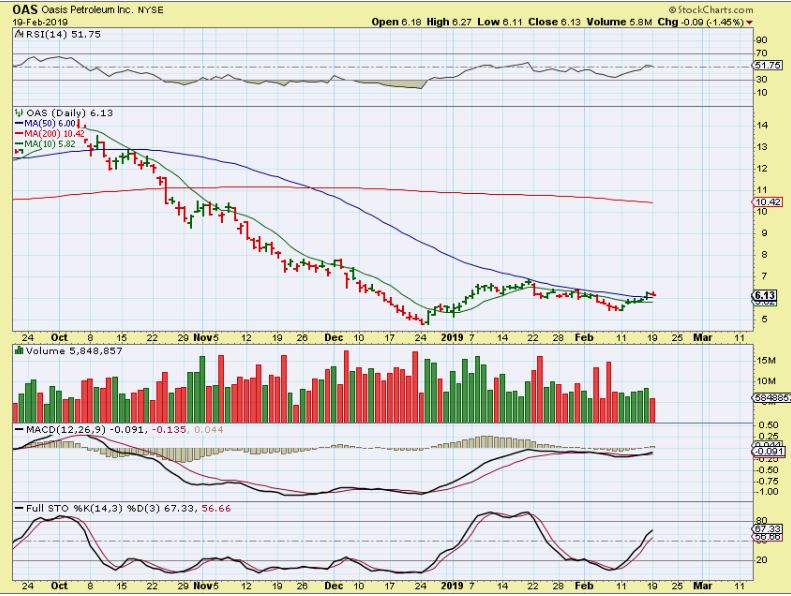
So the OIL / ENERGY sector remains unchanged at this point.
.
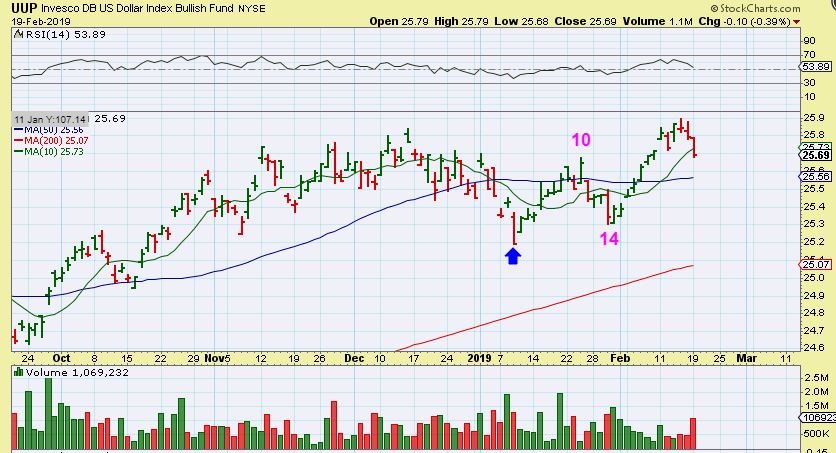
UUP – The USD dropped and the UUP shows that volume increased. Gold also Popped…
.
Please review my thoughts on the Precious metals sector in the weekend report, I had many charts and thoughts to share there. FOMC MINUTES ARE RELEASED TODAY: Anything Can Happen,but Gold reacted bullishly after the FOMC Meeting.
.
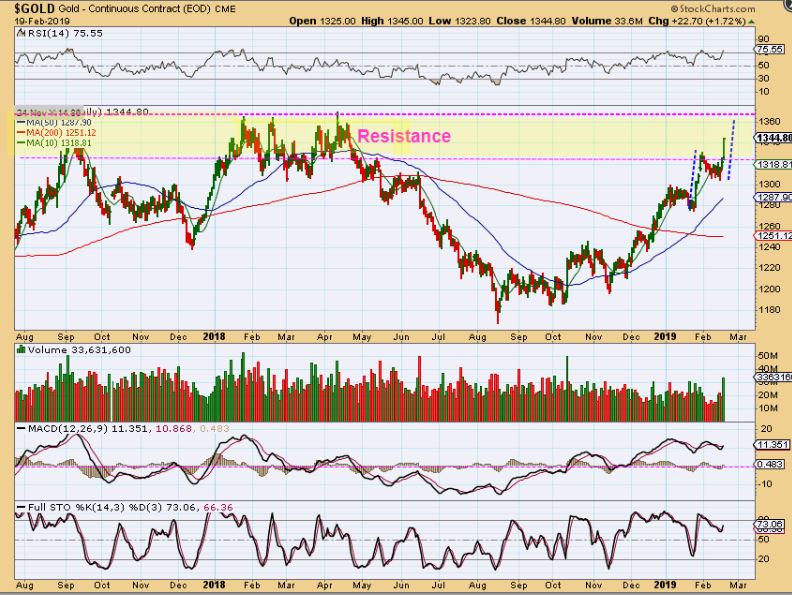
This was GOLD from the weekend report:
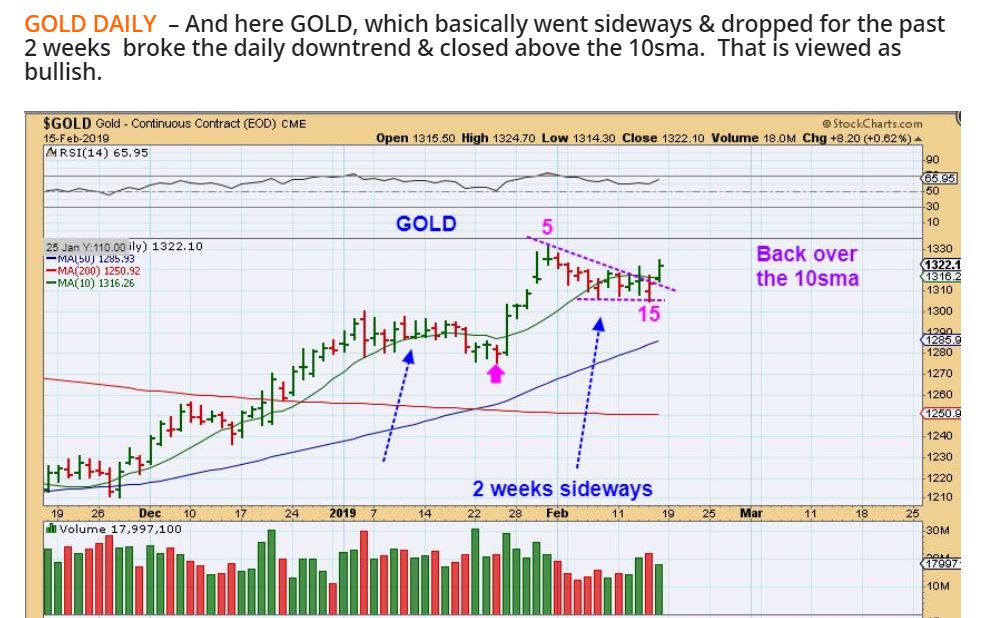
GOLD #1 – Gold Popped Tuesday and broke to new highs
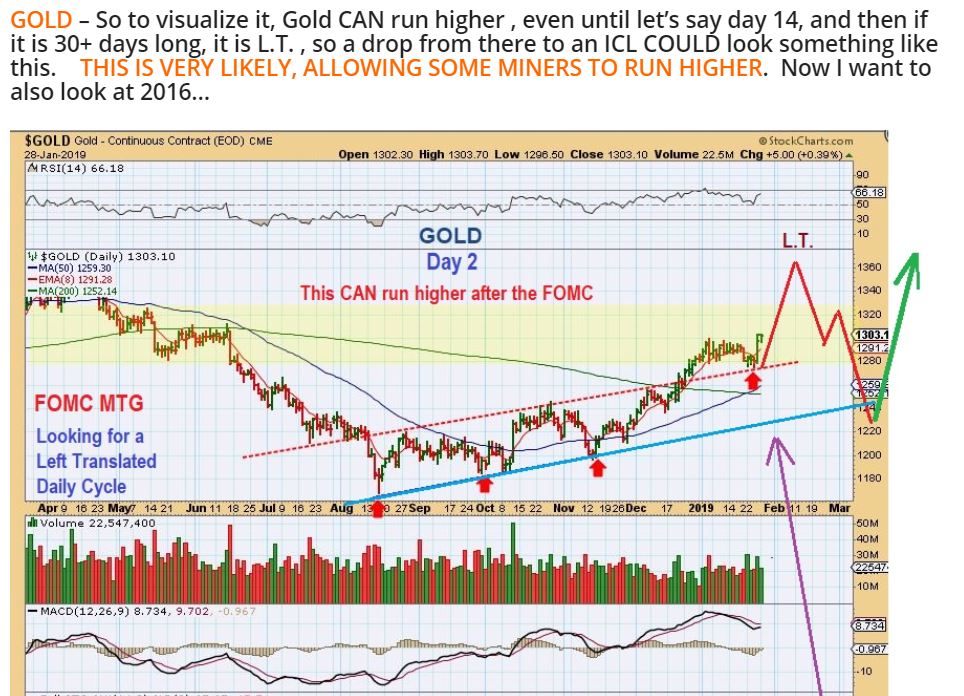
3 weeks ago I drew this in my report: Notice the yellow resistance area. I saw many bullish set ups in Miners, so I was showing that GOLD could run to $1360 and allow many of the Miners that were bullishly set up to run higher too. I was expecting it to become L.T., but that part may not happen now…
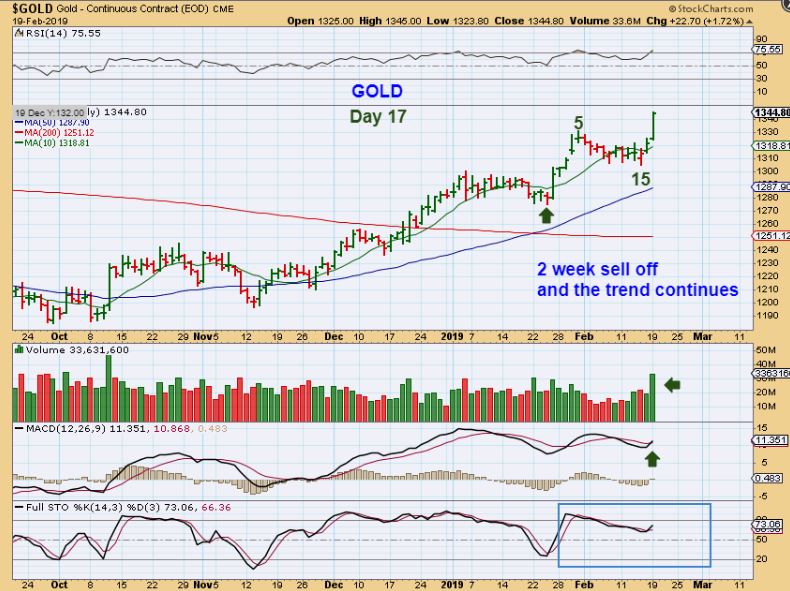
GOLD #2 – The resistance caused that 2 week dip, and now it is powering higher. This has allowed the individual Miners to make further gains.
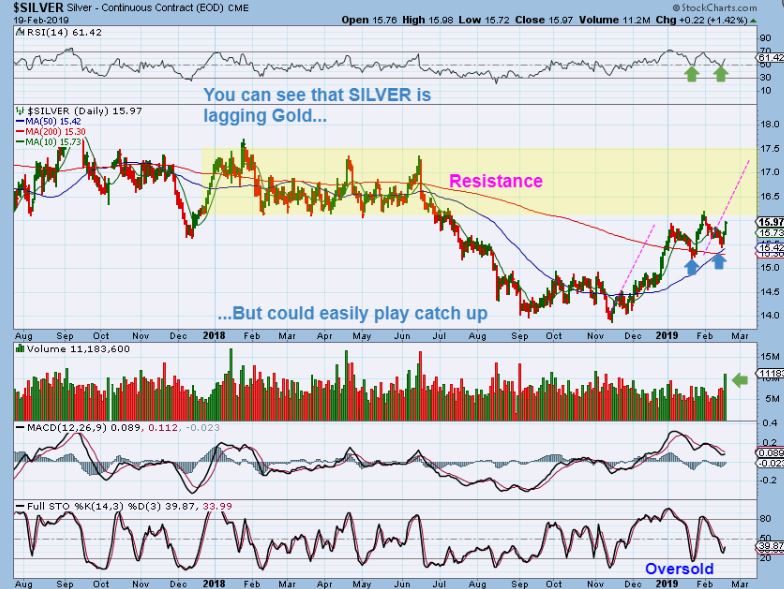
SILVER – Silver has not entered the resistance area yet. If it plays catch up to Gold, Many of these bullishly set up silver stocks will continue higher. Look at the volume, Silver looks bullish, and many silver stocks do to. I had CDE & AG Big Pictures in recent reports.
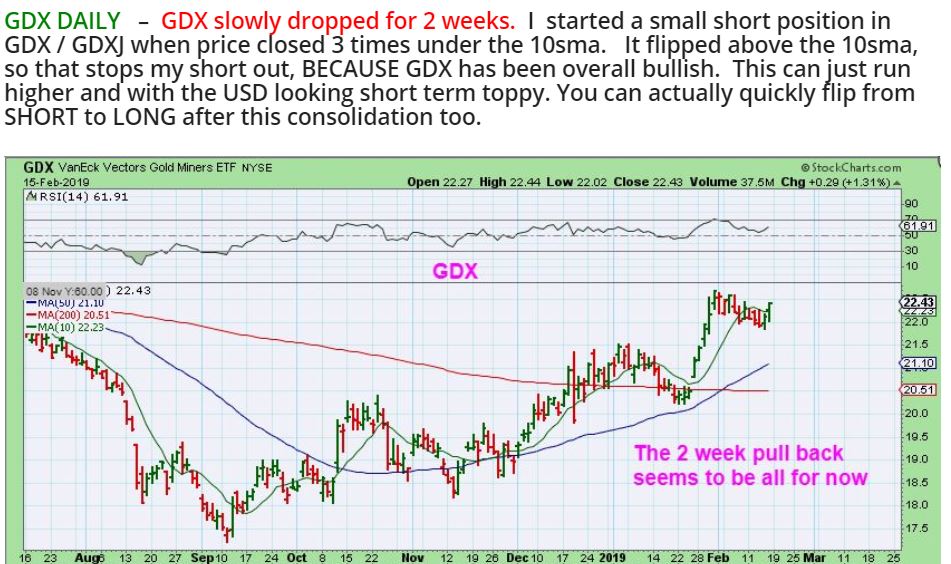
This was GDX FROM THE WEEKEND REPORT : After a 2 week sell down, it flipped to long.
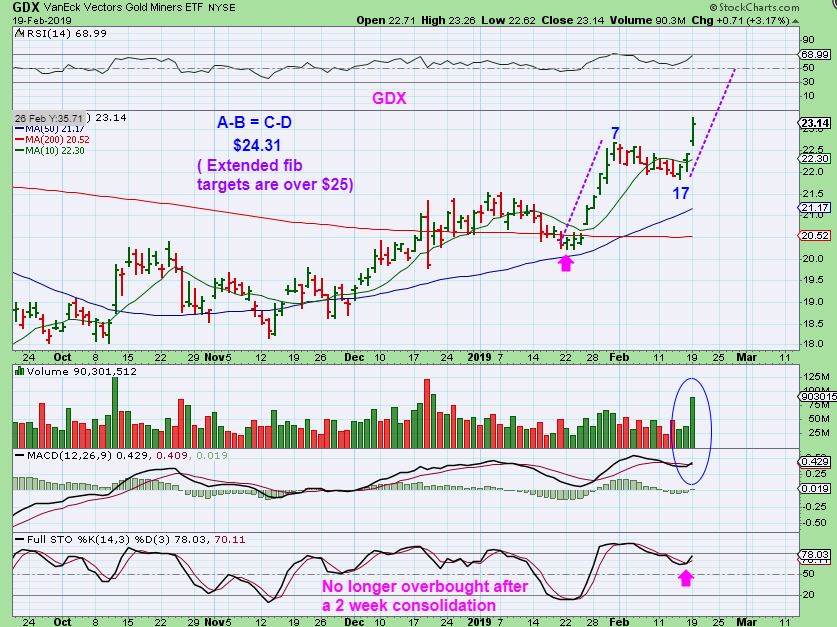
GDX #1 – I get an A-B = C-D target of slightly over $24.31 ( but they can extend using Fib Extensions).
ALSO FROM This Weekends Report:
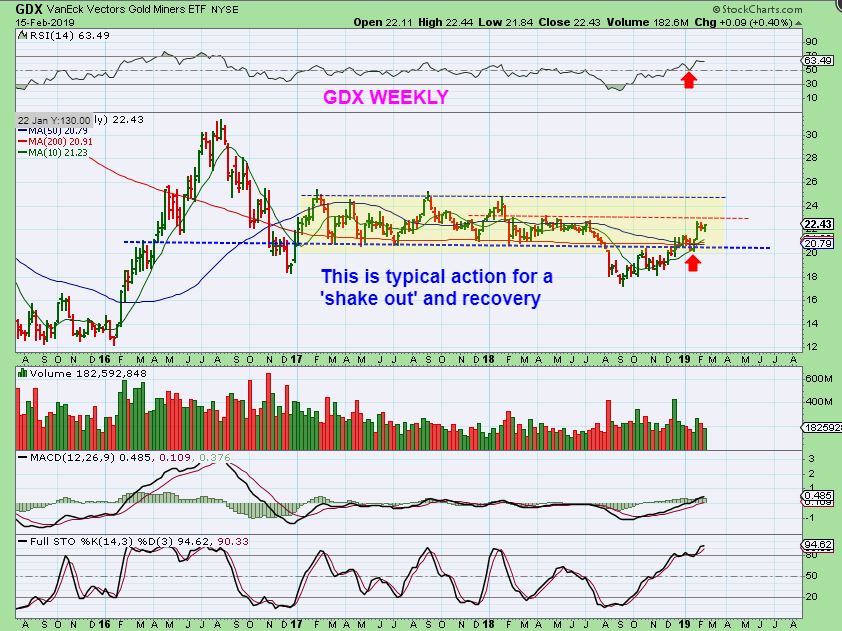
GDX WEEKLY BIG PICTURE – I have mentioned that this is a very bullish chart. We COULD run to the upper yellow area now, and then drop down from there. As I have said in each weekend big picture report, overall this looks very bullish for MINERS in 2019. This was a ‘shake out’ & recovery. Technical traders see that and buy the dips. This current 2 week drop was just a bull flag as seen here. If you ‘buy the dip’, that 2 week mini drop appears to be it for now.
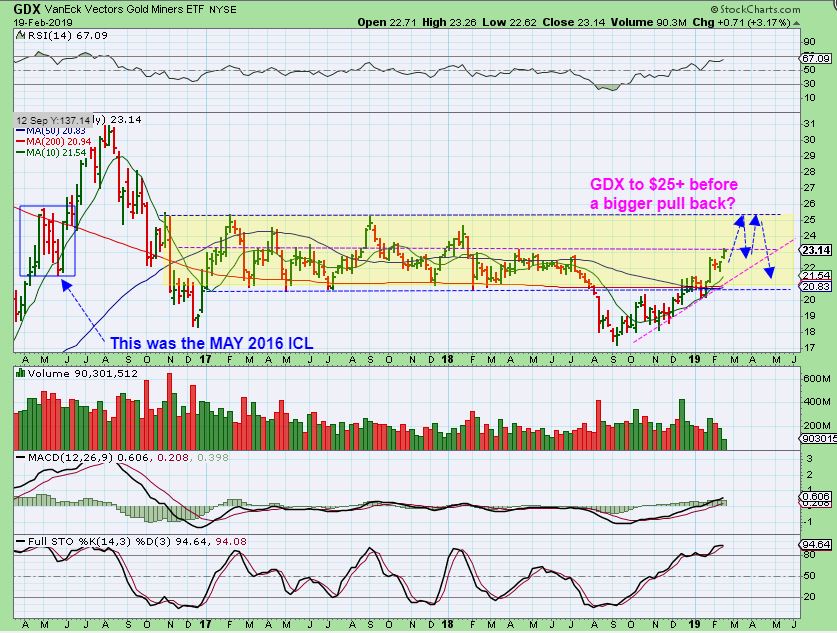
GDX #2 – So we Popped Tuesday and it is possible that this could run to the top of the yellow area, before a more meaningful dip.
I am going to just discuss some Miners and a few other things below. Enjoy your Wednesday trading.
.
~ALEX
.
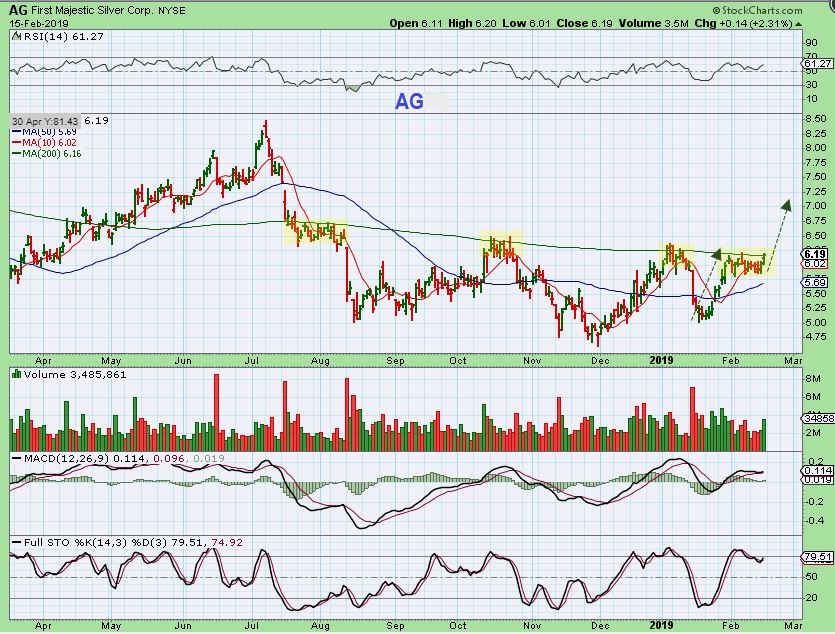
AG -I have been posting these charts for a while now. AG & CDE were mentioned in Late January and early February. This chart was in the weekend report as a BUY if it breaks.
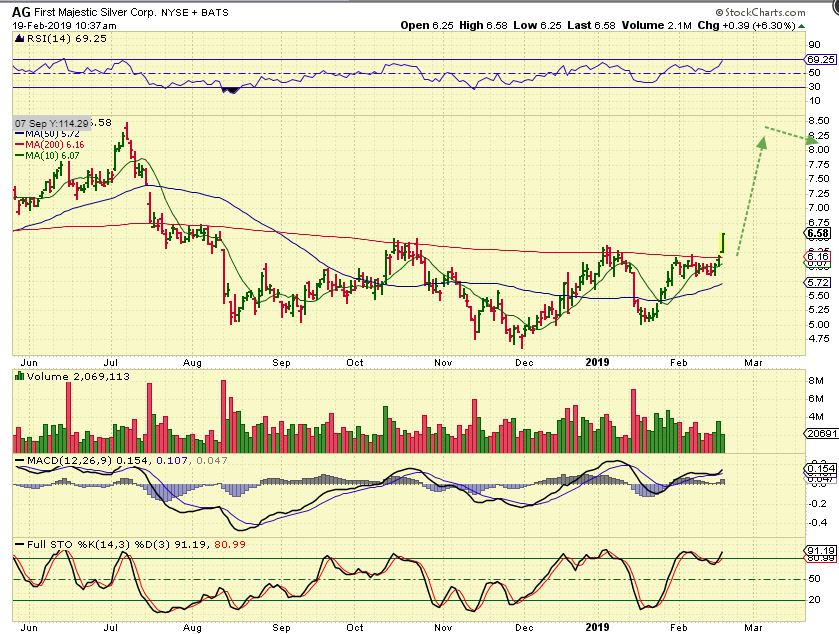
AG – I added to my current position.
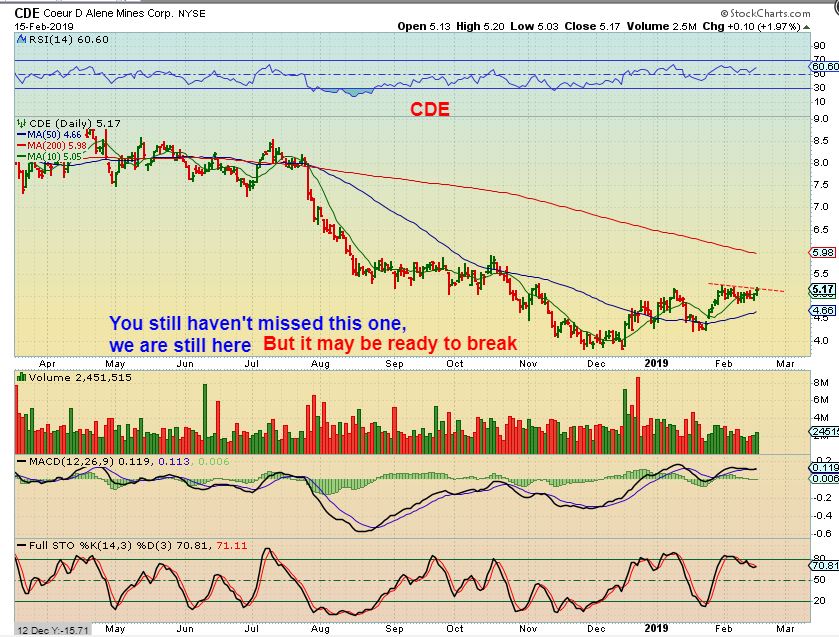
CDE FROM THE WEEKEND REPORT – This is CDE and it looks ready to break out. MAG & AXU broke out, so if this breaks out here next week, I would view it as a buy. It could run to the 200 sma.
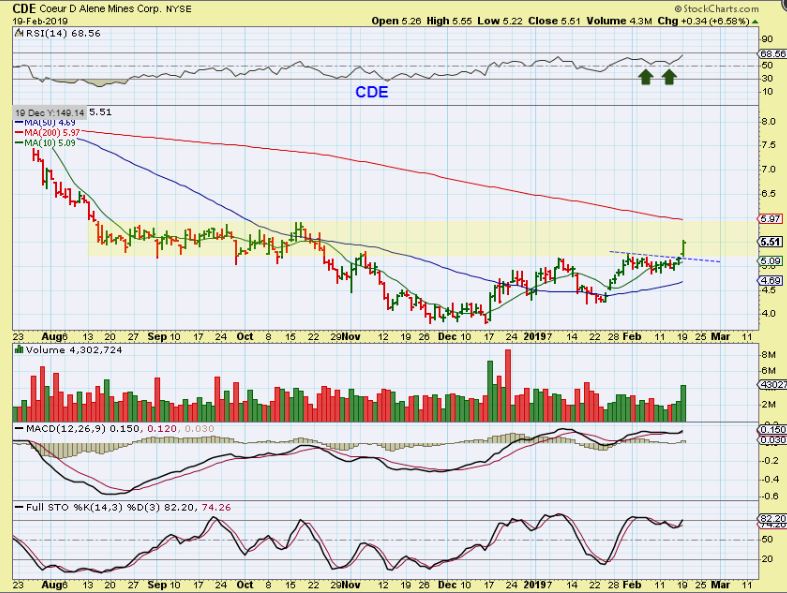
CDE – CDE also broke out. These Silver stocks could really run as they break from these bases. You also saw the SILVER CHART above and how it could play catch up. I also posted HL this weekend and it broke out.
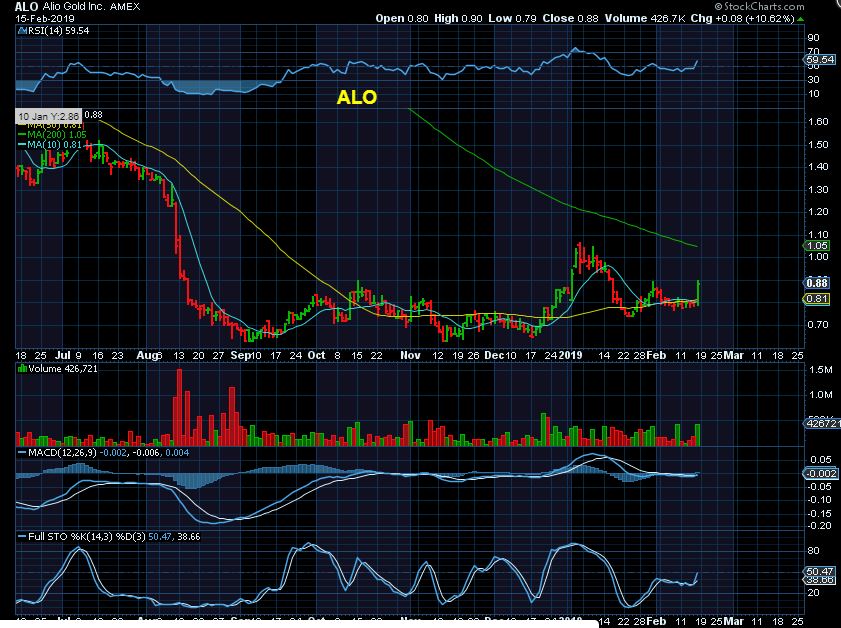
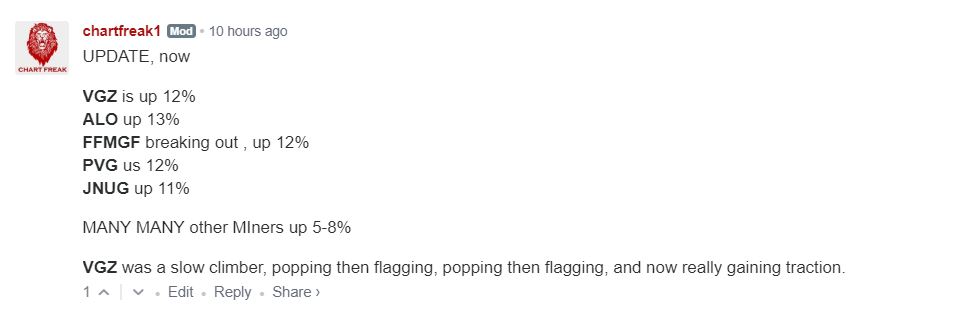
ALO – ALO popped over 10% Friday from a base-like bottom.
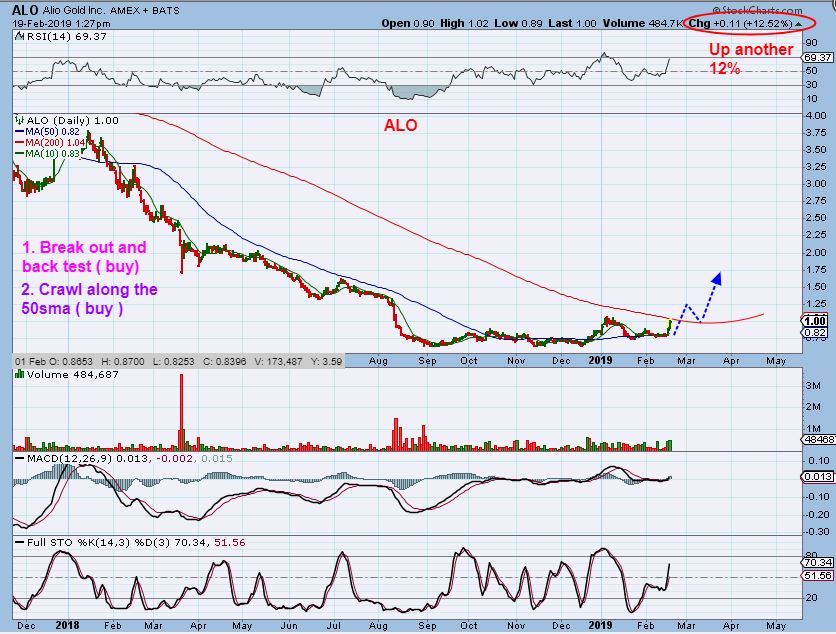
ALO – It was up another 12% Tuesday. These bases are finishing up and the upside can be rewarding over time.
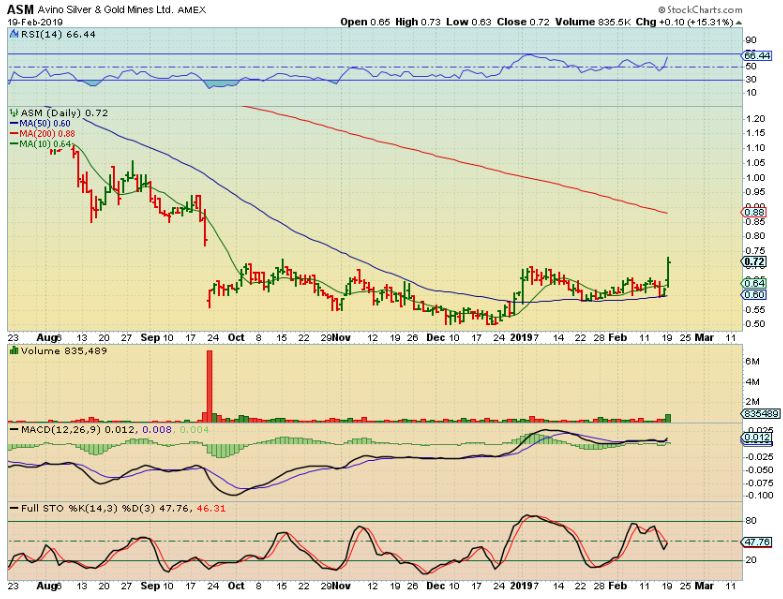
ASM – This base was in the weekend report as it reversed on the 50sma and…
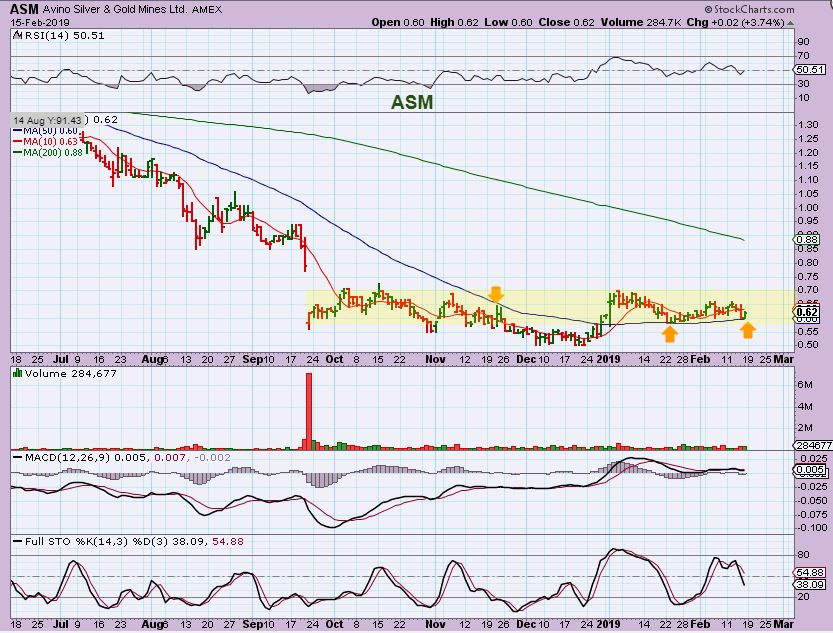
ASM – It actually jumped up 15.3%. So we are seeing the bullish set ups continue to play out.
I made this comment in the live discussion area in the morning, so you can look these up if you have time and see how they finished out the day …
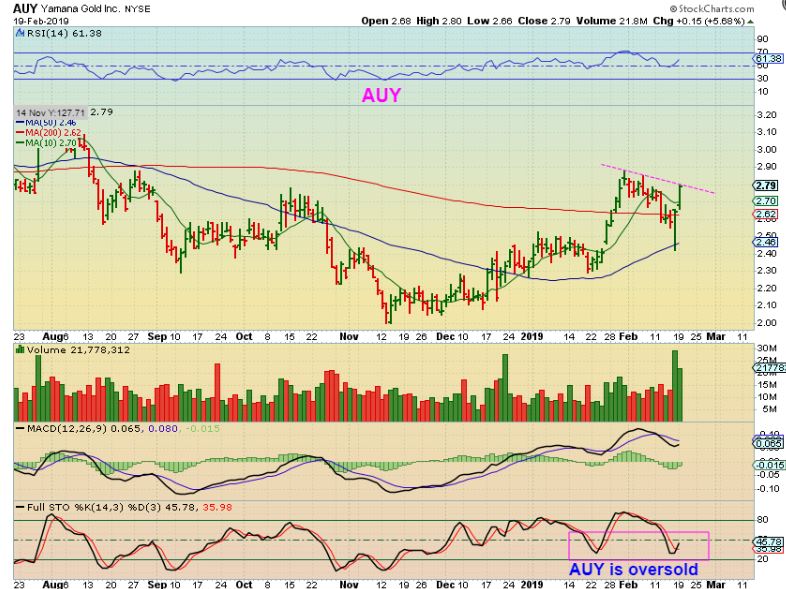
AUY – AUY had that crash down during earnings and the reversal off of the 50 sma. It also regained the 200sma & closed up another 5% Tuesday. It now looks ready to break out here, which is also a buy. It may form this giant cup at prior 2018 highs.
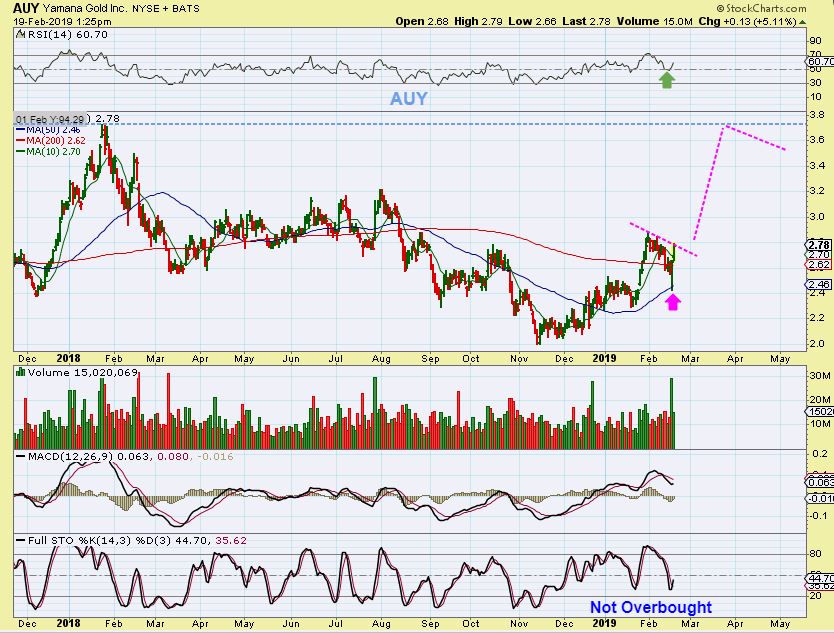
AUY – I apparently grabbed 2 charts of AUY, so I’ll just post this one as a bit more of a close up.
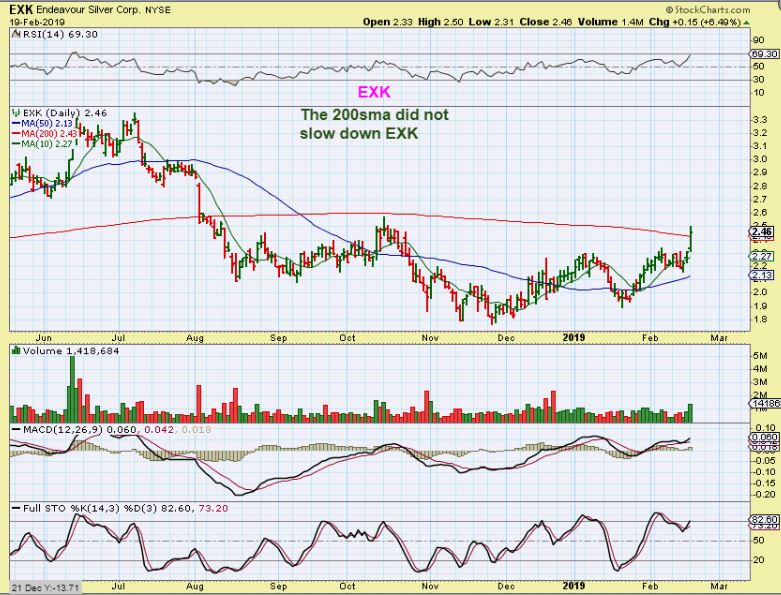
EXK -We are seeing some of these break the 200sma on the first try, so it may just run to former highs, especially if SILVER plays catch up to Gold. ALSO, if EXK broke the 200sma …
There is a possibility that CDE will not stop at the 200 sma too. That is a Big Base, and CDE could easily run to $8 from here. Those are Great Gains.
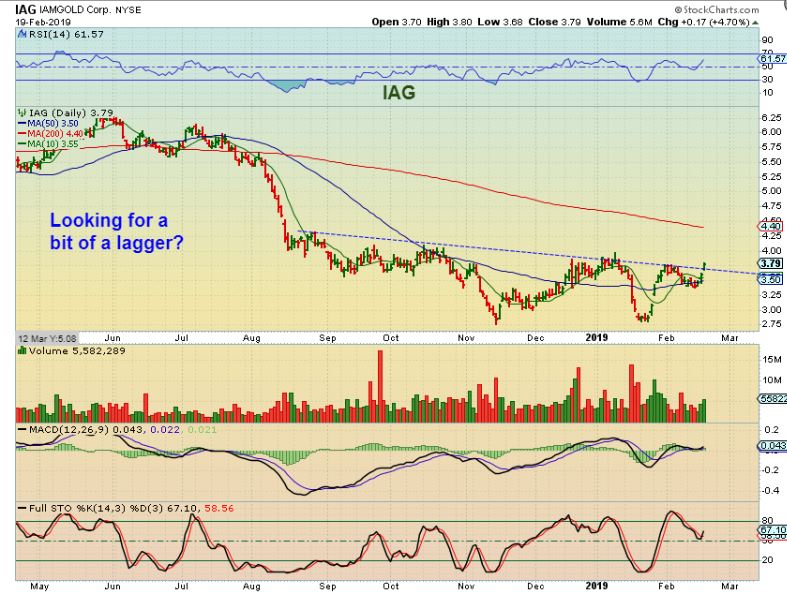
IAG – Did you need a lagger, one that is JUST NOW Breaking out? IAG might break through the 200sma like EXK and runs to prior highs at $6 over time. That is almost 100%. This is a big base, and even if price just crawled at the 200 sma it should eventually keep going.
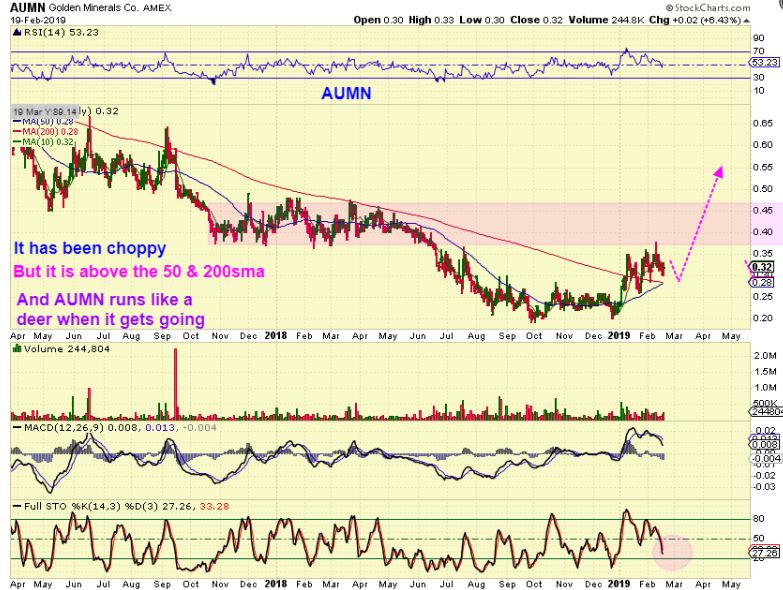
VGZ – I just wanted to show VGZ. It has been choppy, not straight up, and maybe hard to buy & hold, but suddenly it clears resistance and Pops 20% yesterday? I didn’t see any news on VGZ.
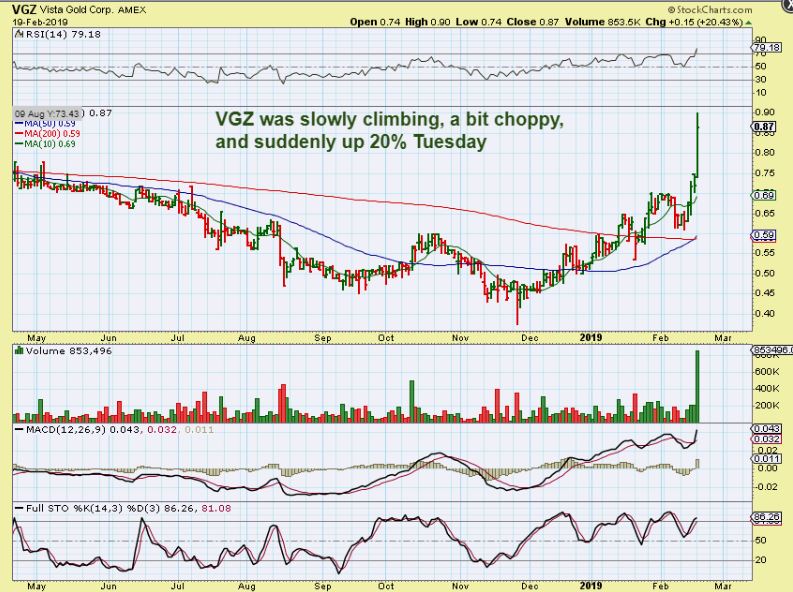
Smaller Miners like AUMN, TRX, THM, VGZ all have good potential in the long run. This action is hard to buy & hold, but when the next run comes for AUMN, it can be explosive. A back test of the 200sma is a Gift entry.
.
FINALLY BITCOIN / BLOCKCHAIN
.
This is where some felt that they were in the wrong stocks and wanted to chase some of this action, but chasing these can be harmful, I’ll point that out soon.
.
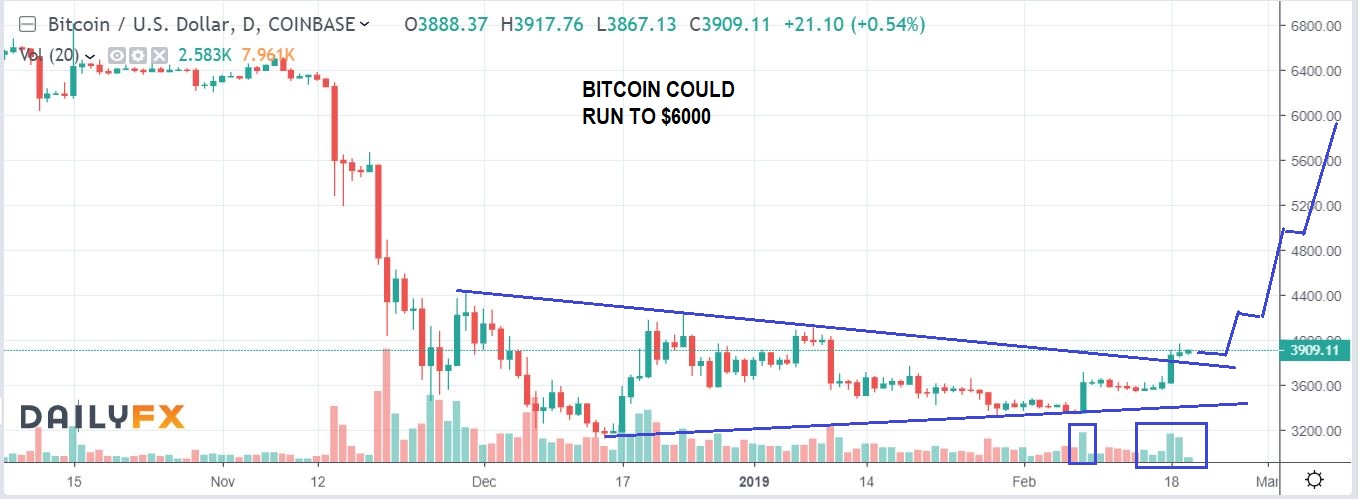
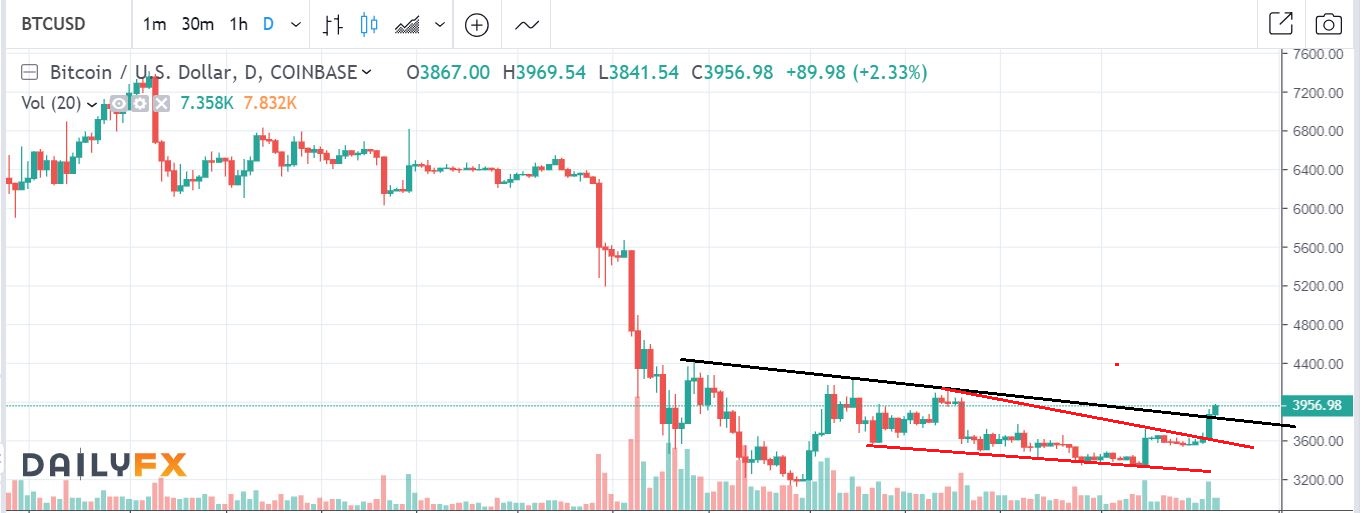
-About a week ago I pointed out on this chart that BITCOIN was starting to look ready to break out. It was flagging. I mentioned many blockchain stocks that get rather explosive when Bitcoin runs. I mentioned stocks like RIOT, NETE, HVBTF, MGTI, GBTC, MARA, GROW, BTCS, BTSC, and there are many more.
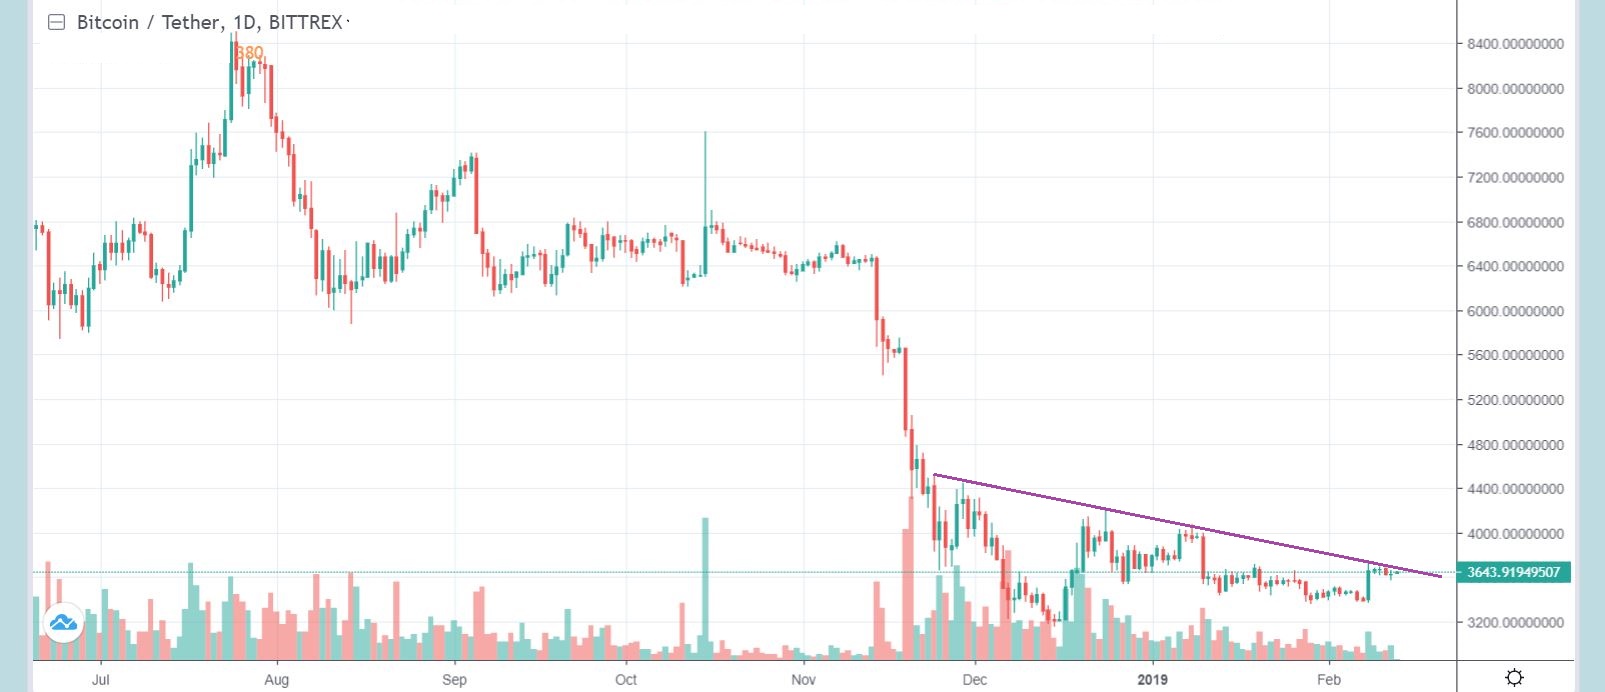
BITCOIN started to move higher and on just this tiny move by Bitcoin, many of these blockchain stocks were up 20% – 150%
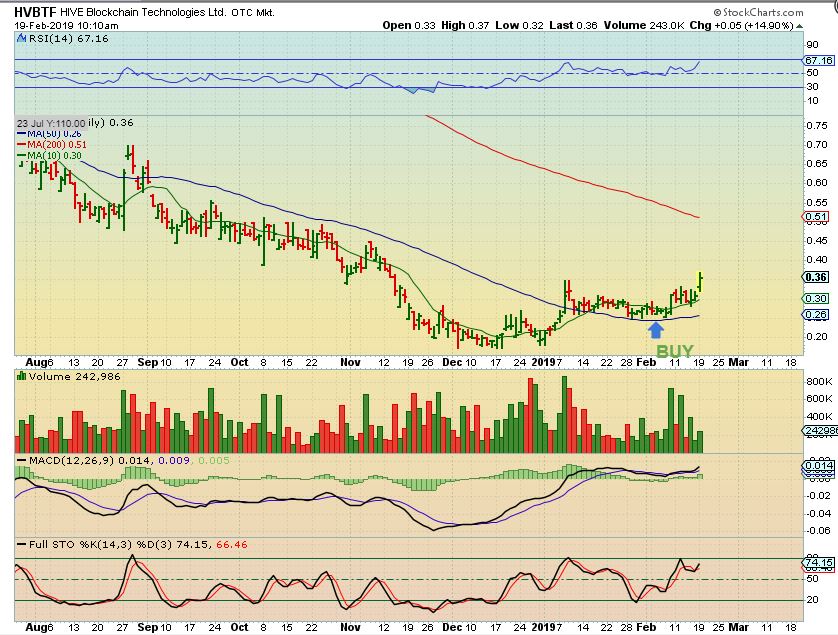
HVBTF – I actually posted this company a couple of times because it continued to act correctly at the 50sma, so that would make a good place to stop out.
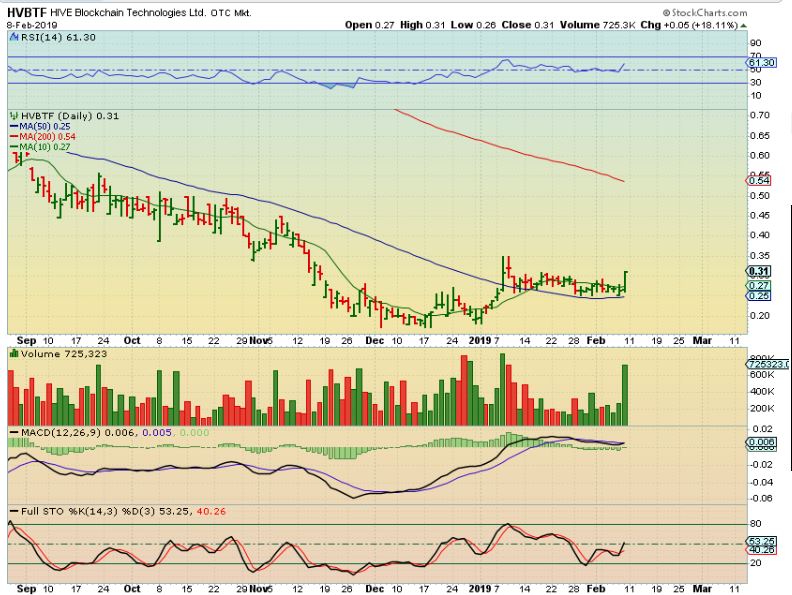
HVBTF – It started to break out too, and was up over 20% at one point. I think that it could easily make a run to the 200sma, since it is acting like normal set up. You can see that it was best to buy at support though, chasing these can be tricky if it drops back to the 50sma.
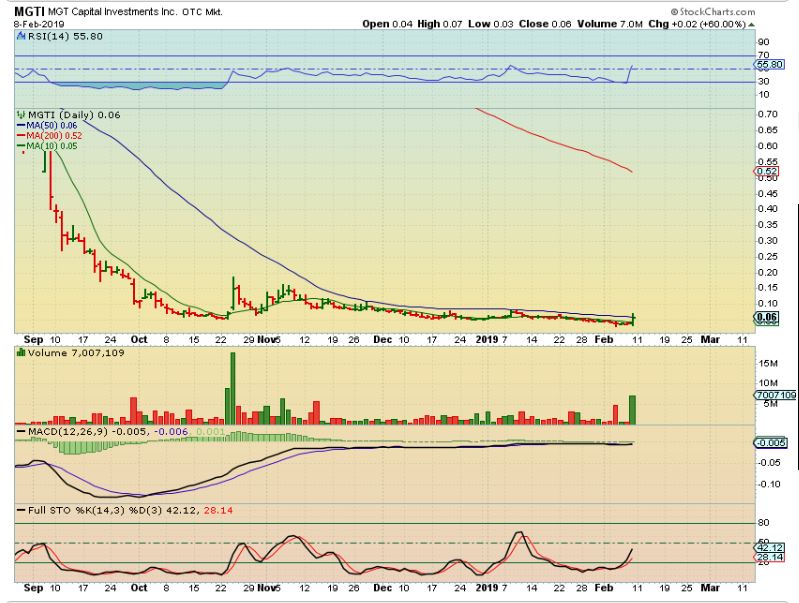
MGTI – Feb 8th I posted this nice long base with a price Pop at 6 cents, just at the 50sma.
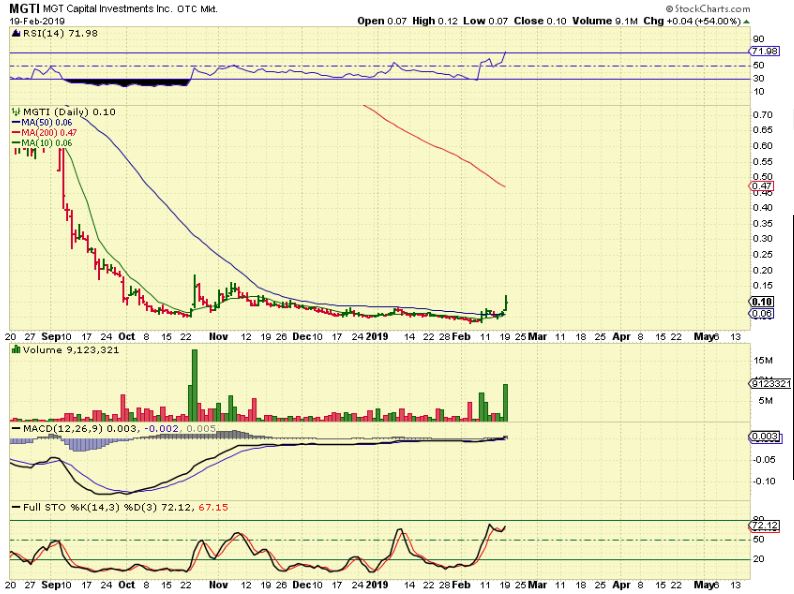
MGTI – It flagged sideways since then and Tuesday it hit 12 cents , so that is a 100% move, but it closed at 10 cents, only up 54%. (Only?). This still looks bullish, but it can be dangerous to chance these, since dropping back to 6 cents would hurt. Again, it is best to buy at support when Bitcoin sets up properly, and let them POP while you are in it.
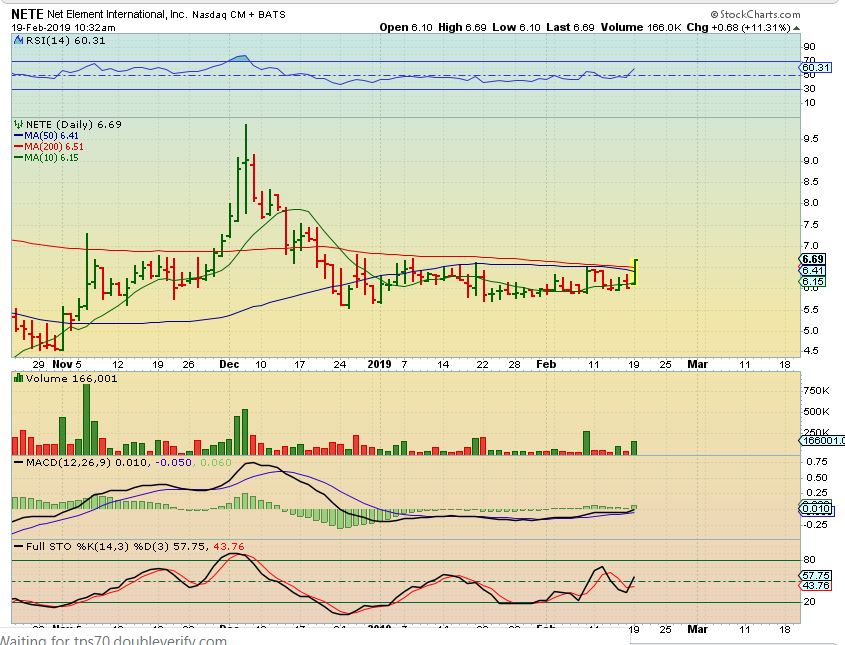
NETE – I posted NETE under the 50sma, it broke out, yet closed back under the 50sma. This may still break out & run if Bitcoin stays healthy, so this one may not be too late to buy ( I added).
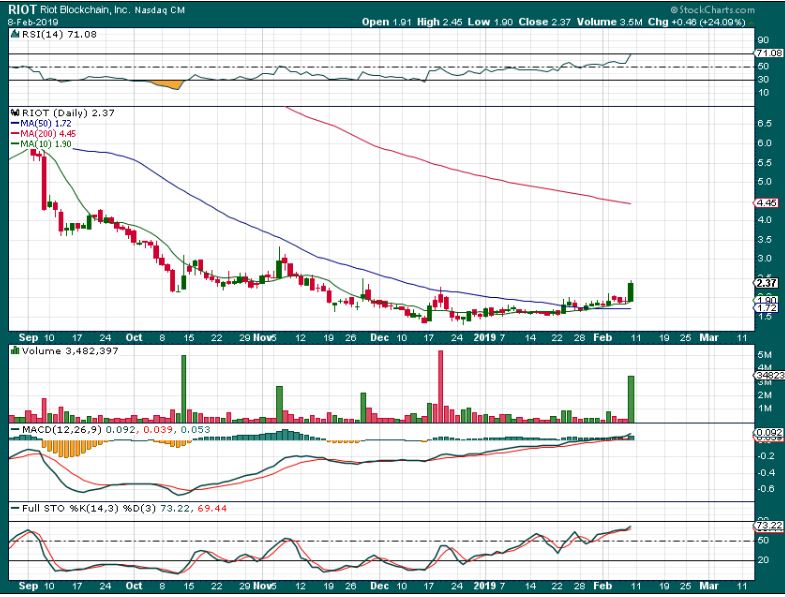
RIOT – On Feb 8 Riot was posted up 24% at $2.37
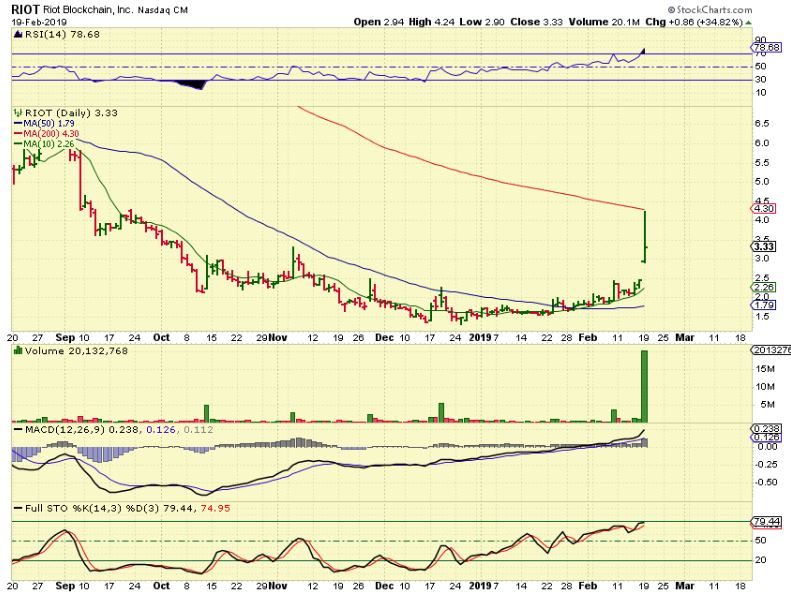
RIOT – $2.34 to $4.50. Riot ran up over 80% right to the 200 sma and then fell back, but it still closed up 35%. It may drift down and do a gap fill.
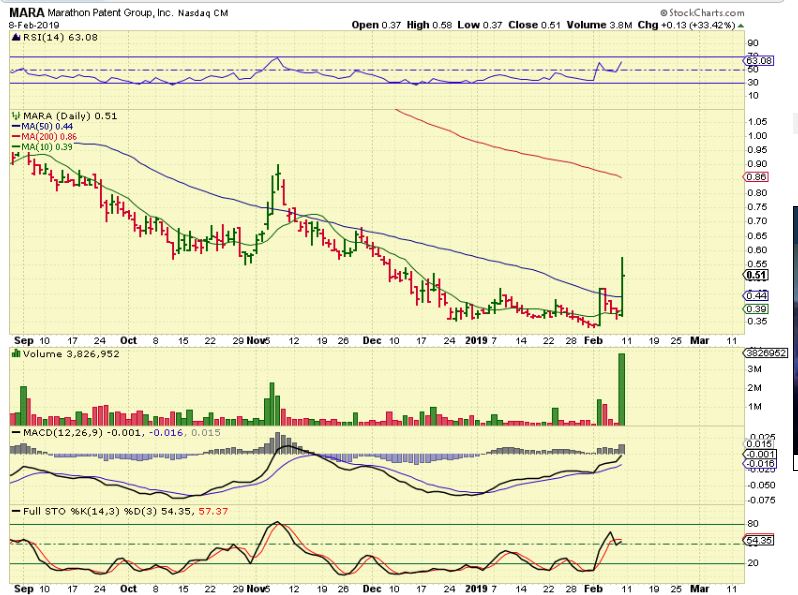
MARA – On February 8 I posted the 33% POP in Mara, but it would be best to wait for a pull back or see if it Bull Flagged again, like that first Pop.
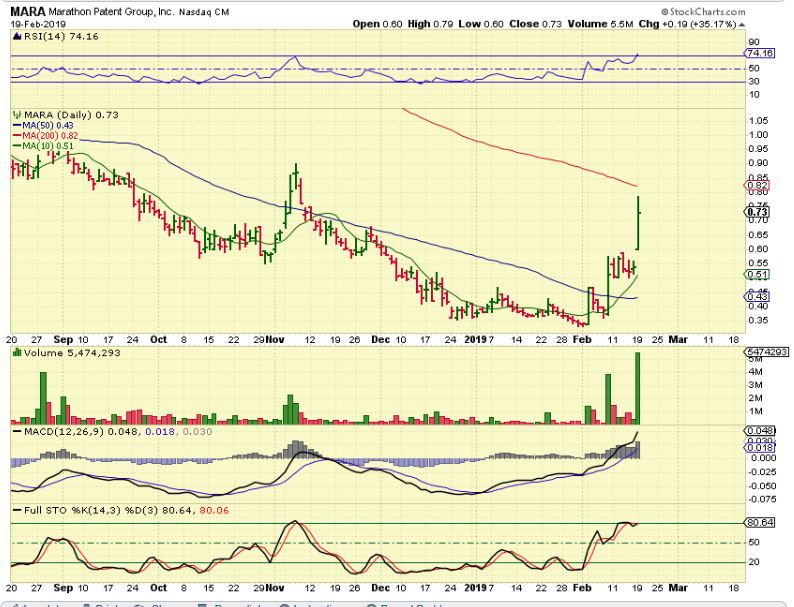
MARA – It did flag and Popped another 35%+. Now it may be best to see if it flags again, maybe by crawling along under the 200sma.
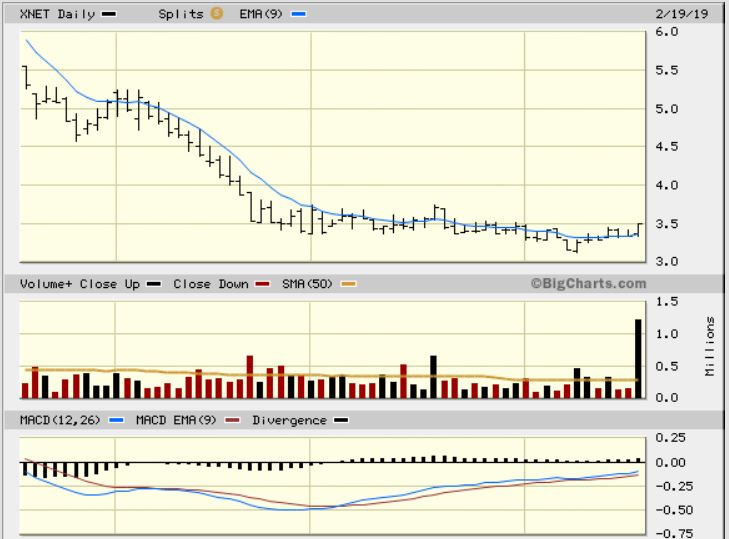
I was watching XNET to see if it would run, and mid-morning it took off, so I captured this intraday chart as it ran to $3.80
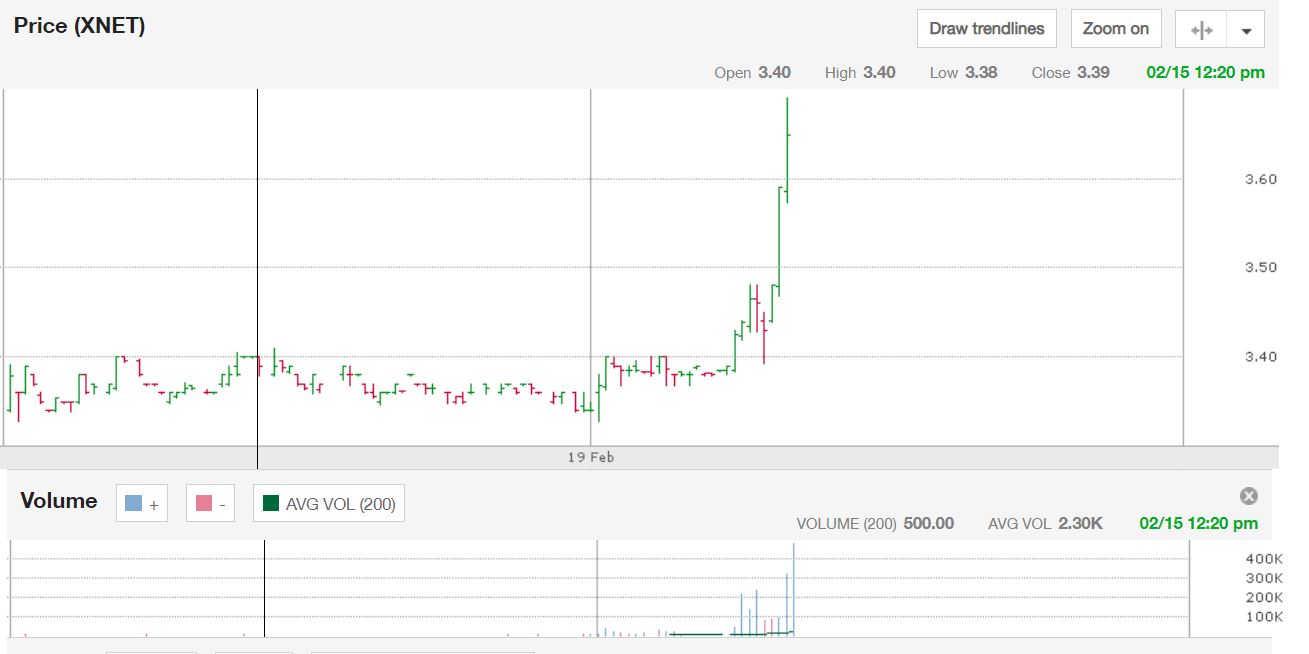
XNET- This was it moments before it broke out at $3.49
So at this point, I guess that some of these could run further ( Like NETE, HVBTF, DPW, and others that are not overly extended from a one day 50% pop). Others may exhaust after that 1 day Pop and bull flag or consolidate gains, it may depend on Bitcoin itself. So far, Bitcoin still looks like the Bullish Base that I pointed out on Feb 8th. You can see that if you were in these stocks, buying when they were near support of flagging, it was a big gain for you. THESE ARE HARD TO HOLD THOUGH. If you weren’t in them, you missed the initial POP and other than for Day Traders, it may be best not to chase them now in case they pull back. There will be more set ups to come if Bitcoin runs higher. At least you get a glimpse of how these can move ( and warning: They move just as quickly on the downside at times too though). If they Bull flag or churn sideways, we will find other set ups to place a small trade in. That chart of MARA that was posted above is a good example of how they may Bull Flag after the first Pop.