Thursday February 7th – A Mixture
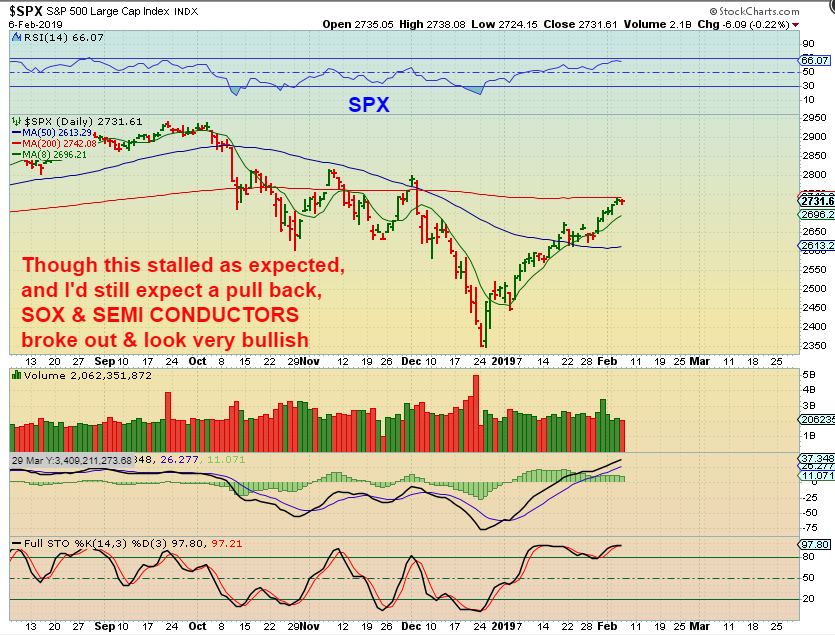
SPX – I advised tightening stops, maybe below the 10sma , because I was expecting a possible rejecting at the 200 sma, So far we only have a pause. I did mention that price can POP over the 200sma first, as seen in October, November, and December, and then roll over. Let me show you why that might still happen.
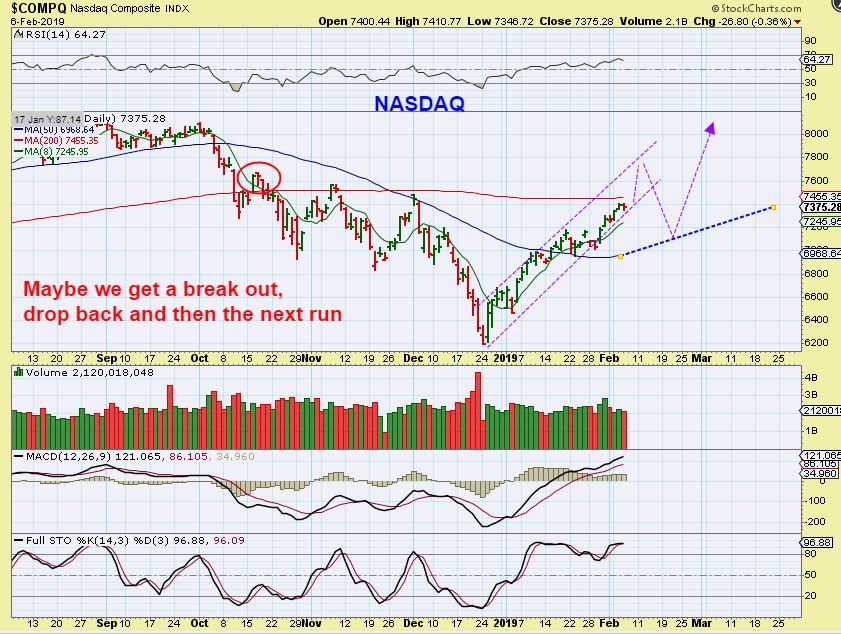
NASDAQ – If the markets don’t start dropping right away, it looks like it may play out like this , and the reason is the SOX.
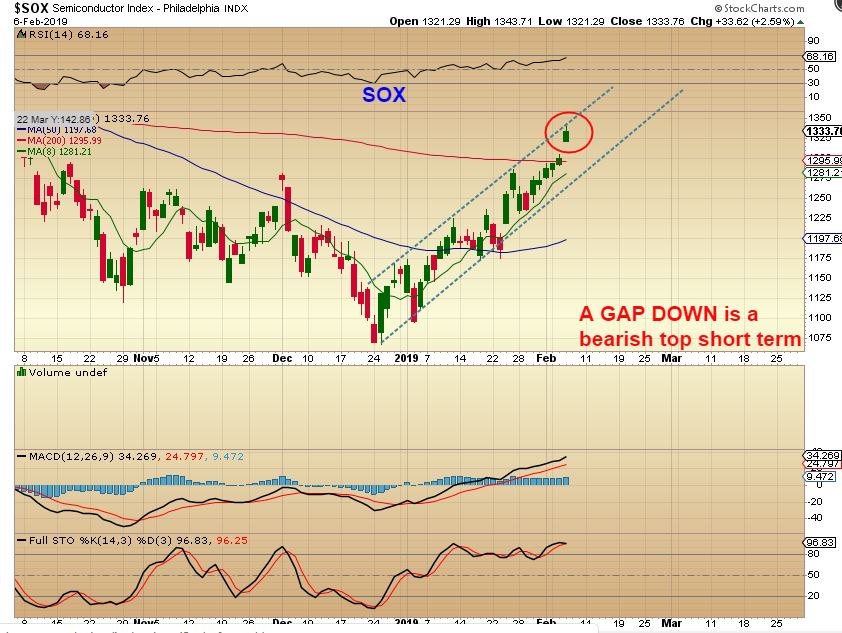
SOX #1 – The Semiconductors actually broke out over their 200 sma Wednesday, though the General Markets didn’t. Often the semis lead the markets, so I have to wonder if the markets will do the same, or is this a fake break out?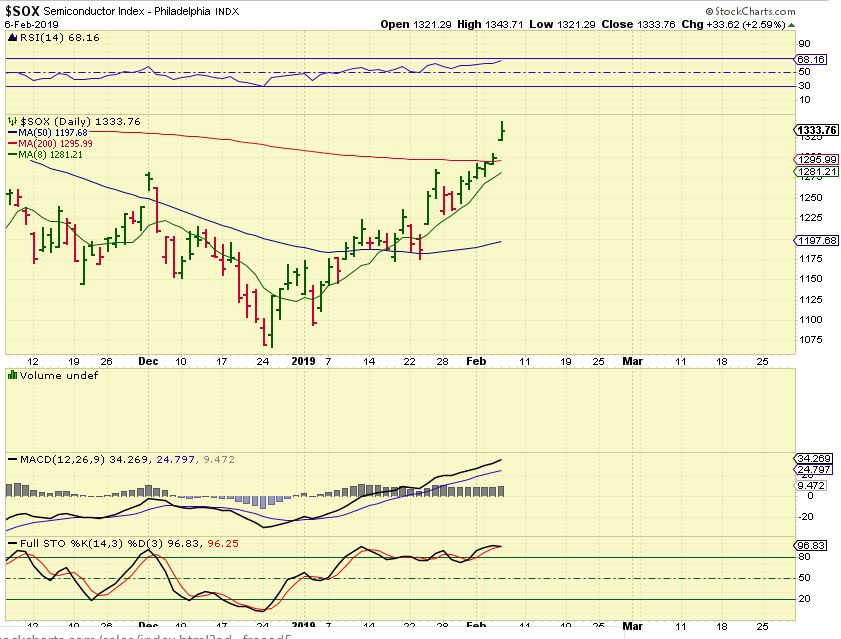
SOX #2 – If I use candlestick charting, this could end up being the top, because this is often a topping candle. If it gaps down tomorrow, it will be an abandoned baby top and likely a fake break out.
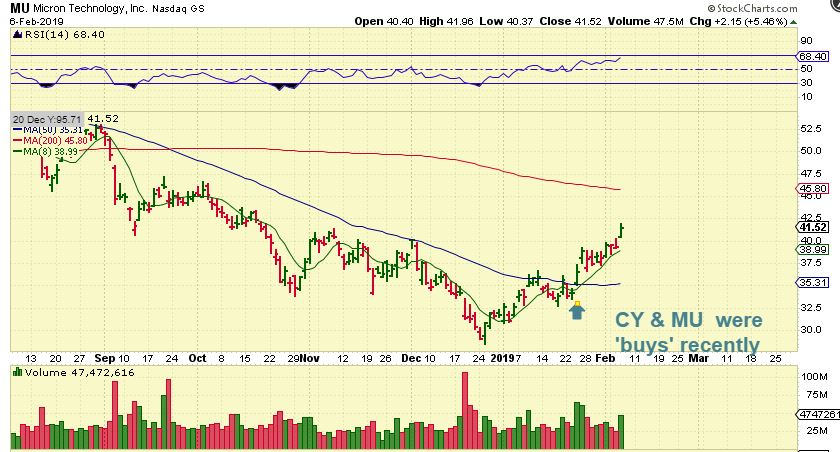
MU, AMD, CY, AMAT, etc were buys again at the 50 sma, and the semi stocks continued higher, so they can be ridden until they break the 10sma, but a back test of the 50 sma is likely.
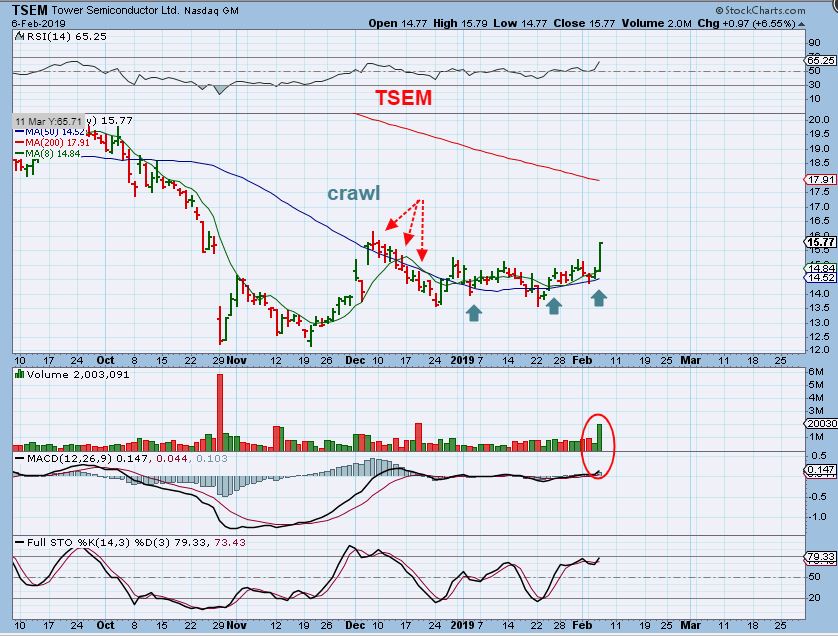
TSEM – I actually really like the way TSEM has been acting around the 50sma. Is it ready to continue higher? If it drops back to the 50 & Holds there during the market dcl, it could be on a watch list to buy.
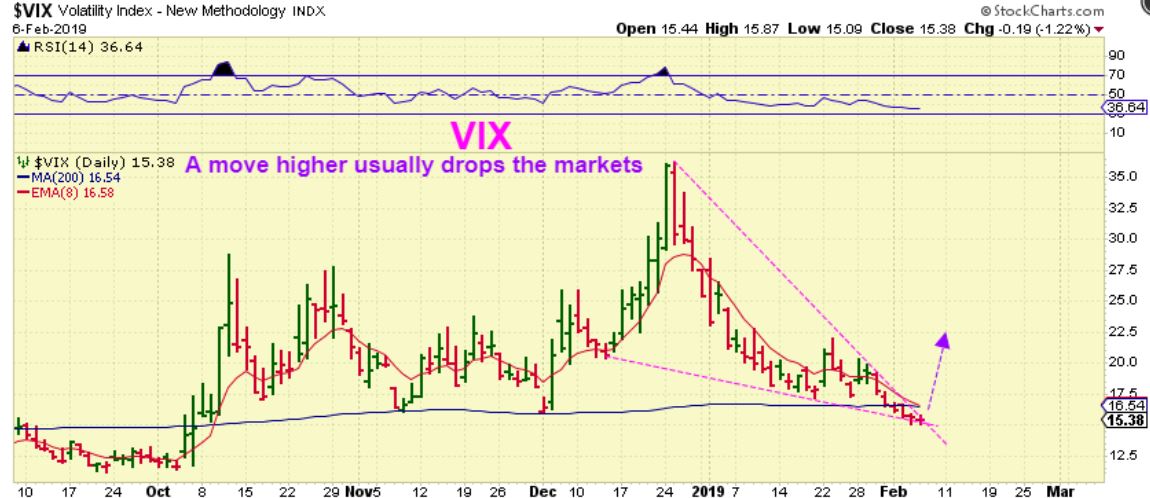
VIX – A push higher by the VIX ( Volatility) is often accompanied by a drop in the markets. The VIX looks ready to POP. TVIX is also traded BY THE FASTER EXPERIENCED TRADERS during pull backs .
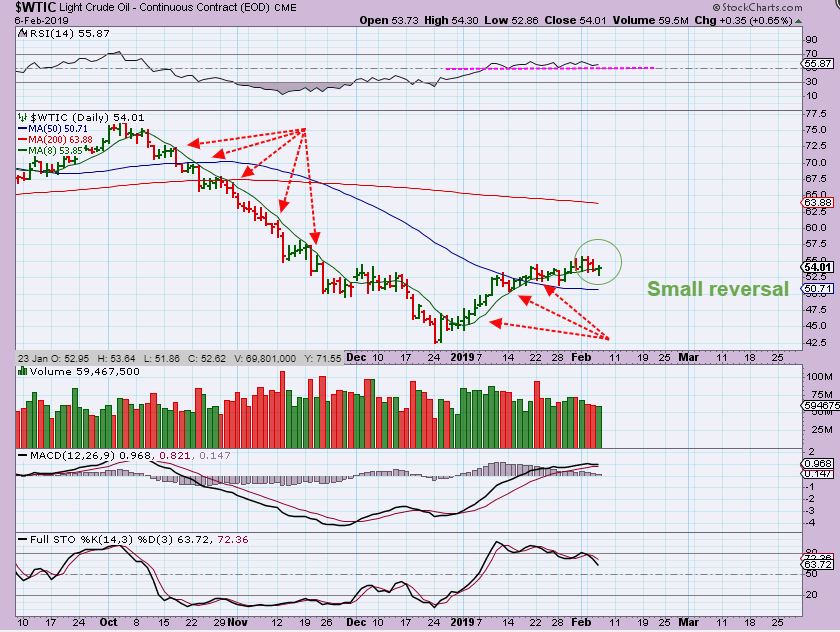
WTIC – I bought the reversal in Oil after the inventory report, but it really is lack luster as it works its way sideways. I am hoping for a run o the 200sma, but we are slowly running out of time. I bought OILU ( a 3X etf) , and will sell if it heads south. Oil has been stalling lately.
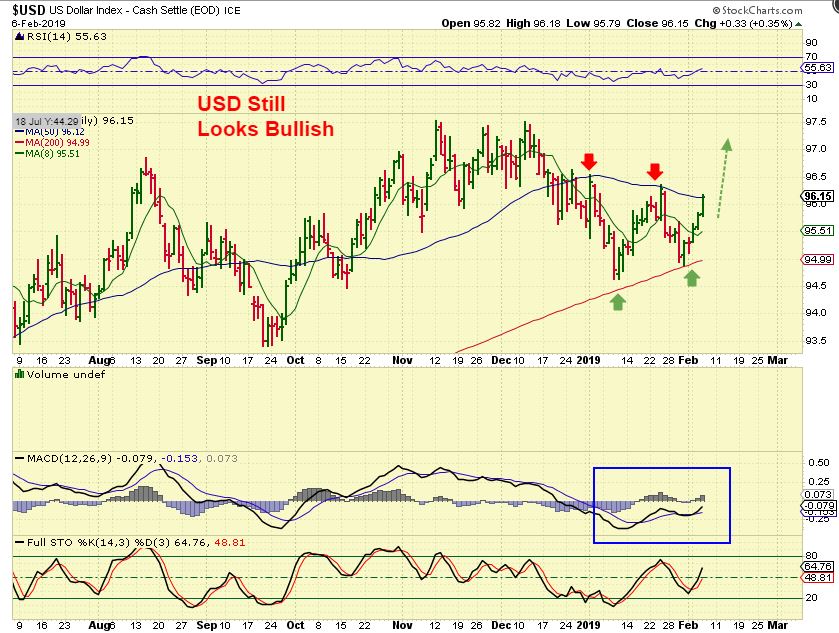
USD – The USD still looks bullish and popped toward that 50sma.
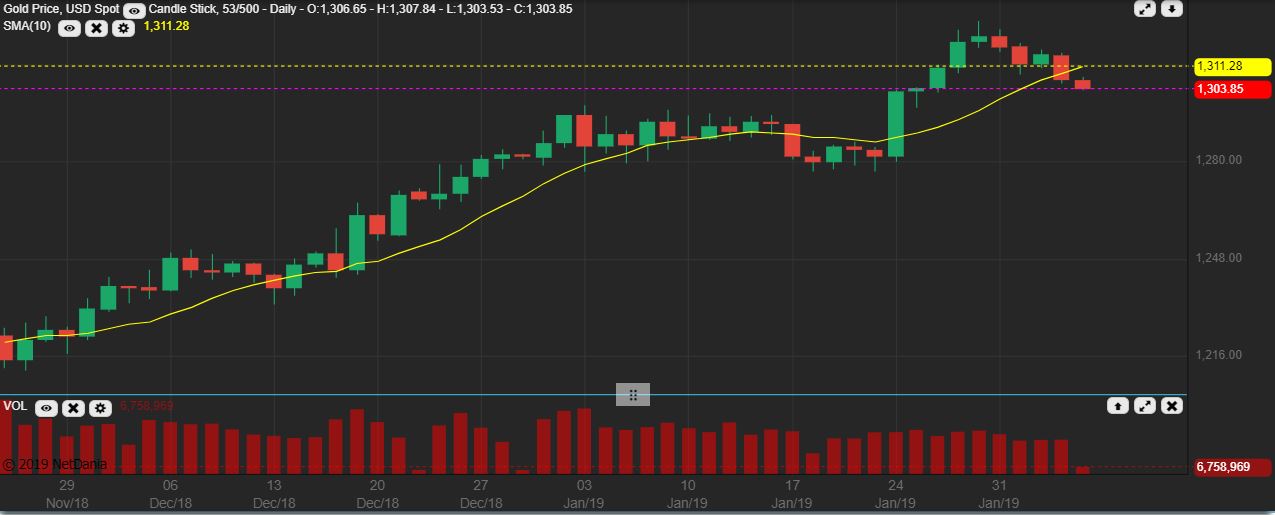
GOLD #1 – Gold is dropping and is also now below the 10sma. We are expecting GOLD to sell off eventually , but it has been Bullish …
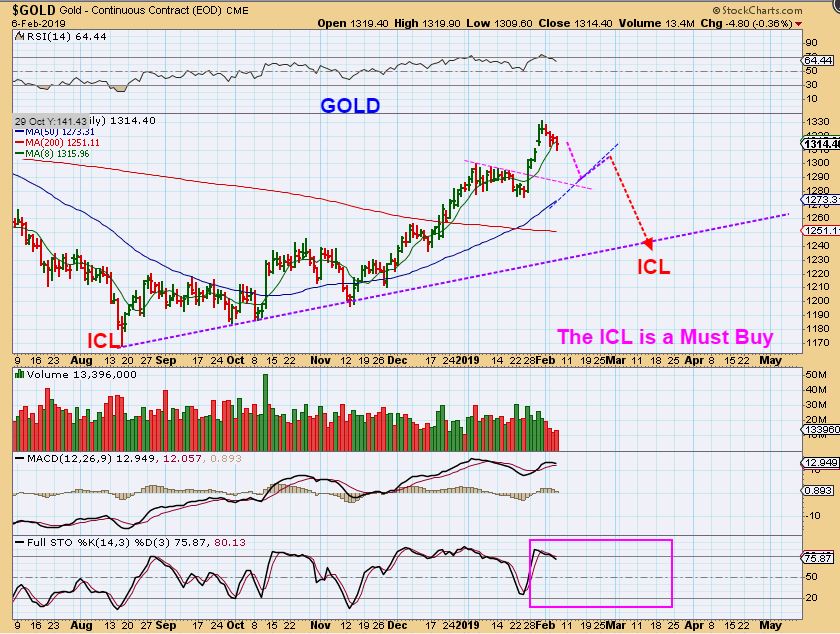
GOLD #2 – This is how I would picture a drop into an eventual ICL at this point. The trend line of this Intermediate Cycle should be violated. For the first time in this climb, the MACD looked weaker at the last Pop to new highs.
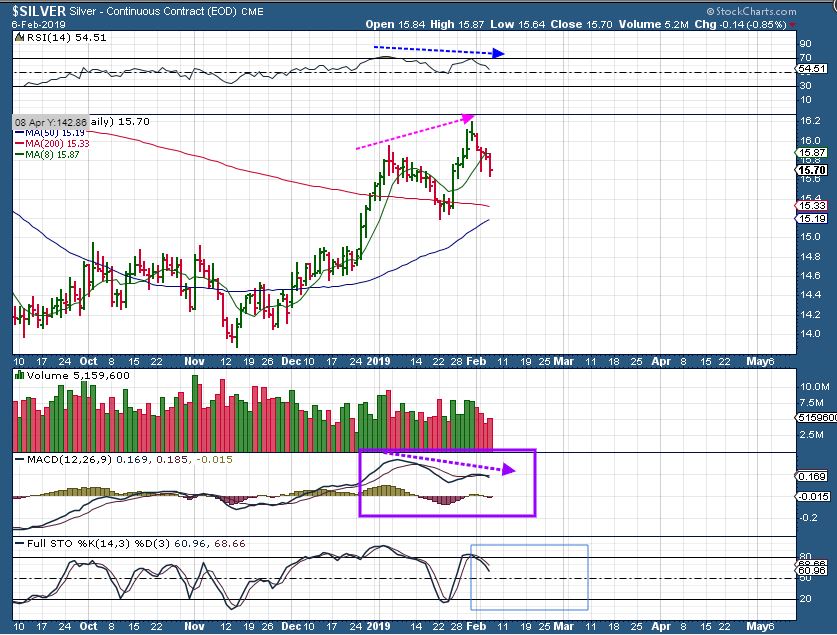
SILVER – So far it has been dropping on rather light volume. Divergence at the highs was evident.
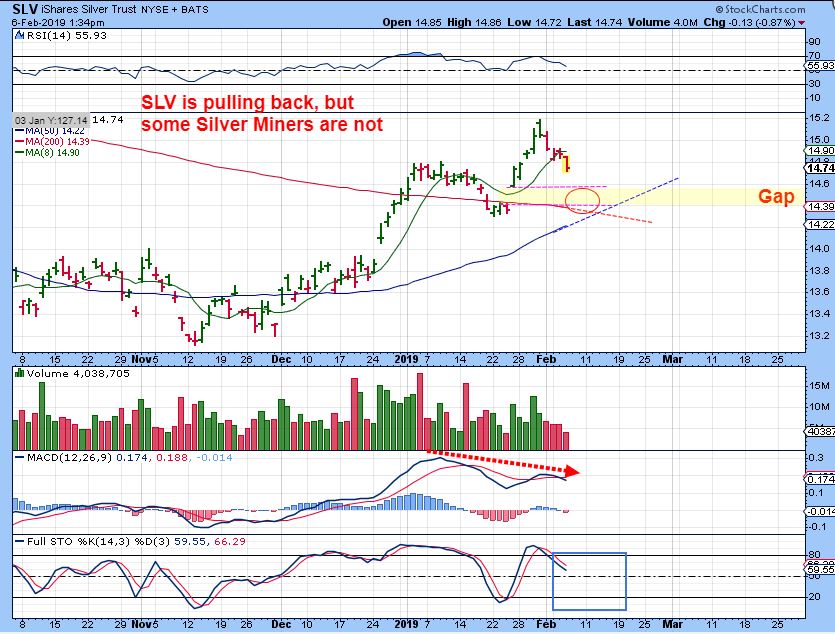
SLV – GOLD & SILVER are pulling back, but Miners really aren’t yet. SLV has a gap at the 200sma.
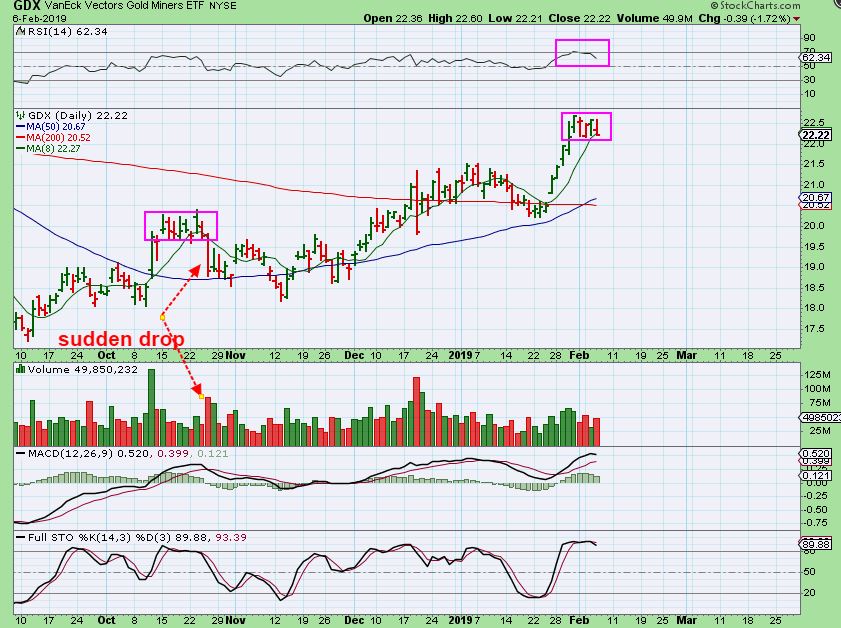
GDX – Thought GDX & GDXJ aren’t pulling back day after day, this can become a Tower Top , like we saw in October. It suddenly sells off and continues lower.
So I am expecting some short term tops to begin showing up in various sectors, as mentioned. I tighten tops and allow myself to be removed from a trade at this point, usually a bit under the 10sma ( or I set my stop to at least get me out of 1/2) . I sold my position in HEXO for example, but I am fine with that. I will explain that below. There is always another trade 🙂 After we get several days of selling in the General Markets, eventually in Energy, and also in the Miners, etc, buy set ups will begin to appear in one place after another again. I will have a little more in the way of charts at the end of the report.
.
Enjoy your Thursday trading
.
~ALEX
.
MOST OF THESE STOCKS ARE ON A WATCH LIST IF THE MARKETS PULL BACK. IF OIL RUNS HIGHER, THE ENERGY STOCKS MAY BECOME A BUY NOW.
.
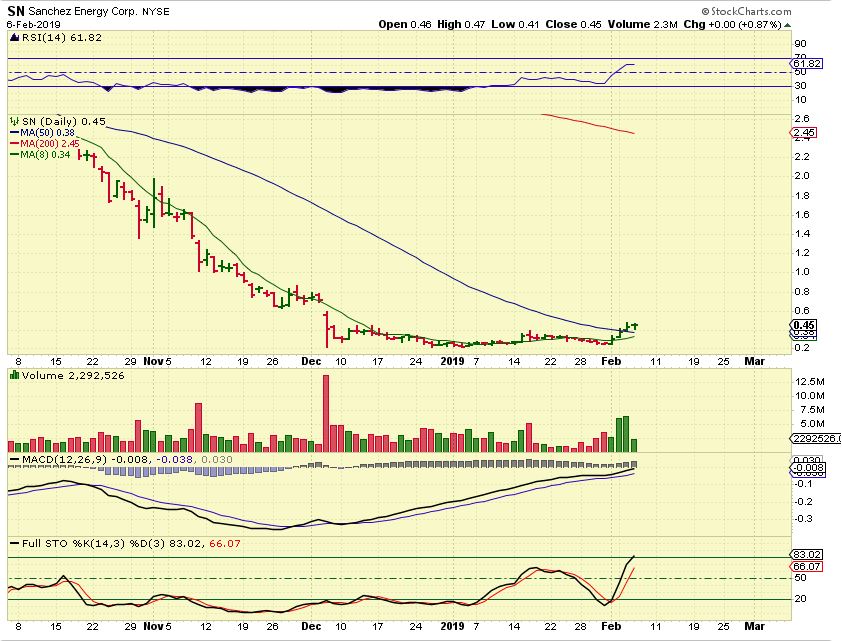
SN– I still like SN. I was away from my computer for most of Wednesday , or I may have bought this.
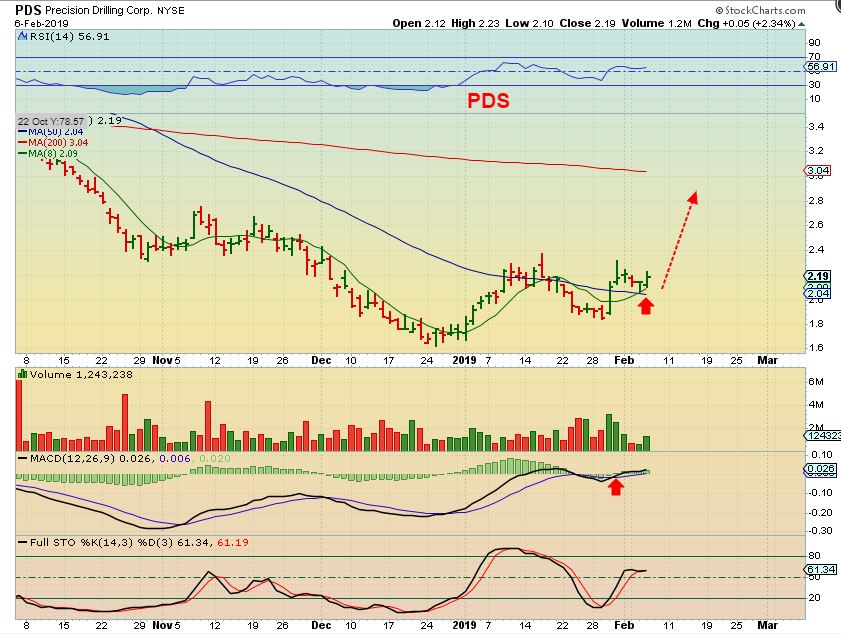
PDS – I think I would have taken a position in this as a low risk Energy Stock too ( I still might). It reversed off of the 50sma, so that can be my stop.
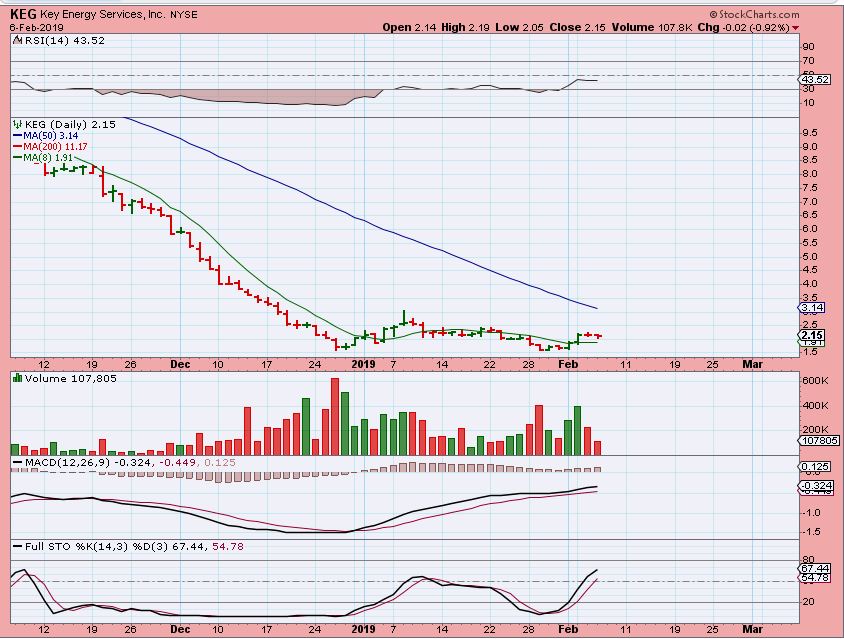
KEG – I still like KEG, and I’m watching it daily. It is acting correctly as a double bottom low.
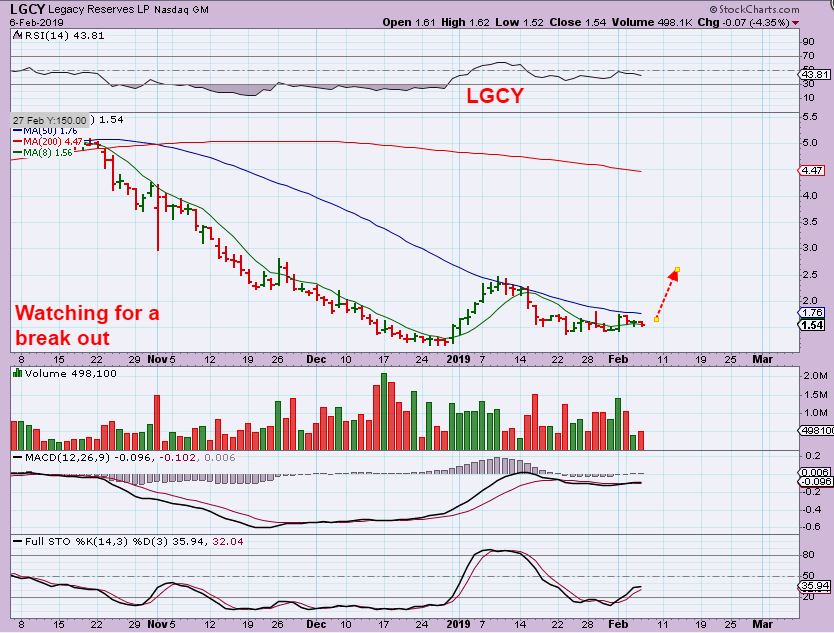
LGCY – And I still have my eyes on this one and DNR. The set ups are there, the follow through is a bit lagging, but then again, so is OIL right?
.
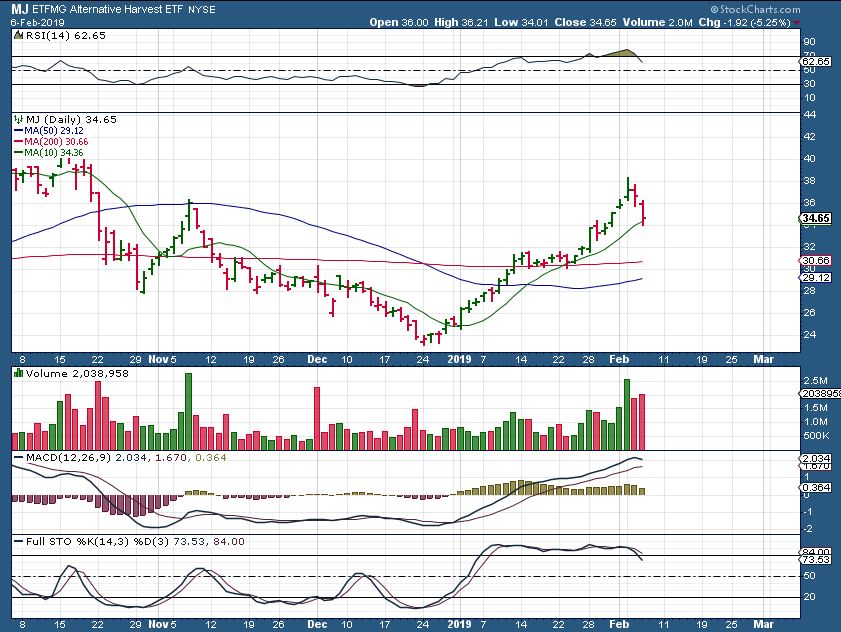
MJ ETF – We have a normal pull back, and hopefully that is it, but the volume is high. As a trader, I always lock in some profit on the way up because when these DO sell off, they sell down quickly. Look at Novembers sell off. 5 fast days down and you lose your gains. WILL MJ SELL WITH THE MARKETS? Let’s look at a couple of stocks.
.
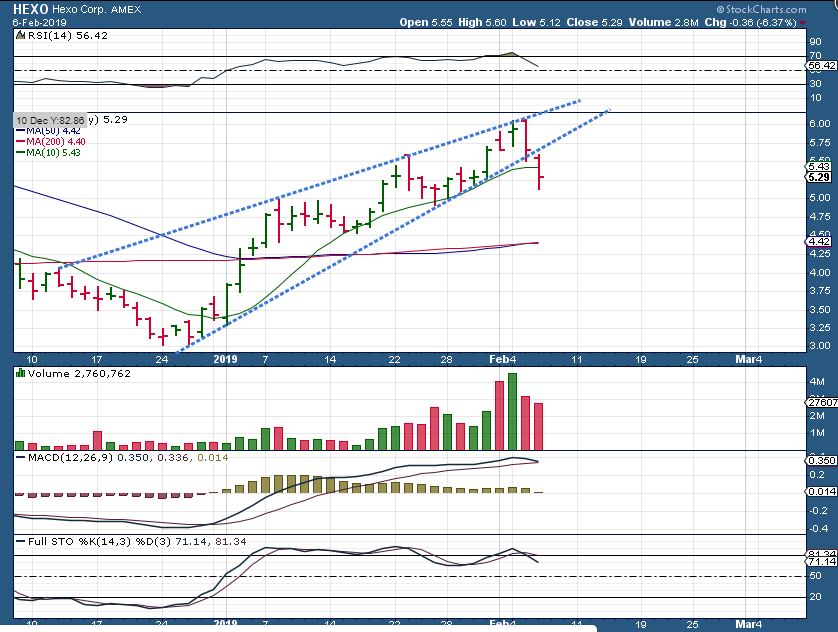
HEXO – I drew this as a warning in yesterdays report. Read what I wrote. I don’t like Bearish rising wedges and the 50sma was never back tested…
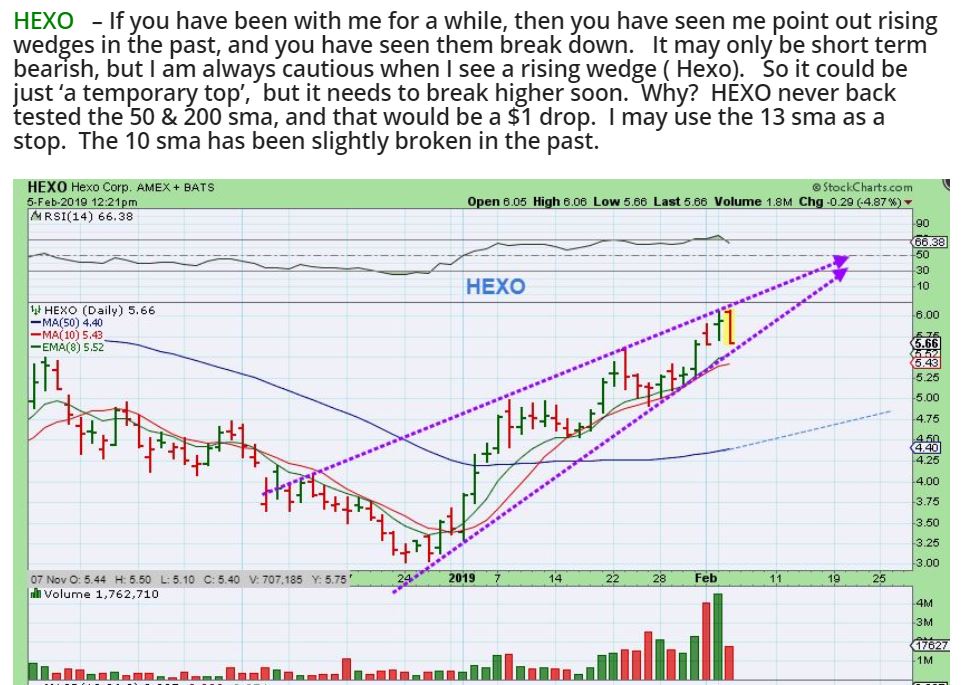
HEXO – I sold all of my HEXO and I think this will drop to the 50 & 200 sma. That will then give us a parallel channel.
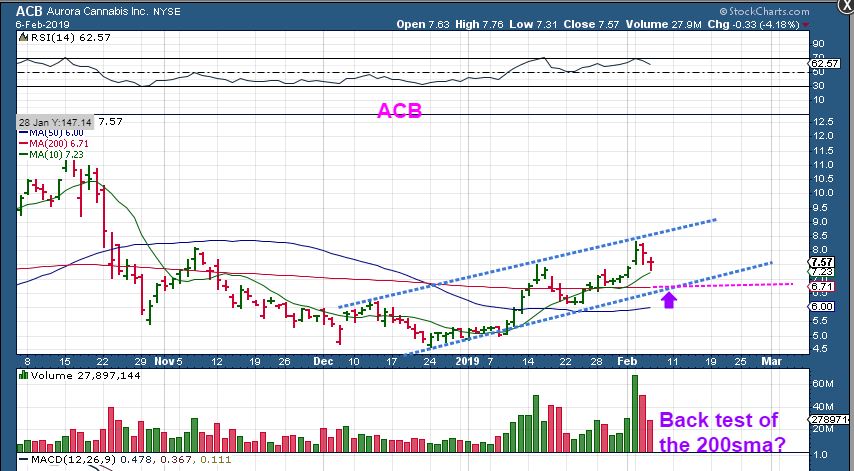
ACB – I started to see a possible wedge in ACB, so I sold a portion. It only did a gap fill and moved higher into the close. It MIGHT have another push higher, or…
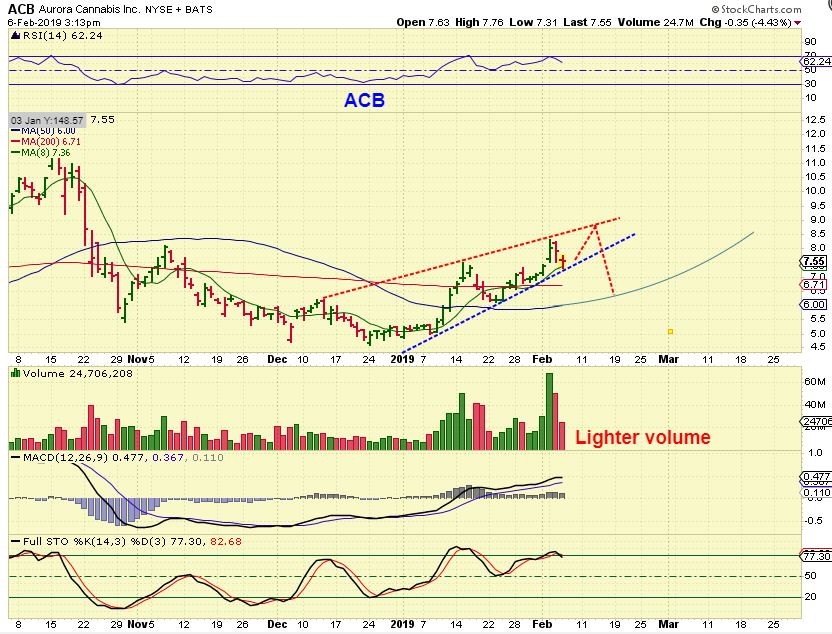
ACB – It may drop to the 200 sma and form a channel too. It is not clear, and this will reveal itself over time.
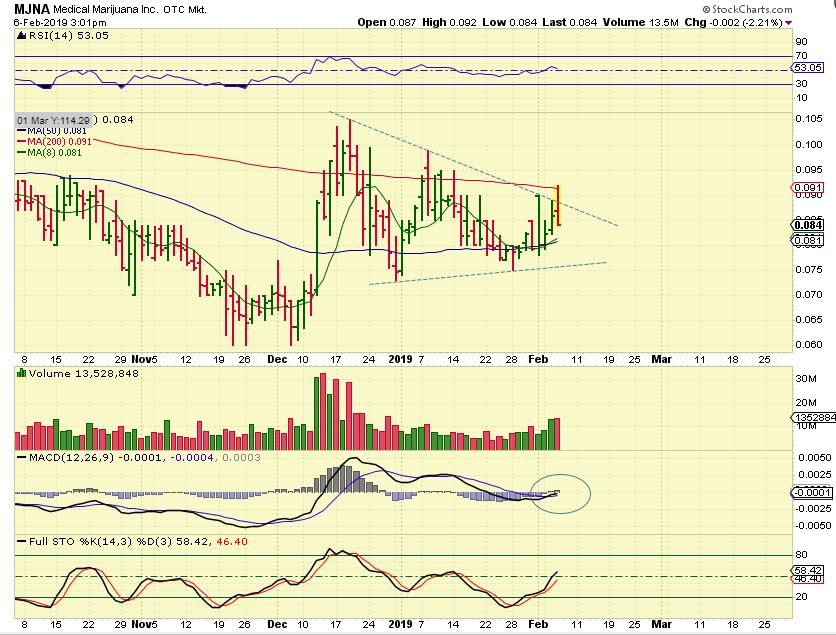
MJNA – I am actually watching this pattern as a possible Buy. If the triangle continues and breaks out, this is a penny stock, but they have been running well.
ALEAF #1 – Most know that I have been bullish on ALEAF. IT has doubled and I expected a cup to form. SO far it is doing well at the 8 ema or 10 sma, but…
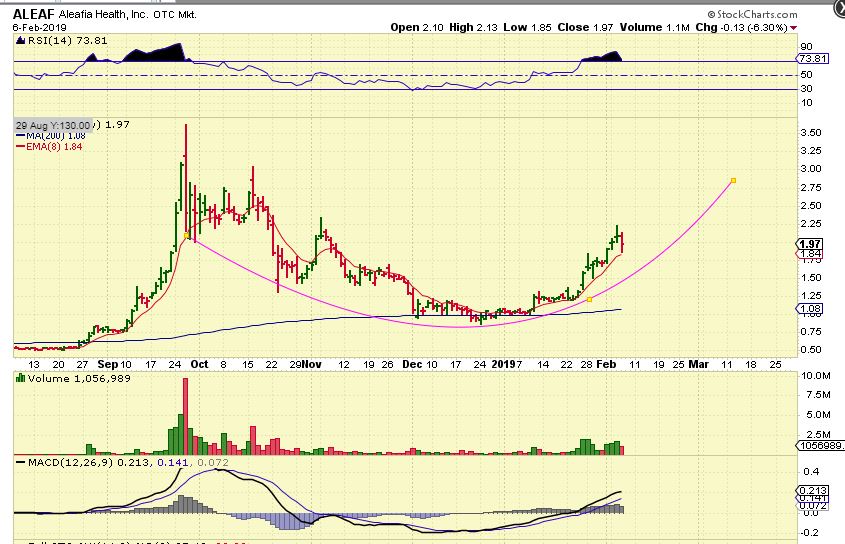
ALEAF #2 – So far , so good, and this acted correctly at the 8 ema, but I would HATE to see this …
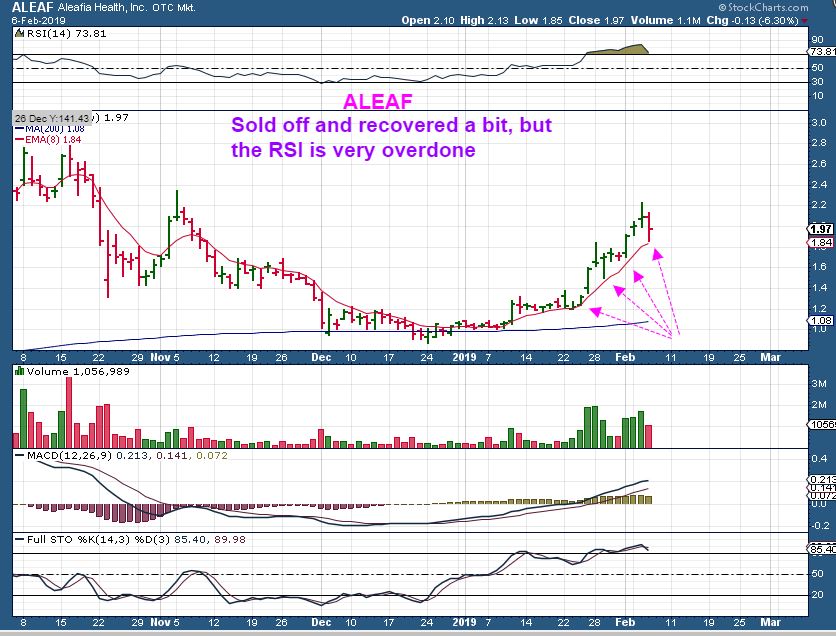
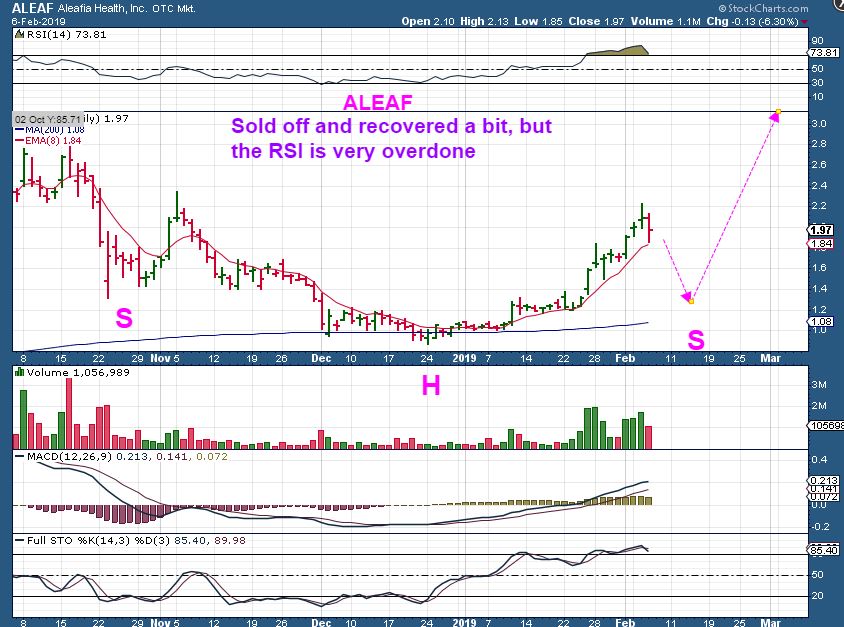
ALEAF #3 – I would HATE to see this dip down first and form an inverse H&S before completing that cup. I am using that 8 ema ( or the 10sma) as a guide.
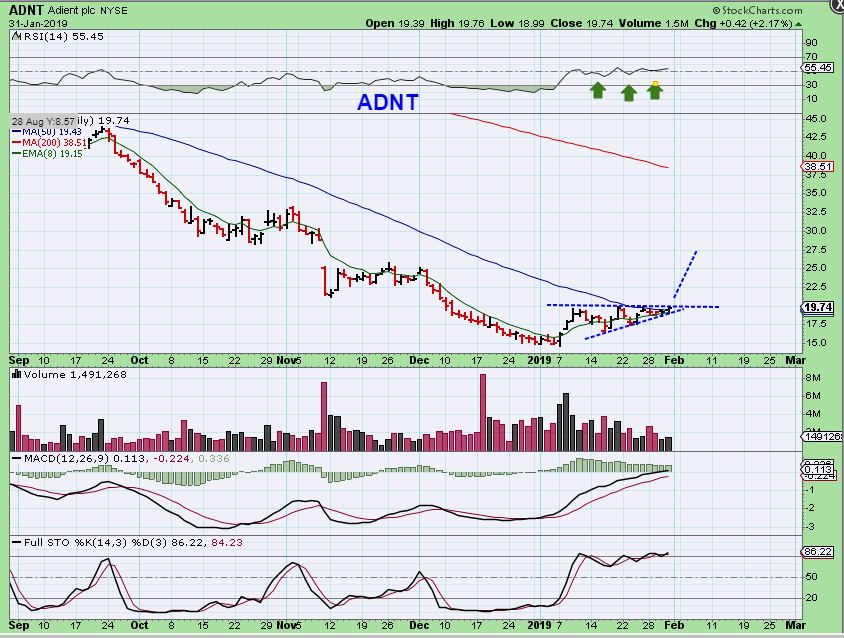
ADNT – This was posted as a Buy near $19.75
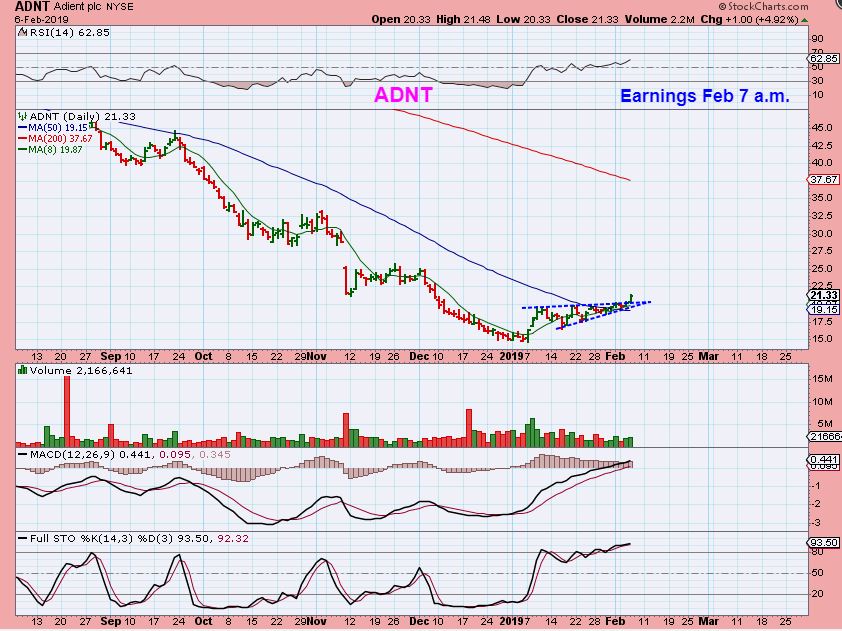
ADNT – It is running, but I just saw that earnings comes out THIS MORNING. Lets see if it can rally , but beware if it drops below that 50sma.
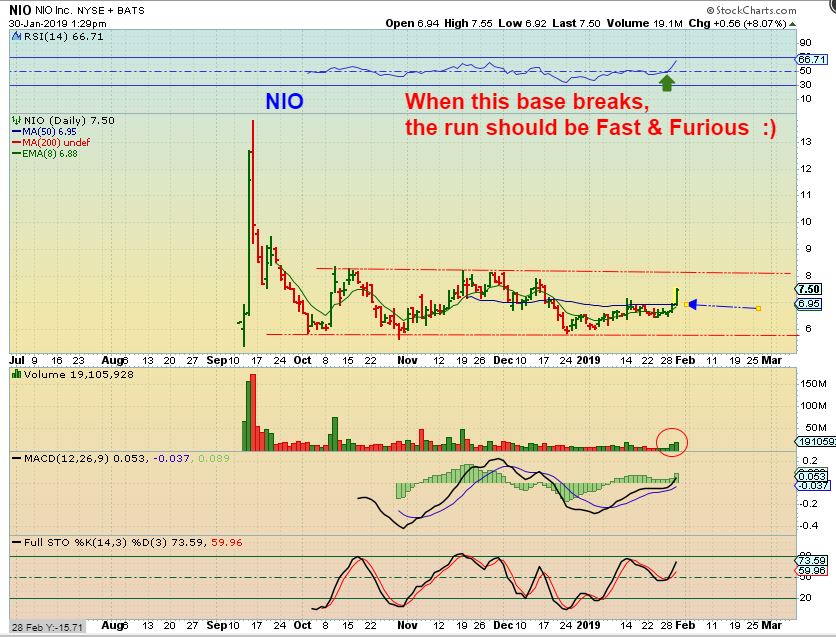
NIO – I posted this a week ago…
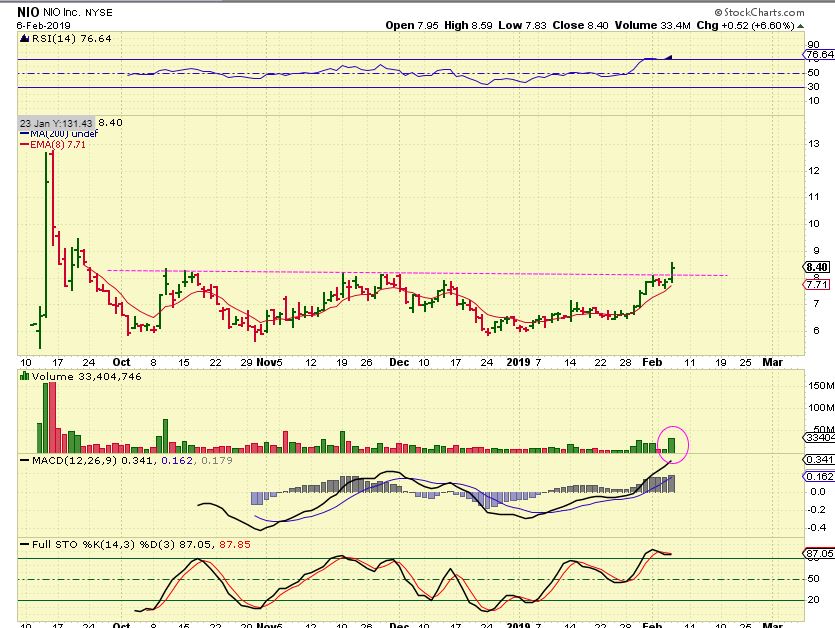
NIO – After a small sideways flag, there it goes. I don’t own this, but I should have bought it when I posted it. I may try to find a way to get in while keeping risk down ( If it pulls back at all). This is called the Chinese Tesla, I’m watching to see what it does if the markets pull back.
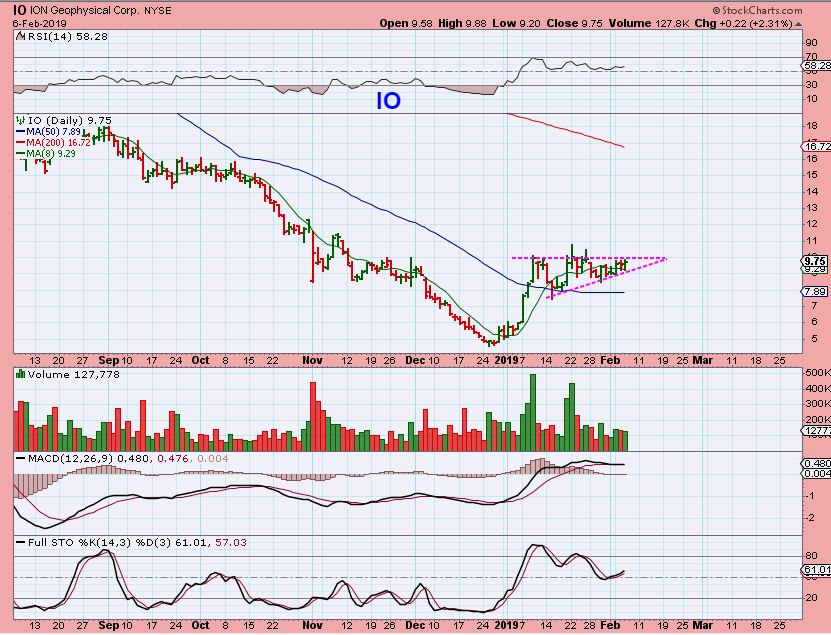
IO – This is a bullish pattern too. It just ran $5 to $10 and has a $15 target if it breaks higher.
I WANT TO GO BACK TO THE 2 SILVER STOCKS AG & CDE THAT I SHOWED THE BIG BIG PICTURE OF…
.
AG THE BIG BIG PICTURE – You recall this BIG BIG PICTURE SHOT. Lets zoom in on the ‘base’ again.
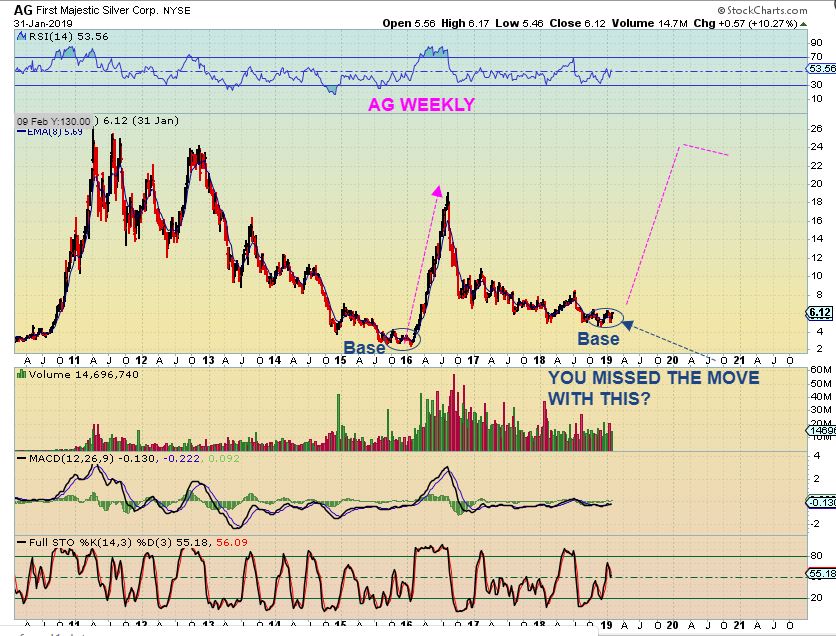
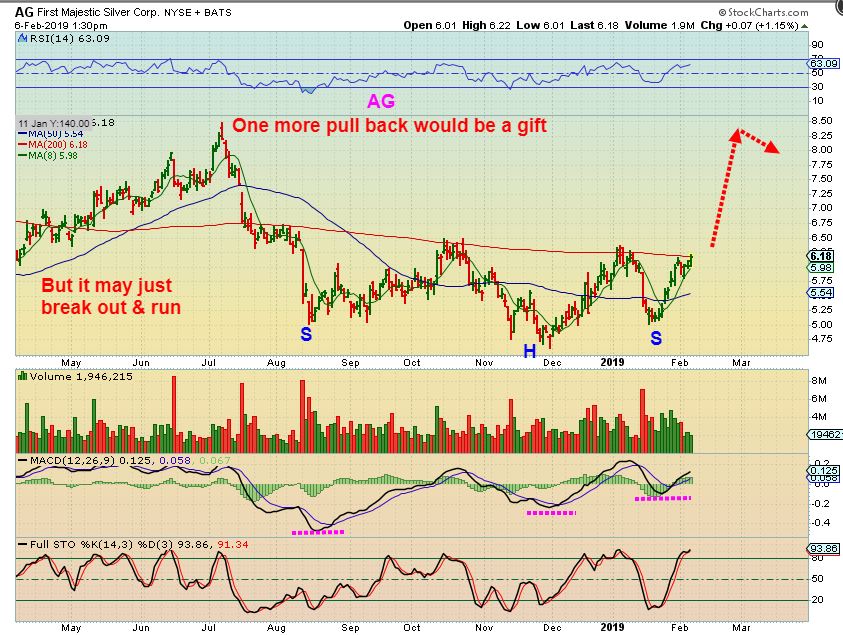
AG – This looks ready to break out, and if it does, it may be the last chance to get in at low prices. It dropped and closed at $6.05 Wednesday. We ARE expecting a pull back in Miners though, so here is what I am looking at. Either a break out here, buy above the 200 sma & you can put a stop under the 200sma if you want. If it does pull back, maybe to the 50sma, we’ll stalk that entry .
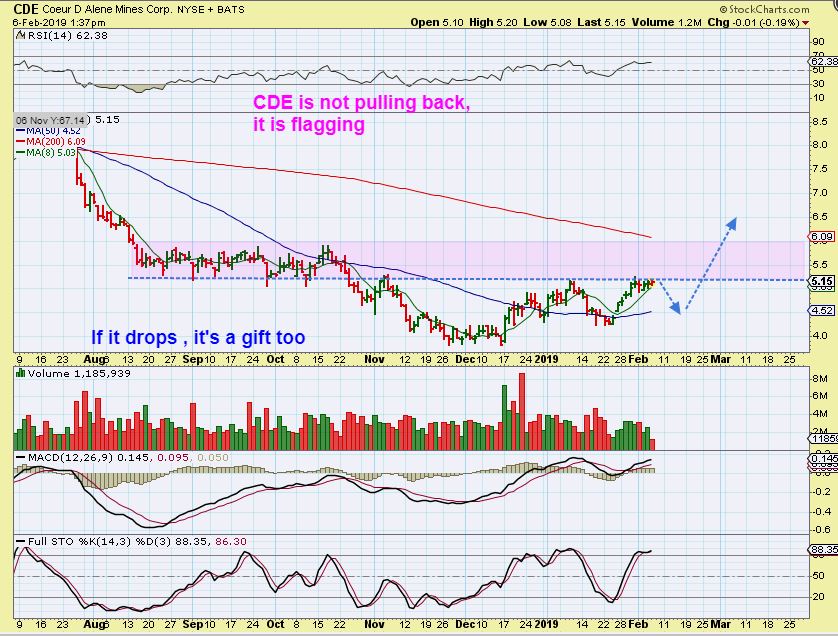
CDE THE BIG BIG PICTURE – The run so far just looks like a tiny base, so lets zoom in here too.
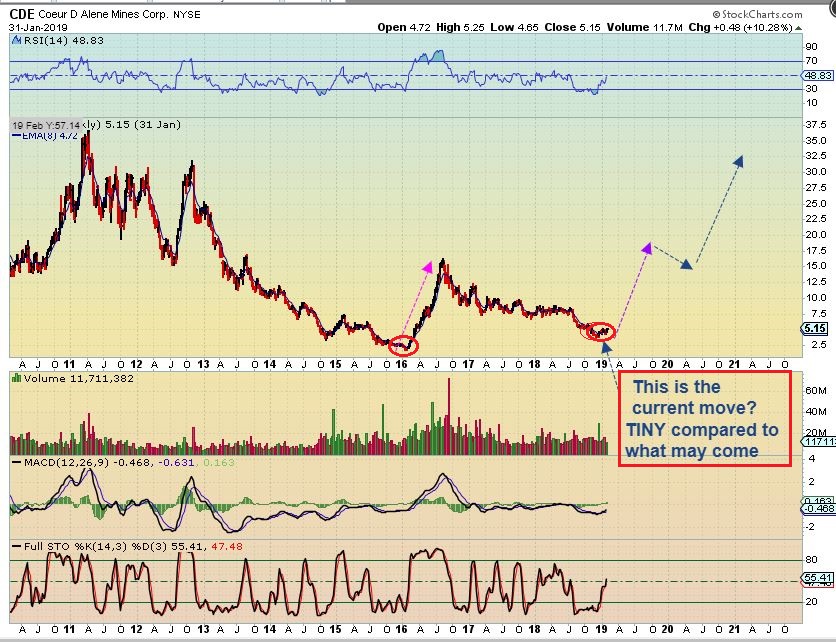
CDE #1 – The Current CDE base is also at a point of resistance in the base. If it breaks out, it is a buy with the blue line as a stop. It dropped and closed at $5.03 Wednesday.
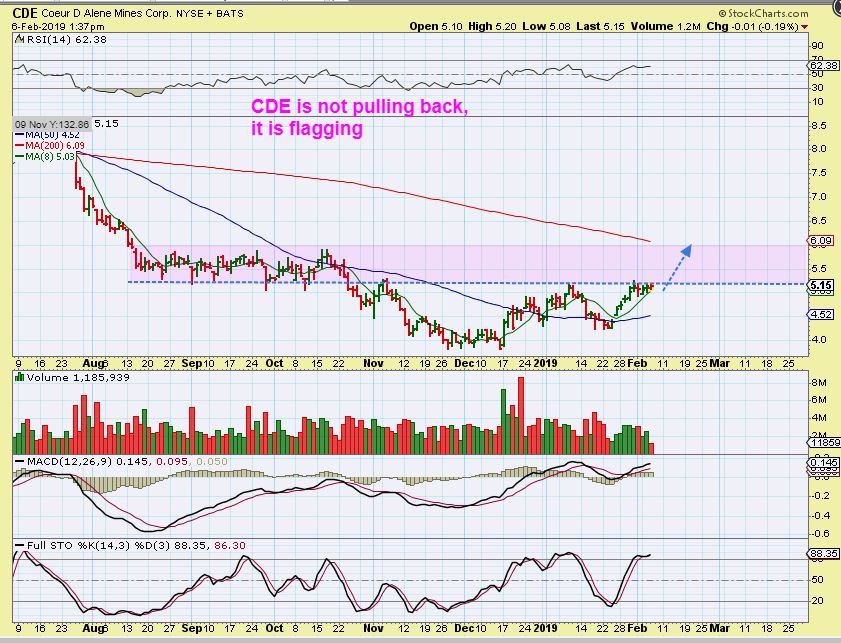
CDE – IF THIS SELLS DOWN FURTHER , say to the 50sma again, we’ll look for an entry.