January 30th – Waiting On The Fed Again
Let’s take a look at the markets current set up, as we wait for the FOMC Decision at 2 PM. Eastern today.
.
SPX – Basically still sliding sideways along the 50sma as expected, we had no real change in the General Markets. Are they waiting for the FOMC Decision too? 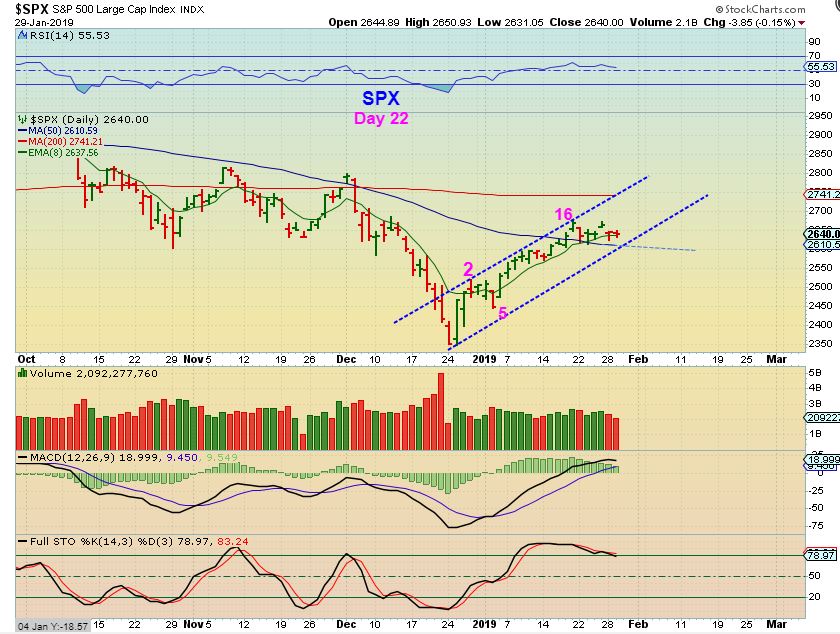
I wanted to take a look at something else here, to see if there are any clues as to which way the Markets may break after the Fed Decision…
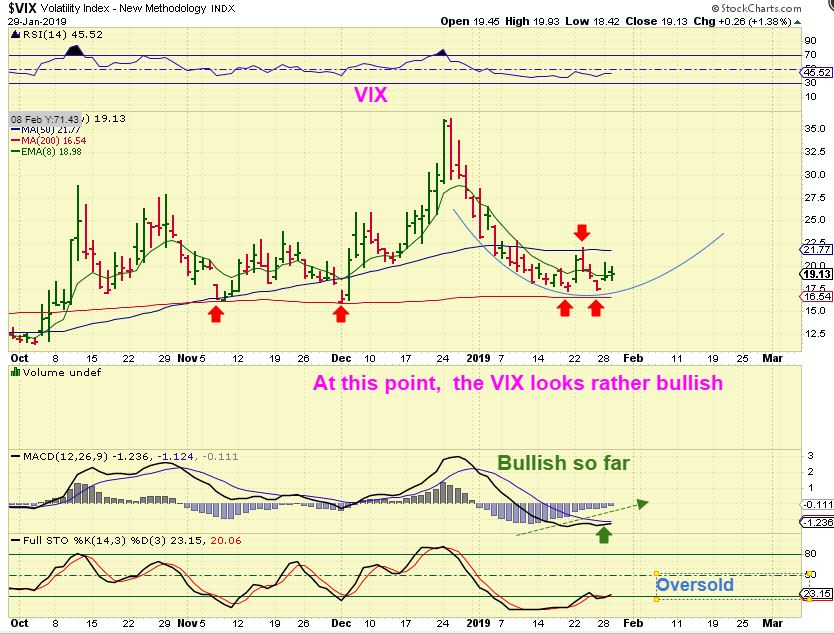
VIX – When the VIX is Bullish, the Markets drop, and the VIX actually has a bullish look to it, however it CAN just go sideways and bounce around for a while too. My personal thought? : The SPX is on day 22. I would actually think that the markets would pop higher to the 200sma before dropping into a dcl. And…
CPCE – I use the Put / Call Ratio at extremes to gauge a high or low in the markets too. It is not an EXACT Science, but it works more often than not. This is saying that the markets just suddenly pulled back enough that they are actually at a level that prior lows have been seen. It is not extreme, but Lows have been put in place here. Read the chart.
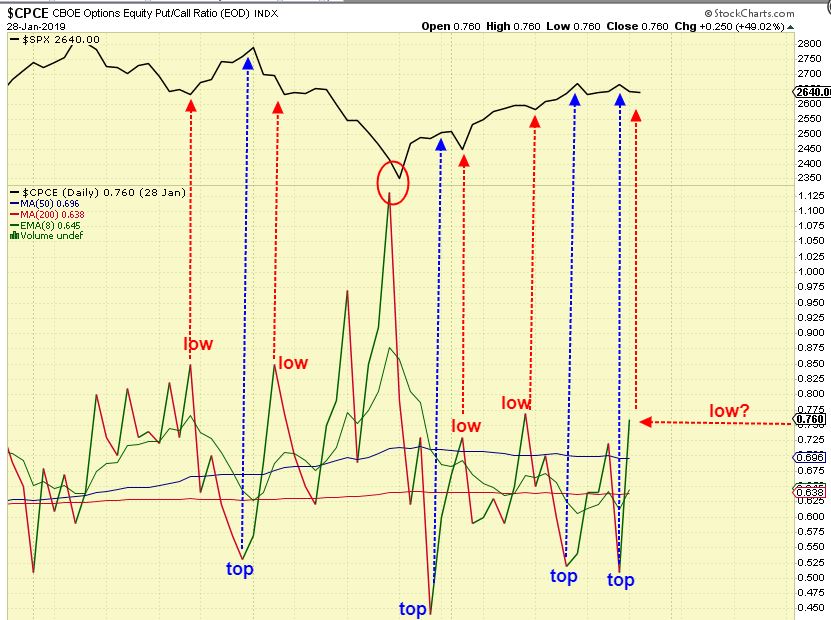
It gets harder to call which way a sideways market will break during the ‘middle’ of the run (on day 22), since it could go either way timing wise. That said, The PUT CALL level seems to indicate that the sideways move along the 50sma is a crawl that will break higher. We’ll see.
.
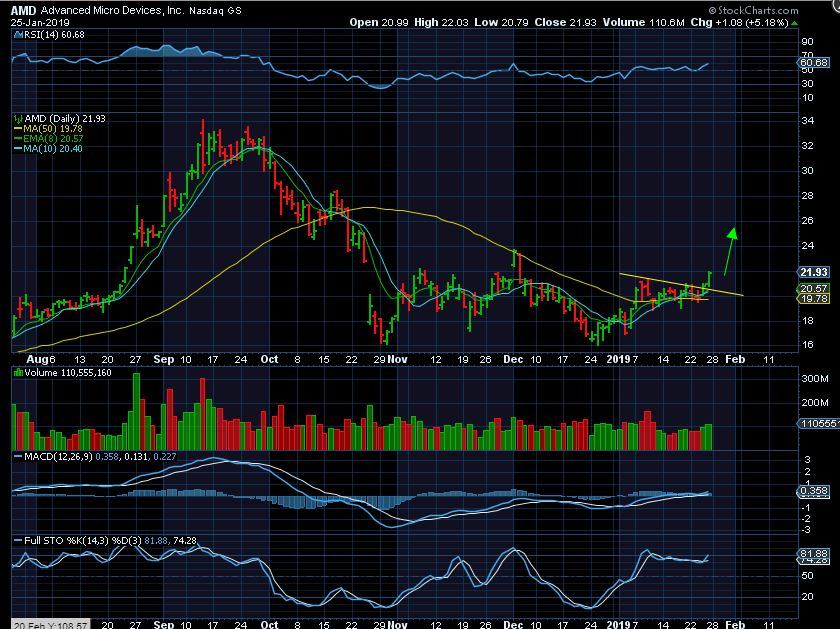
Sidenote: AAPL beat in after hours. Also AMD JAN 25 – After this recommendation, AMD actually dropped back to the 50sma AGAIN when INTC missed on earnings. Well, AMD beat on their earnings yesterday and shot up 10% in after hrs. It was up almost $2 in afterhours, putting it back at $21, so this is again a buy, but now it also has positive earnings to back it up. Maybe it’ll stop basing out here now & take off higher. The weekly chart looks good on the 10 ma.
.
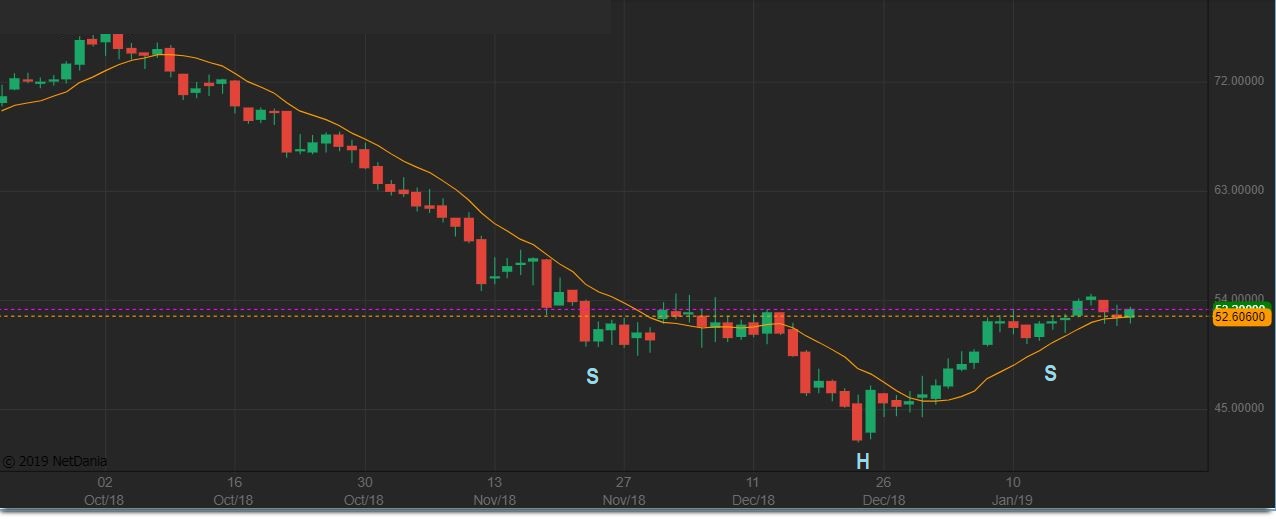
WTIC #1 – Along with the inverse H&S posted recently …
WTIC #2 – Oil did a back test and bounced off of the 50sma. NOTE: Wednesday is the Inventory report. I would expect OIL to move higher from this crawl, because a daily cycle can be 40-50 days long, and we are on day 23 or so. 23 Days is only 1/2 way, and moving up from an ICL can be Bullish in the first couple of daily cycles.
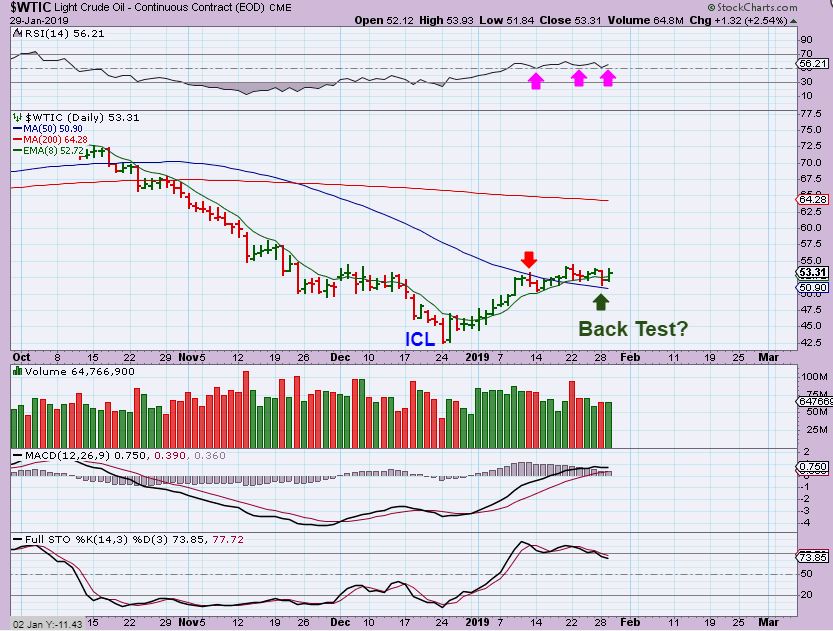
AGAIN : Wednesday is the Inventory report.
.
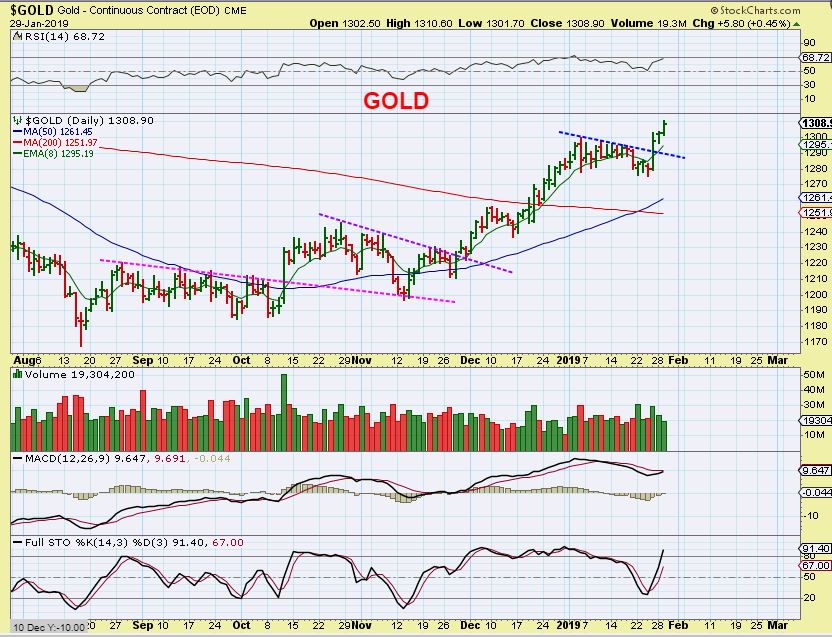
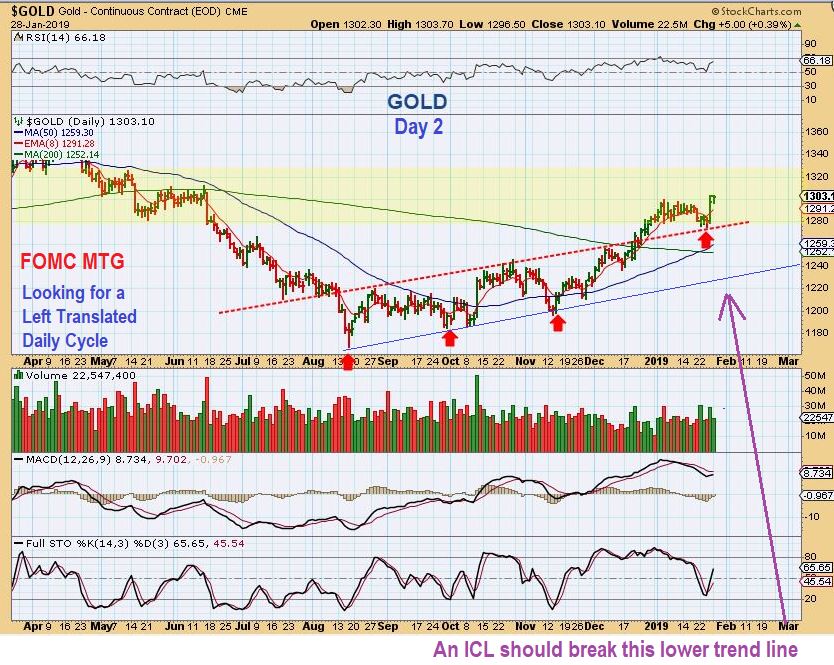
GOLD – Nice follow through on day 3. This DCL was a ‘Buy the lows (DCL) in case it runs higher into day 12 or so, and raise stops along the way”. GOLD pushed higher on day 3 and I think that it could run even higher into the 2 p.m. FOMC Decision . Then what?? I explained Gold thoughts in detail in yesterdays report if you need to refresh that in your mind.
.
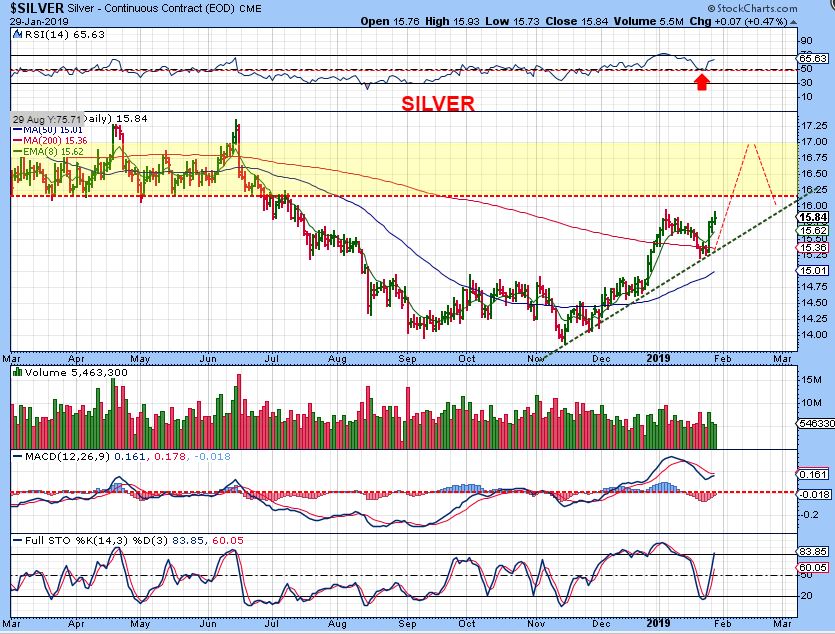
SILVER – These charts are actually really bullish looking. Basically these look to be forming a bullish cup out of the base / lows too. Silver is also rising off of the 200 sma. IF THE SILVER STOCKS CATCH UP, there are great gains to be made, some are still right near the lows.
.
I want to insert yesterdays GOLD Chart in here , to point something out before we discuss GDX.
.
NOTICE THAT GOLD BROKE THE UPWARD CHANNEL & BACK-TESTED IT ALREADY. WOW. DO YOU REMEMBER WHEN GOLD WAS BULLISH AS SILVER & MINERS LAGGED NEAR THEIR LOWS?
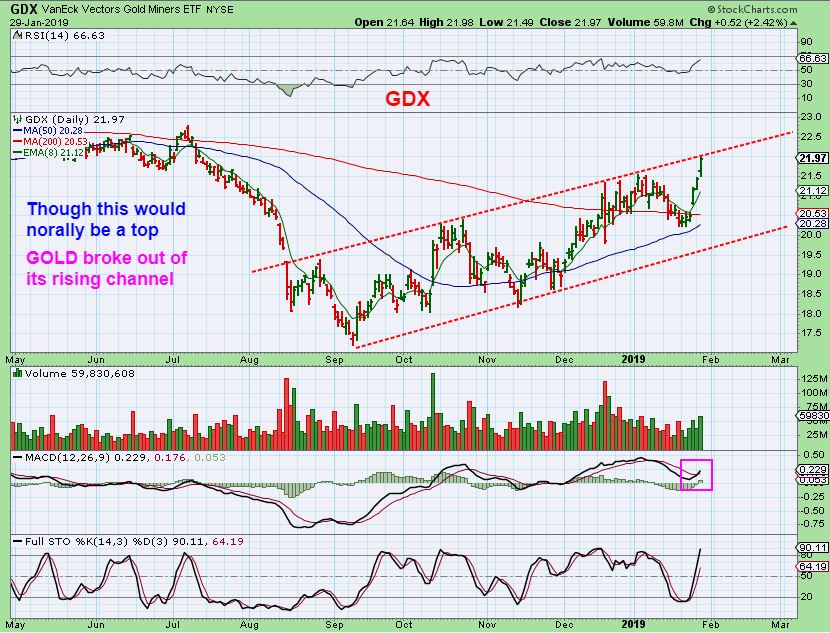
GDX – So now GDX is at the TOP of the rising channel, but we just saw that GOLD was bullish enough to break through it’s channel. Interesting that GDX would get here on FED DAY. Will it POWER Right through it like Gold with a FED Push, or will we see a FED Rejection? Stay tuned. It is only day 4 Tuesday, so this may just power higher.
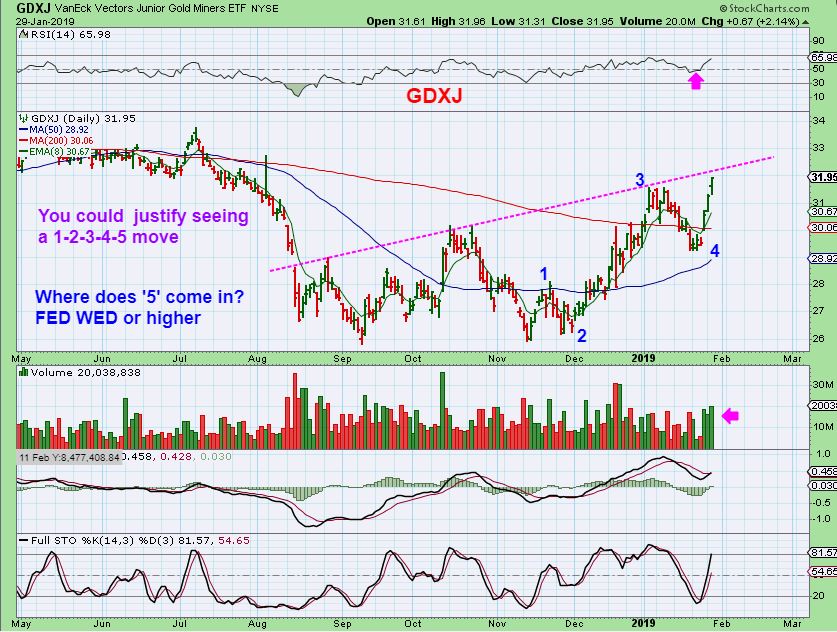
GDXJ – 1-2-3-4-5? Read the chart, is this ‘5’ or will it break & run higher to ‘5’?
Things usually do get a little ‘Active’ at 2 p.m. with the Fed Rate Decision, even when most already know what the decision will be. At this point, we’ll just have to stay alert, tighten ( or loosen) Stops, depending on your plan, and enjoy your Wednesday trading!
.
~ALEX
.
Many Miners were up 4-5 % yesterday, and a few were up even more. Let’s just see what we have going on here…
.
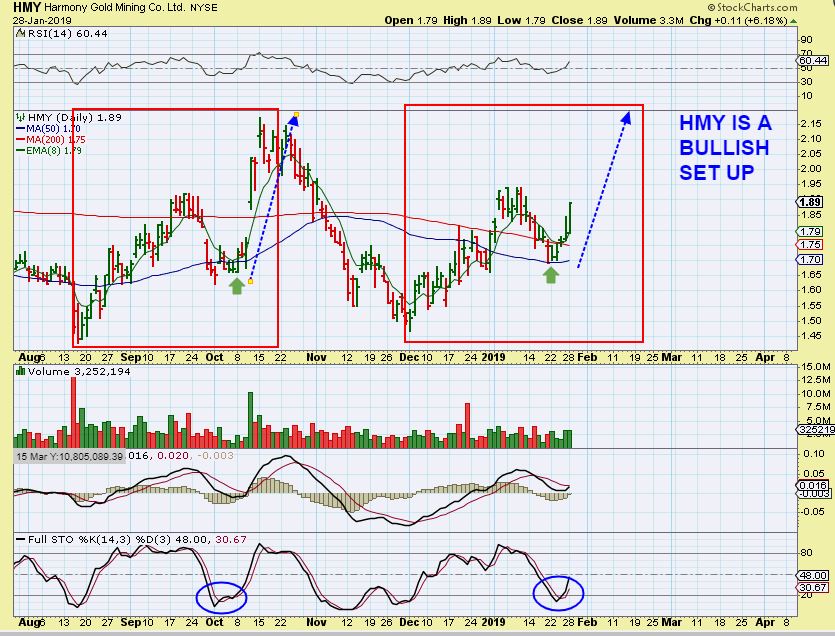
HMY – Yesterdays report had a bullish set up of HMY
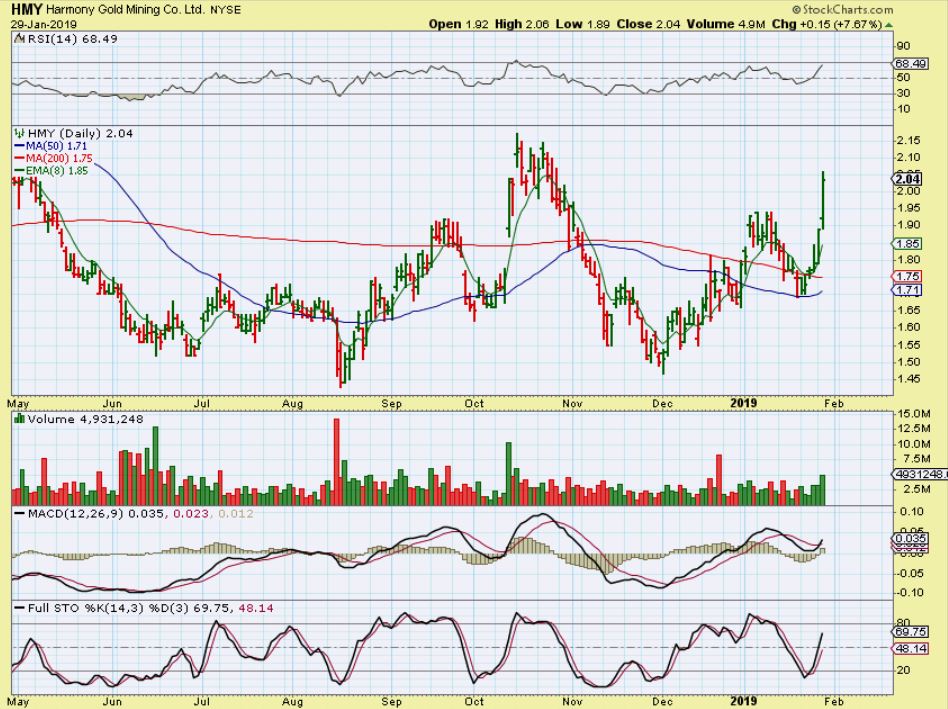
HMY – It stretched out another 7.5%
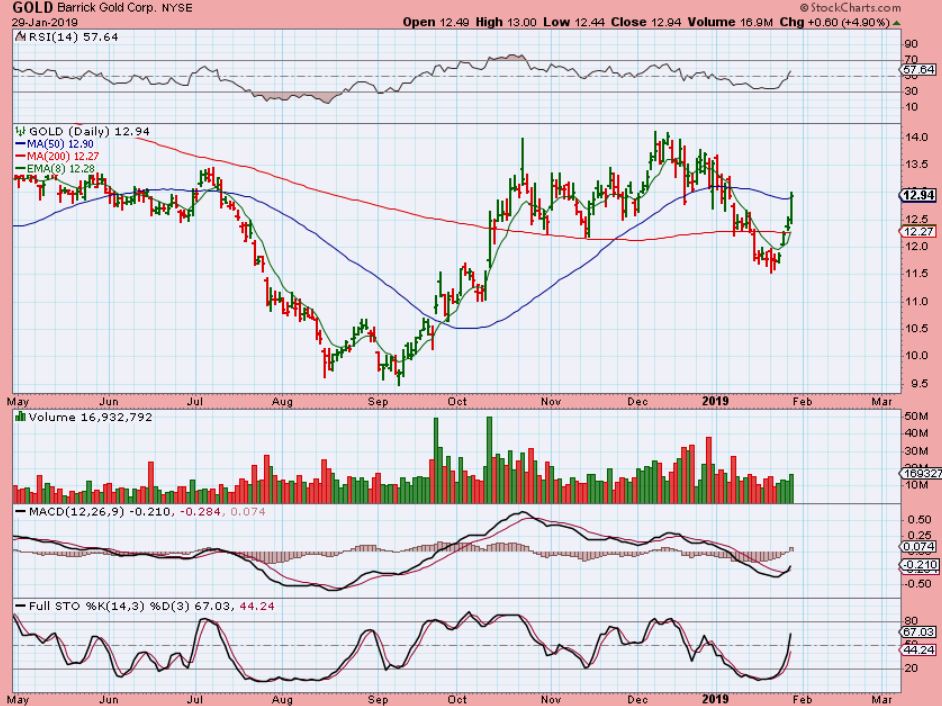
BARRICK GOLD – After the recent Merger, Barrick sold off below the 200sma. After recovering, it looks ready to continue higher as it is pushing through the 200 & now the 50 sma (shake out). This is a low risk buy, but everything needs a stop with the FOMC MTG. .
.
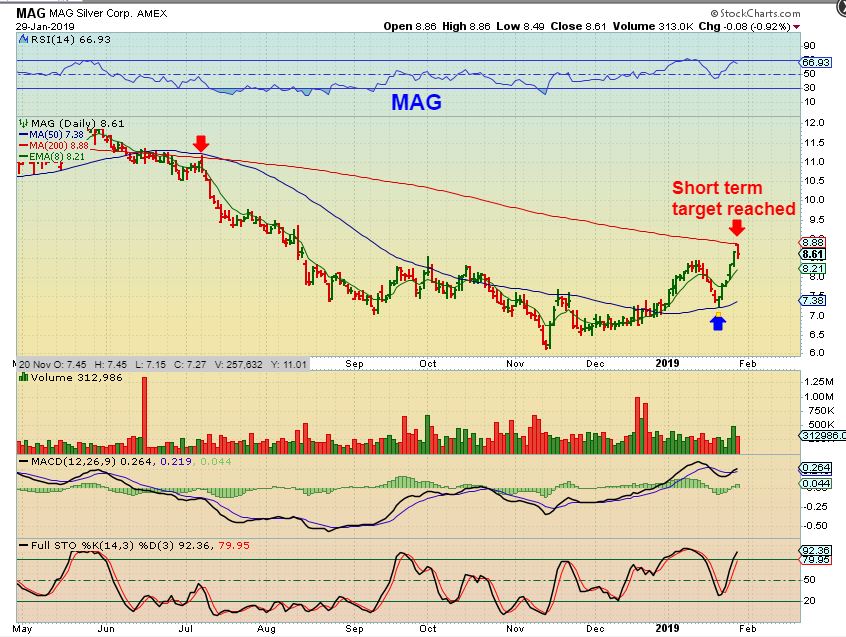
MAG – MAG SILVER was a buy when it reversed on the 50sma. The initial target was the 200sma.
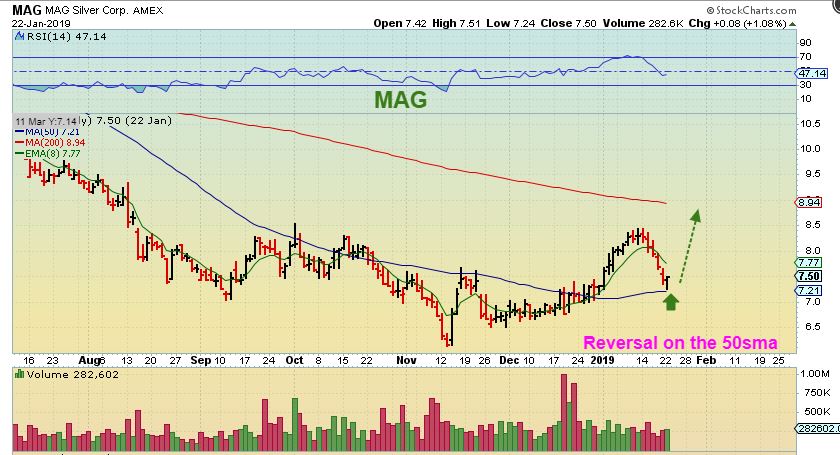
MAG – MAG reversed at the 200sma Tuesday. It may now crawl along that 200 sma and try to break out soon. Some may want to just lock in profits Pre-Fed though, others might want to risk it and see if the Fed Decision pushed Miners higher.
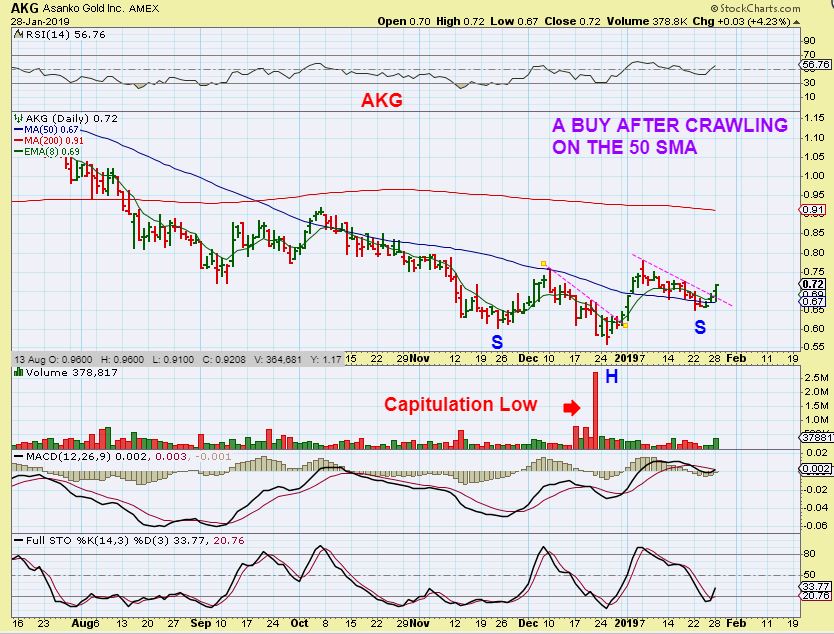
AKG – This was in yesterdays report and is still a BUY ( a low risk entry), because you can place a stop under the 50 sma, and raise it as price rises. Many of these Miners have been running to the 200sma. It only moved up 2 cents Tuesday, but look at this…
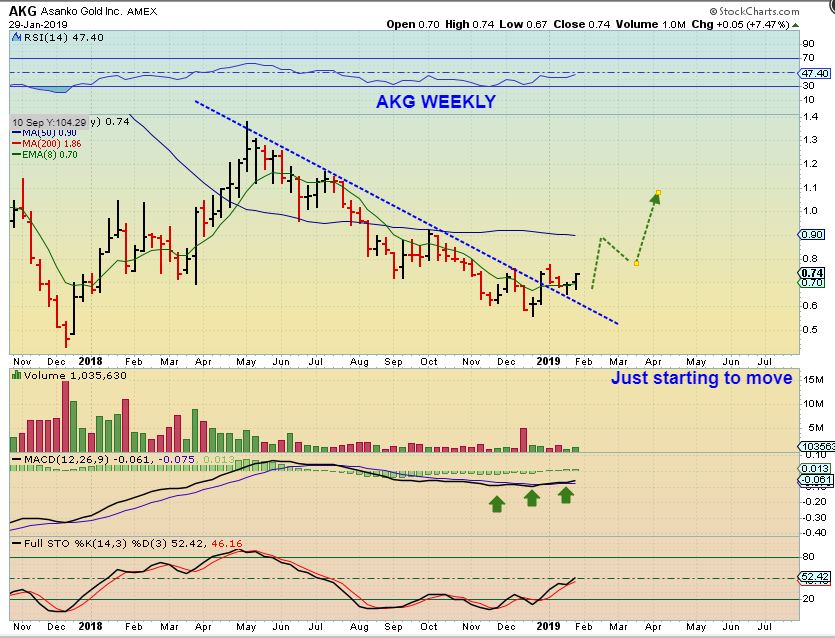
AKG WEEKLY – The weekly chart is set up bullishly too, with a break of the down trend and back test. This is still pretty close to the lows too. Ignore the volume, this is a weekly chart and it only has 2 days recorded for this week.
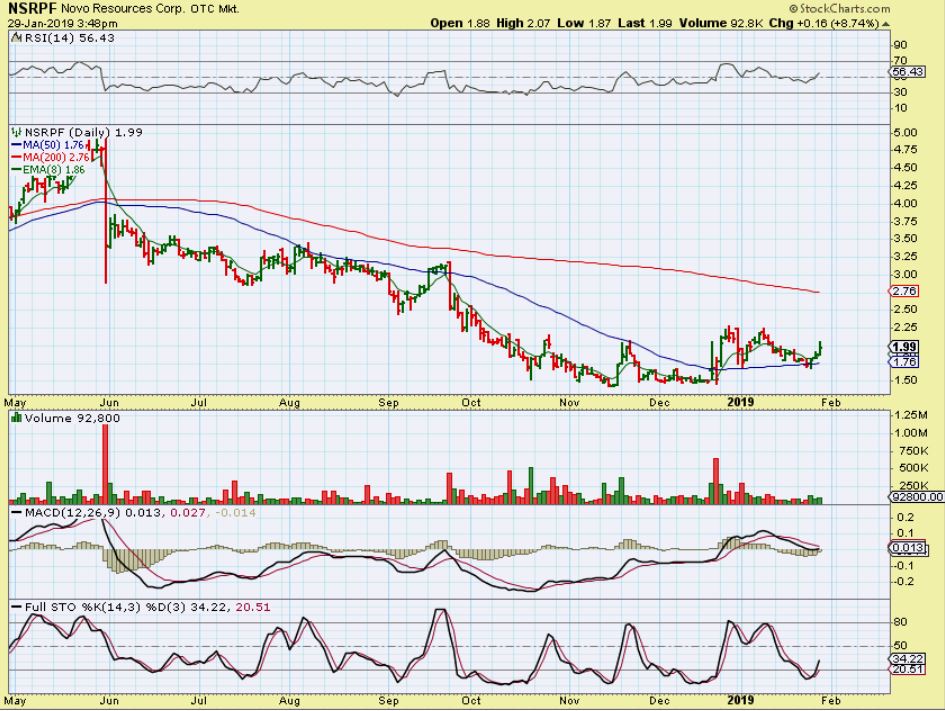
NSRPF – I like NSRPF right off of the 50sma and climbing out of a 3 month base. The best part? This tiny move seen Tuesday was over 7%, so when it gets running, you can see that the gains will be good.
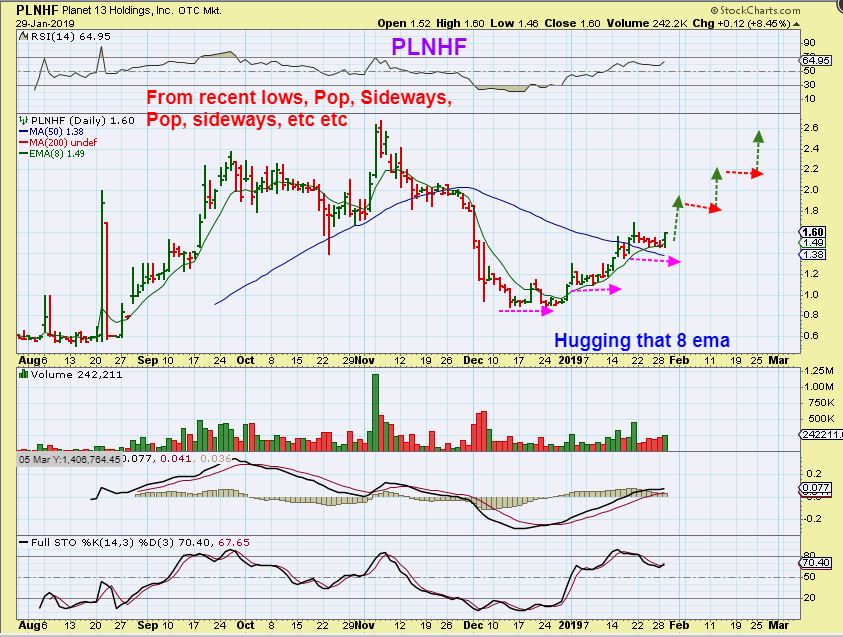
PLNHF – This small run was 80 cents to $1.60 … Oh, wait, that ‘s 100% gain in just a month. It crawled above the 50sma a week ago, and looks ready to just continue this stair-step higher. This has been a steady climb along the 8 ema.
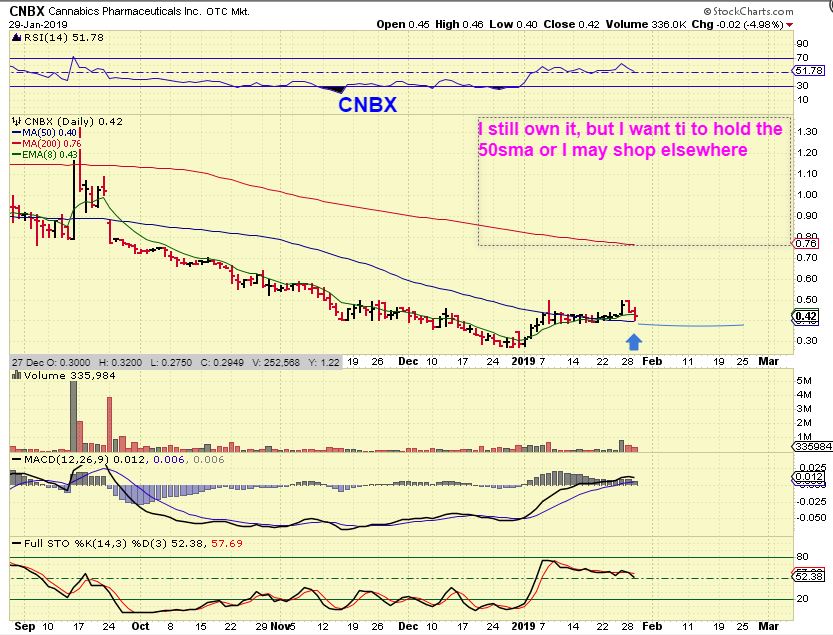
CNBX – Read the chart
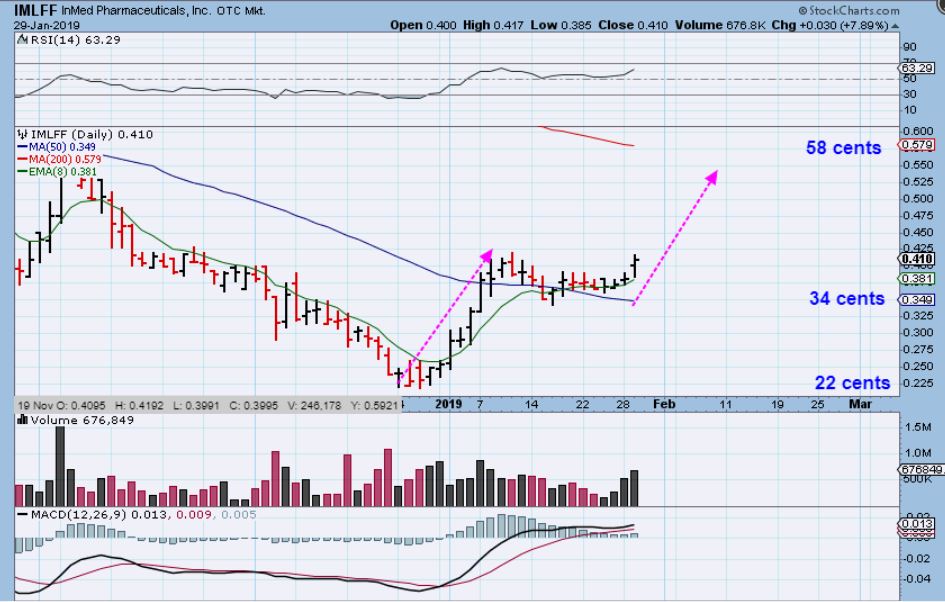
IMLFF #1 – Crawling down the 50sma, IMLFF looks like it has started running. As a penny stock, is it really worth it though?
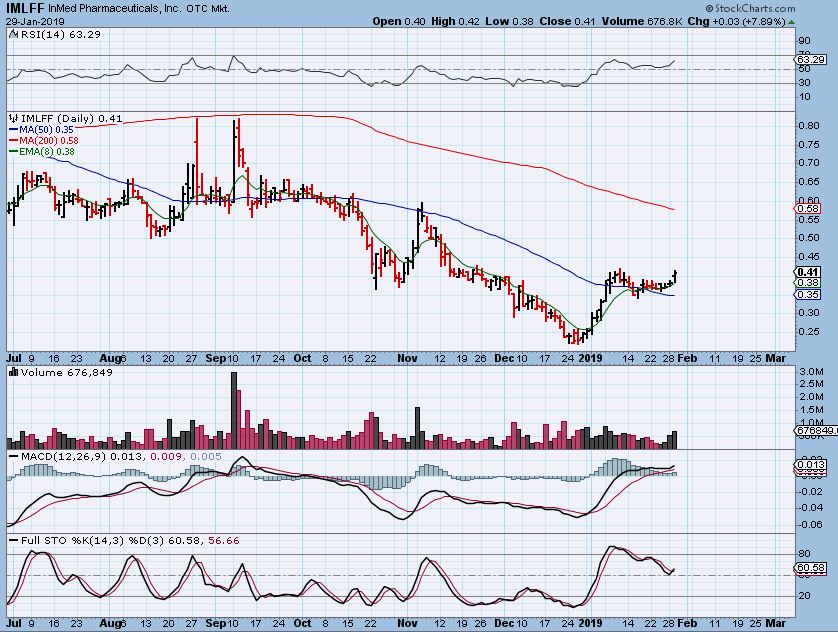
IMLFF – Yes. It just ran from 22 cents to 43 cents ( 100%) . Pulled back to 34 cents , and looks set to run to 58 cents or more. Yes these are penny stocks, but when the buyers step in, they run swiftly.