
The January 26 Big Picture Weekend Report
We had another very active week of trading, and opportunities were wide ranged for traders and the short term Buy & Hold investors alike. Trading has been excellent and profitable for weeks now. Let’s take a look at The Markets and future expectation…
.
SPX WEEKLY – The run out of the December ICL has been a sharp rally with a slight pause this week. It should continue to the 50 weekly ma (Blue line) over time. 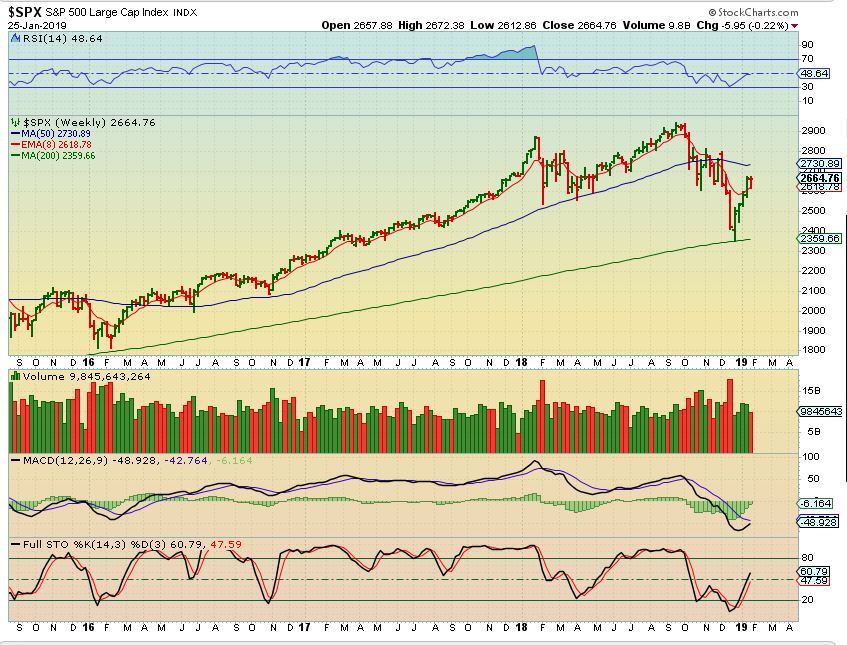
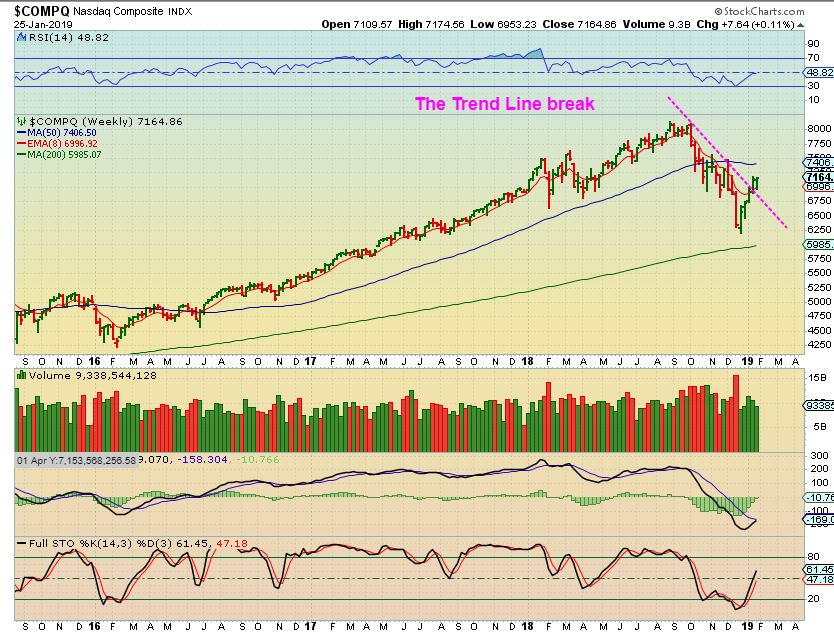
NASDAQ – The first 2 daily cycles, maybe the 3rd, will help us to see if this is a bear market ‘short covering rally that sucks in the bulls and eventually rolls over’ , or is it a real recovery. We may see this forms a H&S with just a ‘back test of the break down for example.
So with the General Markets, they are a BUY and HOLD out of the ICL, and the type of markets that we have will become clearer 2 or 3 months into 2019. The Big Picture unfolds with many variables contributing to it. It will be helpful to see ‘earnings reports’, individual stocks performances, the slow down in Chinas affect on US companies, The FED & Rate Hike expectations, etc. DAILY CYCLES will unfold and we’ll see how they play out. For now it has been a good trading environment. I will touch on this a bit more at the bottom of the report later.
.
WTIC – Oil had a brutal sell off from October to December too, and it is also rebounding sharply out of the ICL. This week it paused but held above the 200 weekly ma, after falling slightly early in the week. As you know, Oil has held up very well, Oil Stocks had some short term trouble…
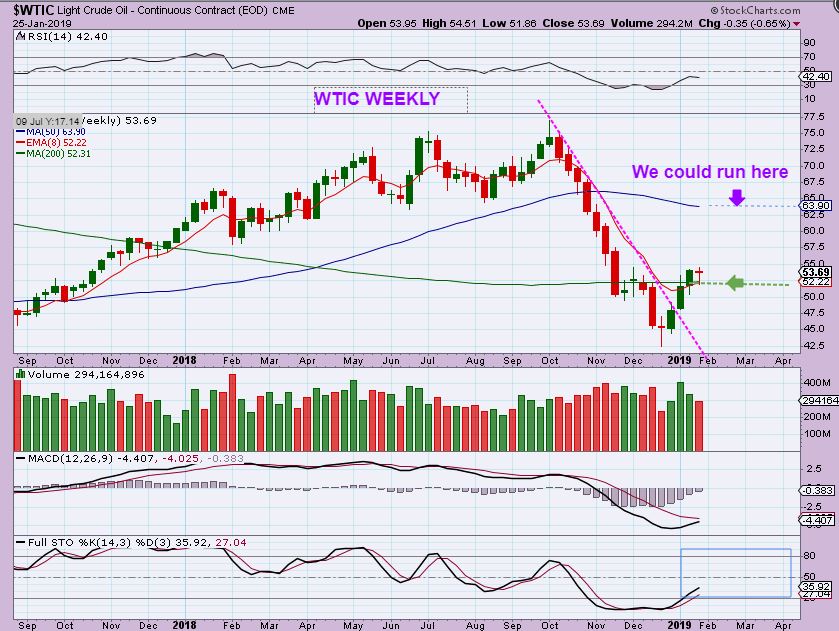
As you know, Oil has held up very well, Oil Stocks had some short term trouble. Let’s review what has transpired here.
.
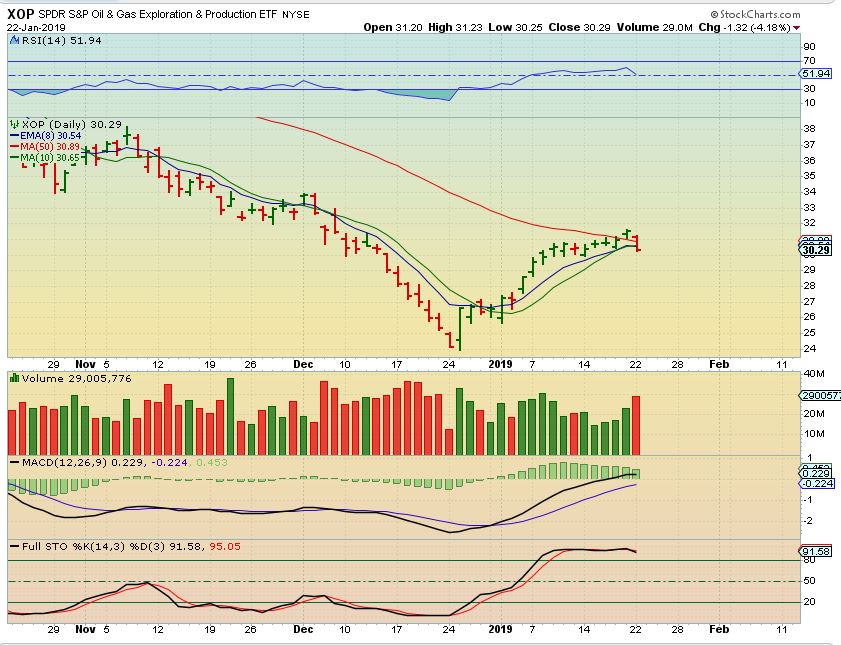
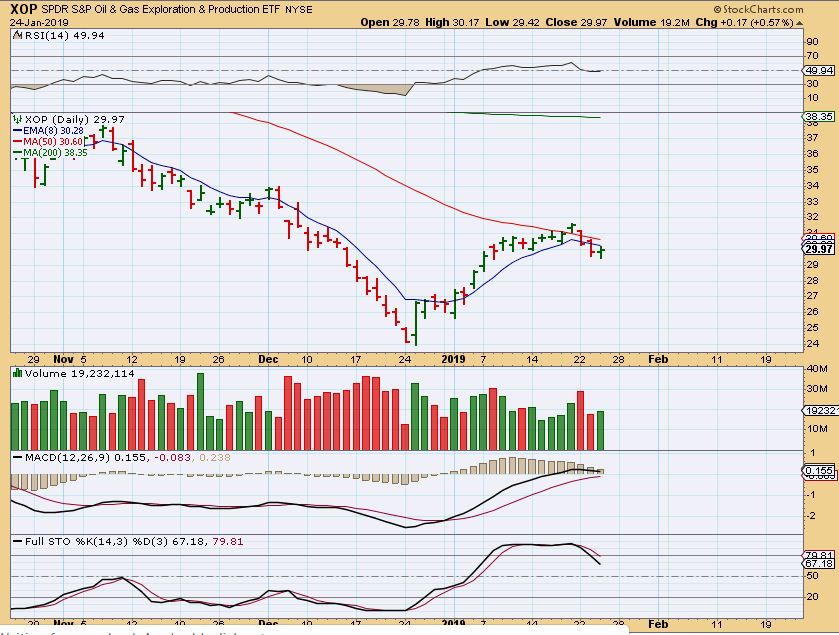
#1 -XOP TUESDAY JAN 22 – Oil was acting fine, but suddenly the XOP & OIL STOCKS like OAS, WPX, BTE, etc started to break down. This concerned me, since it looked like a rejection at the 50sma, and closed below the 8 ema too, on high volume.
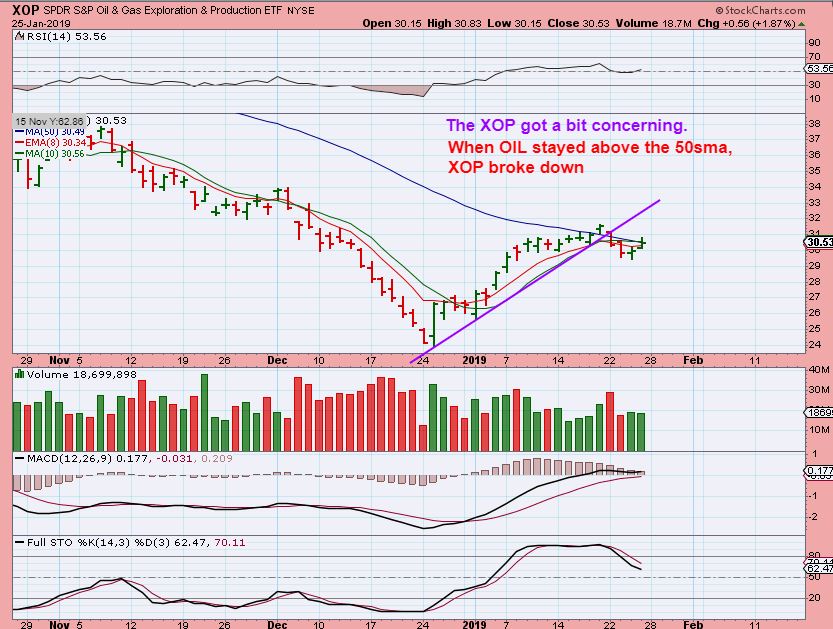
#2 -XOP THURSDAY JAN 24- For 2 days it dropped while Oil acted fine, so I recommended tightening stops or exit positions until it got clearer. On the 3rd day of the drop, it actually closed as a reversal after the inventory report was released Thursday, so now maybe OIL was fine and the XOP, OIH, and XLE would recover?
#3 XOP FRIDAY – This is starting to recover, and there is good news to follow…
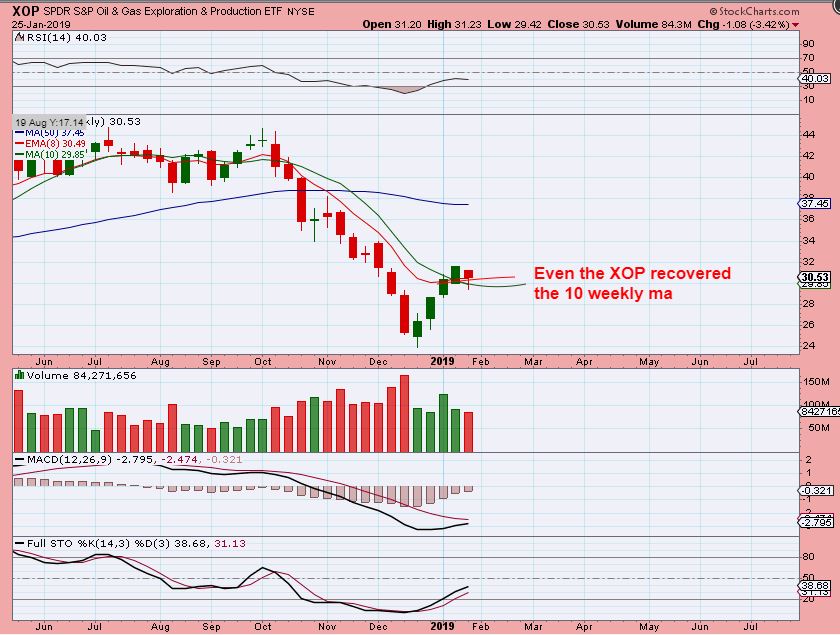
XOP WEEKLY – The XOP regained the weekly 10 ma, and that is Bullish. It remains oversold on a weekly, and there is even more good news…
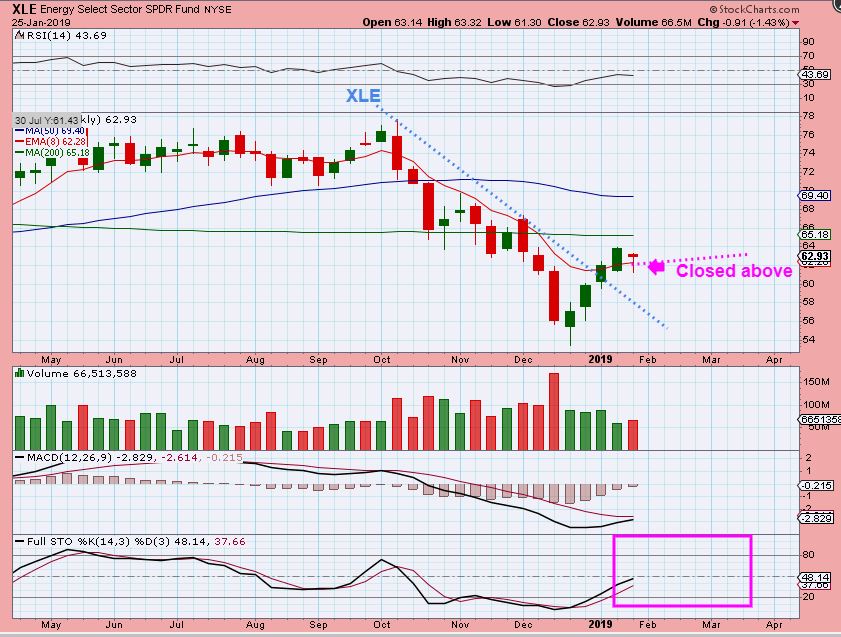
XLE WEEKLY – By the end of the week, the XLE looked really good again, is still near oversold and there is even more good news…
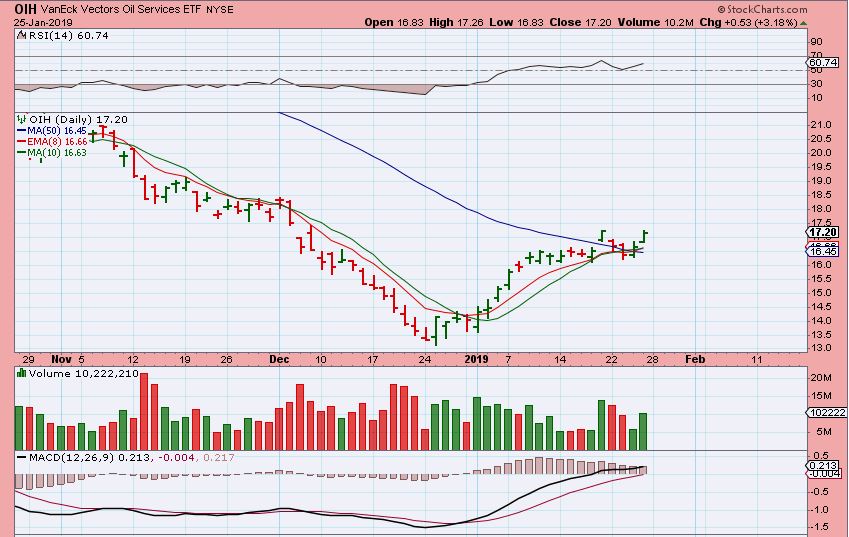
OIH DAILY – The OIH seems to be leading the way, and looks very Bullish again. Yes, this gives us even MORE good news in the next chart…
GUSH NOW – GUSH follows the XOP, which is the slowest to recover, so if you sold GUSH on the break down to lock in gains, you can now assume that the XOP & GUSH are going to follow XLE & OIH, and Buy back right where you left off, expecting a push higher again. That is good news. 🙂
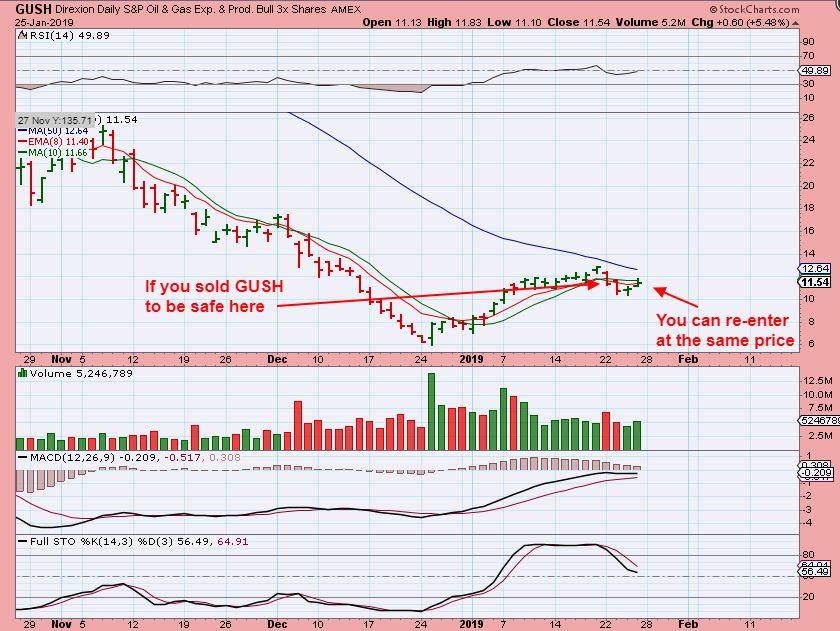
AS A SIDENOTE: I will say this, however, WLL recovered nicely and looks good. OAS, WPX, LPI still need to recover, so some may think it is best to wait for GUSH to regain the 50sma. That is fine. Either way, have a stop in place and this is a low risk entry.
.
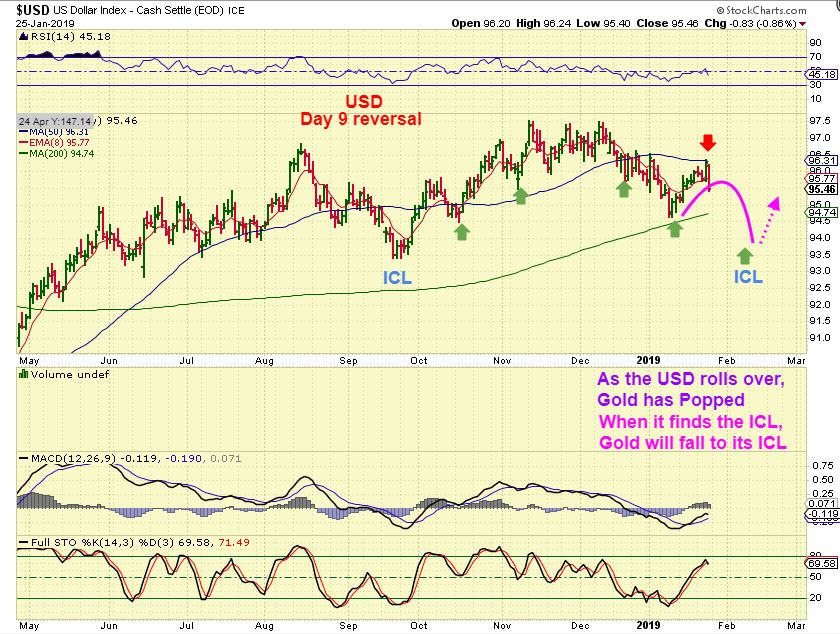
USD – The USD reversed sharply down at the day 9 tag of the 50sma. This looks like it wants to drop to the next ICL, and GOLD popped as this dropped. Read the chart.
.
AS THE USD DROPS, I WOULD ASSUME THAT GOLD SHOULD HAVE SOME MORE UPSIDE
.
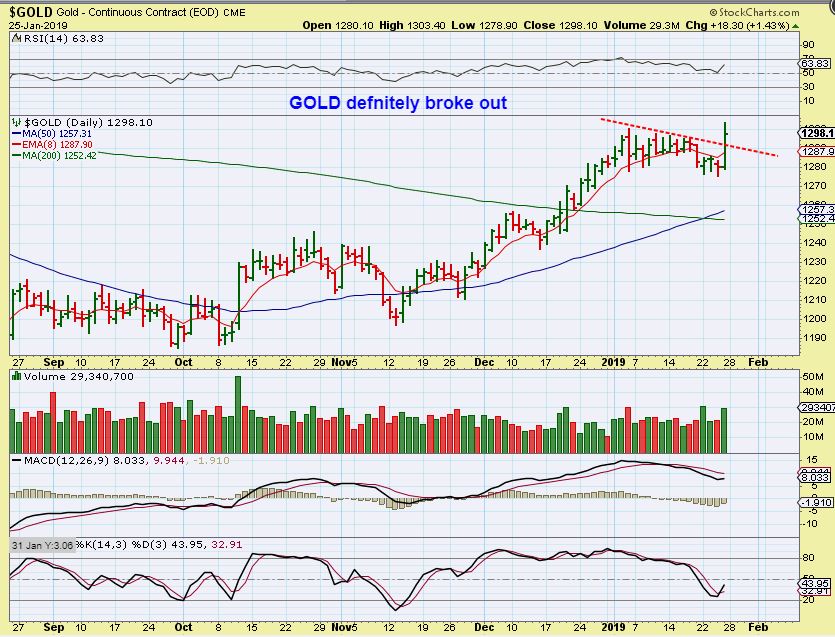
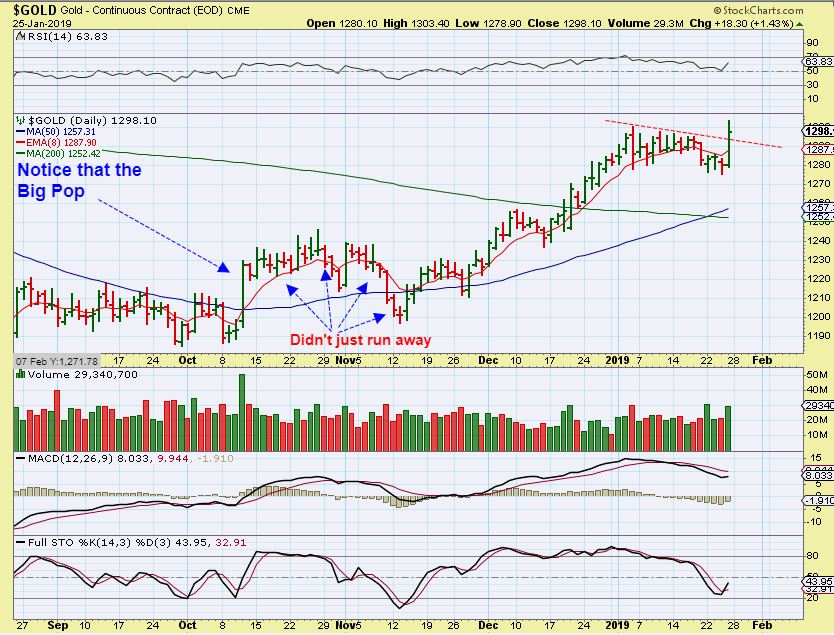
GOLD – so Gold had a very strong break higher, and put in a high DCL. Everyone is excited about Gold, and the Big Picture for GOLD is really pretty, but let’s dissect what we have here, and look at the possibilities …
GOLD – It should be mentioned that all BIG POPS in GOLD do not rally forever, they can roll over too, see the chart.
1. Yes, this can be viewed as a dcl buy, with the USD dropping, it may run higher for a couple of weeks, and …
2. We have seen individual miners ‘do their own bullish thing’ (KL, AU, AEM, etc), that may continue even if GOLD dips later. Keep in mind that…
3. Note: We should be coming due time-wise for a drop to an ICL , so
4. Use stops, maybe raise stops as it plays out, we’ll discuss this further since there are pros and cons.
5. Read the chart, not all POPS run straight up…
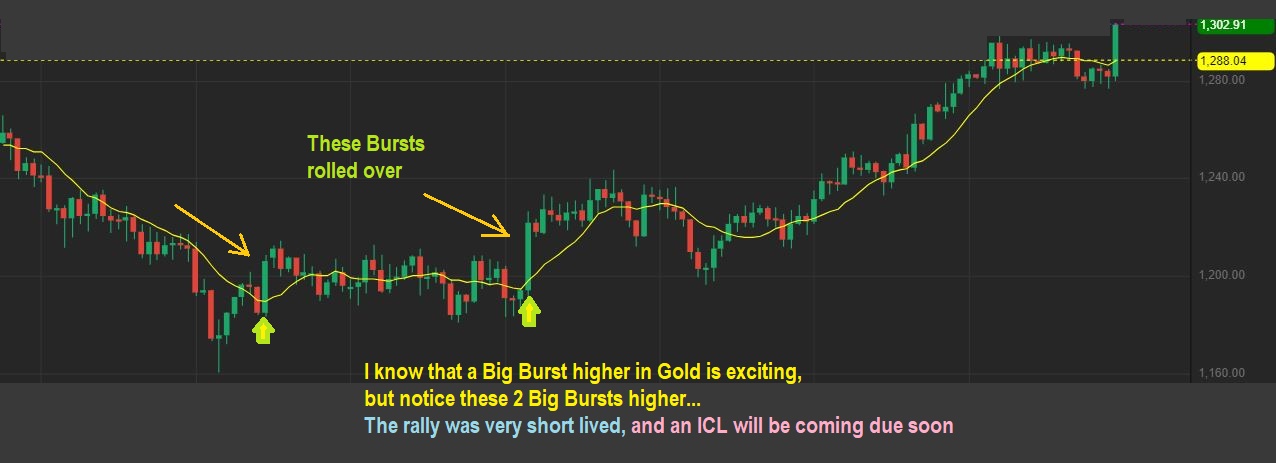
GOLD BURSTS – Visuals are always helpful, right? How long was the rally out of these recent GOLD BURSTS. Read the chart.
.
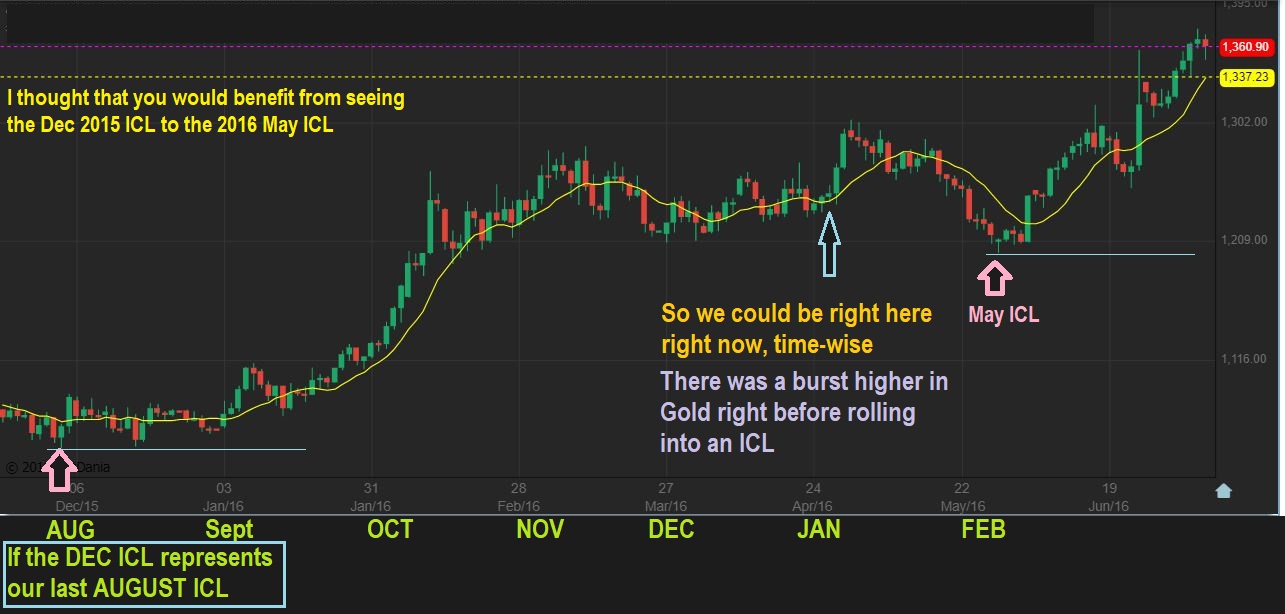
GOLD 2016 ICL compared to now ‘time-wise’ – THIS IS THE 2016 RALLY, ICL TO ICL.
The Dec 2015 ICL in Gold to the MAY 2016 ICL was 6 months. If we match the DEC 2015 ICL with our current AUG 2018 ICL and move forward month by month, this chart shows us to be at a point 5 months later where GOLD burst higher & then slowly dropped into an ICL. I found that Interesting and wanted to share that here. Read this chart.
.
This is the same chart. Look at the Strong rally out of that next ICL. That next ICL popped on day 4 and signaled “ALL ABOARD” as it broke the 10 sma. Our next ICL will be an ‘All Aboard’ entry too.
.
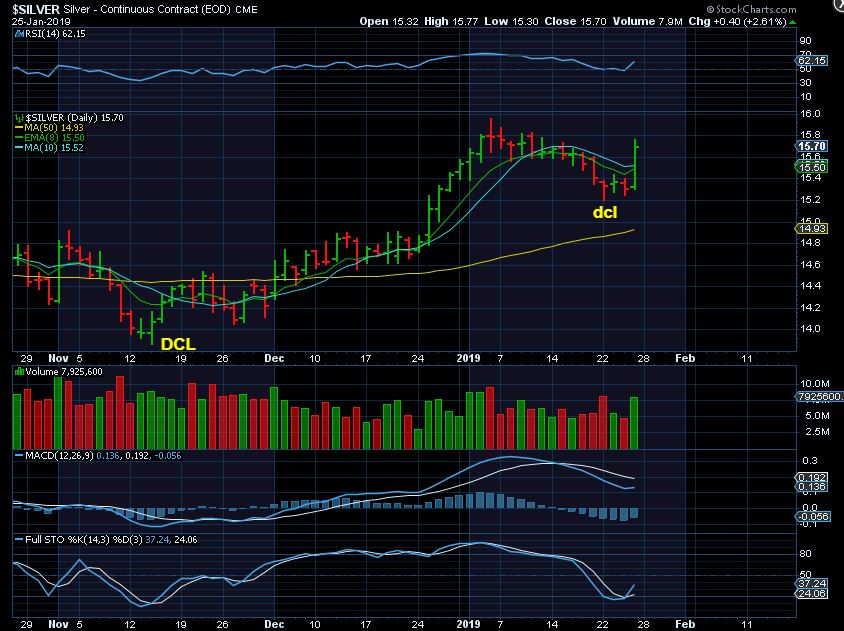
SILVER DAILY – Silver actually sold off this week, but Friday changed everything. Breaking below the 10sma and breaking the trend line was a daily cycle decline. Breaking above puts us on day 3 of a new daily cycle.
SILVER WEEKLY – Even with 3 weeks of selling, the final week reversed Friday and this actually acted perfectly Bullish on the weekly chart. A ‘Guess’ would be that we tag the Green 200ma, and slowly roll over to an ICL. One thing to note however, is that SILVER didn’t bottom in AUG when GOLD DID. That may be important. It may do its own thing here too. In fact…
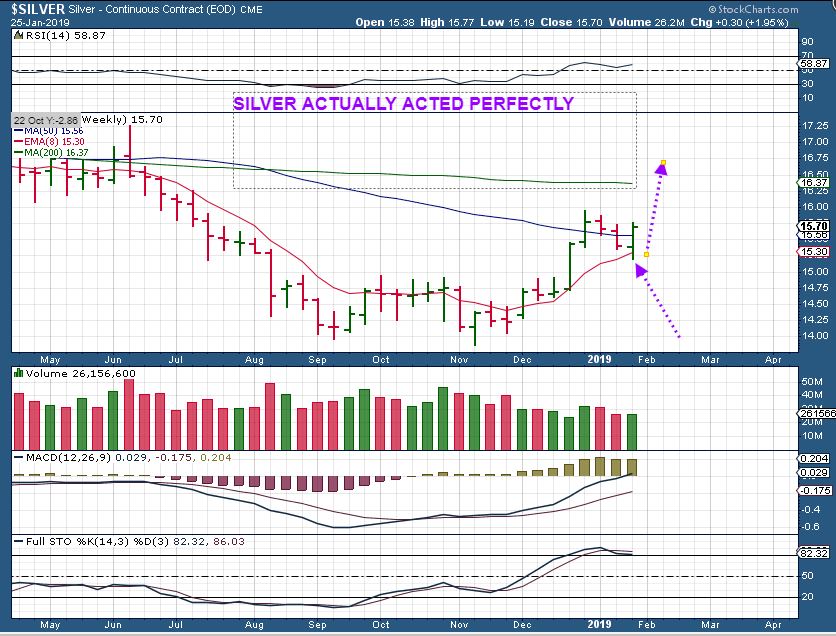
SAME CHART: One thing to note however, is that SILVER didn’t bottom in AUG when GOLD DID, and also, take a look at SILVER in November. Is that a new low? Did Silver ICL in November? Does that matter? It MIGHT mean that Silver IS doing its own thing, and may lead the way higher as Gold drops sideways into an ICL. We may have a mixed set up, so keep that in mind. This Weekly Silver chart looks gorgeous to me.
Same Chart Again – In technical analysis, this weekly reversal on the 10 ma, cutting back above the 50 week ma, is flat out a screaming buy reversal. Cycle timing aside, this is a Technical Big Picture buy and Silver stocks may take off next week.
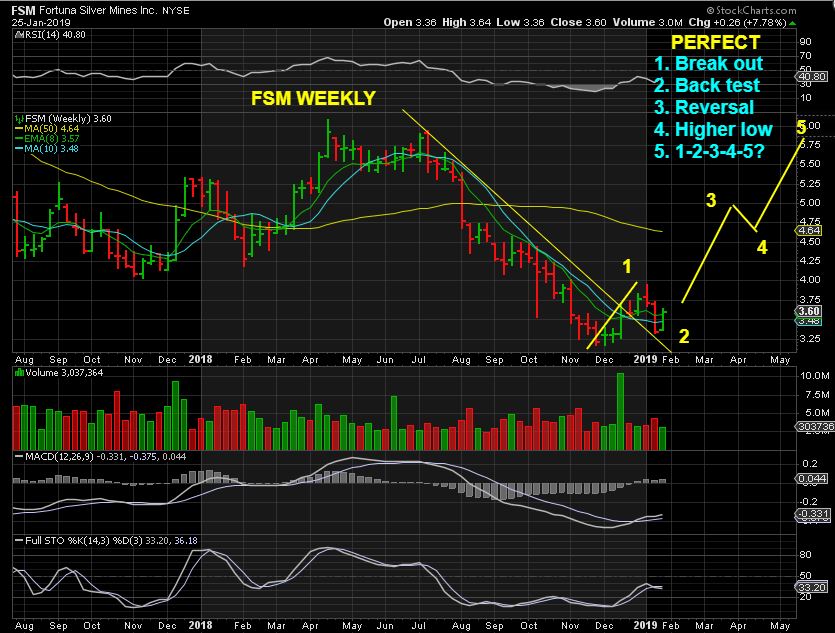
I bought MAG & AUMN based on their weekly charts. MANY silver stocks are still near the lows, but the weekly charts look ready to move higher. I’ll give FSM as an example: A perfect back test & reversal.
.
So Silver MIGHT be marching to its own bullish drummer from here. Only Time will tell, but the charts looks bullish.
.
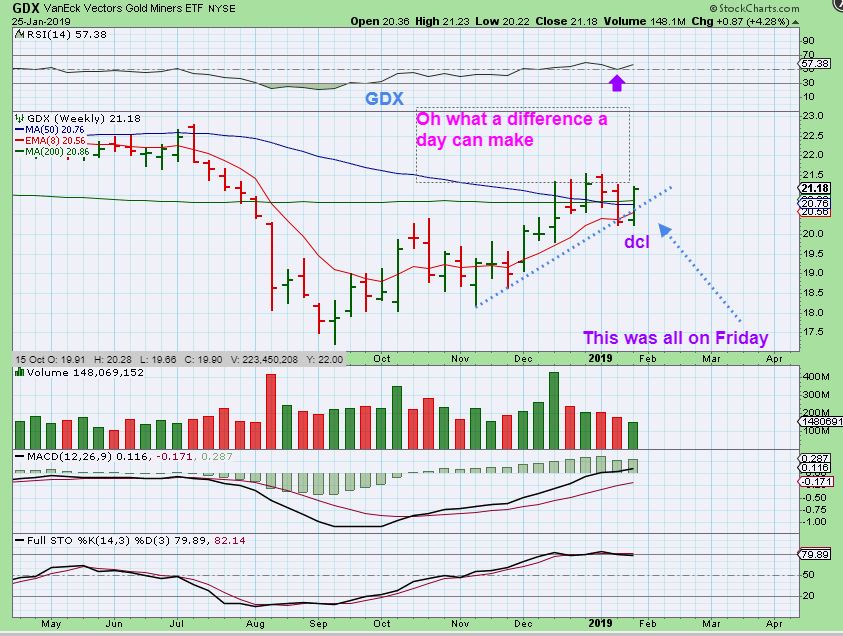
GDX – GDX exploded higher over the 200 sma and looks very bullish. You can buy Miners as a dcl, but what should we keep in mind? Similar to Gold…
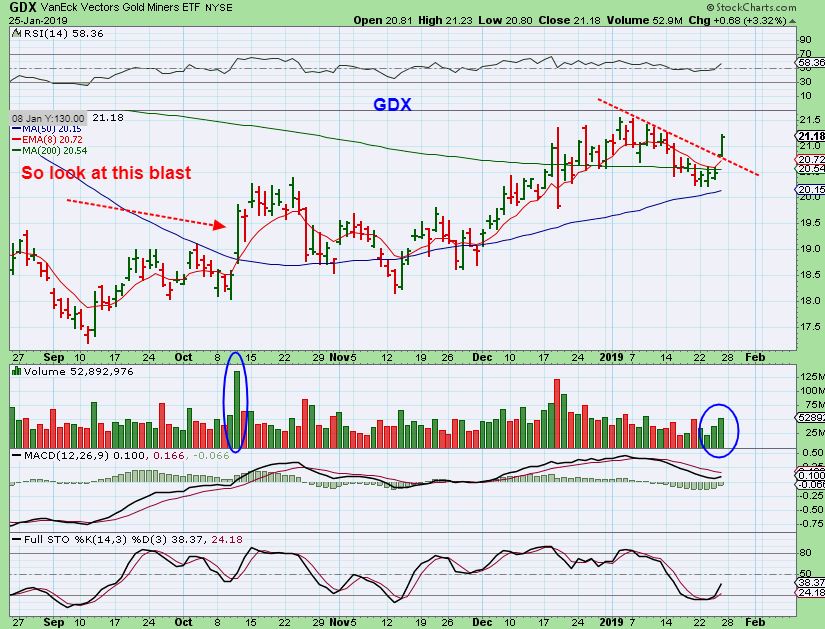
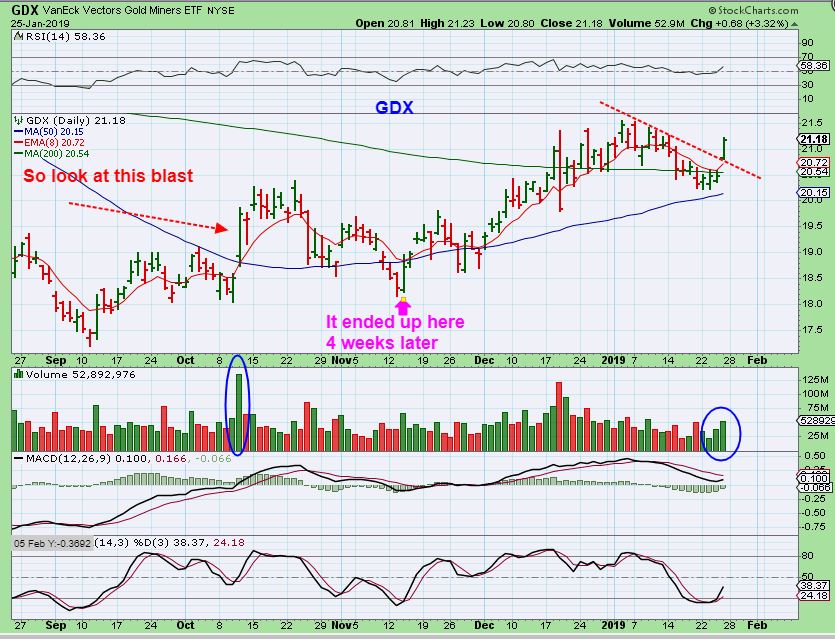
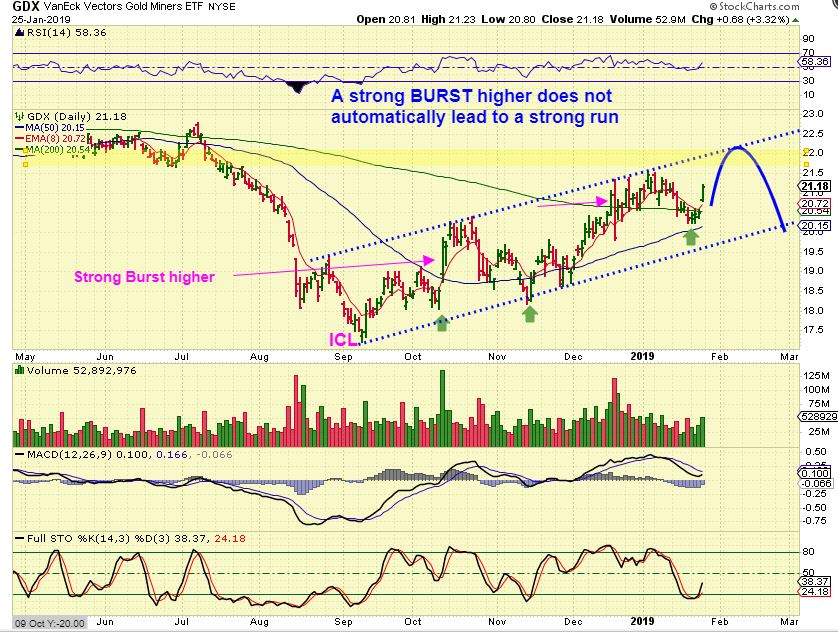
GDX- We have seen A big Burst higher eventually roll over, right? we also now have a GDX & a GDXJ Gap. This is just something to keep in mind. After months of sideways chop, the last daily cycle suddenly rallied strongly, so I can’t say that this one will not do that too. I just need to show the caution points for those that always jump into leverage.
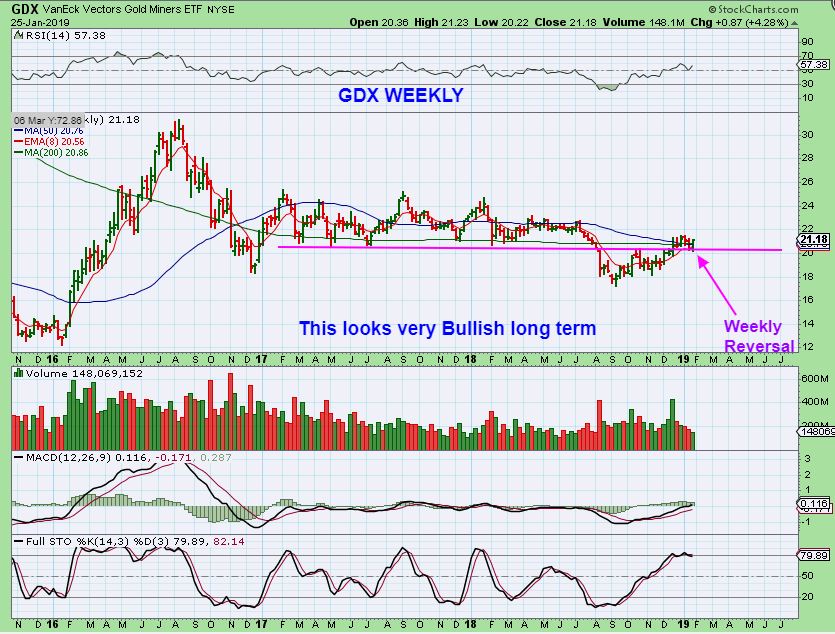
GDX WEEKLY – With fridays burst higher, the GDX Weekly chart suddenly looks very Bullish. If GDX had a Sept ICL, it is 4 months into the intermediate Cycle (not 5 like Gold), so maybe it will just run higher. Let’s zoom out…
GDX WEEKLY BULLISH – That weekly reversal gives us the Bullish set up again of a shake out & recovery. It simply went sideways on support since recovering. we now have 5-6 weeks of sideways in GDX, it did not sell off much. The Big Picture chart here looks very Bullish to me, closing back above the weekly 10, 50, & 200 ma. When this takes off higher, YOU WANT TO BE IN IT.
GDX Daily again– So if that GDX Weekly chart above looks so bullish, yet we are thinking that GOLD gets an ICL drop, it may just be a high ICL, but it should slightly break this dcl. More sideways action for the GDX Weekly chart? Then it may rocket ship launch out of here.
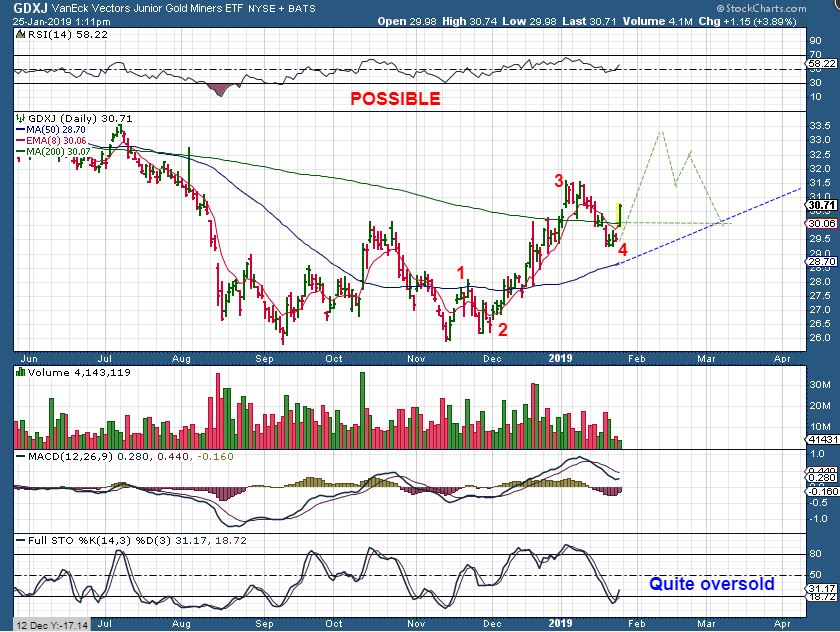
GDXJ- I posted this in the comments Friday, to say that Buying here as a dcl is ok, though we may drop later. This just gives you an idea of how a drop later may be mild-ish, a correction after wave 5 up. Why Buy it? I think the Silver stocks may run for one thing. Also IF some of these Miners just rocket launch higher on their own, like we saw AU, KL, etc- you can buy now and hope for the best, but prepare for the possible dip.
.
So trading has been excellent for the past few weeks in many sectors, and it doesn’t look to be ending any time soon. There will be pauses along the way, and pull backs are normal in up trends too, but at this point things look to be set up bullishly in many sectors. I am covering a few extra thoughts, including the still Bullish MJ ETF, below. I’m also taking an interesting look at JNUG 2016, since I think that we can all benefit from a few reminders. Please check out the bonus info below after I sign off.
.
Enjoy the rest of your weekend!
.
~ALEX
.
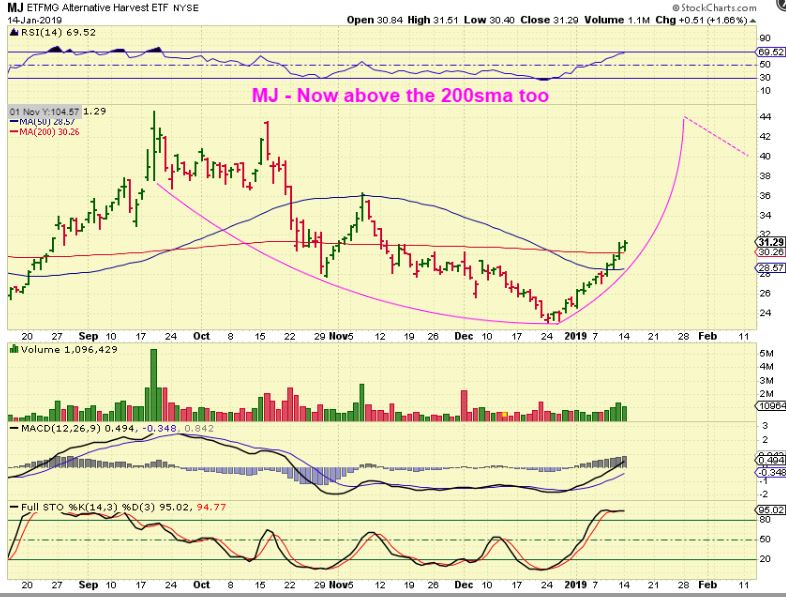
MJ ETF – I have been saying that I think this current run is a real run in the MJ sector, and not a small rally like we occasionally get (see November) .
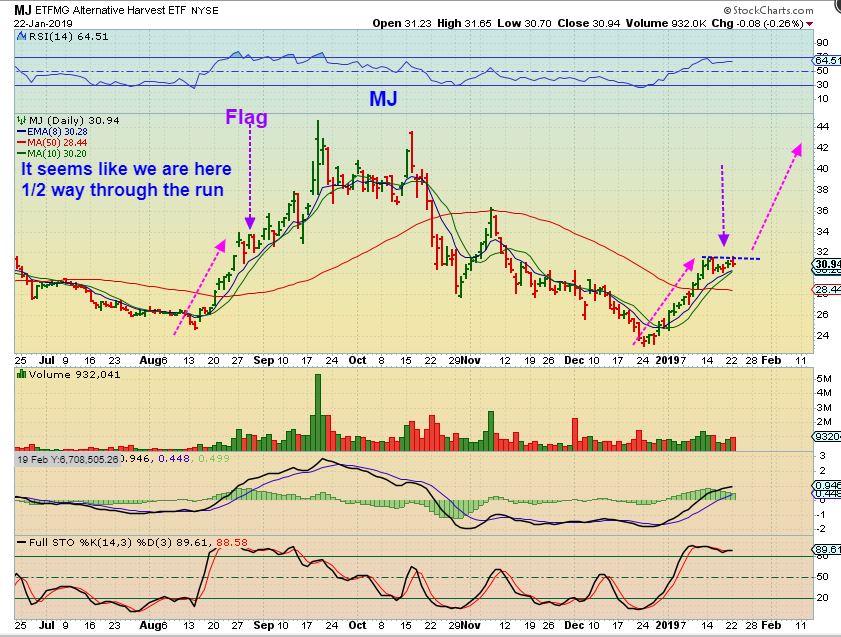
MJ ETF – I drew this 1/2 way pennant / flag to show how this occurred in the strong August run too. I expect a break out higher, and the stocks have been acting Bullishly.
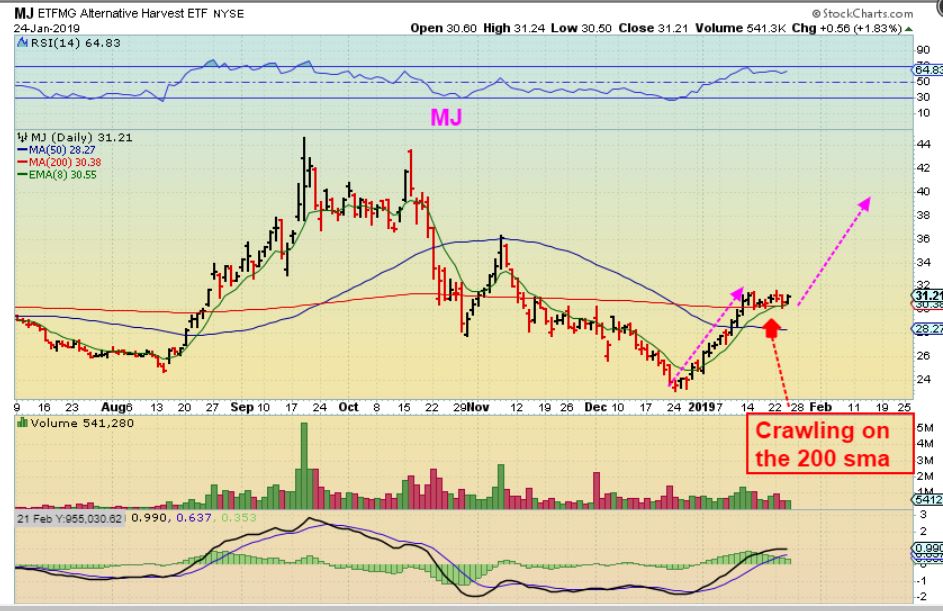
MJ ETF – And again, Crawling along the TOP of the 200 sma should be considered Bullish and also a low risk buy with a stop under that area. This trades on the NYSE, so many may be able to participate.
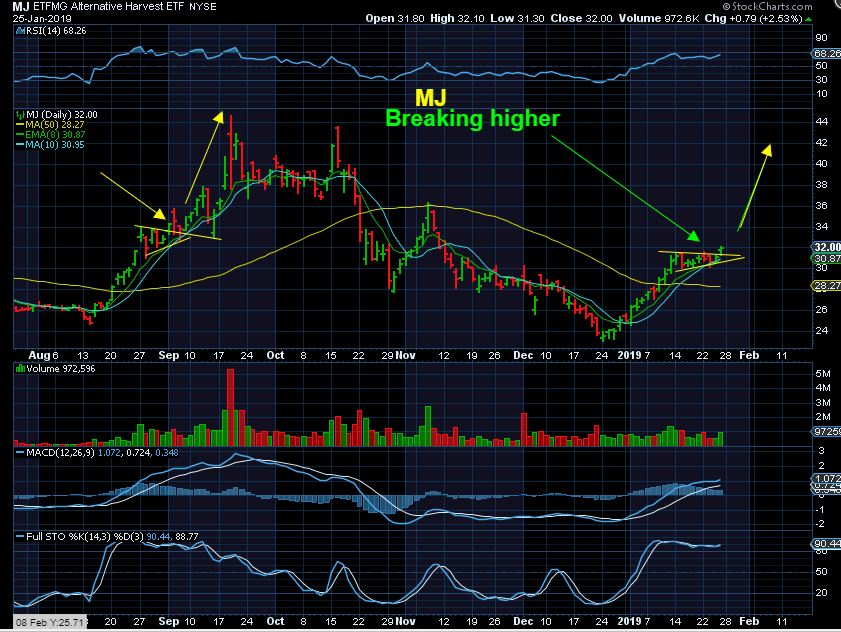
MJ ETF – And now I am seeing the start of a break out as of Friday. A run from the flag at $30 to, lets say $44 again, is about a 50% gain. Lets say someone wants to try this trade and use a stop under the flag. They throw $1000 on it, and may walk away with $1500 in a month. You can pay for a year of Chartfreak and still take your loved one to a very nice Dinner with that! 🙂
Throw $3000 on it, and maybe cash out with $4500. Throw $5000 on it, take $7500 in a month. You get the idea. Of course, there is always some sort of risk, but we see that there is a possible excellent reward, so be reasonable, position size is important, use a stop.
.
.
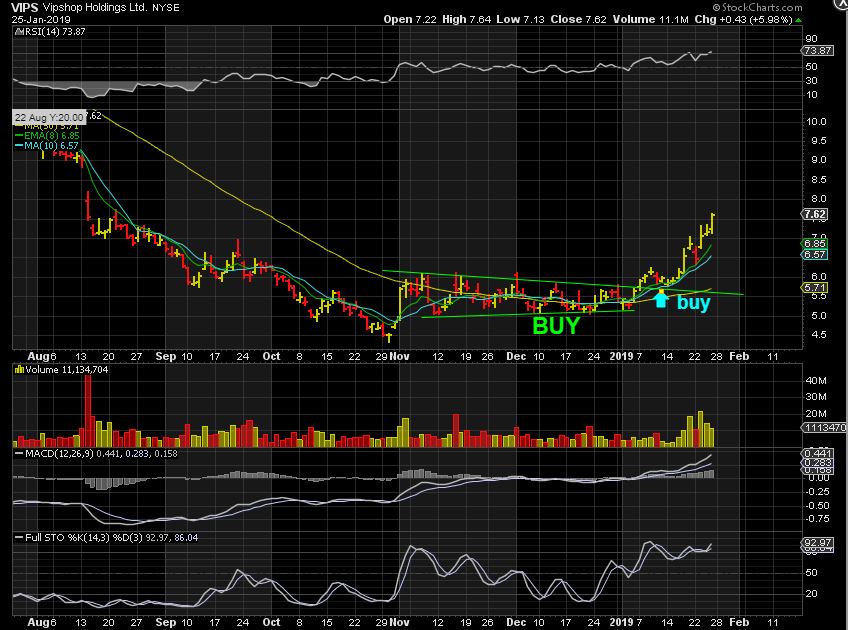
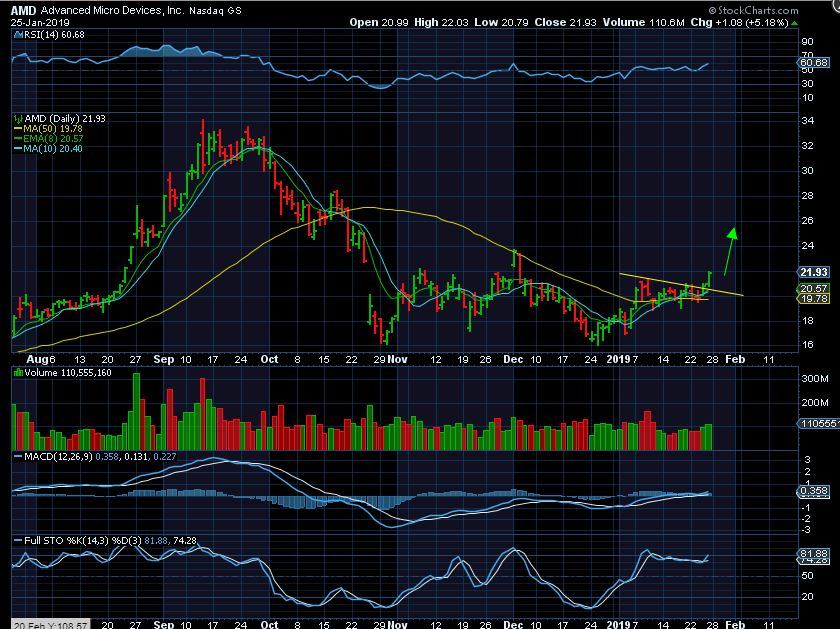
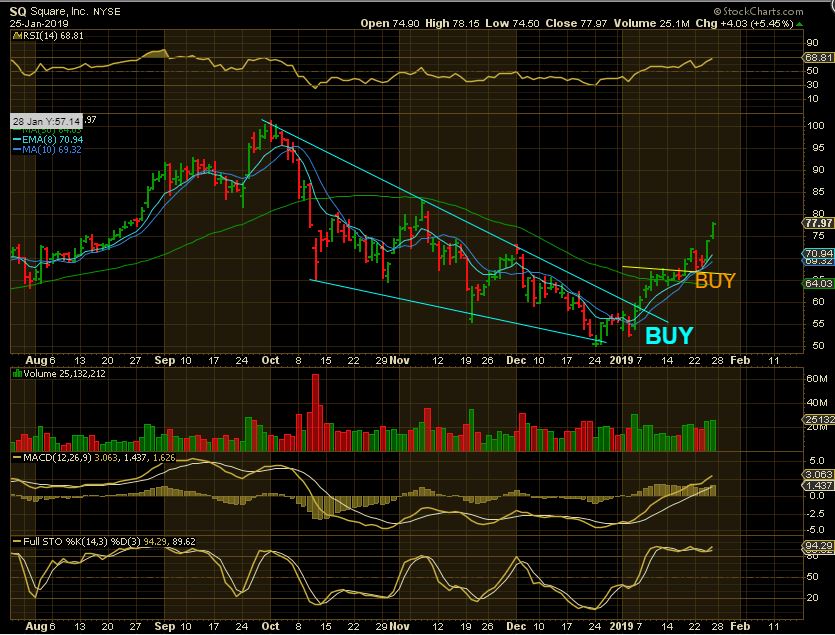
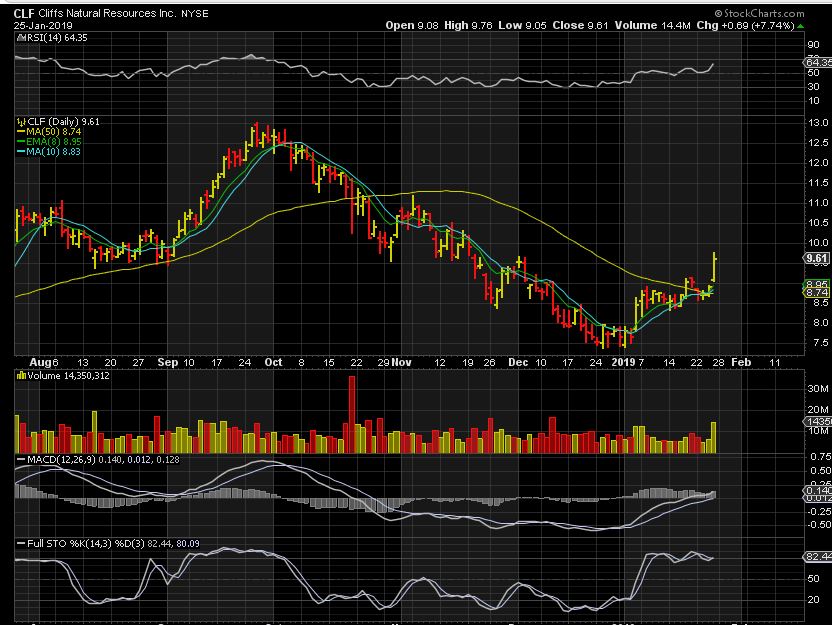
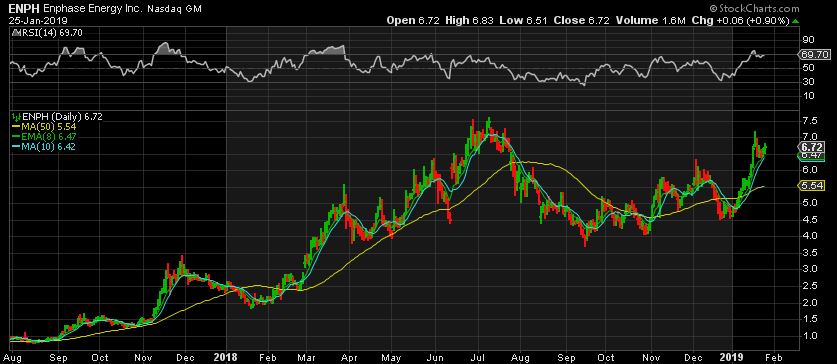
TRADING IN THE TECH SECTOR, with recommendations in VIPS, SQ, MU, AMD, etc , HAS BEEN GOOD, along with Solar stocks JKS, SOL, ENPH, etc. JKS is ramping higher and ENPH has formed a nice cup by the way . Metals CLF, AKS, X, etc, MJ Stocks ( Many are making great gains). It has been a nice environment over the past few weeks.
.
See charts of AKS, X, CLF, HBM, etc, they still look valid as bullish set ups with more upside too.
.
ENPH is an old favorite recently mentioned again. It ran straight up to form the right side of a cup and remains bullish. Bulls are not always easy to ride, as they buck the rider off, but this is a nice bullish cup forming here again.
.
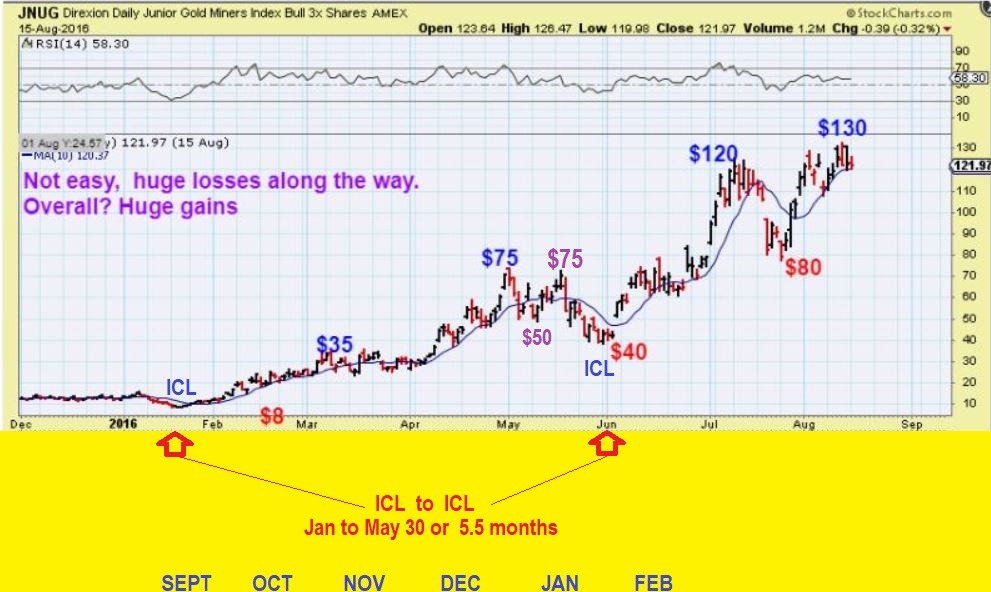
IN THIS REPORT I SHOWED YOU THE GOLD DEC 2015 to JAN 2016 ICL TO ICL RUN. I Need to show you the JNUG run, because it highlights that even in a Bull Market excellent run, JNUG can be very rewarding, but it can also cut you up if you jump in late. Let’s take a look…
.
JNUG AND THE 2016 RUN- We would currently be near the MAY ICL. JNUGs final drop went from $75 to $40 in 7 days. WOW, cut in half ! Yes, it is easy to say ” If you held on it then ran to $130″, but in real time, this is a gut punch that you can do without. Use stops on your leverage. Better yet, Study & Understand how JNUG & NUGT move. It also later dropped from $120 to $80 in about one week before reaching $130.
.
As you can see, there is a lot to look at and talk about in so many sectors lately, so I’ll do my best to cover them all, but obviously I won’t have time to cover ‘everything’ or ‘every bullish stock set up’ in the Nasdaq, Oil sector, MJ stocks, Metals & Miners, etc etc , but feel free to ask me questions in the live chat area if you arent sure about a sector, a stock or an ETF. You can email me too, but I sometimes only check my emails 2 times a day when I am this busy, so I apologize in advance for delayed replies.


