Jan 24th – Swim At Your Own Risk
When a Red Flag shows up on the beach, it means that for some reason, it is unsafe to swim in those waters. Well, after 3 nice weeks of gains in the Oil & Energy sector, I am still seeing a Red Flag in those waters. As mentioned in yesterdays report, Oil itself still looks fine, but it seems that some of the Oil / Energy stocks may not like the waters that they find themselves swimming in. It looks like a Red Flag to me.
Let’s take a look at our markets…
.
SPX – I mentioned that the General Markets can pull back to a 1/2 cycle low, or just go sideways along the 50sma . So far they are going sideways along the 50sma. I expect higher price …
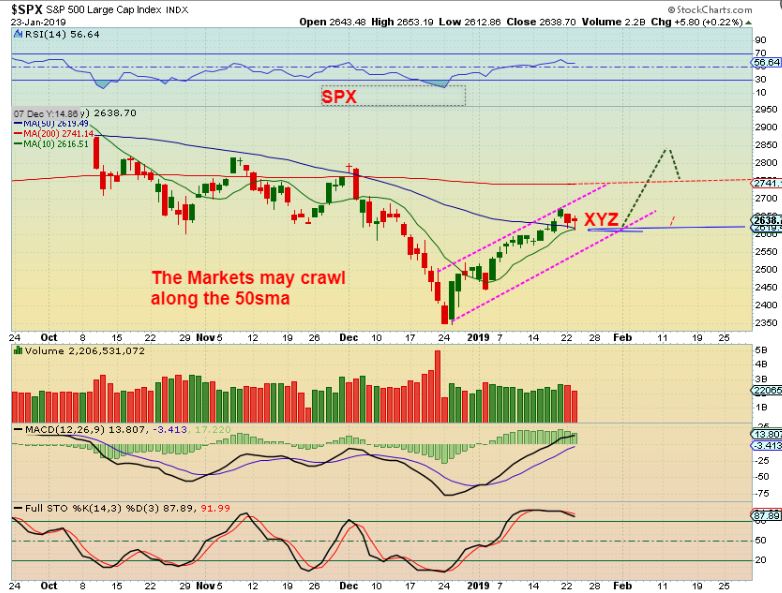
Coming out of an ICL, I would expect more upside in the General Markets after this pause.
.
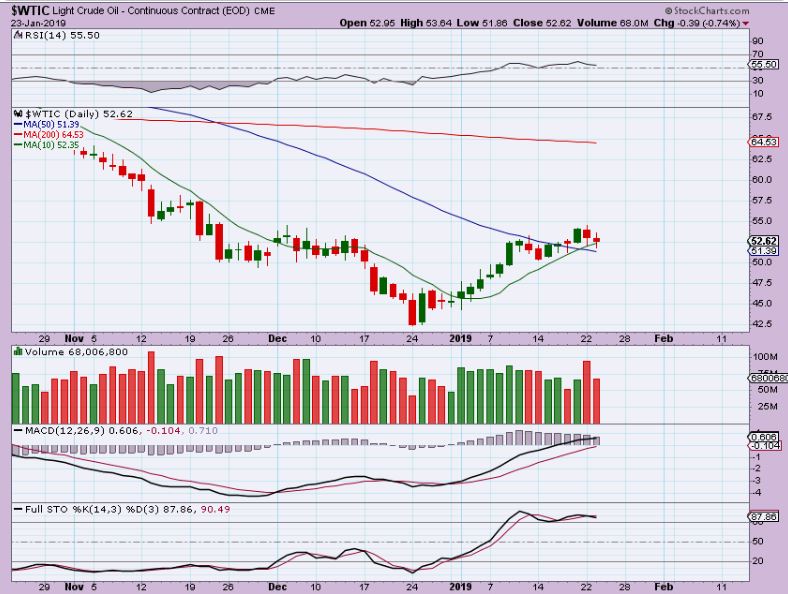
WTIC – Oil held up just fine here, but as you’ll see, it seems like the OIL / Energy Stocks are not feeling the bullishness. With a 40+ day daily cycle, I would expect higher price in Oil too, but I don’t know why the Oil Stocks are not playing along….
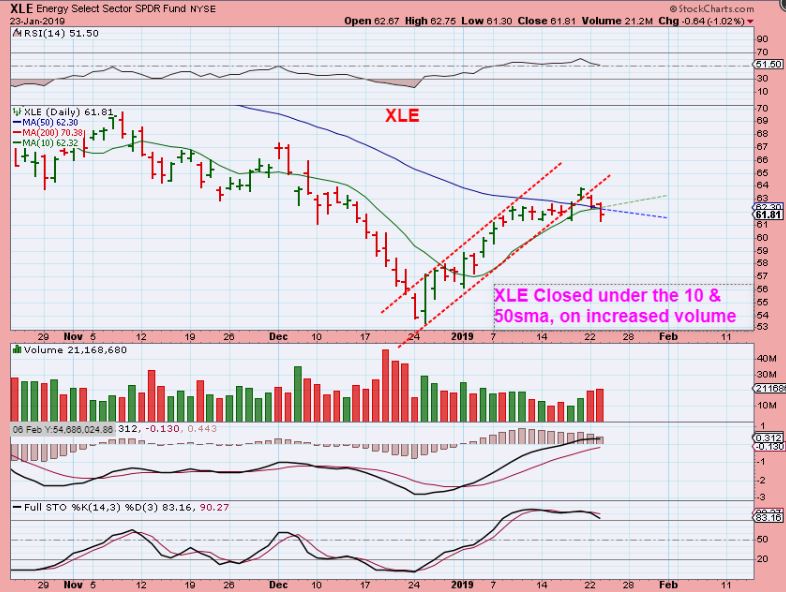
XLE – Yesterday I mentioned that XOP dropped fast along with several Energy Stocks, but the XLE & OIH held up. I wanted to see how they did on Wednesday, and here is what they did. As OIL held up, the XLE closed below the 10 & 50sma.
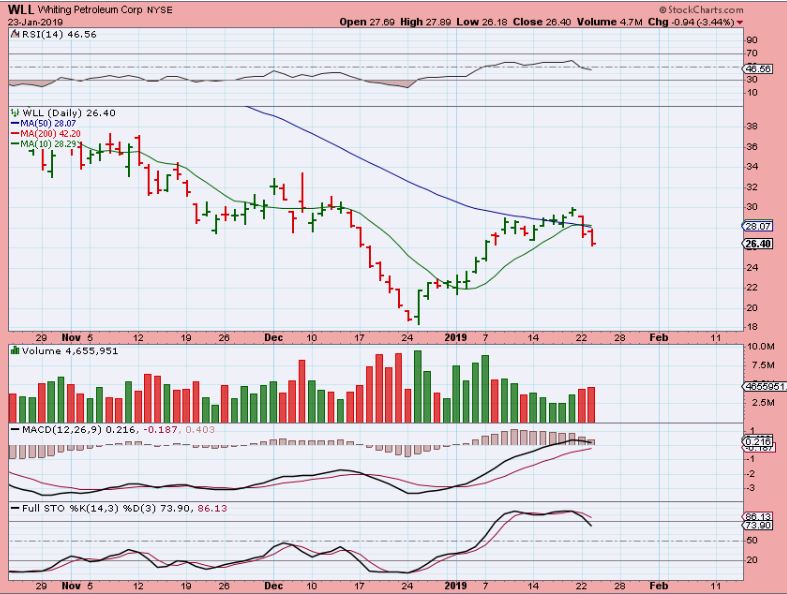
WLL – And some stocks had downside follow through, so I am cautious here.
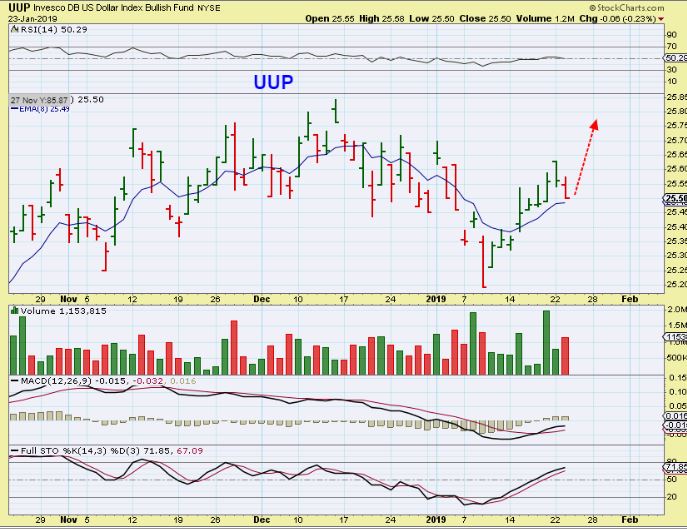
UUP – I expect the USD ( UUP here) to move higher off of the 10 sma or 8 ema, and that should push Gold down a bit more.
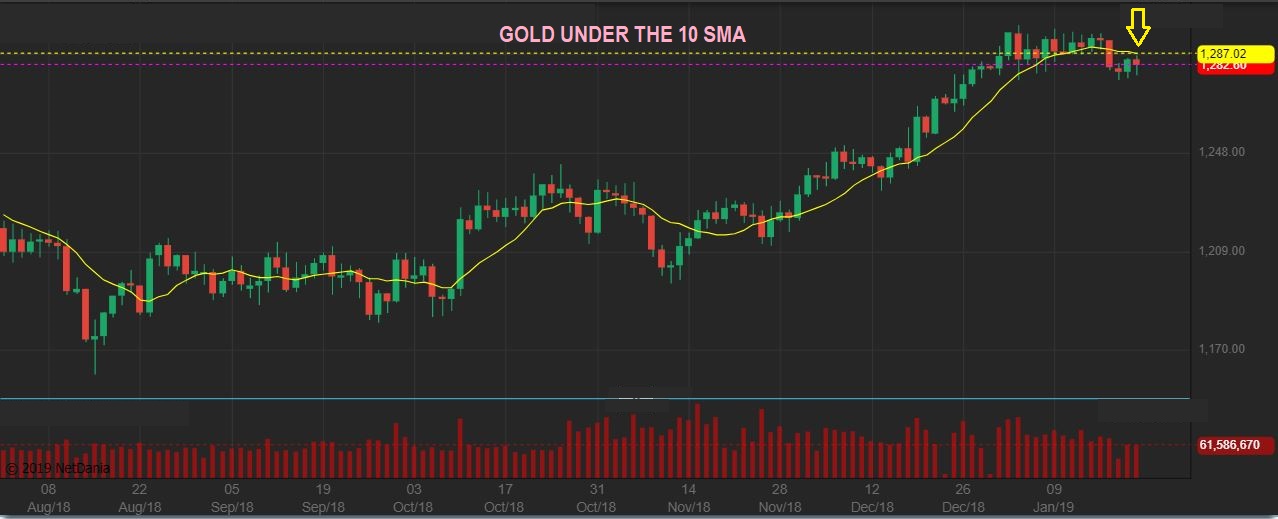
GOLD – Gold moved slightly higher , but was rejected at the 10sma so far. If Gold moves above that 10sma, it could run to new highs, leaving a vague dcl behind.
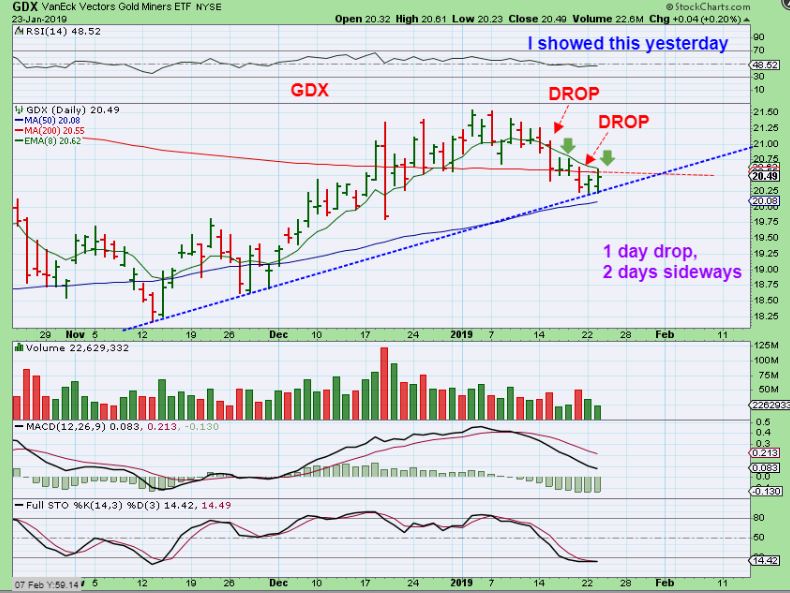
GDX #1– GDX ‘looks’ bullish at a glance, but I am expecting a dcl and it has been in decline ( a slow decline so far). At this point, Price tagged the 10sma and stayed below the 10 & 200 sma. It remains above the 50sma. If GDX breaks above the 10sma, it could be that a dcl is in place, you could buy it for a quick trade if you want, but I have to expect it to roll over into an ICL. Let’s look at another GDX chart…
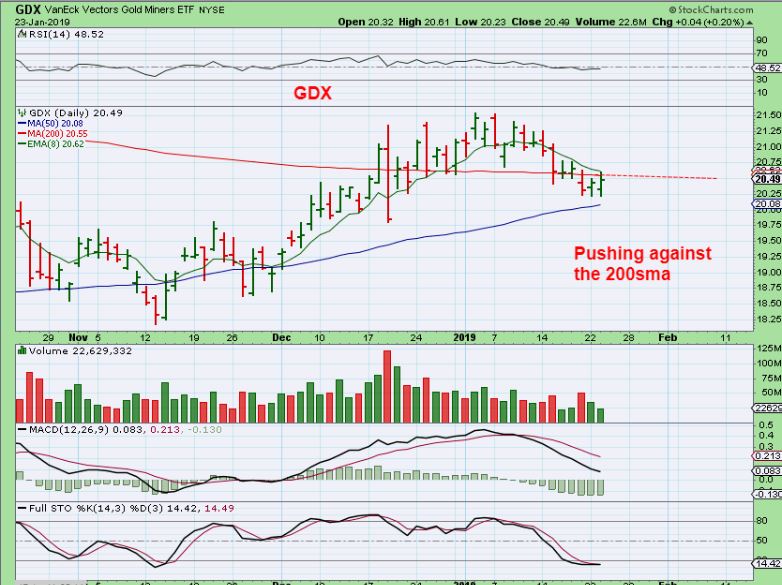
GDX #2– I am watching for 1 of 2 things
1. A continuation of this Drop, sideways to the 8 ema, Drop, sideways, and another Drop. Or…
2. A break out above the 10 sma is likely a dcl. I explained yesterday that a break higher would still probably becoming a short lived peak on a final left translated daily cycle.
.
So when we have the General Markets crawling along the 50sma, and OIL holding up while the Energy Stocks are rolling over, it is hard to recommend a trade set up. I will post a few ideas below , but so far it is the MJ Stocks that are still acting correctly, and all other trades seem to be waiting for this pause to end. Oil stocks seem a bit risky under the current set up. That said, Below I will mention a couple of trade set ups, some Tech, some MJ Stocks, and even a Miner or two. I realize that the MJ Stocks are not what everyone wants to trade, because they can move quickly, so I will try to add a few non MJ stocks. Until the direction of these sectors begins to play out, it also may just be best to watch from the sidelines for a break out higher.
.
Enjoy your Thursday trading!
.
~ALEX
.
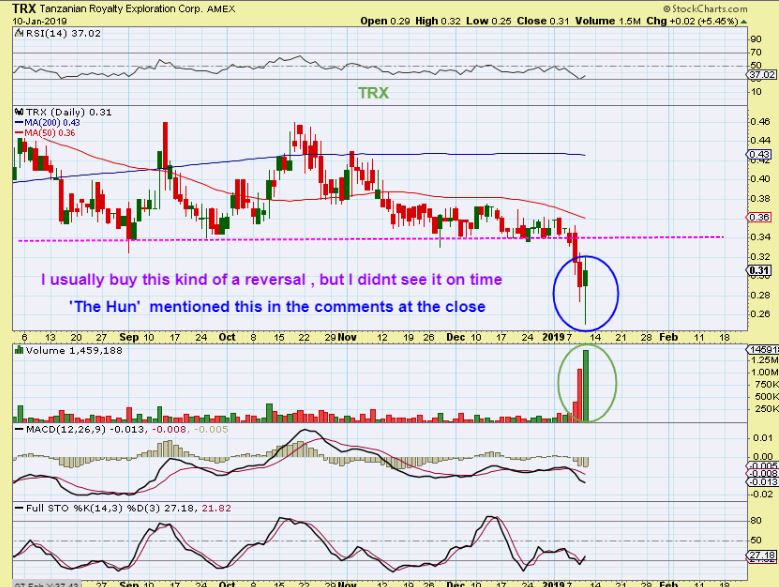
TRX – This was a strong buy, I pointed it out on Jan 10th. High volume reversals like this are capitulation lows and often they do not get taken out in the near term…
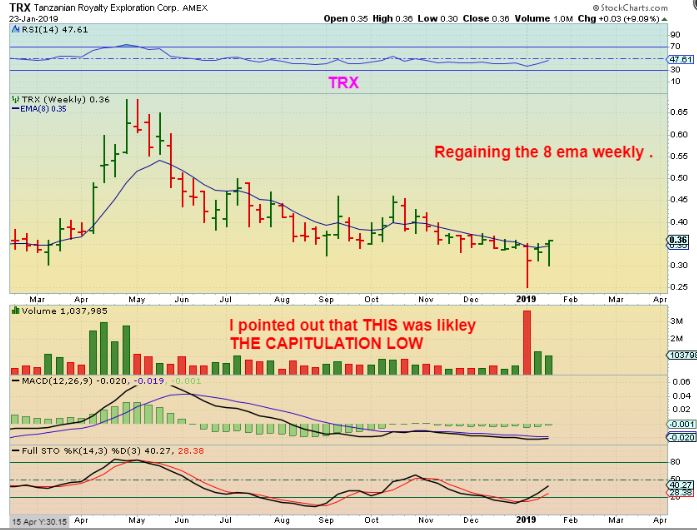
UPDATE TRX WEEKLY – This is also a buy on a weekly chart. When Gold is ready to run, this should do well, and it may even lead the way here.
.
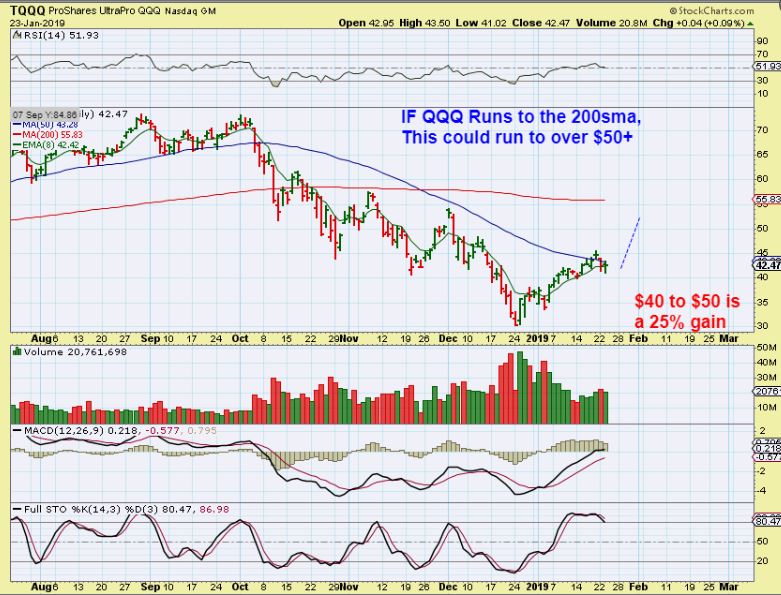
BY REQUEST- I was asked, ” I bought TQQQ when you pointed out the reversal at the lows and I’m holding on. Can I just ride it?” Well, there is always risk, but with a stop, I would say, ” Yes, and it may also be rewarding.” Let me show you why.
.
QQQ – IF IF IF The QQQ is just going sideways and rides along the 50 sma as a 1/2 cycle low, Yes you can just hold on to your TQQQ using QQQ as the guide. QQQ SHOULD run to the 200sma before seeking out a dcl. Is that a good enough trade?
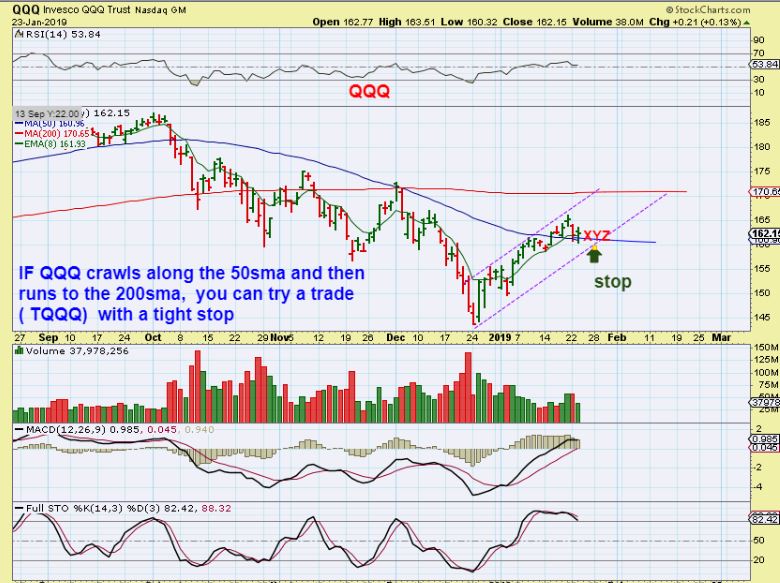
TQQQ – TQQQ running higher from here to say over $50 is a 25% gain. I basically went conservative and only showed a run tot he $50+ area, it may do better than that.
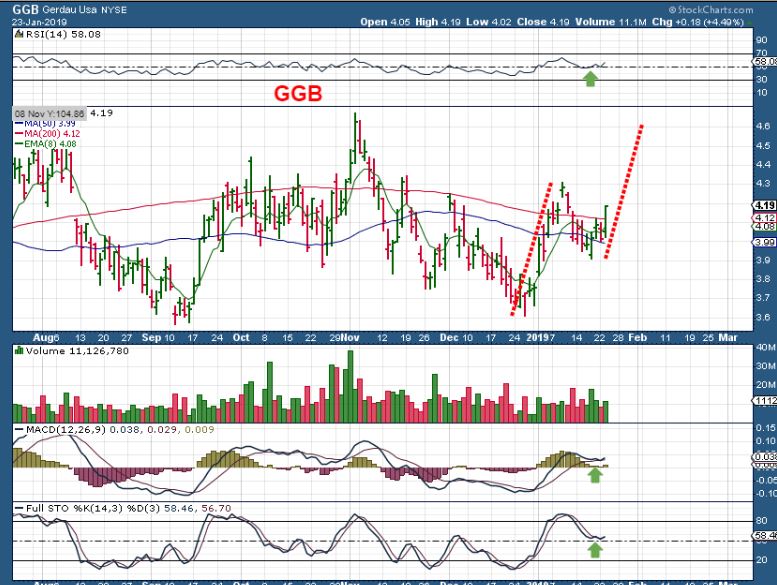
GGB #1 – Rocky mentioned GGB in the comments, and I do like this set up. It broke above & Closed above the 8ema, 50 & 200 sma.
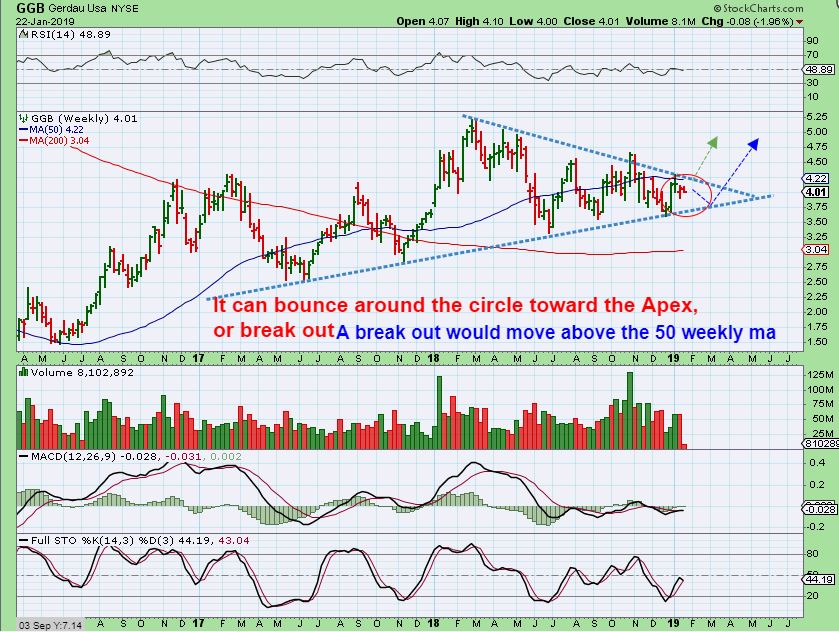
GGB #2 (Weekly) – This is actually a weekly chart for more of a big picture look. This was 2 days ago, so it doesn’t include the move to $4.19 yesterday. If this breaks out, it looks quite bullish to me.
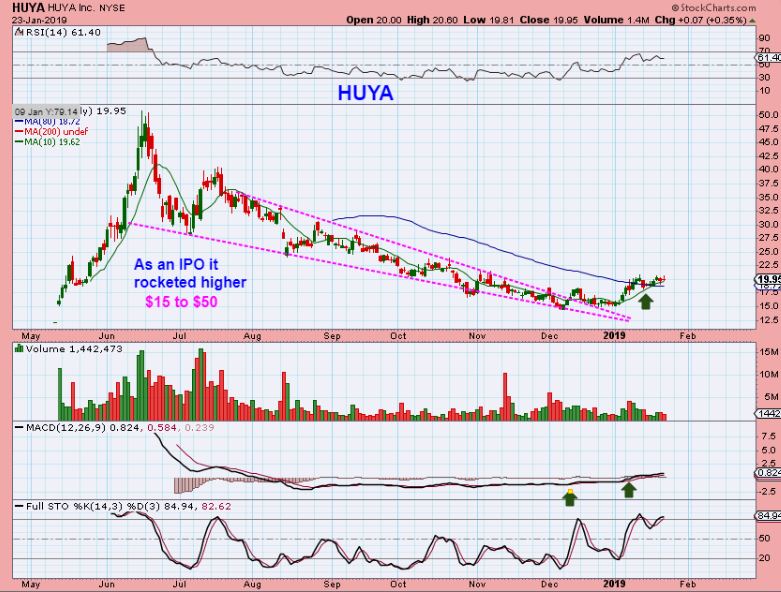
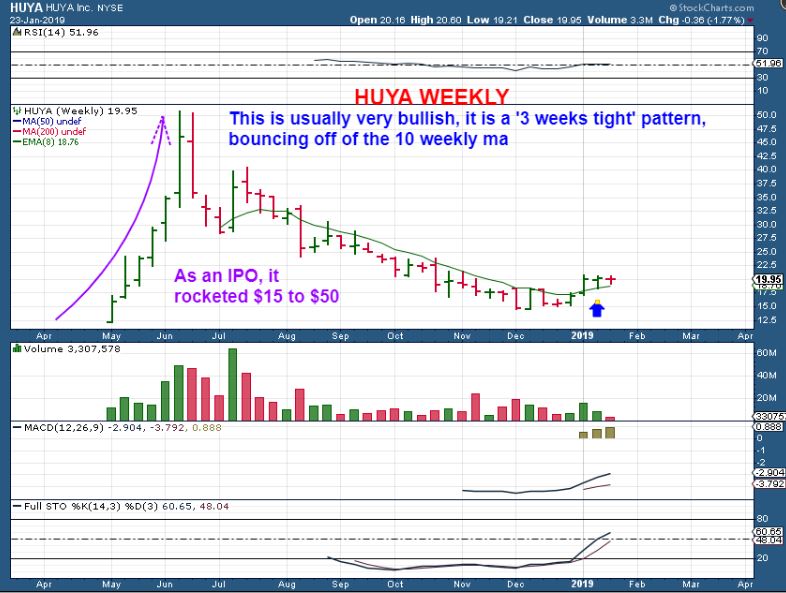
HUYA – This is a Tech stock that ran very quickly as an IPO release last May-June. It is holding up and has made higher lows and higher highs after breaking the down trend. I want to show you the weekly chart though…
HUYA WEEKLY – This is known as a bullish 3 weeks tight pattern, where price closes in the same area on a weekly basis. It is bullish, and is bought with a stop under the 8 weekly ema. It is similar to a bull flag, and we watch for a bullish break higher. This COULD go 4 weeks tight, but the 8 ema is rising, and that is considered support now
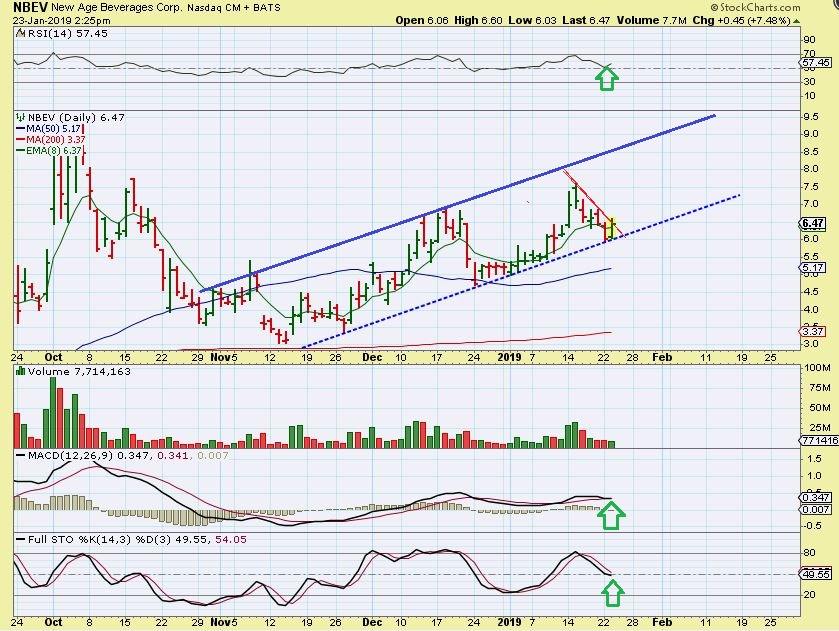
NBEV Daily – New Age Beverage has entered the CBD infused Beverage business, and has been drawing in buyers, but it DOES move quickly in both directions. The daily chart of NBEV seems to have price climbing along a trend line or channel rather nicely, so this would be a good place to add or even start a trade. We got a nice reversal Wednesday, and I would expect that it continues higher from here. If it breaks above the RED TREND LINE Thursday, that is bullish. Let’s look at the weekly.
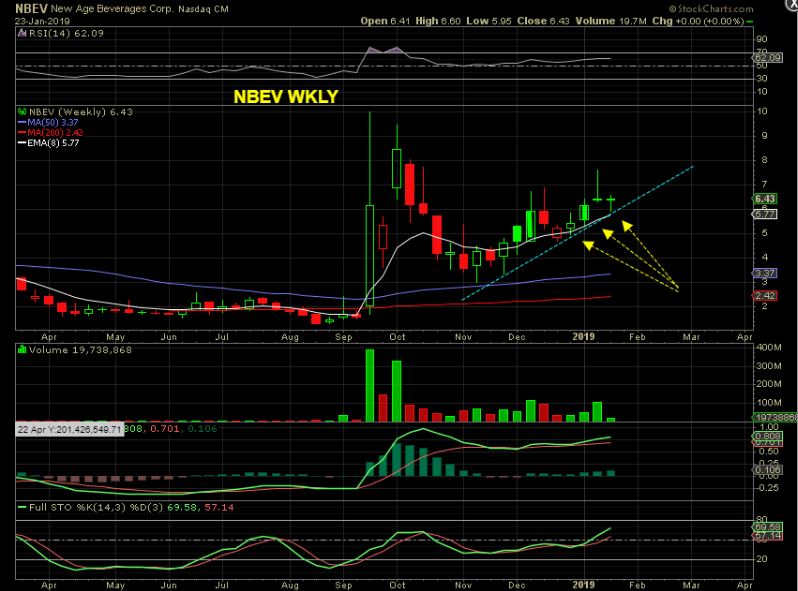
NBEV WEEKLY – We have a weekly reversal off of the weekly 8 ema and that uptrend line too. You could put a stop under the weekly low, which is about $5.90.
SQ was pointed out last week as it crawled along the 50sma.
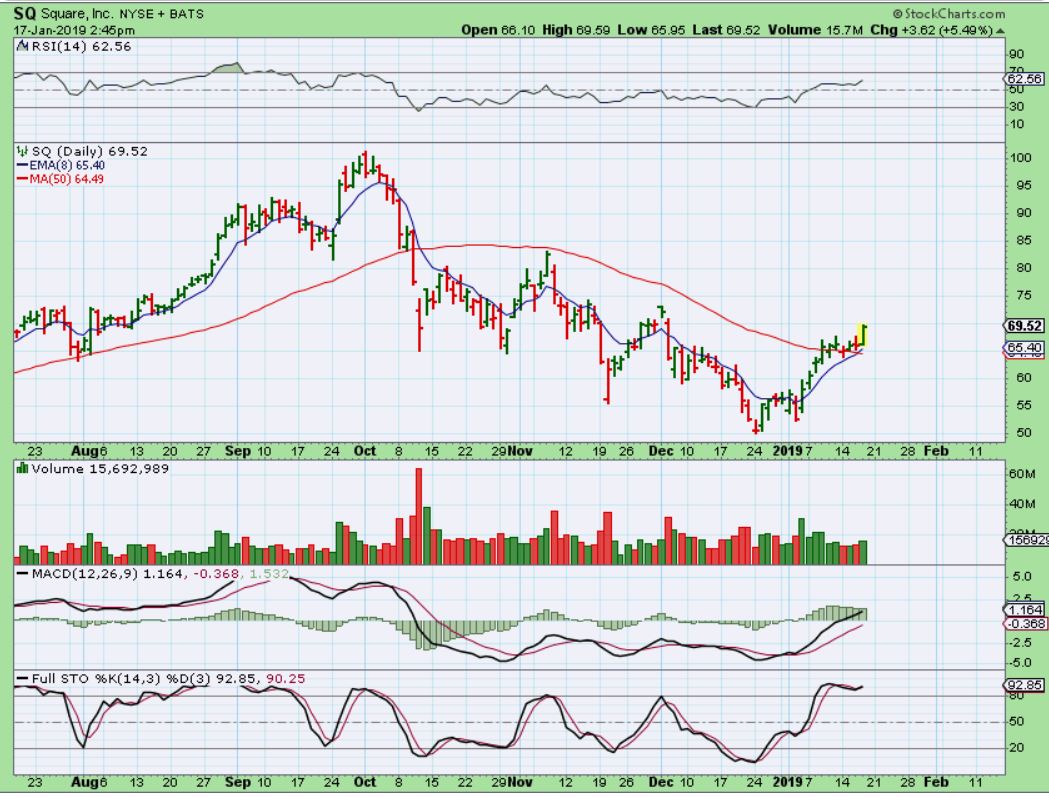
SQ – It did not just take off higher, instead SQ back tested the 200sma this week. So far, it recovered from $50 to $72 (40%). The move off the bottom is always the fastest gains, that is why we shoot for the ICL, but here we see SQ also holding above the 3 main moving averages as it moves sideways with the markets (support). See the next chart for more info.
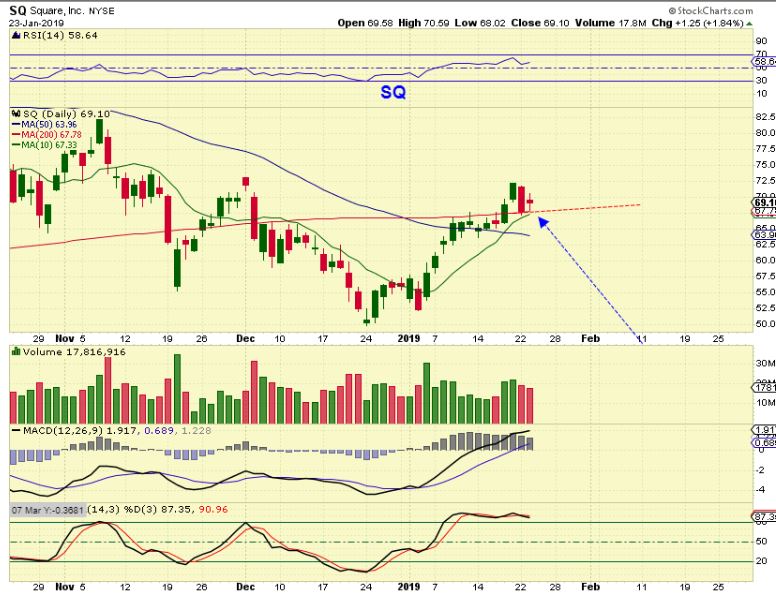
SQ (Same chart)_ This could be bought here or Put it on a watch list. If we get a 1/2 cycle low in the markets, this might back test that 50 sma, and that could be the lower risk buy if we get a reversal there. It is on the 8 ema & 200sma, so it also may just take off from here. This looks like a 1-2-3-4-5, but it might also just be 1-2-3-4- with 5 ahead. What is Bullish is that the last 2 runs in Oct & Nov were equal distance, this one was longer, and also breaks the down trend. See the next chart…
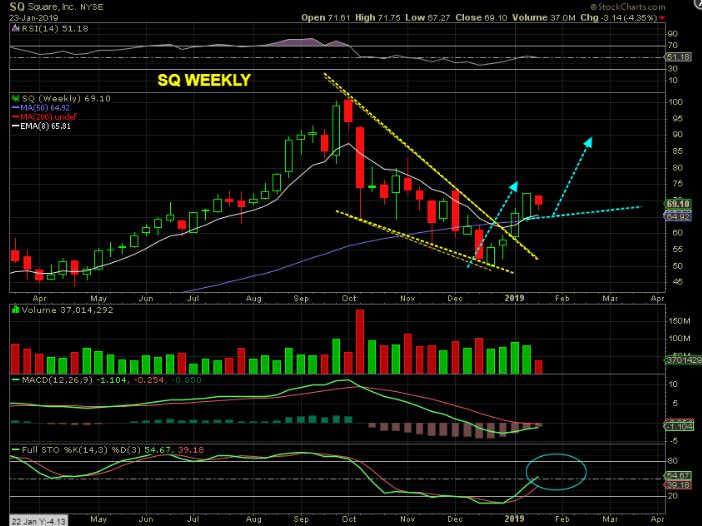
SQ WEEKLY – You can’t see it clearly, but this weeks red candle bounced off of the blue line and this has broken the down trend. I would expect higher price.
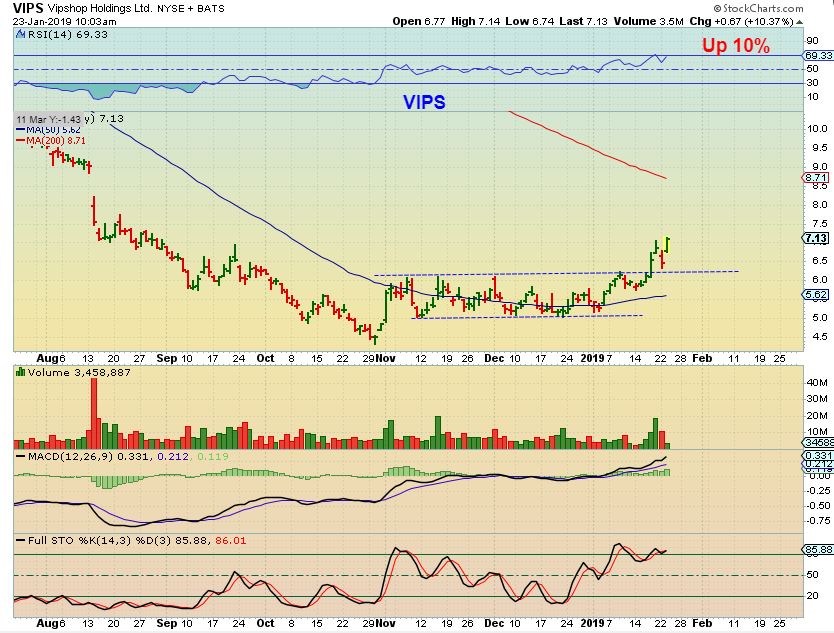
UPDATE FOR VIPS – Vips is getting the follow through expected. The weekly chart is a round bottom base.