Jan 23rd – Wednesday
SPX – Day 17 has us in the middle of a move out of an ICL, and it is overbought. The short term move gets difficult to predict from this point, since it could dip to a 1/2 cycle low and then continue higher, or it may just churn sideways along the 50sma as it struggles in a wedge. Price held above that 50sma, but the Wedge is cautionary short term. My long term view remains the same.
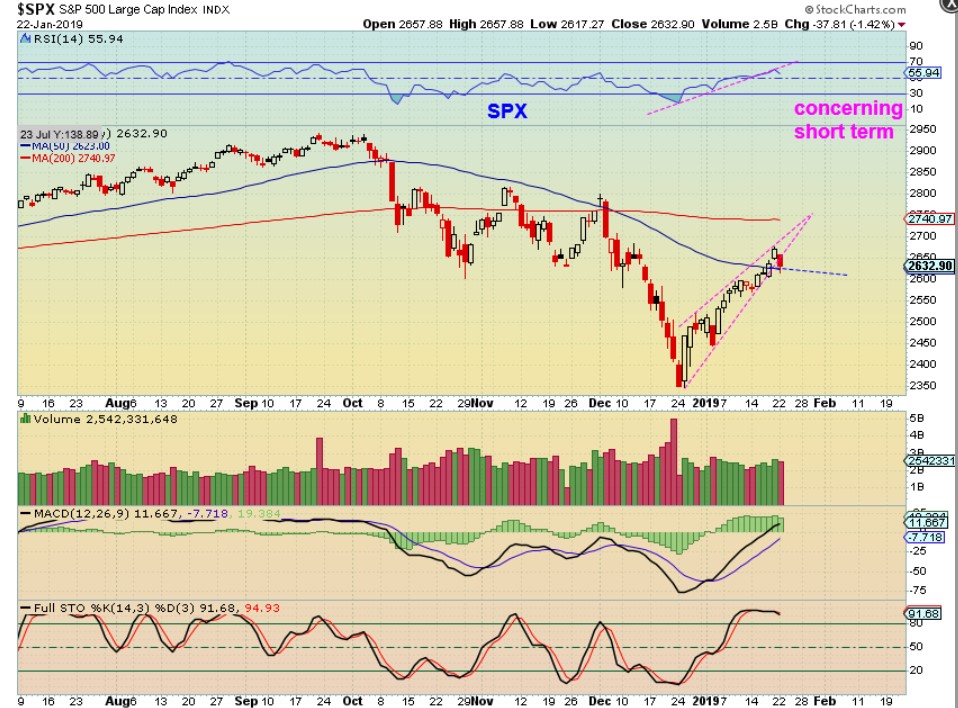
Let’s look a bit closer…
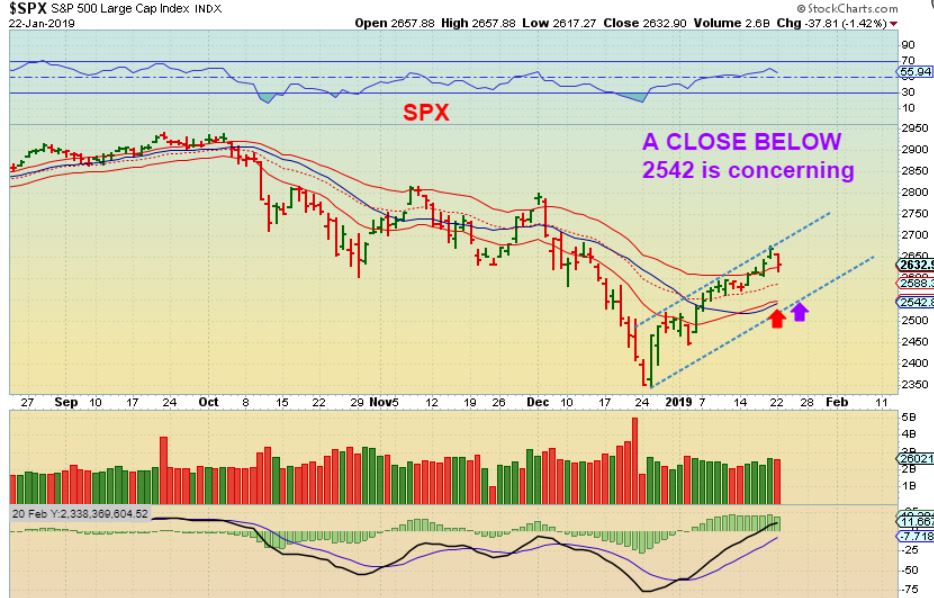
LESS LIKELY:
SPX – If the SPX closes below the 2542 mark, I ‘d say that this drop isn’t the 1/2 cycle low, but that we may actually test the lows into a dcl. A higher low most likely. If that price holds above the arrows or even goes sideways ( Most likely) , it is a normal pull back and forms this channel.
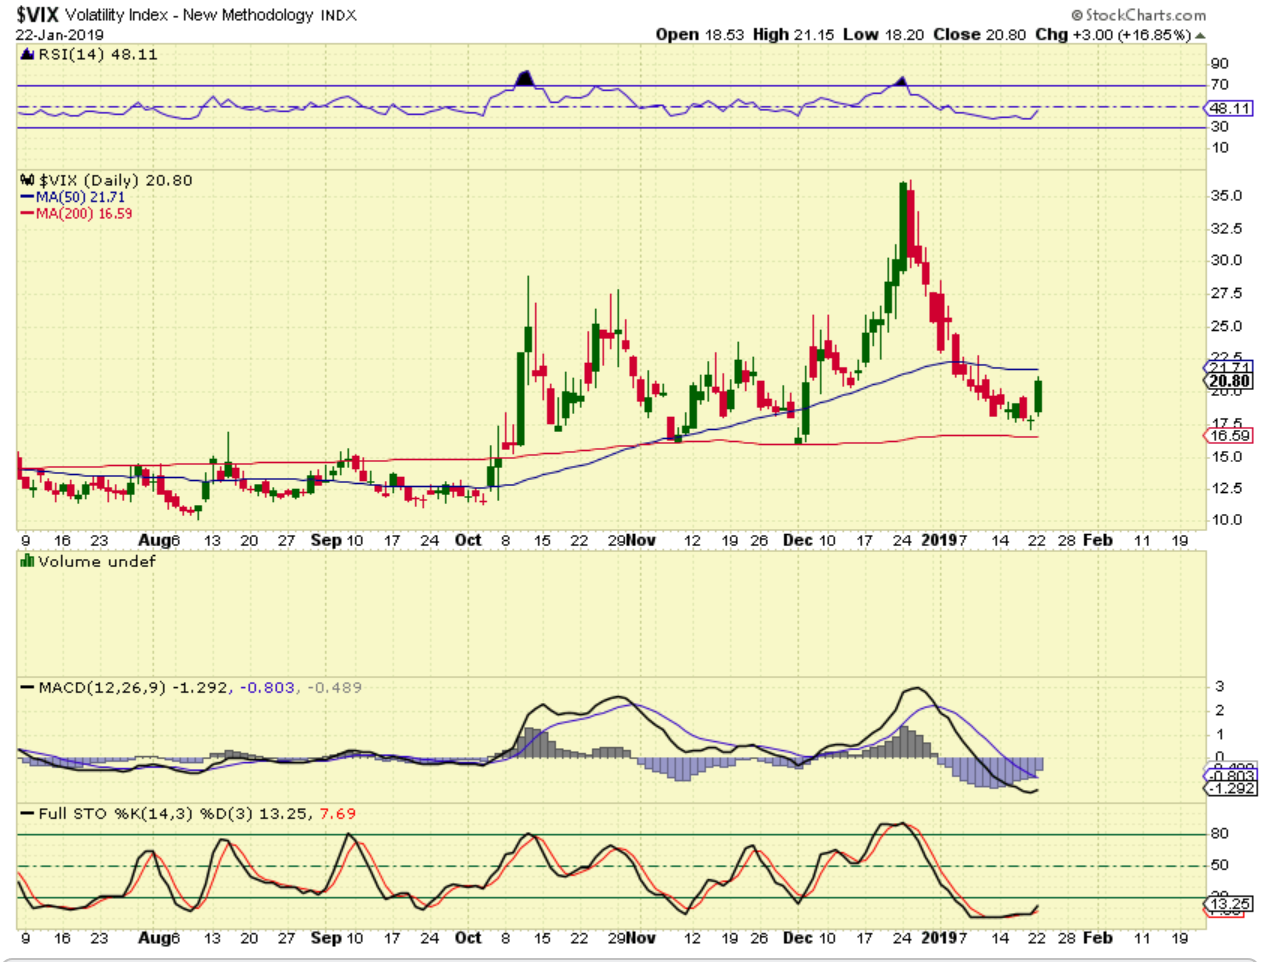
VIX – The rally out of the ICL for the SPX had the VIX drop to quite oversold. It reversed and Popped off of the 200sma area. A choppy vix usually gives us a choppy market. I’m watching the 50sma on the VIX too.
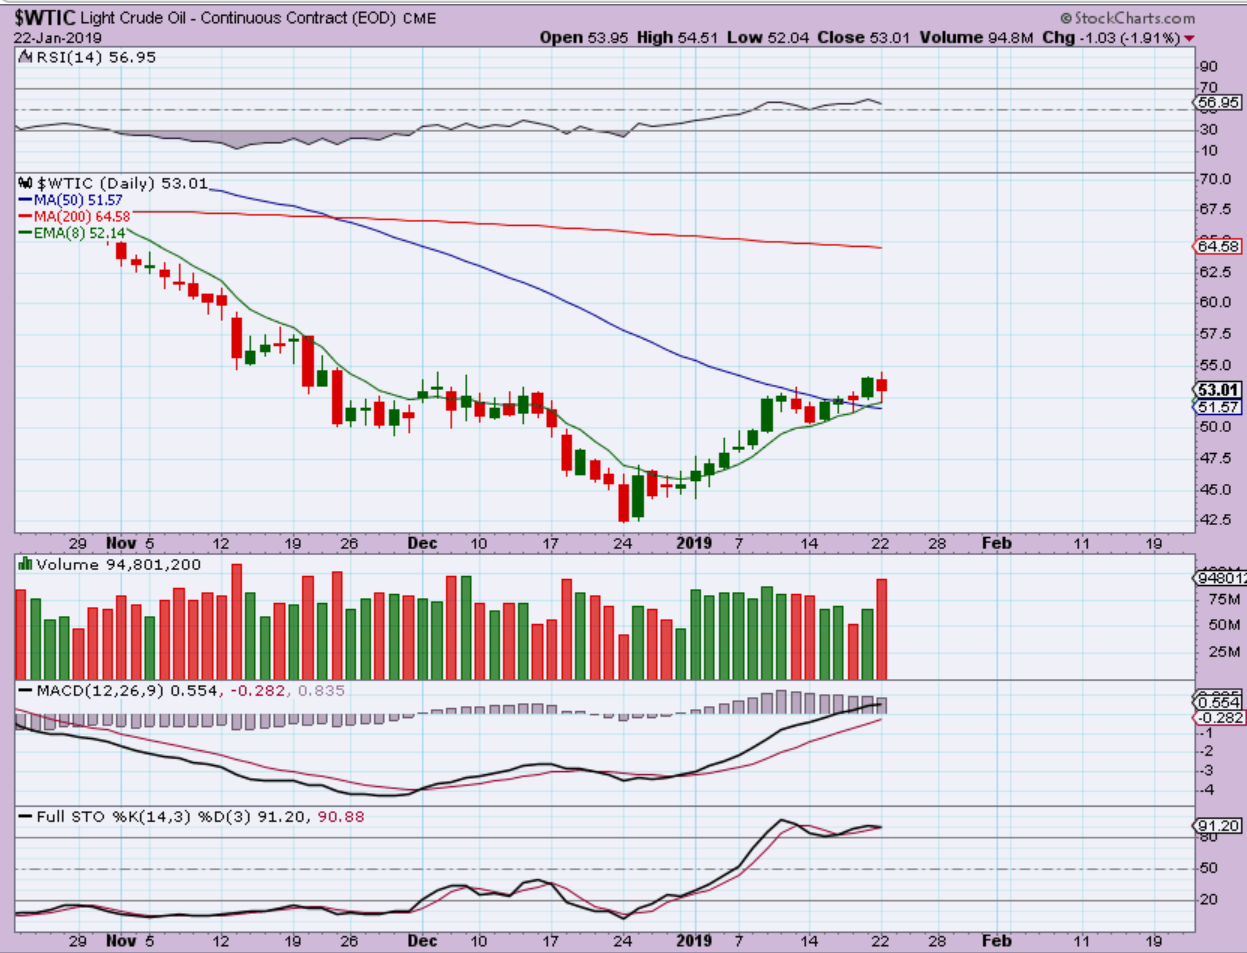
WTIC – Oil dropped Tuesday, but held the 50sma. OIL LOOKS FINE, But there are concerns. I don’t know why the volume was so high, but this is an important area to watch, I’ll explain shortly…
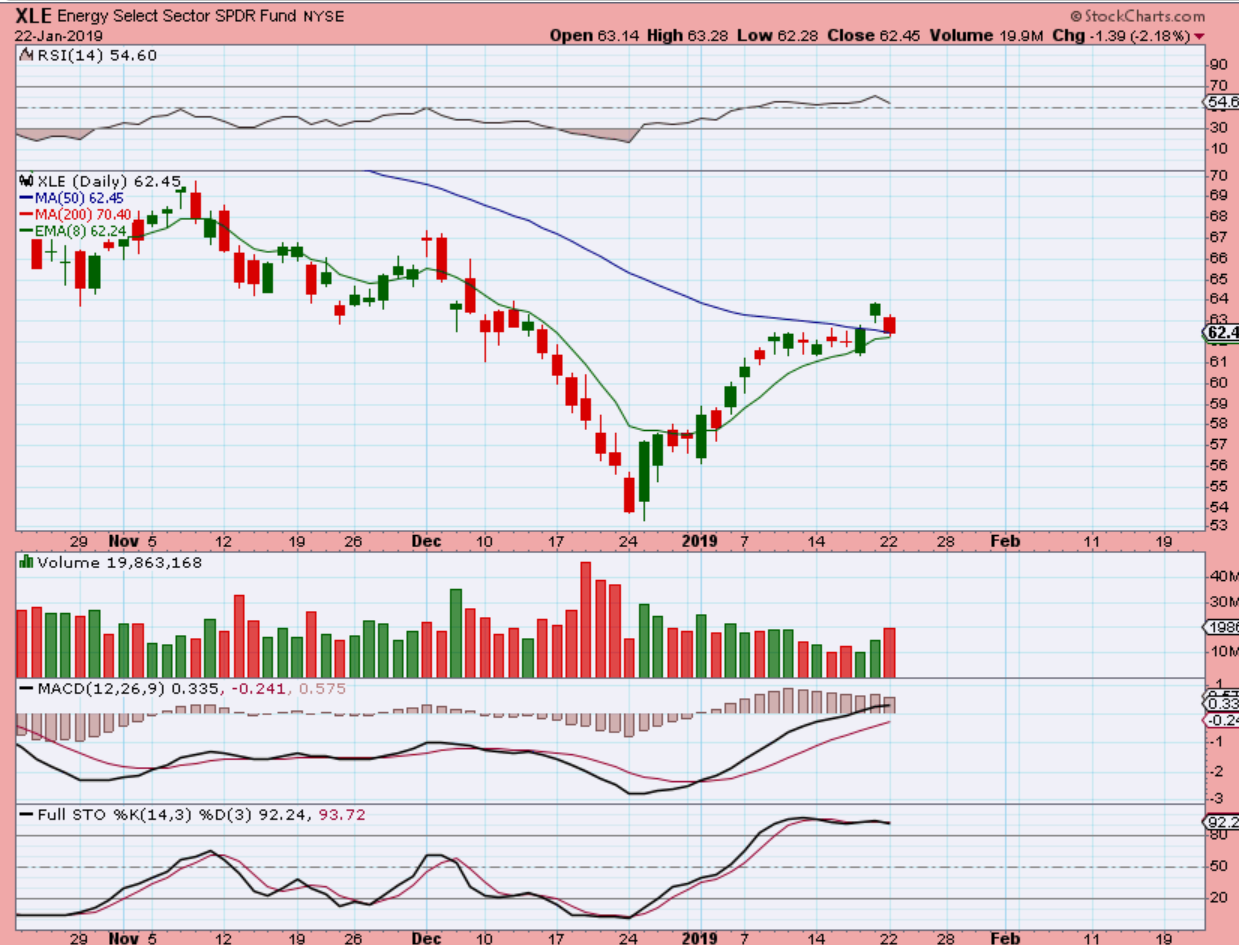
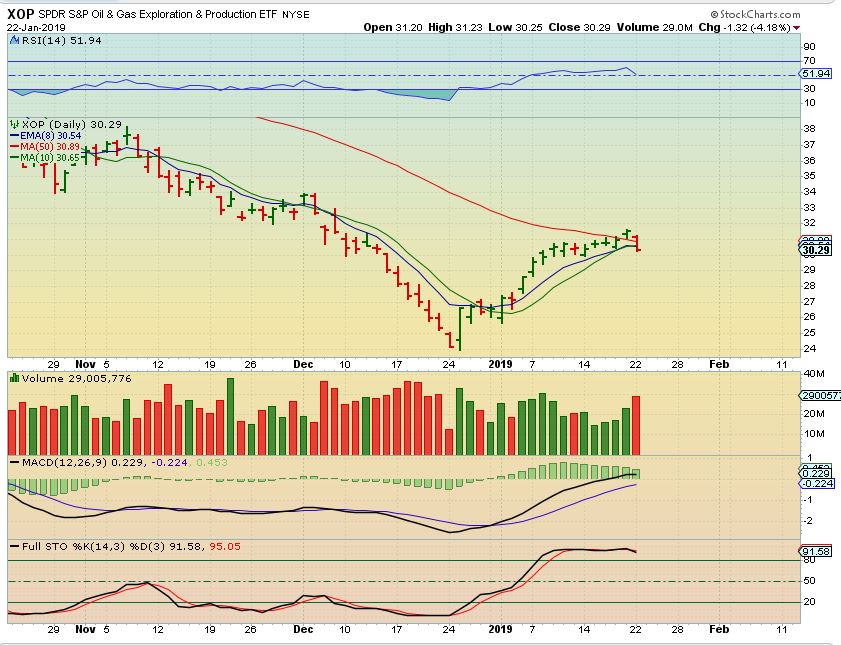
XLE – The XLE also held the 50sma, but this is why I say that it is important to watch Oil now. XLE & OIH Look fine as seen below, But XOP Got ugly fast. Take a look at a couple of Energy Stocks…
.
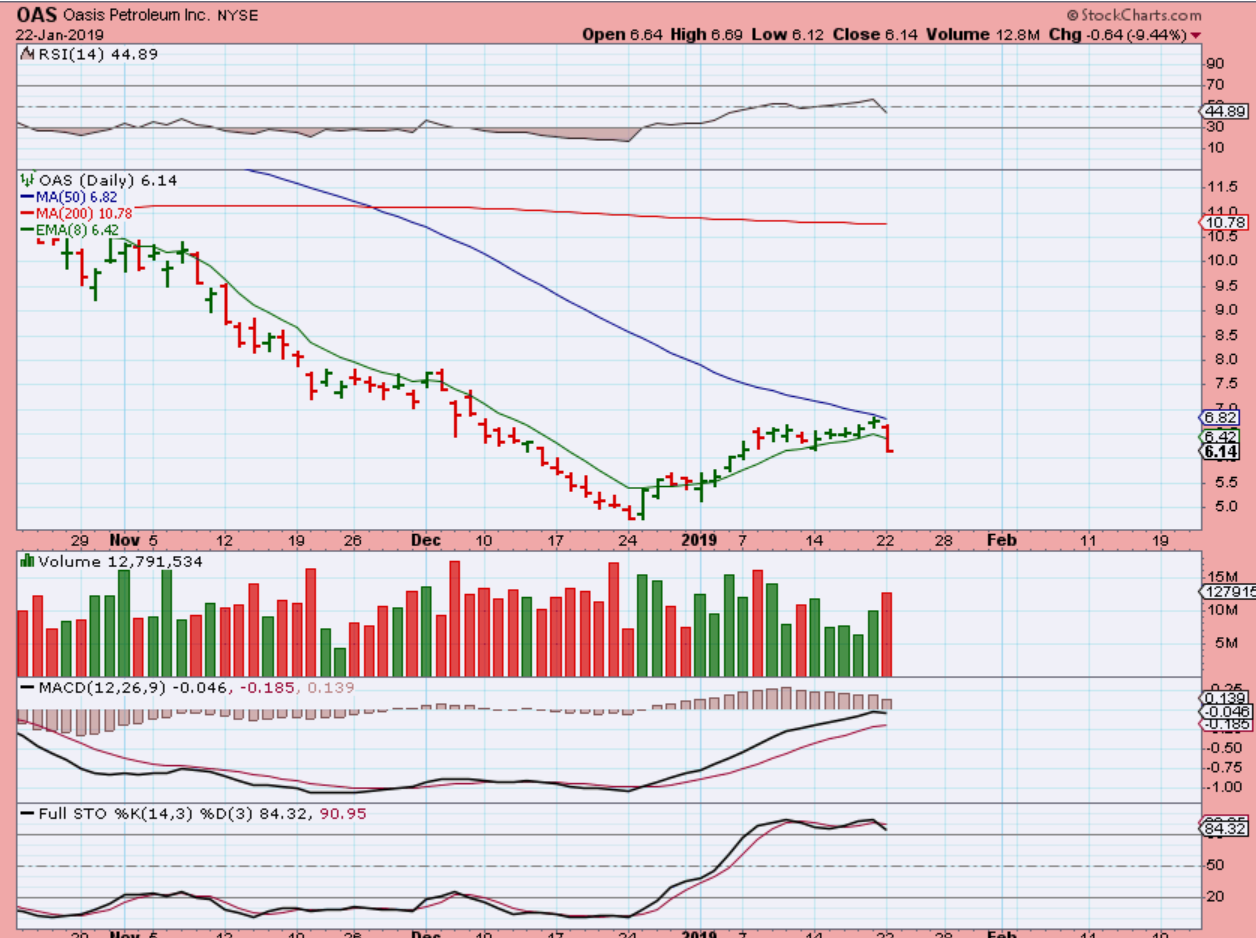
THIS IS SOMEWHAT IMPORTANT: ARE THE ENERGY STOCKS TELLING US SOMETHING?
.
OAS — This is a failure at the 50sma so far, and it broke the 8 ema with high volume. I ALWAYS get cautious when I see that, but not if it is just in 1 stock, however…
.
It wasnt just happening in 1 energy stock.
.
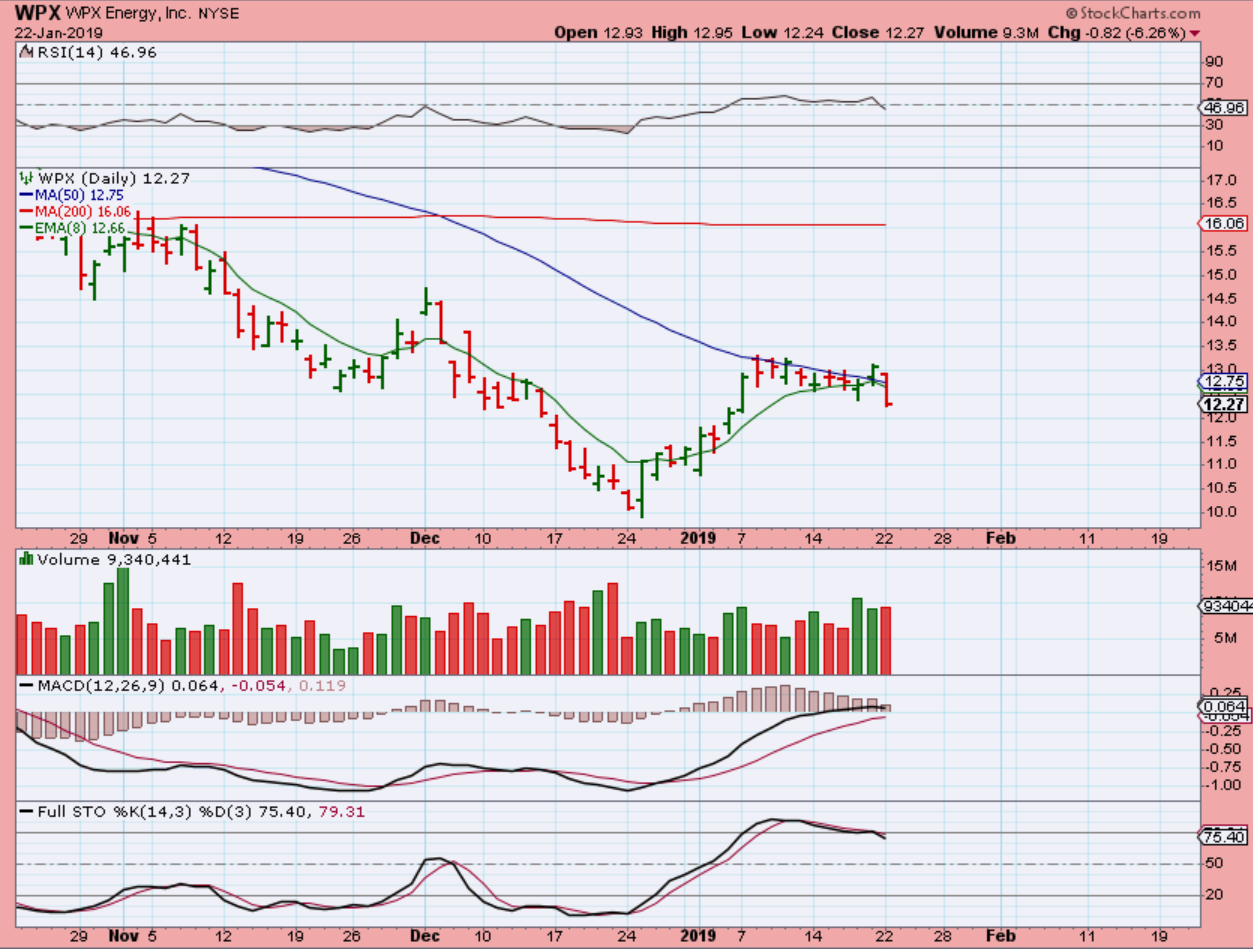
WPX – This was a good looking Break out Friday, and now price gave it up. That could be a FALSE BREAK OUT, and possibly a failure next. This is overbought, so it gets concerning.
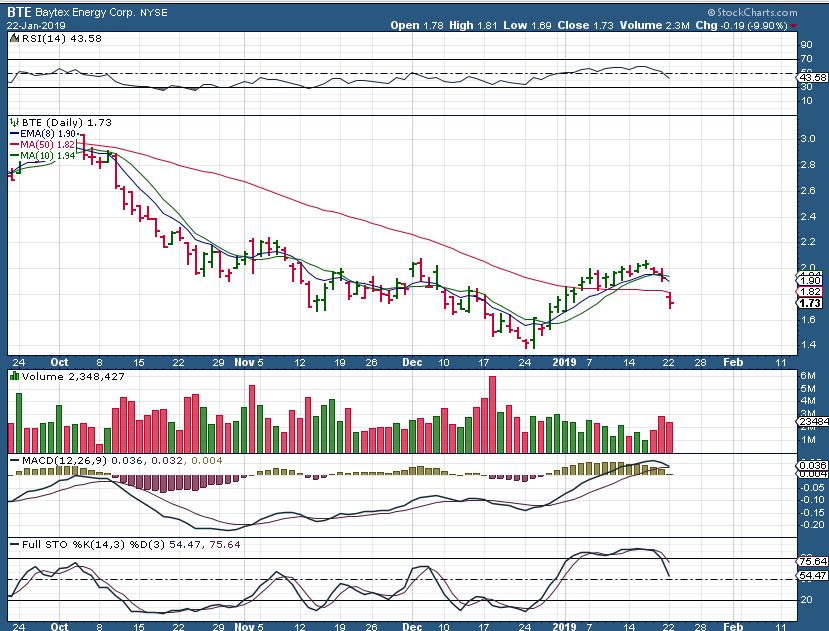
BTE _ When I look at BTE, that was a break out and a crawl along the 50sma, as it climbed the 8 ema bullishly, but Tuesday? That is a gap below the 50sma.
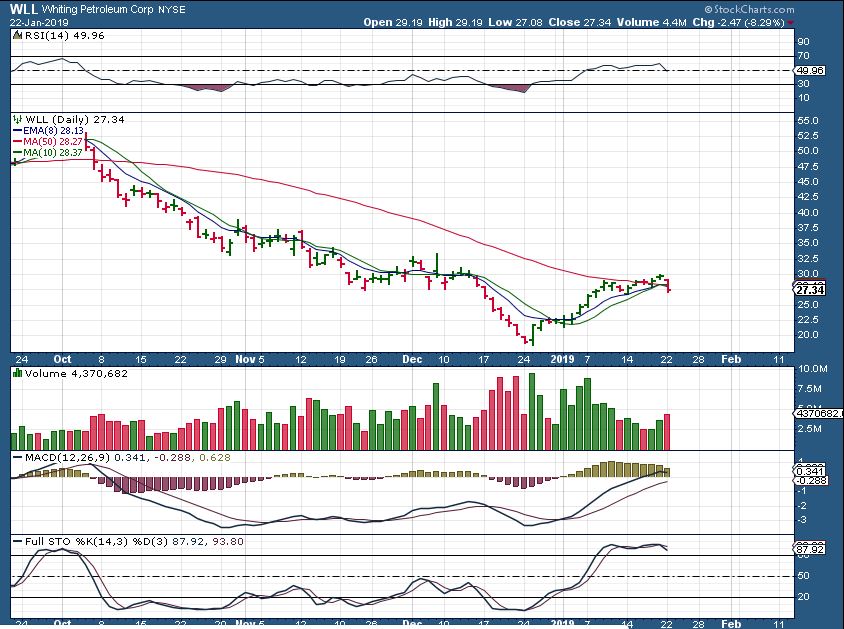
WLL – WLL also Broke above the 50sma Thursday & Friday, after crawling along bullishly. Tuesday, even though OIL & XLE held that 50, saw WLL break down.
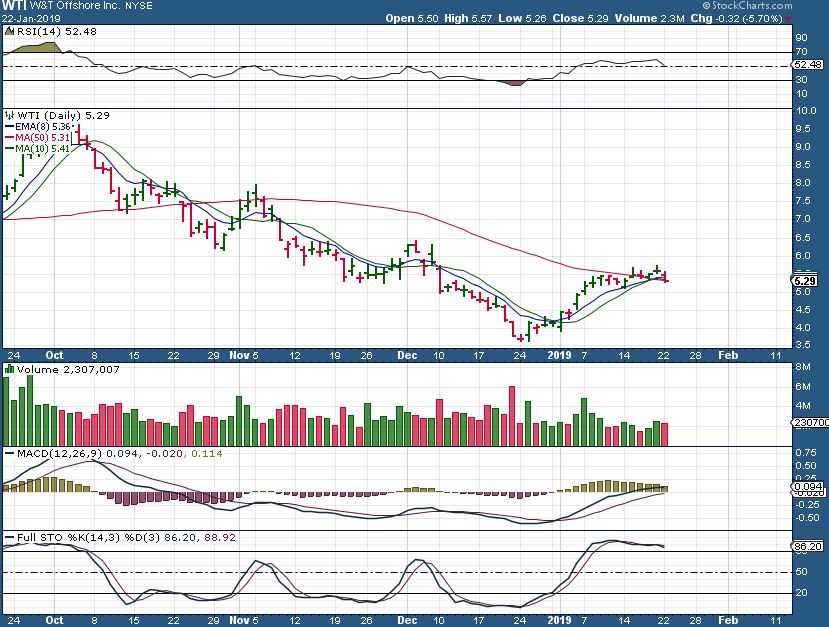
WTI– This is holding the 50sma, but can we trust it after what I pointed out above?? After seeing OAS, BTE, WLL, even CPE is rolling over and that was with OIL holding up, I think these trades should be closed or TIGHTEN STOPS.
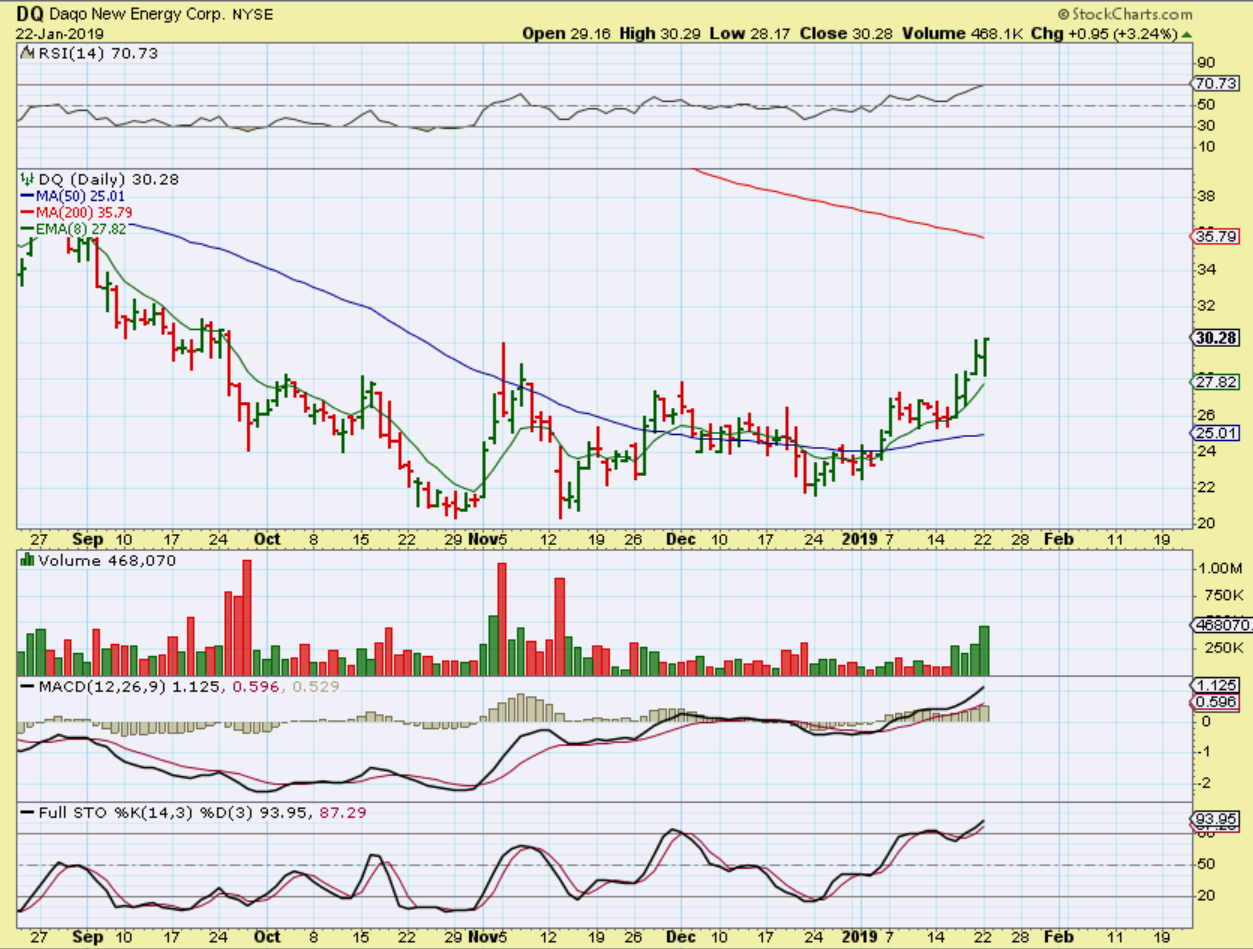
DQ – So, I sold my DQ, yet it went higher and remains bullish. That is a bit of a bummer for me, but I did make good gains. I was going to tighten my stop to the 8 ema, and maybe I should have.
Finally, I held my SN , and it is fine right now, but I have to call it riskier now, simply because of the sector that it is in.
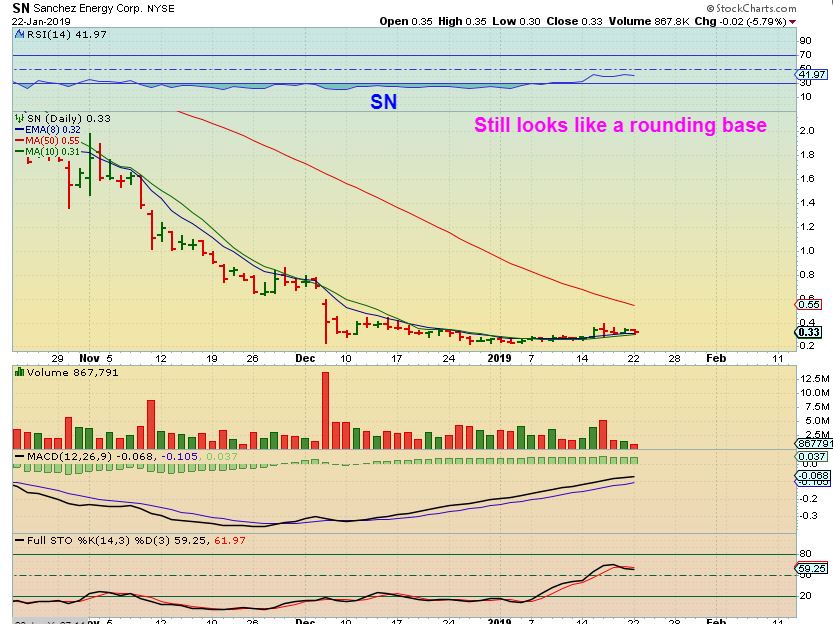
So basically, OIL looked fine, I have really liked the move out of the lows, but the Oil / Energy stocks are acting questionably. It is necessary to recommend – Raise stops or take profits. Like I said, Look at OIL, XLE, and OIH and things look fine, but the XOP below is turning ugly, so caution flags go up. It was a nice run with decent gains, but we’ll have to see how it looks going forward, or maybe at the next dcl. IT IS ONLY DAY 17 of possible 40+, so we’ll look to see if these can repair the damage too.
.
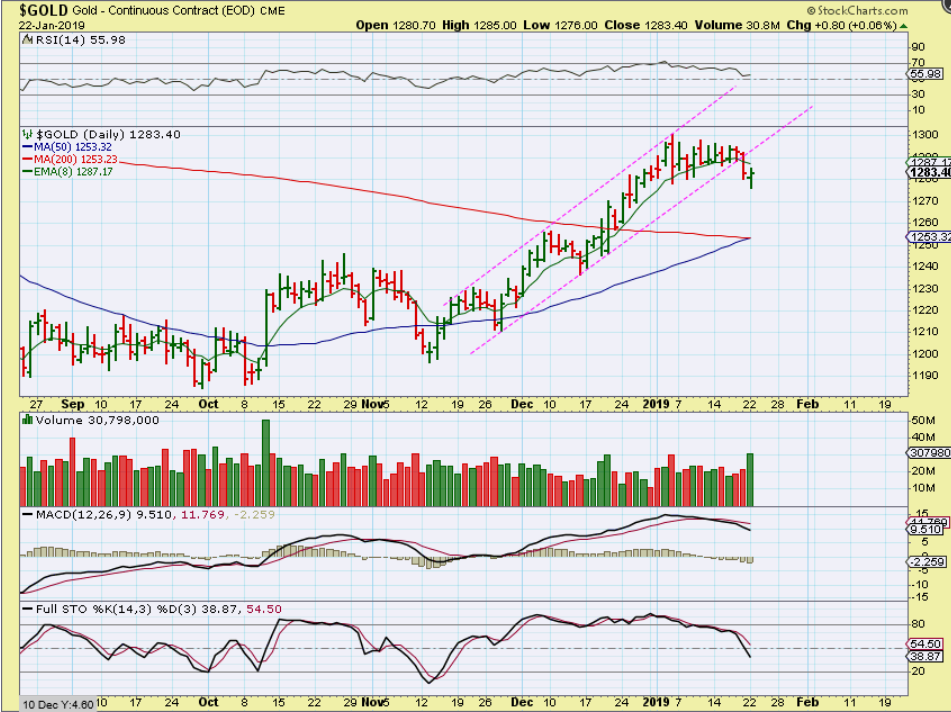
GOLD – Gold put in a reversal, but at this point, it remains below the 8 ema. It may just tag the down trend line or 10sma & drop further.
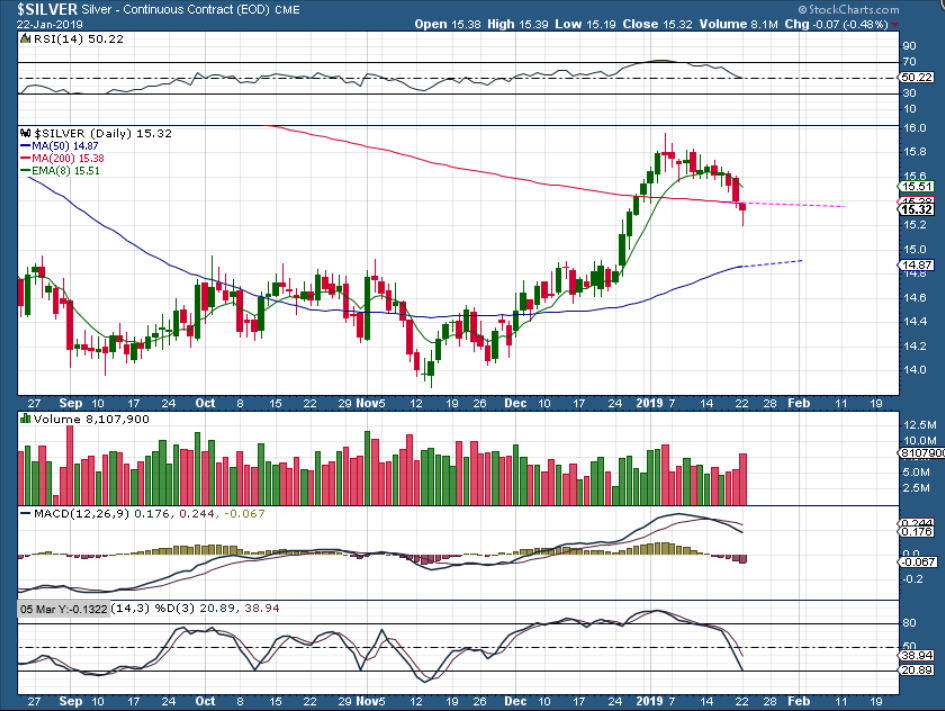
SILVER – Silver dropped below the 200 sma and put in a reversal candle too, but it hasn’t regained the 200 sma or 10 sma. I expect a drop to the 50sma.
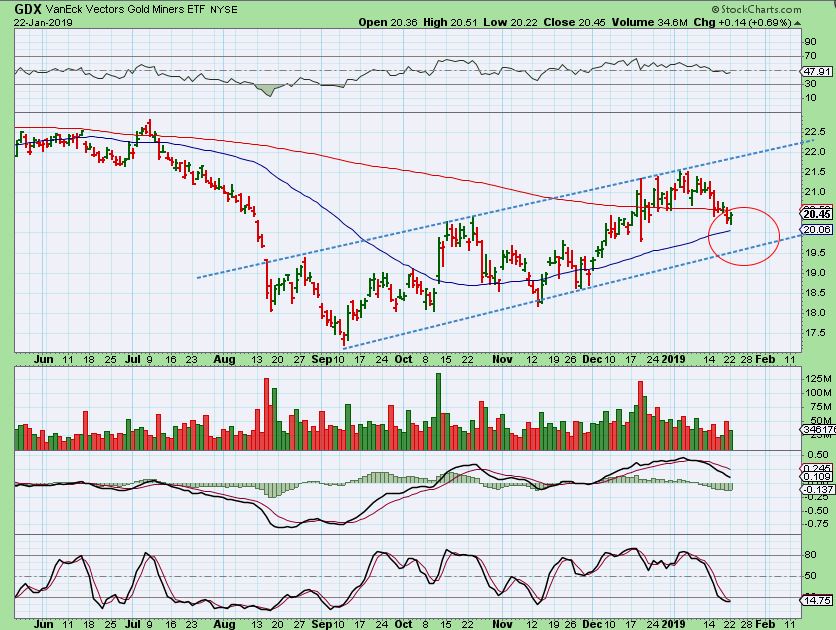
GDX – Read the chart.
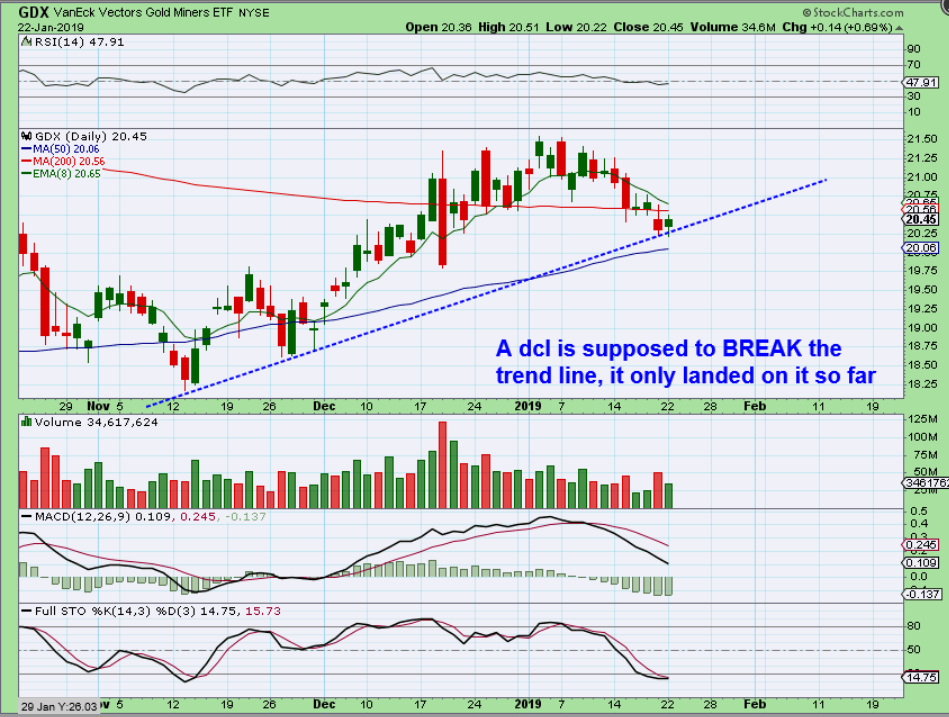
GDX – I’ve been drawing this view all along, and it would seem to indicate that a deeper DCL or ICL will eventually come along.
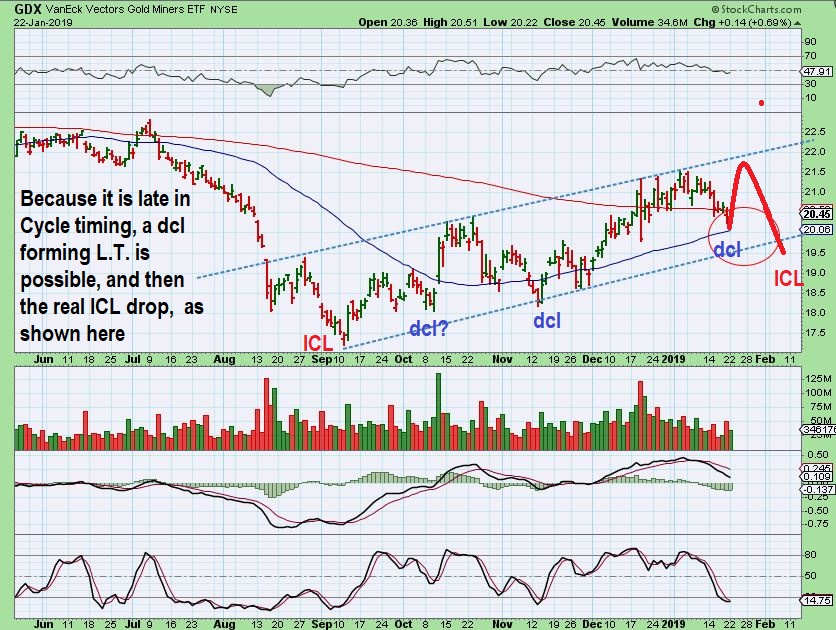
SIDENOTE:
GDX – It is possible that GDX puts in a dcl anytime now, since it is late in cycle counts. The last daily cycle is Right Translated, so this would be expected to make a fake break out to new highs , but form as L.T. & drops to an ICL as shown. It is a very hard call to make in advance, so I just want to watch it play out. So if GDX breaks above the 200 sma, and you want to buy it, that is fine, but use a tight stop and raise it as time goes by.
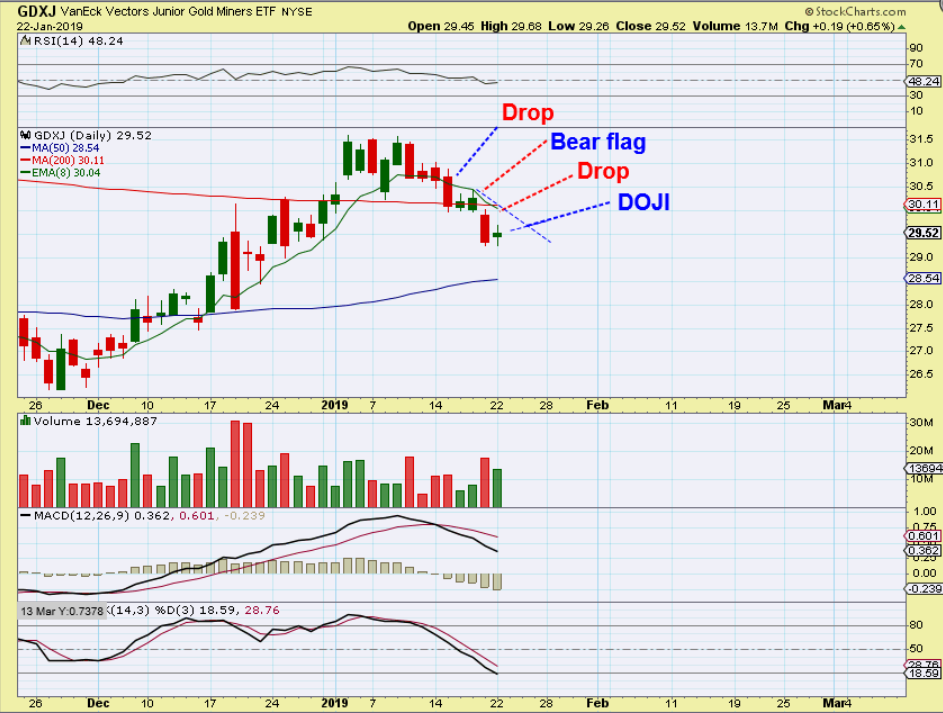
GDXJ – So we saw a ‘PAUSE’ in the selling, but we have seen that before. Notice the DROP, 2 days to the 8 ema, DROP, and a doji. No real change at this point, it may just be a pause in the sell off.
.
So we have had a nice 3 week run out of the lows in the General Markets and Oil. It is still rather early in the intermediate cycle itself, but after 3 weeks of gains almost straight up, we may get some volatility, a dip to a 1/2 cycle low, a PAUSE in the move higher, a sideways crawl, etc. Its is hard to know for sure when you are in the Middle of a move, so at this point ‘traders’ may sell some positions, or just maybe raise stops on a positions. Oil looks fine, but what about those Energy stocks? Definitely raise stops or take action there, until things clear up. Gold , Silver, and Miners are pulling back.
Tomorrow I will try to have some stock picks, but today I want to see what happens in the General Markets and Oil. We’ll see what Wednesday brings.
.
Enjoy your trading!
.
~ALEX
.
BY REQUEST :
This has been running away and our reader rode it higher, sold some, and wants to re-enter. Question was, is it going to pull back?
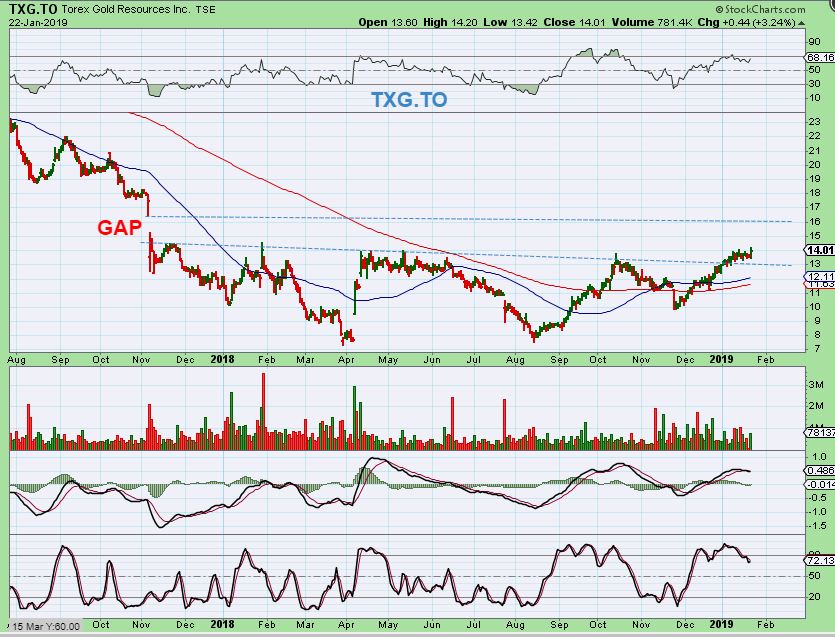
TXG .TO – If I draw the top of the base slanted slightly, it looks like a break out and could do a gap fill at $16. It could run to $16 based on an A-B = C-D projection too. At the same time, if GOLD sells down, it could drag this down to tag the 50 & 200sma. What does the weekly chart look like?
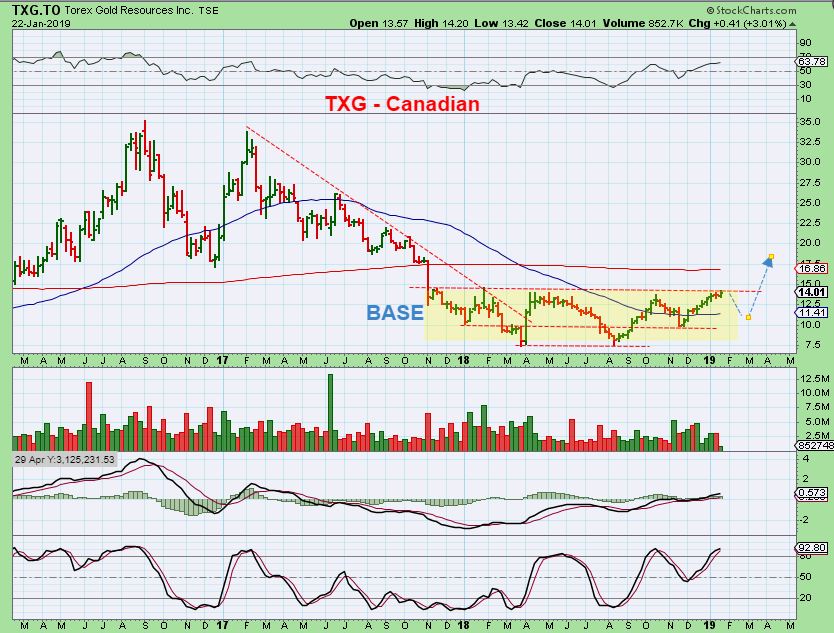
TXG .TO WEEKLY – This shows me that a large BASE has formed. If we get that pull back on the daily, it would match a pull back here to the 50 week ma, but if it breaks higher & Out of that base, that GAP FILL on the daily matches a run to $16 also, a run to the 200 week MA. That may be the only place to add lower, and if it breaks higher, it may then only back test the base later as a possible buy.
.
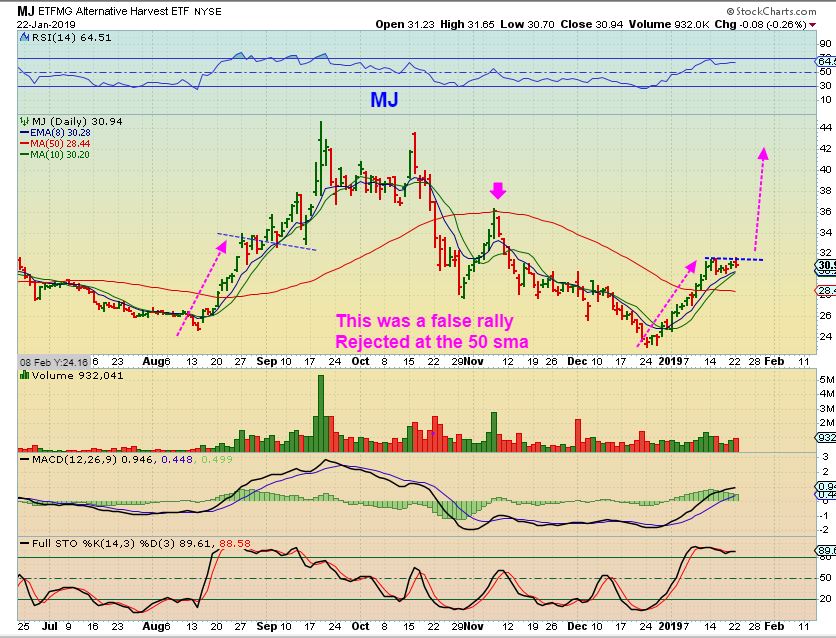
MJ ETF – As this rally in the MJ sector plays out, I started out cautious, because I have seen false rallies in the past. Notice: This one currently resembles the ‘real’ rally of August to October, rather than the False short rally rejected at the 50sma in November. And so…
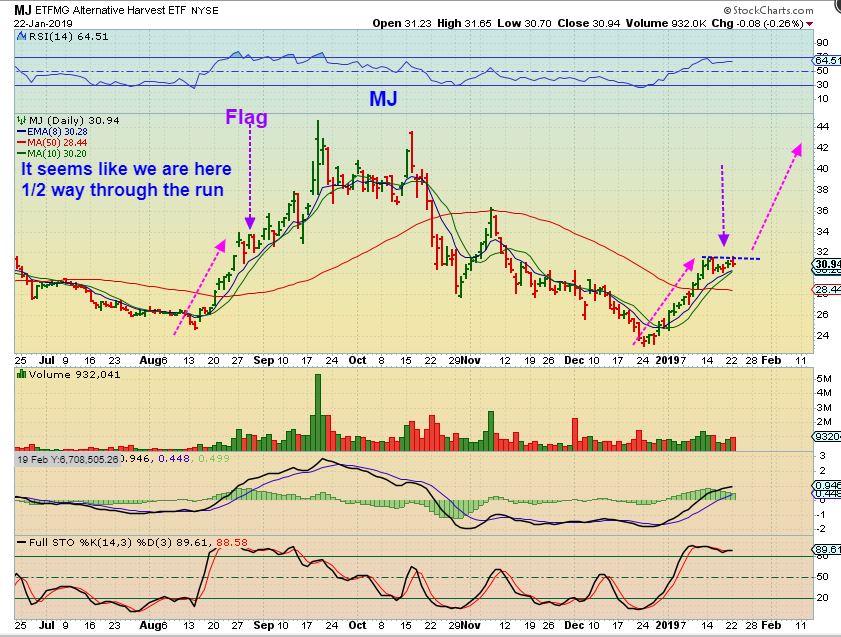
MJ ETF – This one would only be about 1/2 way finished, but THEY DO GET MORE CHOPPY after the straight up move out of the lows.
.
BY REQUEST: Yes, I still own this. This is why…
.
NOTE : I JUST REALIZED THAT HYYDF HAS MOVED TO THE AMEX UNDER TICKER HEXO . THIS COULD BE LONGER TERM BULLISH , SINCE FUNDS AND OTHER BIG MONEY SHOPPERS CAN BUY ON THE AMEX, BUT MAY BE LIMITED WHEN IT COMES TO OTC STOCKS.
.
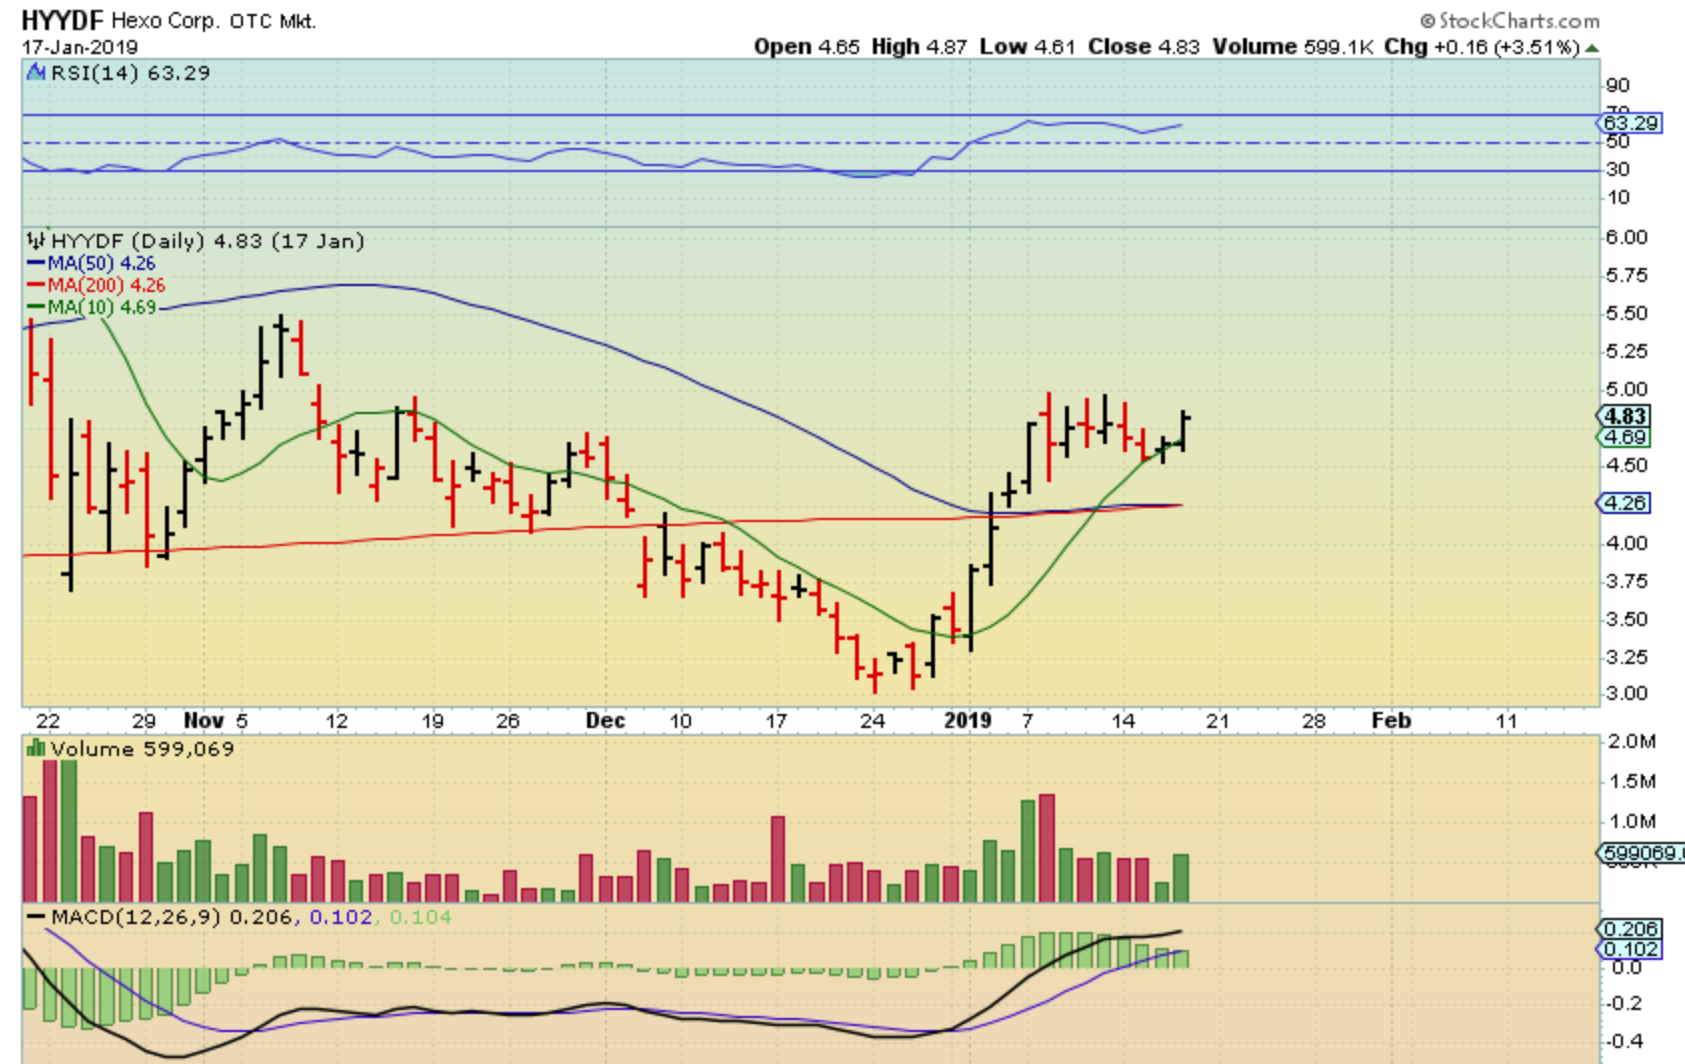
HYYDF – This was the Jan 17 bullish chart. That was a $3 – $5 run, and that is impressive, so I bought it and posted that midday.
HYYDF – We got follow through last Friday, and I expect a good run as shown, so…
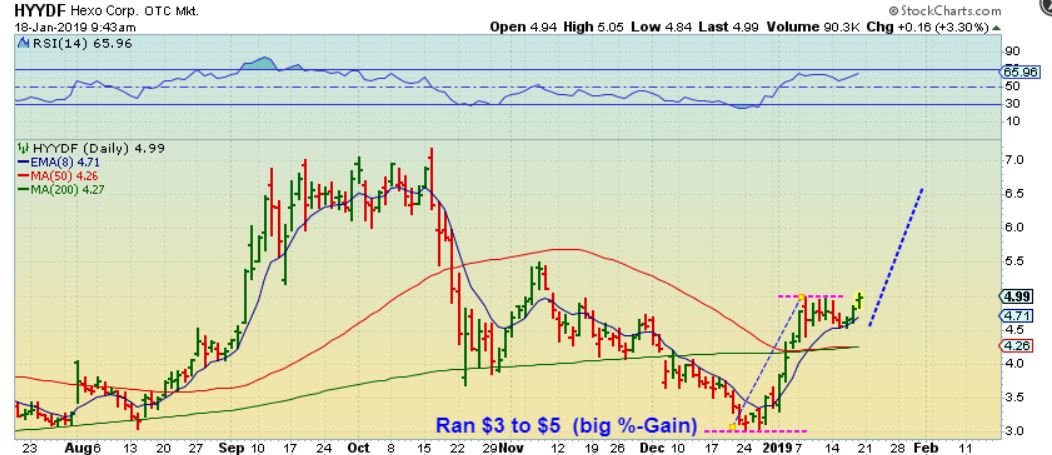
HYYDF – We got the follow through
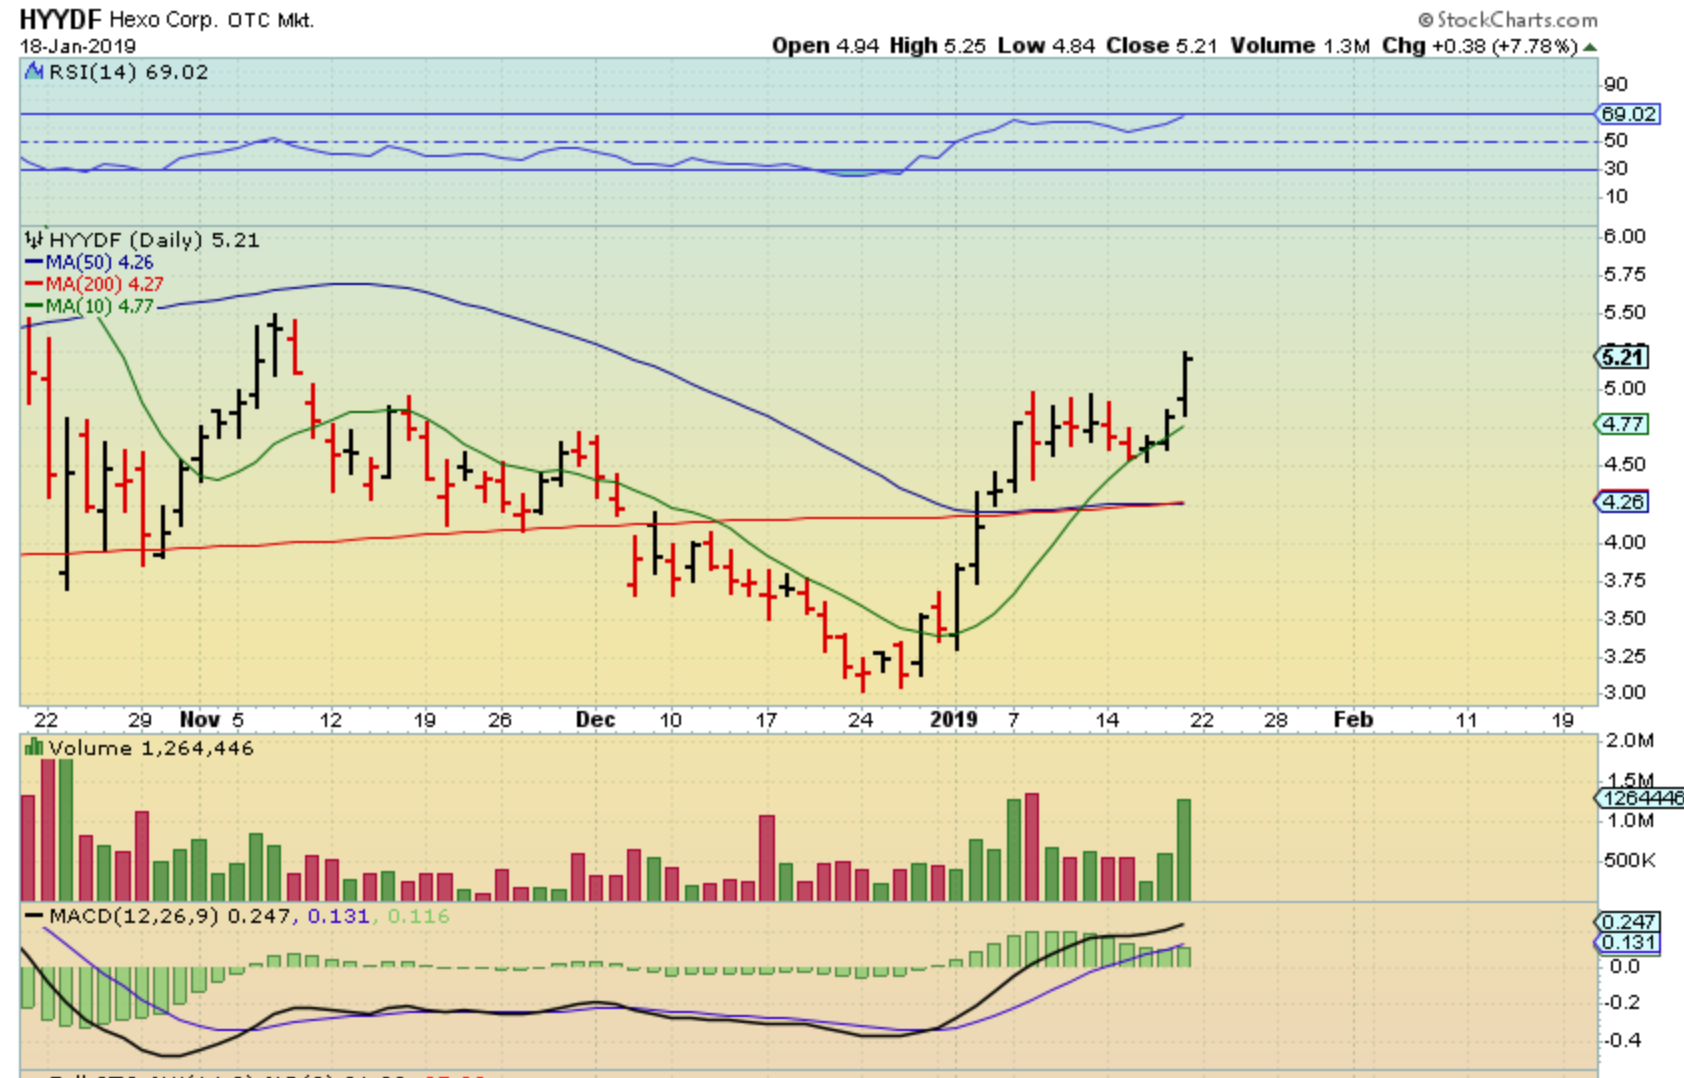
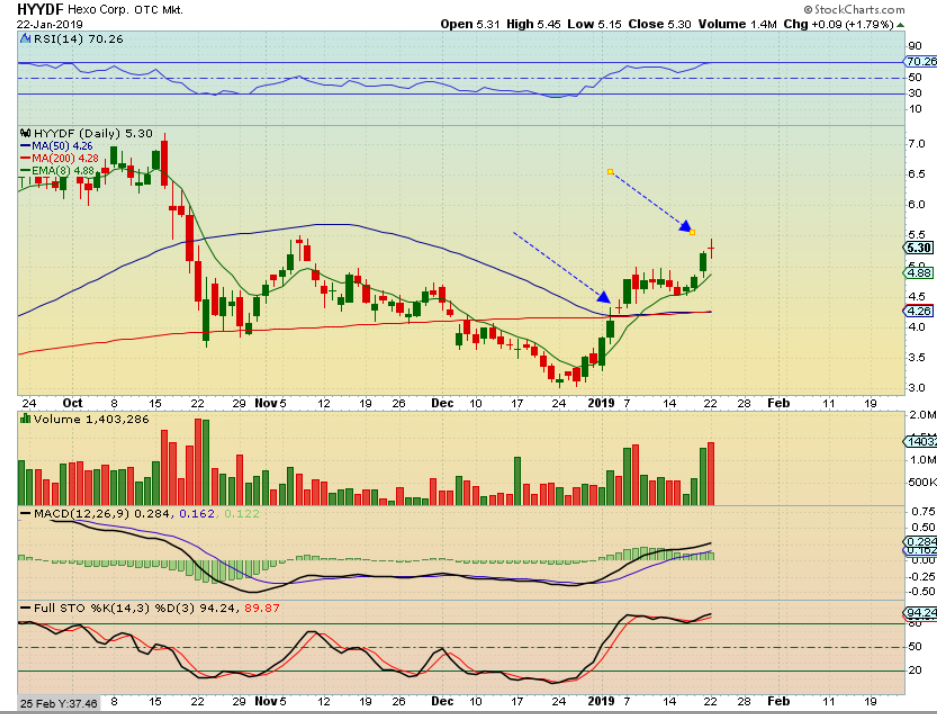
HYYDF – This is a doji, but I didn’t see it as a sell. I expect this to continue higher. Also , we saw one at the 50 & 200 sma too, yet it continued higher. I am still in it.
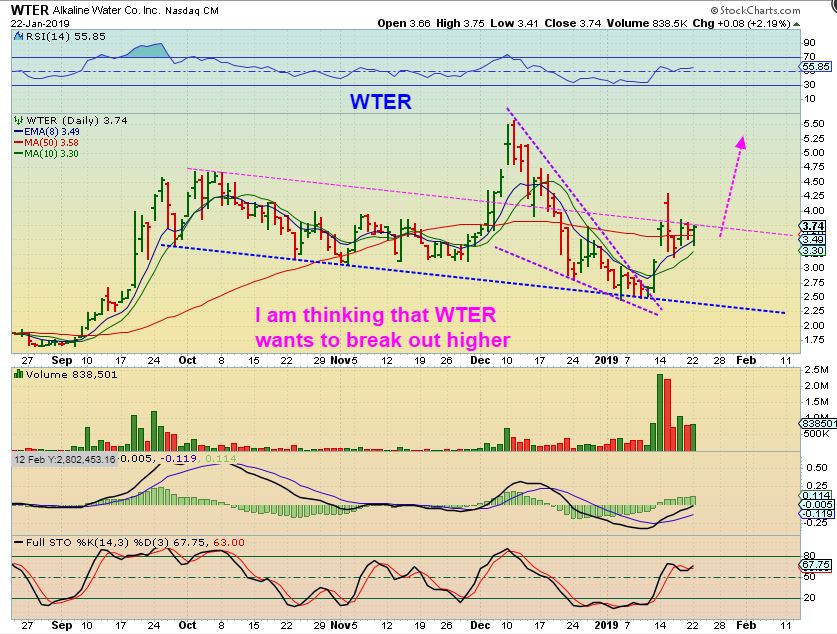
WTER _ This is also by request : I was asked, “It dipped under the 50sma and I sold it, then it moved back above it. Do you still own it, what do you think“. Yes, I own it and I feel that it can be viewed this way, but this seems confusing. Basically I think it wants to break out higher and run to December highs. Volume has increased and it is in a bullish sector right now.
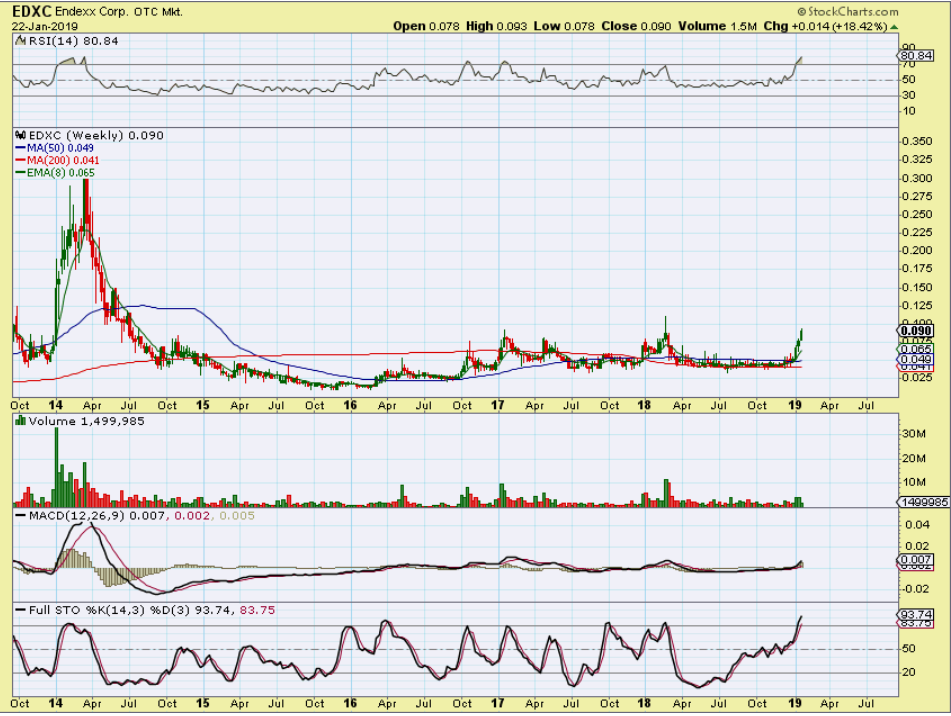
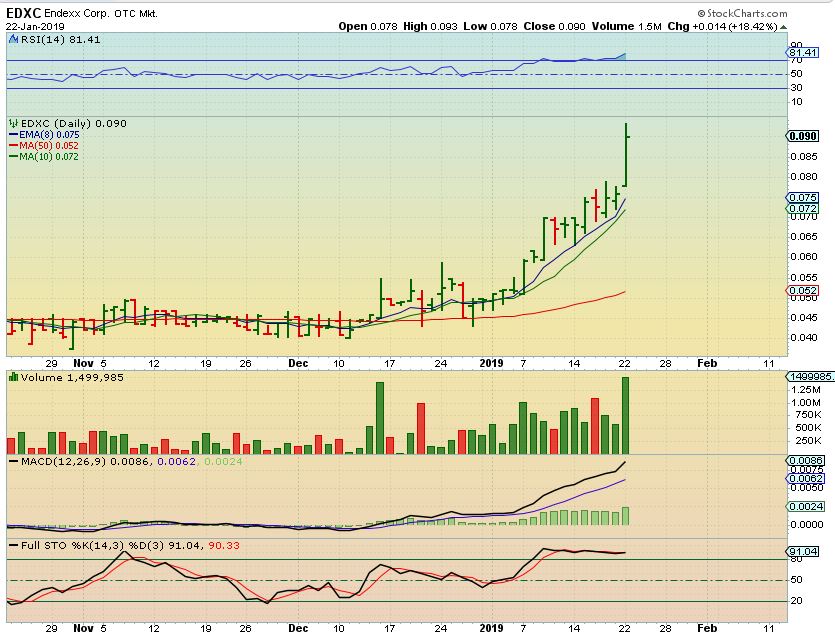
EDXC – Years ago I was reading about a company EDXC and their Phytobytes, a product of CBD infused dog treats to help dogs with Hip Pain, Joint Pain, and anxiety relief. I bought a large BUY & HOLD portion between 2-3 cents and added as it moved higher , but it has been forming a large base. Well, many readers said that they followed me over time, and now we see EDXC running again ( it has done this before). I have a hard time recommending it now, it is extended and buying here MIGHT cause you to ride it down again, but…
EDXC WEEKLY – I hate to get too excited, but I do love this Big Picture chart of EDXC. If it continues higher, the gains can be great, SO FOR THOSE THAT ALREADY Followed me in the trade, I just wanted to point out the potential if this one is ready to go. It actually rode the 200 weekly MA (red line) all through 2018, and that was bullish for the base. It was caught under it in 2015-2017. We may finally get the launch higher from here.