Thursday – Decisions And Risk Reward
As was mentioned in yesterdays report, a variety of the markets sectors have been climbing higher and trading has been excellent. Let’s examine our current markets…
,
This was in yesterdays report–
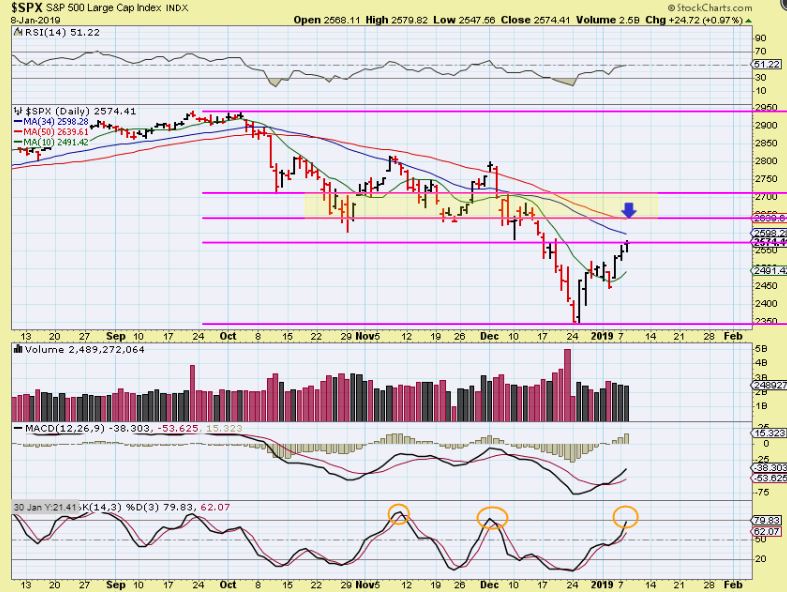
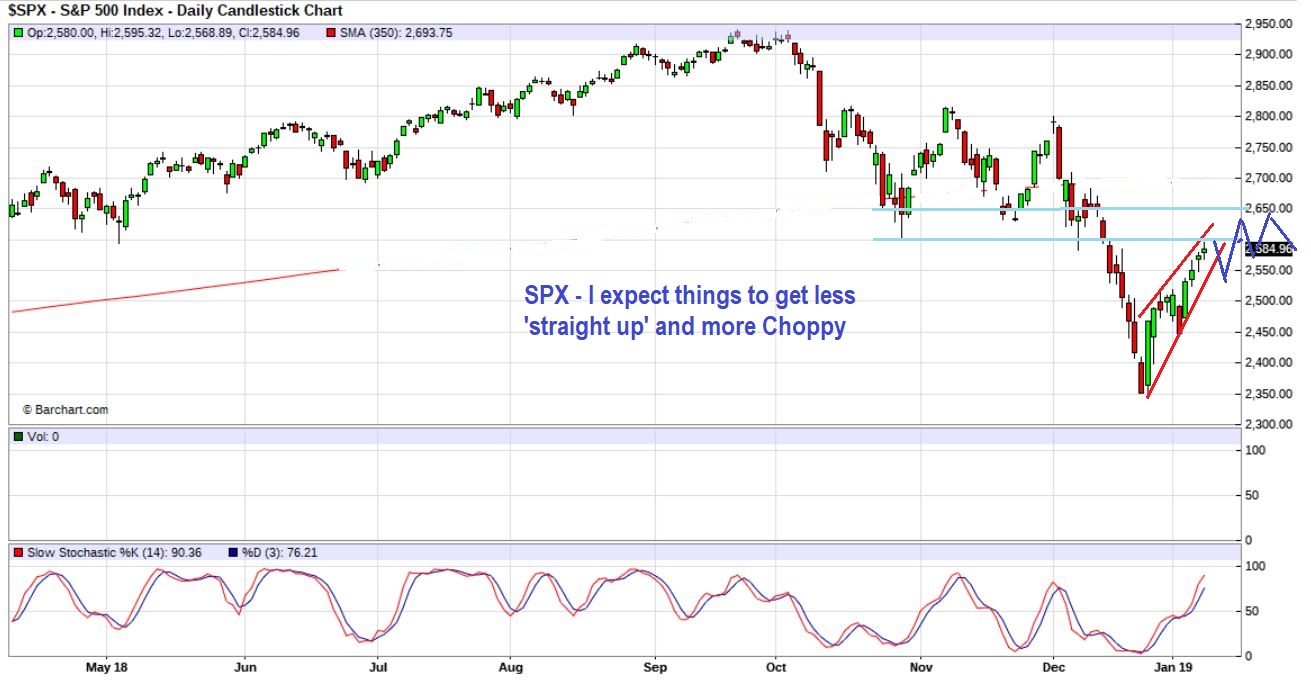
SPX #1 – If this is an ICL, we should have a month or two off of the lows, but we are seeing price enter ‘resistance’ areas. It CAN push higher, but we are nearing an area that may offer resistance and stall price too. The markets have been straight up, but going forward they may get choppy.
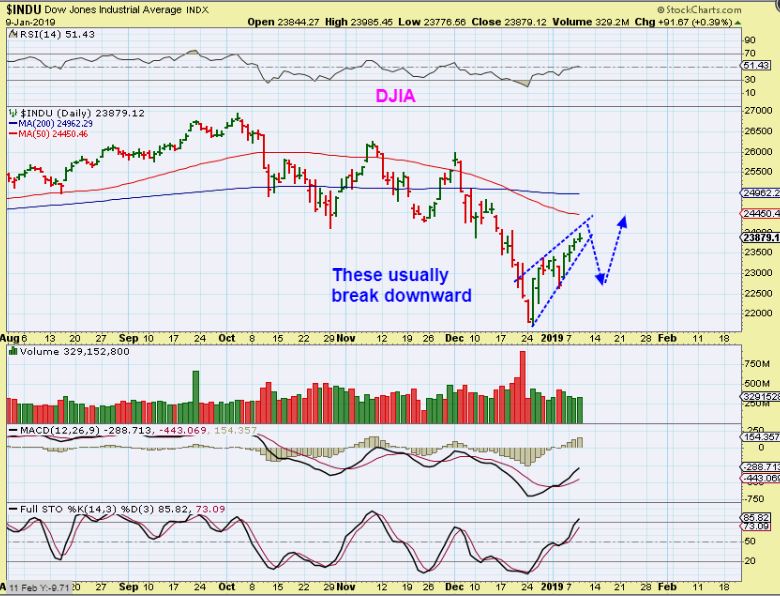
DJIA – This really looks like the run is almost ready to drop for a bit. I almost always see these rising wedges break down.
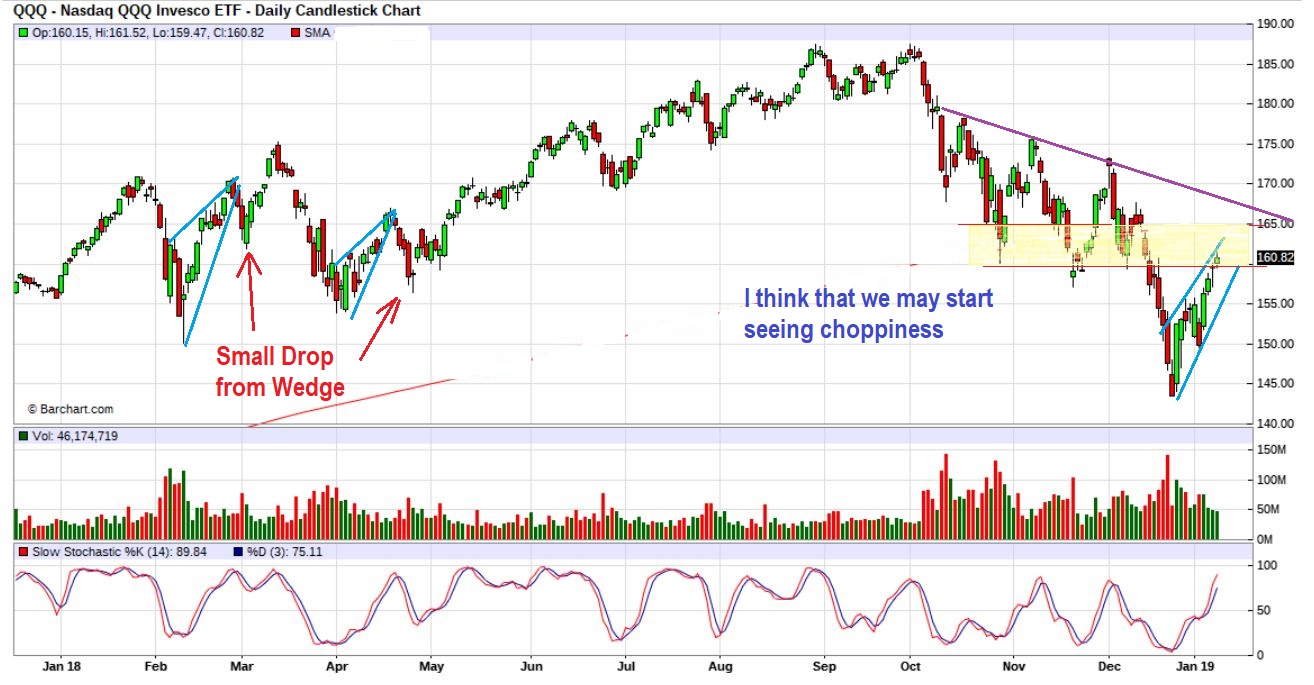
QQQ – I am also starting to see what look like rising wedges in The Nasdaq. This can push higher, but keep an eye on it. These can be short term bearish, and often break down, an example of this was seen last February and April.
SPX – We just recovered the straight down drop. There was no resistance there, so we ran straight up. As we hit resistance , things could get choppy. I expected a first daily cycle to be bullish, but it needs a bit more babysitting now, especially if you are leveraged.
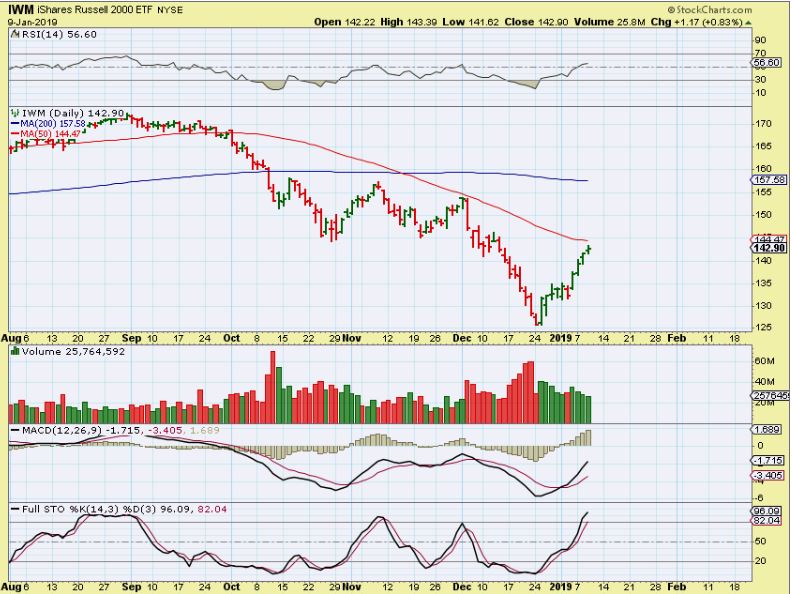
IWM – Watch the IWM for clues. It is ALREADY at resistance, so lets see if it is
1. Rejected at the 50 sma? Or
2. Stalls at the 50 sma and goes sideways? Or
3. Can it actually break out? It may give a clue to what the other sectors will do. The wedge on the DJIA looks ready to drop though.
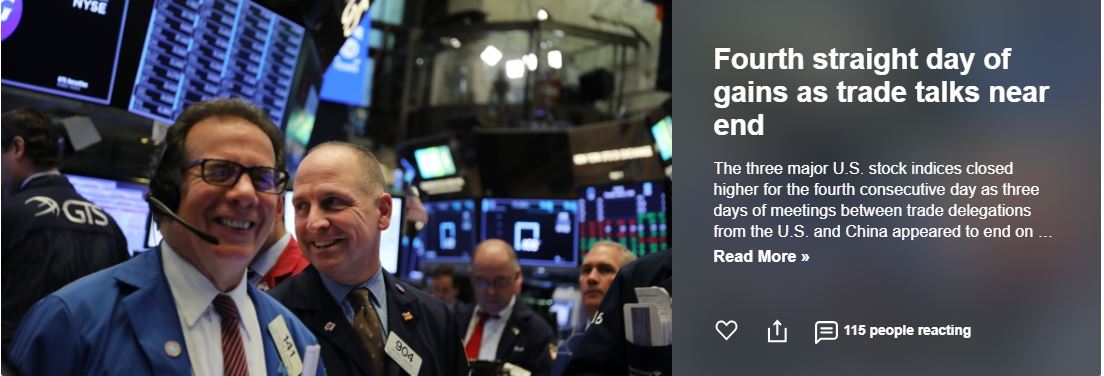
And of course: The Contrarian News may be starting. Smiling faces, Happy days again. I saw a LOT of crying faces and Scary articles right at the very lows. The ‘contrarian’ in me looked for a low then. I’m not thinking that we are at the top, but the contrarian in me sees this headline and thinks that maybe we start seeing some chop now?
4 straight days of Gains & Smiling faces! HEADLINE NEWS
SO SHORT TERM I WOULD EXPECT THINGS TO GET A LITTLE LESS STRAIGHT UP, AND A BIT MORE CHOPPY. IT IS STILL EARLY IN THIS DAILY CYCLE, SO I AM NOT EXPECTING A RESUMPTION OF THE CRASH YET, BUT WE REACHED RESISTANCE , WEDGES FORMED, AND IT COULD GET CHOPPIER.
.
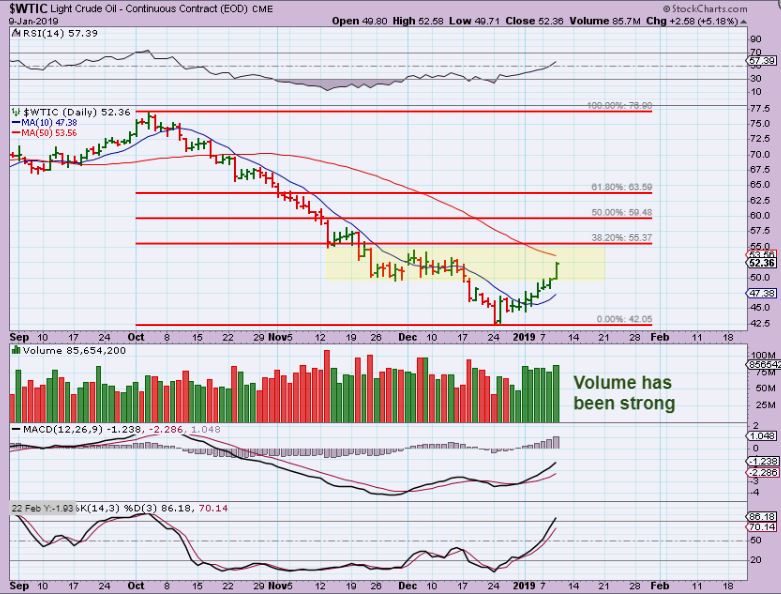
WTIC – I HAD 3 CHARTS POINTING TO OIL $52 as an area of possible resistance.
.
WTIC WEEKLY FROM YESTERDAYS REPORT – Resistance on the weekly is around $51-$52 too, so that is an area to keep an eye on. oil CAN move higher, this is just an area that I am watching for now.
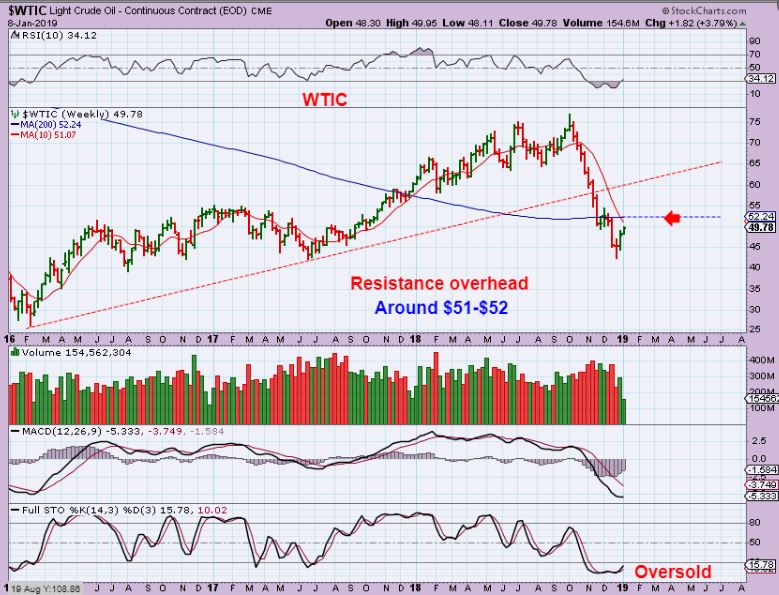
WTIC – Oil popped Wednesday and is now in the area that I mentioned to pay attention too. It actually looks very good and volume is strong, so for the ‘longs’ , I would just use a trailing stop or sell some & ride some. I sold my GUSH already, I may add it back on a pull back.
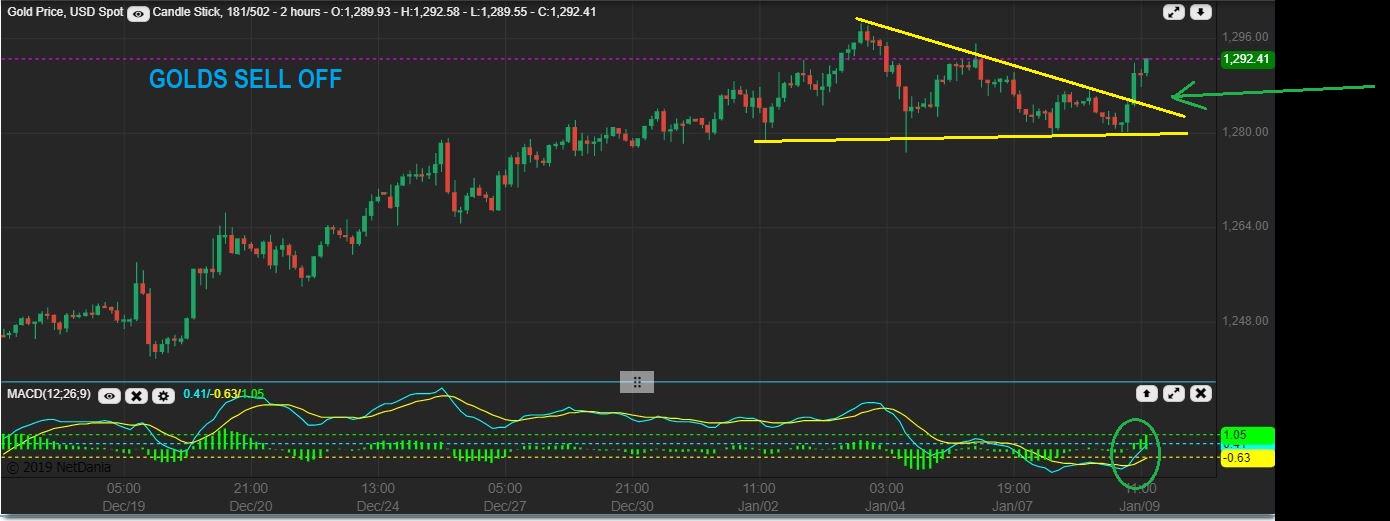
GOLD INTRADAY BULLISHNESS – Gold was down pretty good in the morning, but again, golds sell off forms a bullish wedge and was bought back up. I posted this live shot in the comments to show that Gold is still “Surprises to the upside“! Don’t even think about shorting the yellow metal lately. This pattern looks like Gold wants to run back to the highs.
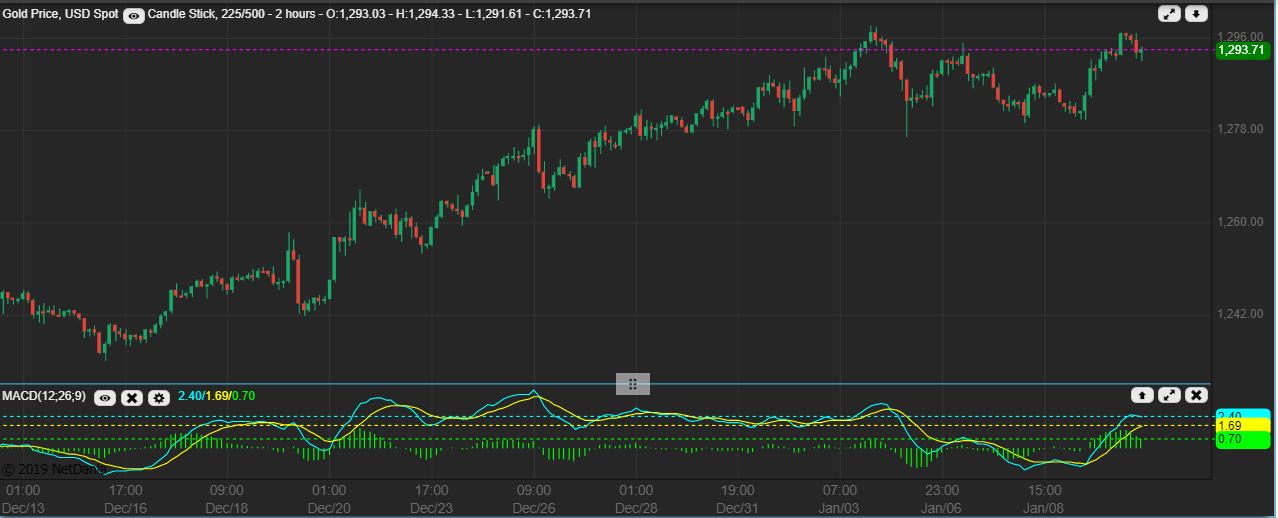
UPDATE : GOLD LIVE 6:30 AM Eastern- I WRITE THE REPORTS MOSTLY AT NIGHT, AND PROOF READ IN THE MORNING. THIS APPEARS TO BE A CUP & HANDLE FORMING IN GOLD RIGHT NOW. This is a bullish pattern that makes it seem that Gold will just continue to melt up higher.
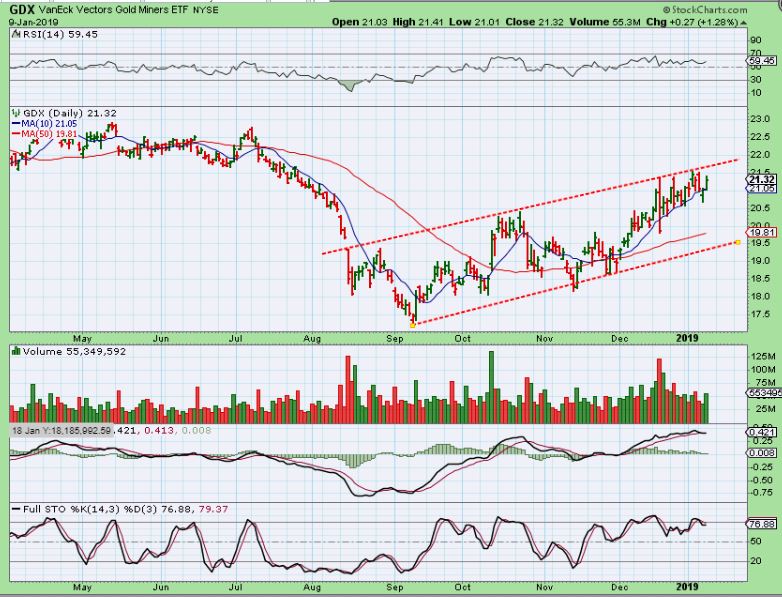
GDX – And nothing has changed here either. It is very choppy day by day, but still climbing the 10 sma & riding along the upper channel.
.
TALKING ABOUT THE MINERS AGAIN
.
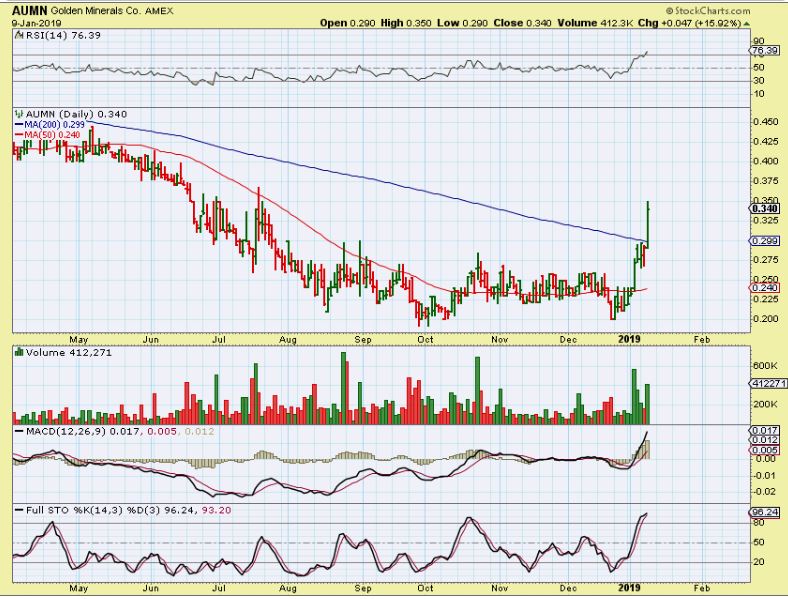
AUMN #1 – When I discussed why I bought AUMN, I mentioned that I have traded this one in the past and it has a ‘personality’ that Flares up & flies under bullish conditions. I bought it in the base moving above the 50sma. After a POP, it was flagging under the 200sma, so I posted this 1 hour after the open Wednesday, it was bullishly breaking out already (small flag) .
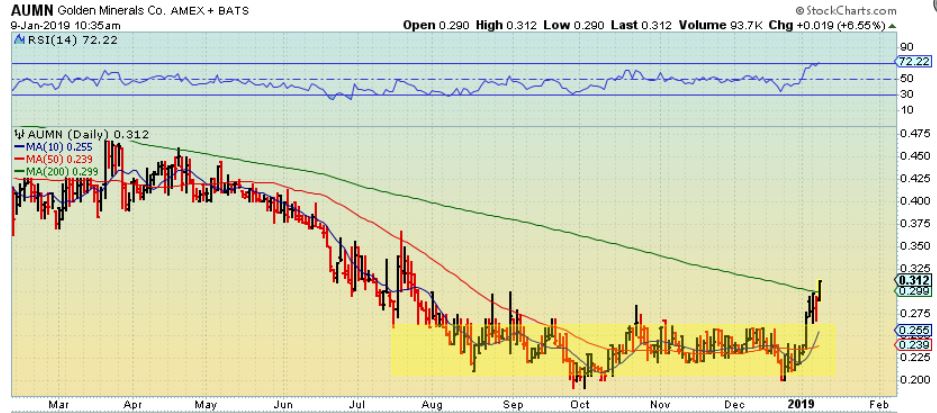
AUMN #2 – It actually ran up about 20% & closed up 16% Wednesday. AUMN always seems to move very quickly. It may back test that 200 sma in time, but this is one that I may just ride now. Under bullish conditions, AUMN usually acts quite Bullish.
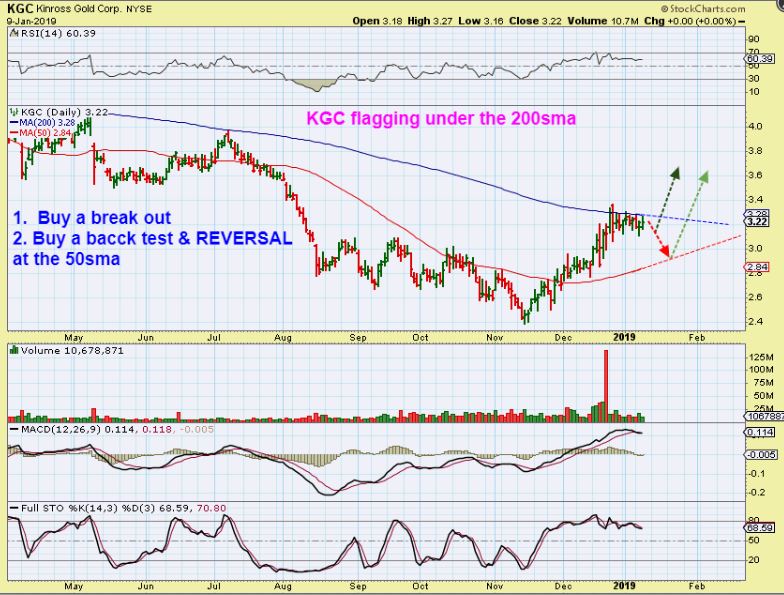
KGC – This was actually supposed to go in yesterdays report with the other Miners that I wanted to point out, but that’s ok, because …
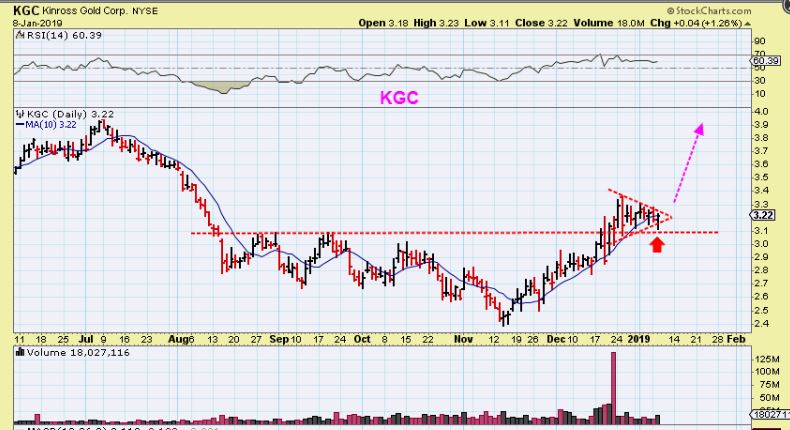
KGC – After Wednesdays trading it is still a bull flag, and I noticed that it is pushing on the 200 sma. Please read the chart. It may do what AUMN just did at the 200 sma, or it may back test the 50sma .
,
So trading has been really good in many sectors and as of right now, the market sectors continue to climb that wall of worry. They may take a rest at points of resistance, but I dont think that the climb is completely over yet. I do personally tend to take profits on leveraged positions, or I at least cash in on a partial position, as hard as that is when things are going good.

.
Enjoy your Thursday trading, Several charts from yesterday and other reports are still active, and I have a few more charts below.
.
~ALEX
,
ENPH – In yesterdays report, ENPH did get a little follow through, but I would still consider this a buy when I look at that big picture. This doesn’t follow the market, but if the markets pull back, this MIGHT back test and allow another low risk entry on support too.
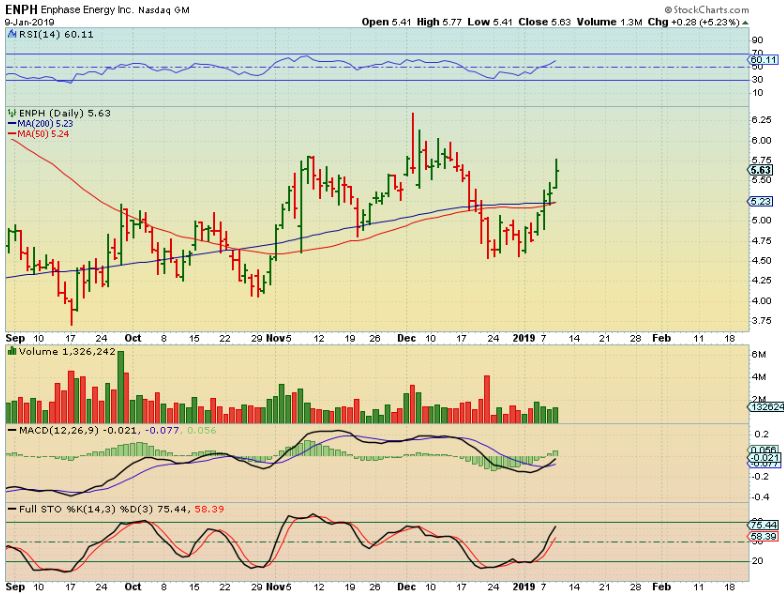
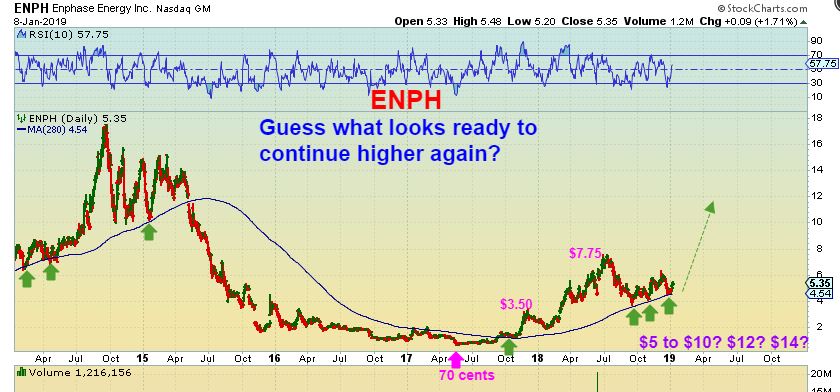
ENPH Big Picture from yesterday – Our old friend ENPH, which has made me some good steady BUY & HOLD gains in the past, looks bullish again. Let’s zoom in…
.
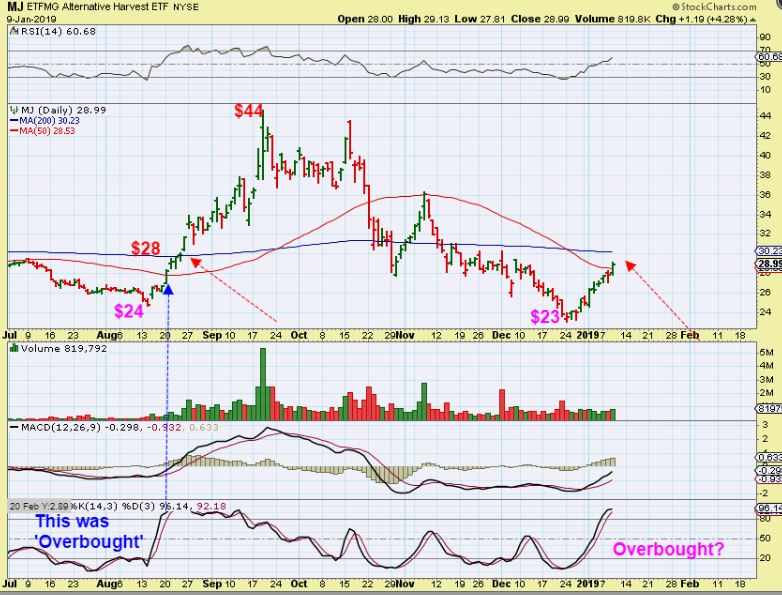
I have been discussing how the MJ sector seems to be setting up, and MANY of those stocks are doing very well. One after the other continues to POP & RUN.
.
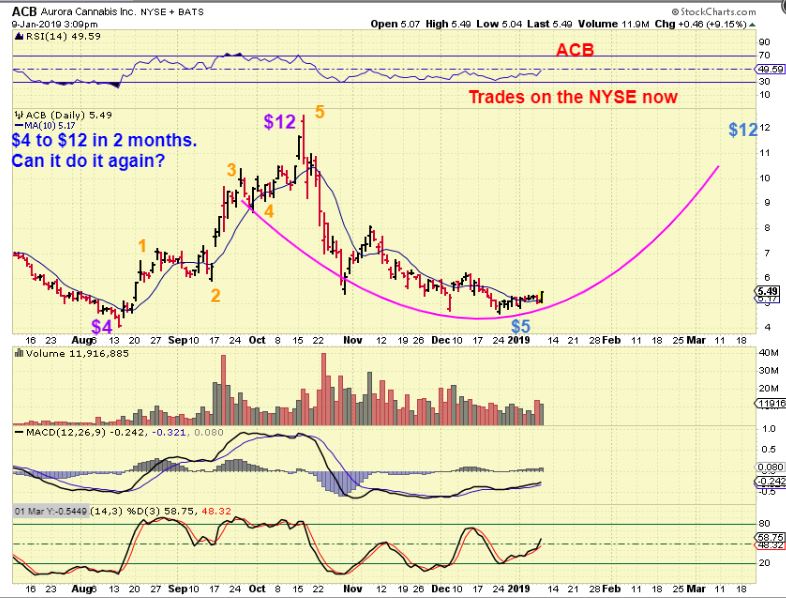
MJ ETF – The MJ ETF trades on the NYSE, it has moved from $23 to $29, and broke above the 50 sma. In August it ran in a similar manner, from $24 to $44. It could be bought with a stop under the 50sma, or put on a watch list and buy as it moves over the 200 sma. One cautionary note is that we had a similar run in October, but then it rolled over at the 50sma. The run in August & the current one has MJ breaking through the 50sma. In August it broke above the 50sma & just kept going through the 200sma too, so that could repeat now. You’ll need to keep an eye on it, but this sector has been HOT with all of the new legalization going on, and when it runs, it can run swiftly.
ACB #1 – I captured this chart after Buying ACB Wednesday morning. I saw volume flowing in and intraday charts were looking good. Smaller time frame set ups were Bullish, so I just bought it at these lows.
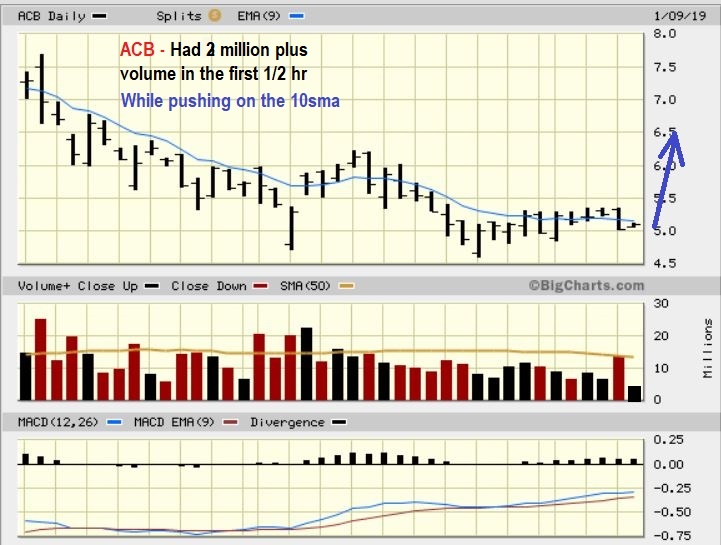
ACB #2 – By the end of the day it was up 10%. It has Great Potential longer term. Look at the Aug – Oct run, 1-2-3-4-5 from $4 to $12. I would love to see this repeat, but I’ll just take whatever I can for now 🙂
.
I also posted that I bought NBEV, but why?
.
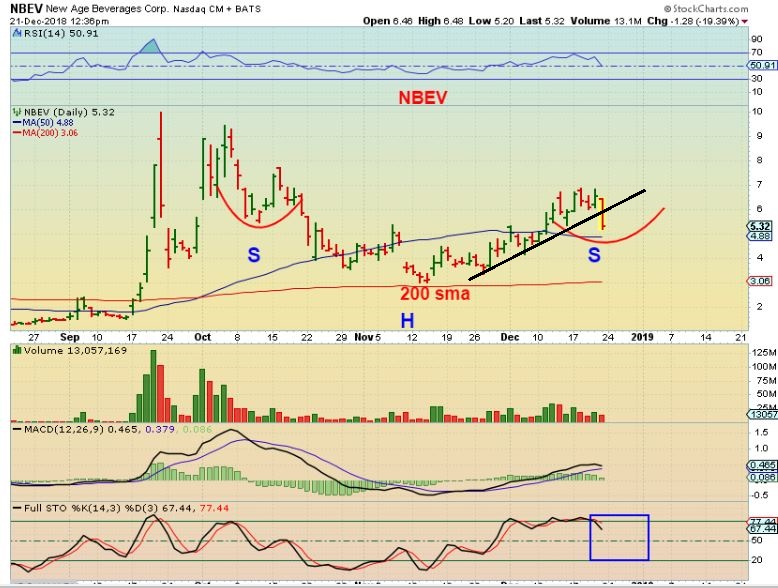
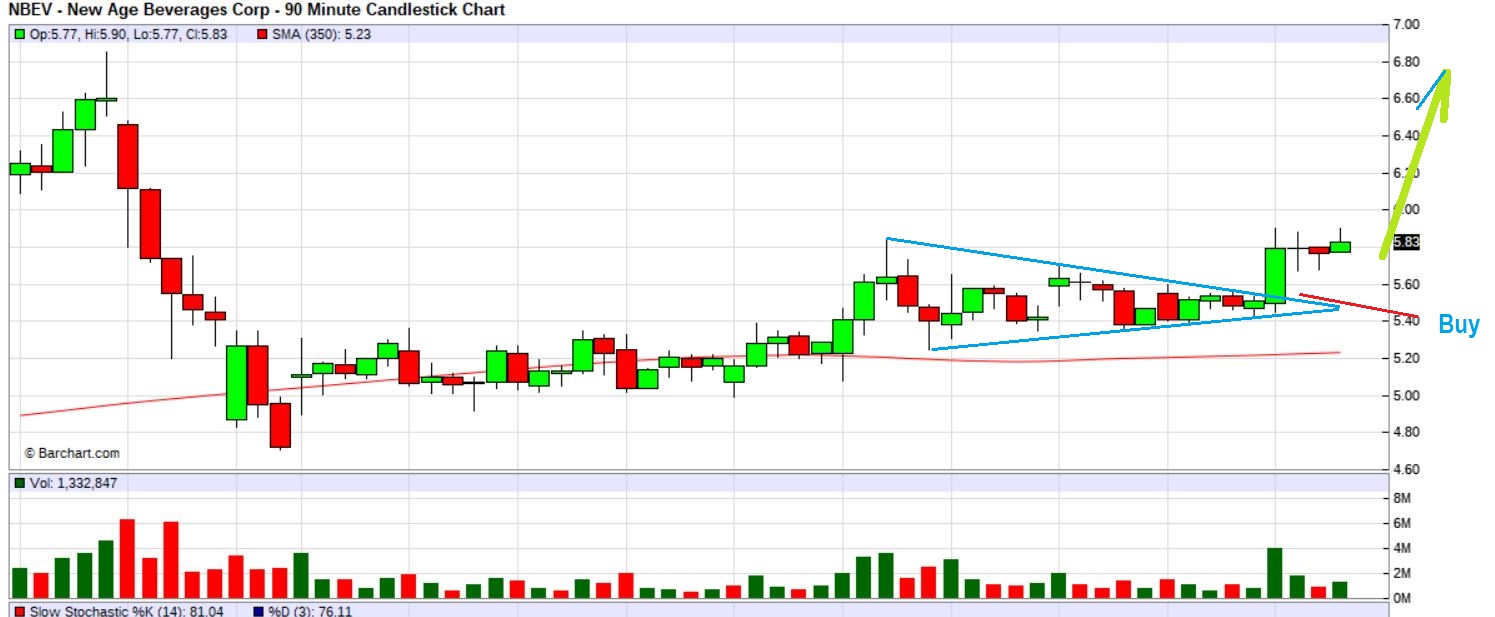
NBEV DECEMBER 21 – Back on Dec 21, NBEB broke down through an uptrend and notice that it was Overbought . I mentioned that it is possible that the 50sma would support it, it could go sideways, and form an INVERSE H&S as drawn here. If so I would re-buy it, because this too ran swiftly. Well guess what?
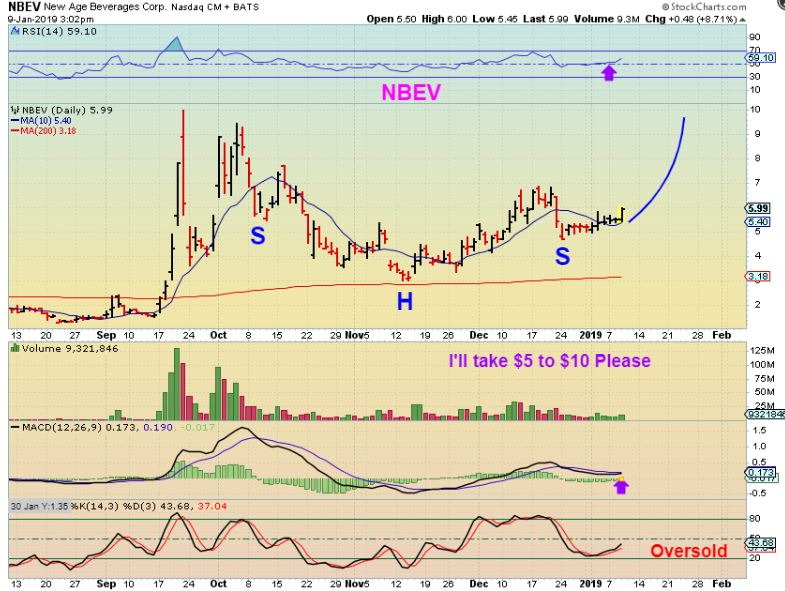
NBEV – no longer overbought, it is oversold and did form an inverse H&S, so I have been watching it daily as it rode along the 10 sma, and …
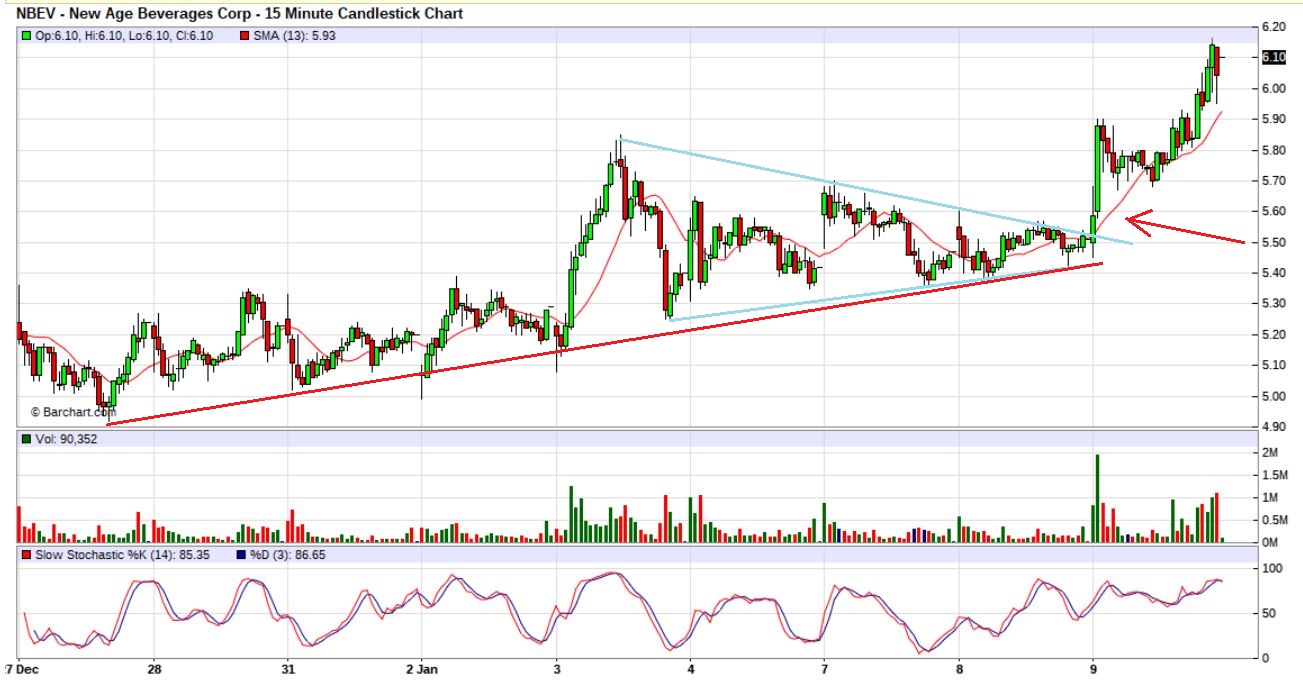
NBEV – INTRADAY I watched a triangle form along a support line . It was at he APEX at the open yesterday and as it broke out I jumped in. I posted this to show that I would also like to ‘add’ on a possible back test, but…
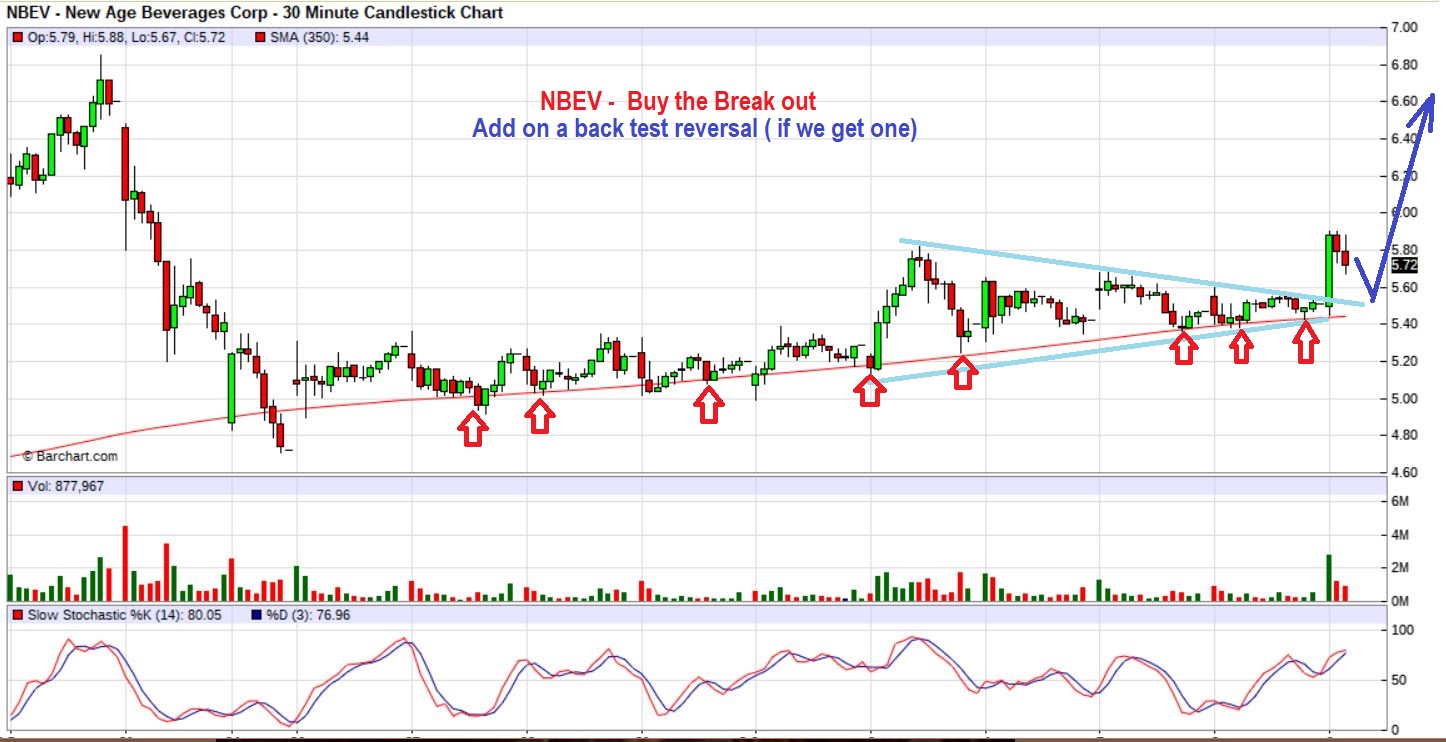
NBEV – It flagged sideways by midday, so I just ‘added’ again and mentioned it in the comments. This too then broke even higher…
Finally, By the end of the day NBEV had run up 11% and closed at $6.10. The sector is acting correctly.
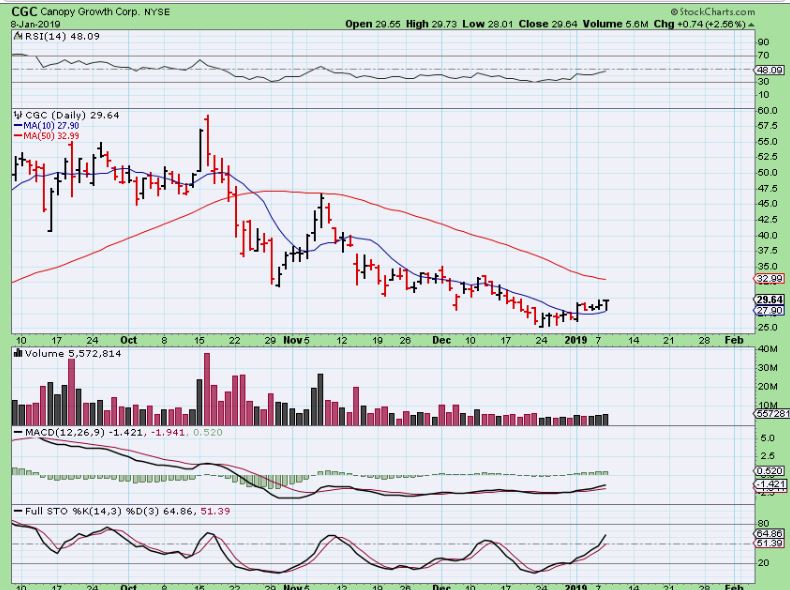
CGC – Jan 8 saw CGC drop to the 10sma and reverse higher again. The 10sma acted as support…
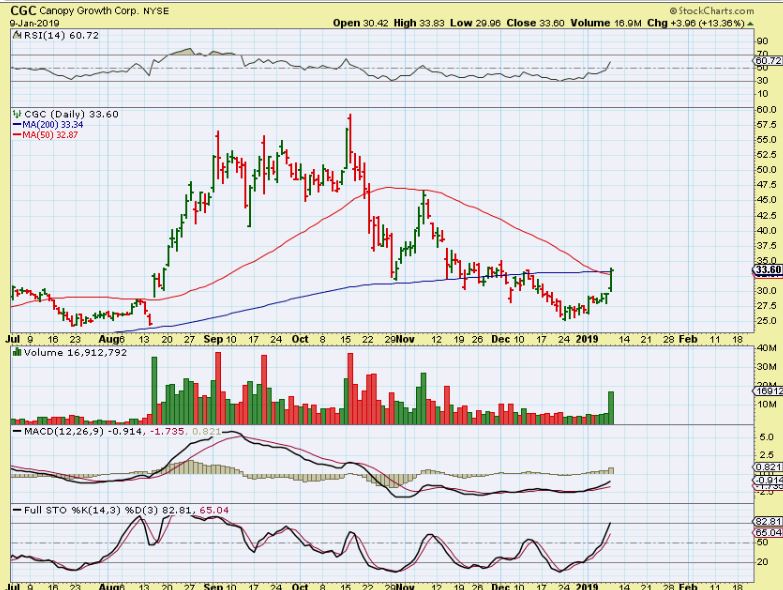
CGC – On Wednesday volume surged and gradually moved up over 13%. This was lagging a bit in the sector, but may now play catch up. It is trying to break through double resistance, which then should act as support if price can move higher.
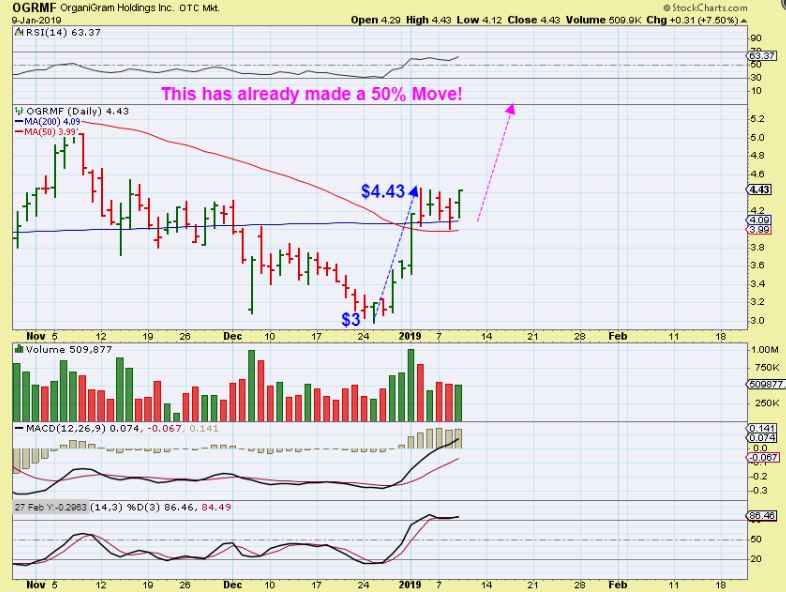
OGRMF #1 – I mentioned OGRMF, SPRWF, NXTTF, etc when they started running out of the lows over a week ago, because the whole sector was catching on fire. This was first a buy as it broke the down trend or 10sma at $3.20. It then ran 50% in 5 days. That is a bull flag and also can be bought as it holds support ( Stop under support)…
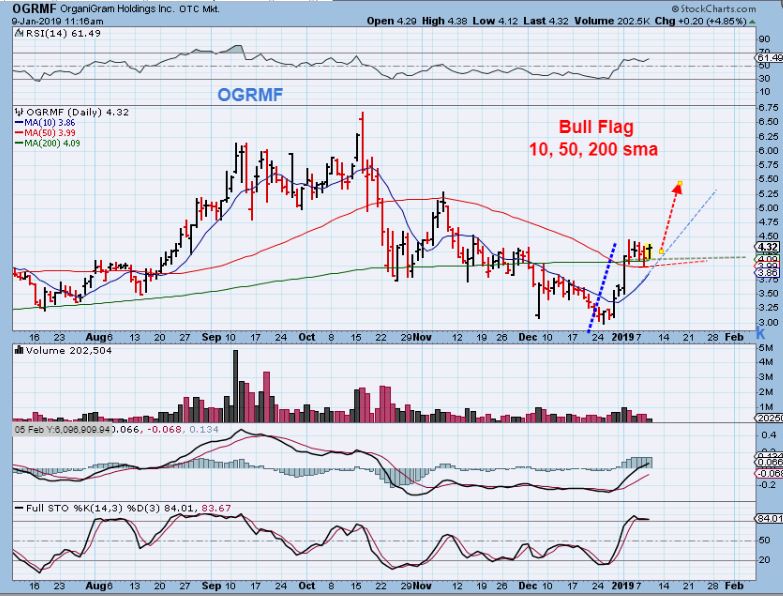
OGRMF #2 – Again, It ALREADY moved 50% in 5 days and remains bullish looking as it flags above the 50 & 200 sma. It is a buy here again, use a stop under support.
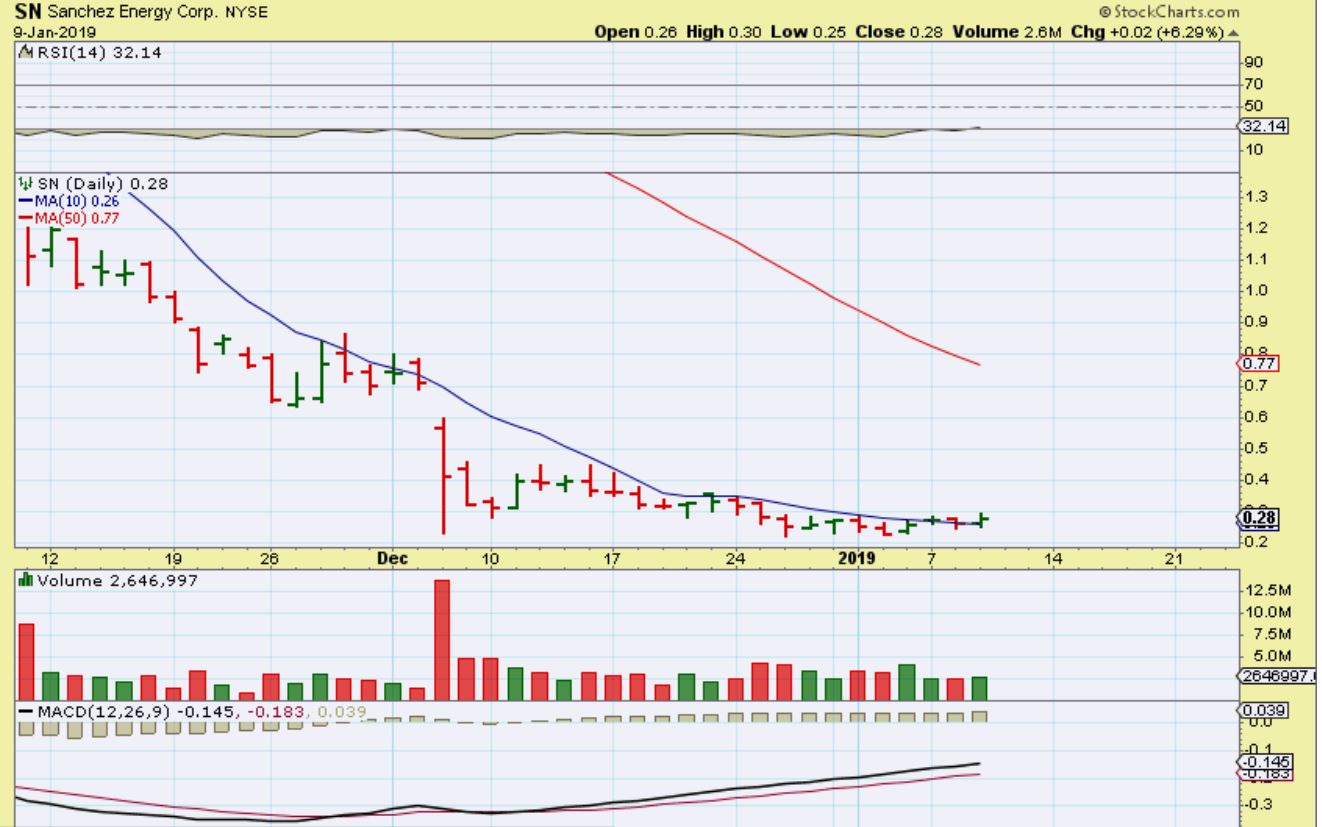
SN – High risk, High reward. This energy stock crashed recently and has capitulation volume at the lows. It then formed a base. If SN takes off from here, I can see it easily doubling from $0.28 to $0.70 at the 50sma. It is risky though, they have been notified of possible de-listing soon from the NYSE, but they do have time to prove themselves. This look ready to go, so our day traders can keep an eye on it.
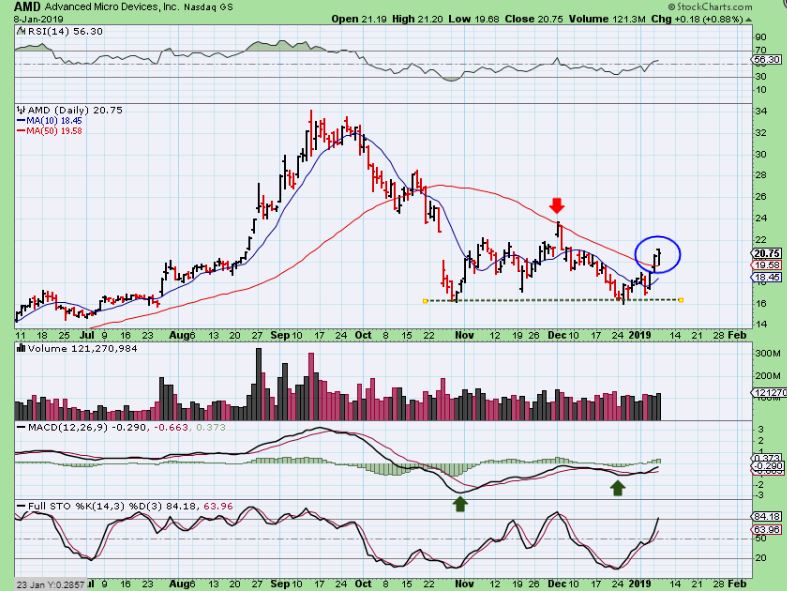
AMD – AMD was a double bottom ‘buy’ and I mentioned it as a buy when the markets bottomed. I was asked yesterday , “Would you sell AMD yet?” I dont think I would sell yet. I see it as breaking out here and…
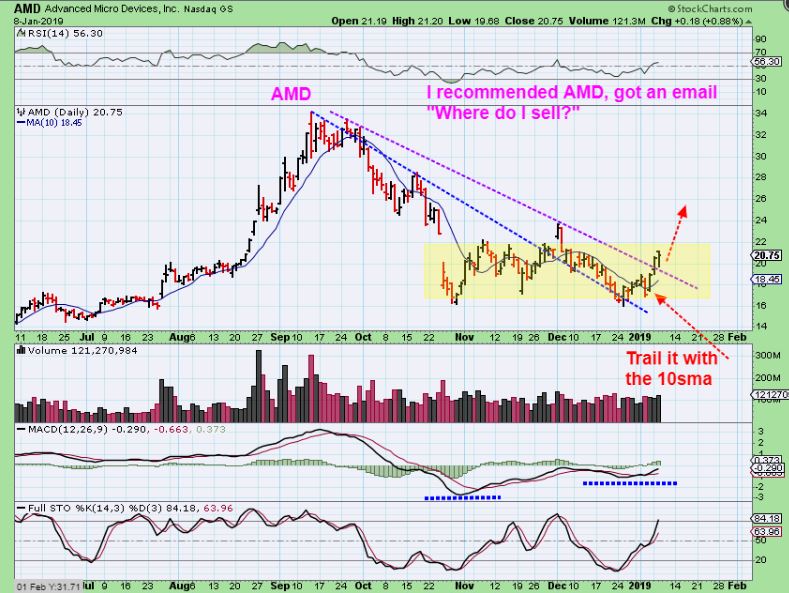
AMD – It is now Closing above the 50sma, so I would raise my stop and probably let it run. Some individual stocks can run higher , even if the markets get choppy. This may be one of them.
SIDENOTE: I have had a large number of stock picks in the past several reports. I always recommend that you write them down ( maybe on a post it note) and keep a watch list. If they continue to set up properly or break out, you take a position. If they break down, you can put a note on the watch list that it needs more time or ‘failed to perform’ and cross it off, etc.
.
My post it note has had me watching NBEV, UBX, GH, VIPS, KGC, HL, CDE, SA, BLOZF, CGC, ACB, ALEAF, and so many more. I just write a small note near each one daily, like * Not yet ,or *Almost ready , maybe even *Watch the volume….then I share them with you, but by watching them on your own, maybe you can catch them early too.
.

