Weekend Report- Things Gradually Change
We have all seen changes take place in various places during our lifetime. The Theme picture highlights how things have changed from your parents day to today, or maybe even your youth to today. Changes can be gradual or sudden, and in the markets we have seen both gradual changes in character to sudden sharp change in market direction and sentiment. Bull to Bear and Bearish to Bullish. As we review our Big Picture of the Markets, we can keep the idea of those types of ‘Changes’ in mind.
.
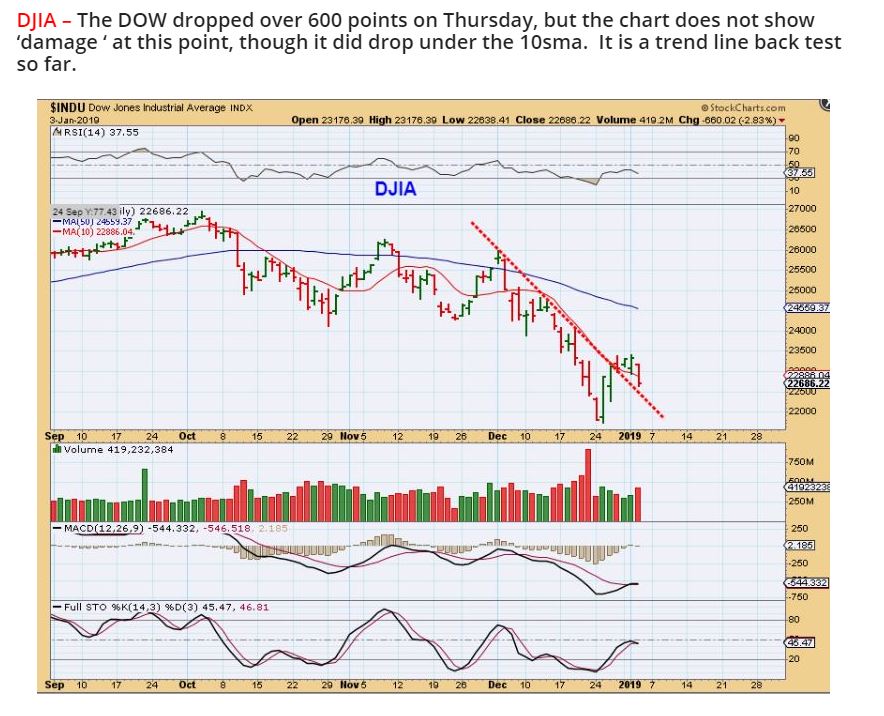
The 600 Point drop in the DJIA Thursday did not concern me. We caught the lows and I posted this after Thursdays trading…
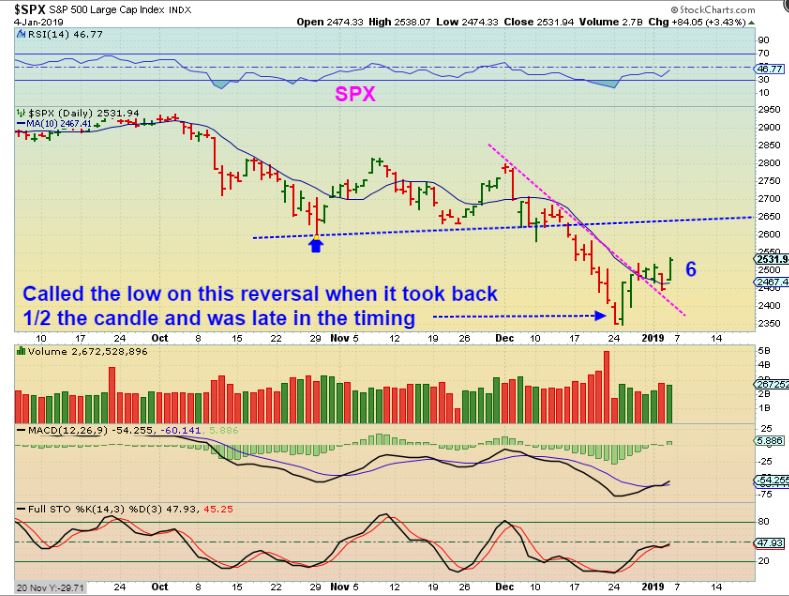
SPX DAILY – We caught the lows with Decembers reversal and day 6 flipped higher off of the trend line & had nice follow through. I WOULD SAY THAT YOU CAN NOW RAISE STOPS TO THURSDAYS LOWS TO BE SAFE. The blue line resistance can be broken, I just drew it to show where we may stall.
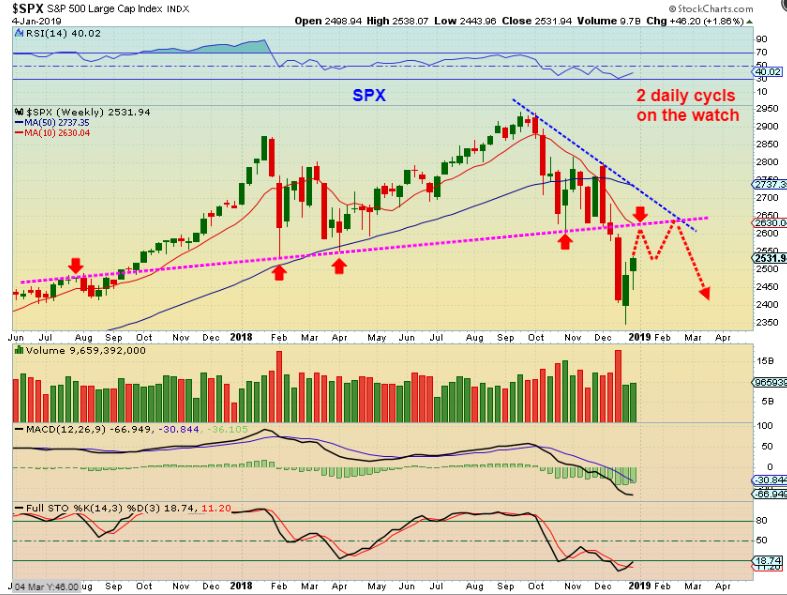
SPX WEEKLY – The weekly chart now has a swing low. I remain alert to resistance points and the possibility that the next couple of daily cycles may become choppy & stagnant in the BIG PICTURE view. Since this is still oversold, it should play out further. That is why I said that we can look at the next daily cycle or 2 as it plays out. We can watch for a V-Bottom or a choppy low as time goes on.
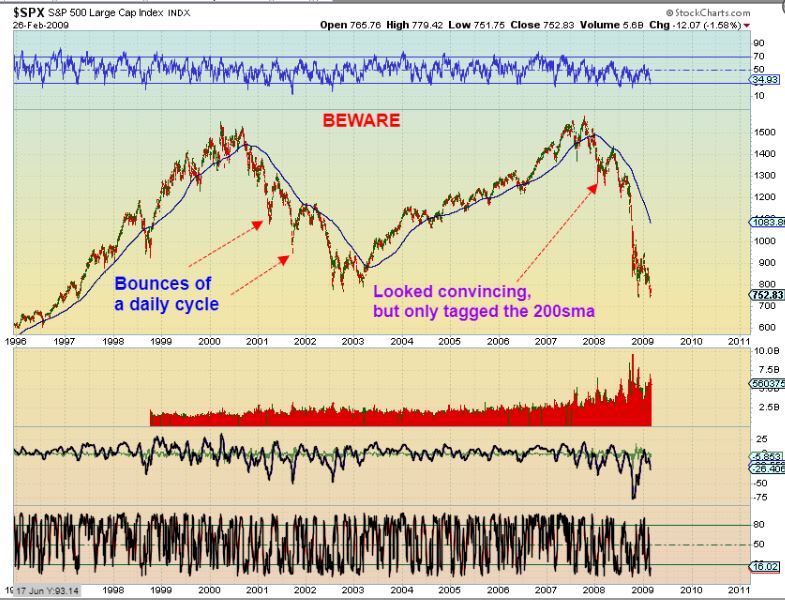
IMPORTANT: SPX 2000 & 2008 Drop – This is just to show that the ‘Rally” after Both the 2001 & the 2008 drop began may have looked Bullish and convincing, but it was ONLY 1 DAILY CYCLE to ‘peak’ and bear market drops took over. The 50 Weekly MA was the peak. I will be watching that closely. Look at that 2008 crisis drop.
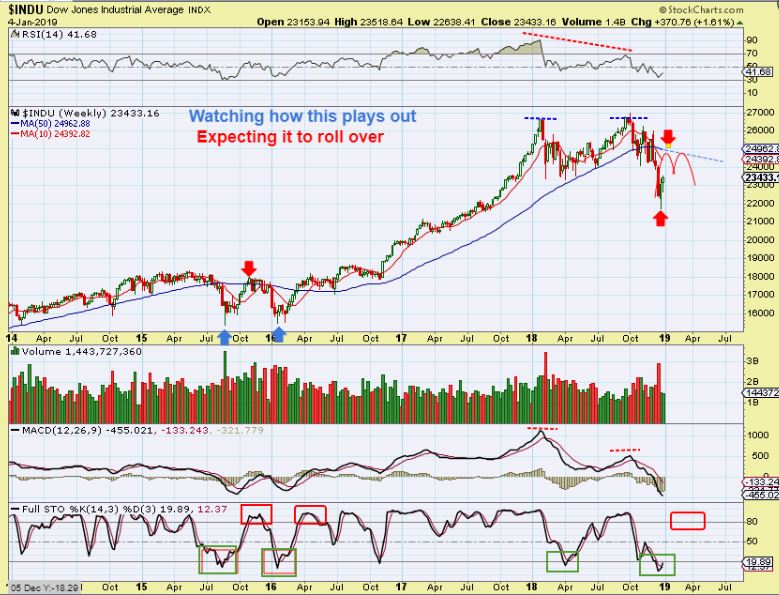
DJIA WEEKLY POSSIBILITY – I have pointed this out as something that I am watching for if the Bull Market is done. It may be as ugly as 1 daily cycle & then the 2nd peaks quickly & rolls over.
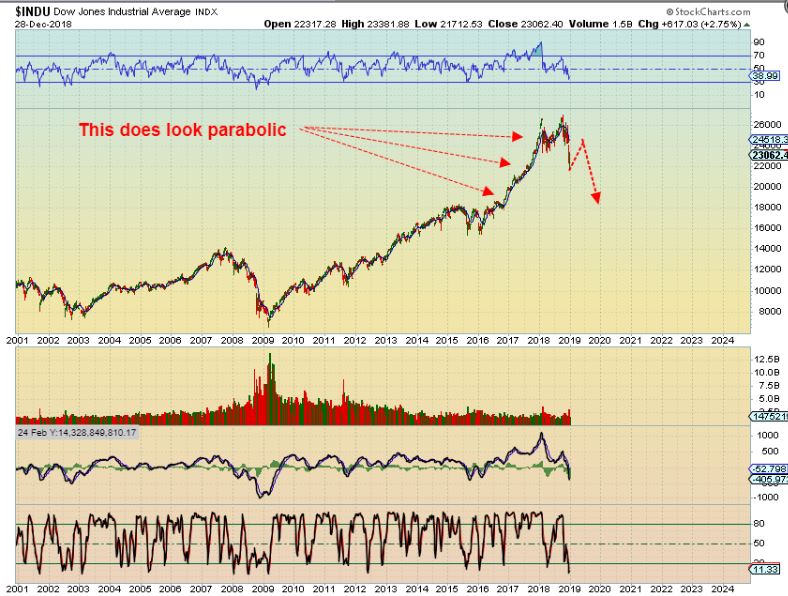
DJIA FROM LAST WEEKEND REPORT – This bounce may begin to look convincing, but remember the Theme of Gradual and Sharp changes? They can take us by surprise. I will keep this idea in my reports so that any rally now is viewed as a possible multi-week bounce that can ‘change’ and roll over.
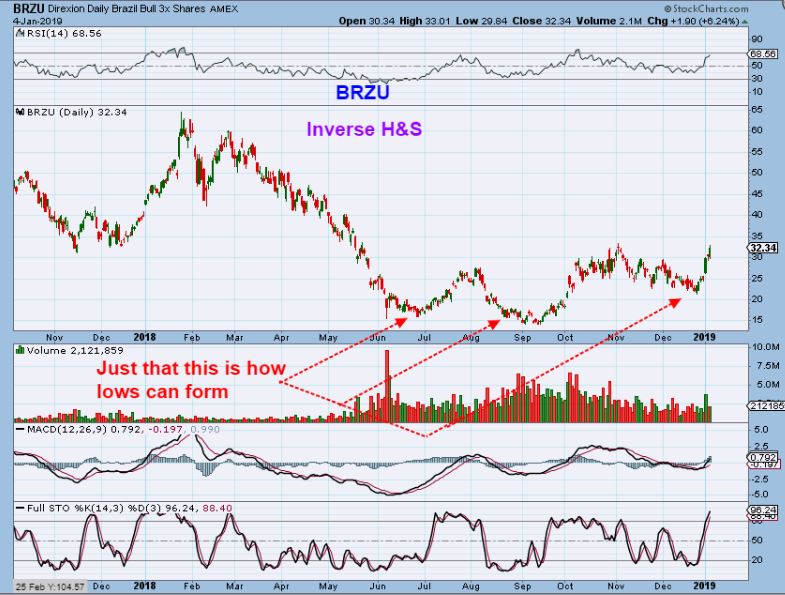
BRZU – I mentioned that BRZU is breaking higher out of an inverse H&S bottom, but I want to show this for another reason. AFTER THE BIG 2018 sell off, look how the ‘Bottom’ formed. Each rally ( like we may be seeing in the General Markets now) can bounce yet give up the gains. This is why we raise stops. Who really wants to ride this for 7 months and gain nothing? This 3x etf has doubled twice & gave it all back the first time.
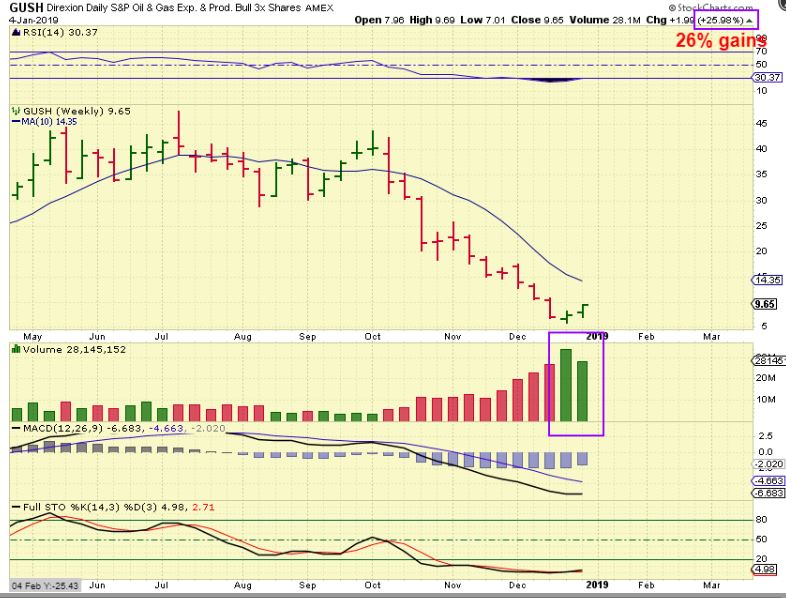
WTIC WEEKLY – We caught the reversal Low over a week ago. It still could use some follow through, but short term gains in energy stocks and 3xetfs has already been pretty good. Oil itself is tricky at the lows. Why do I say that?…
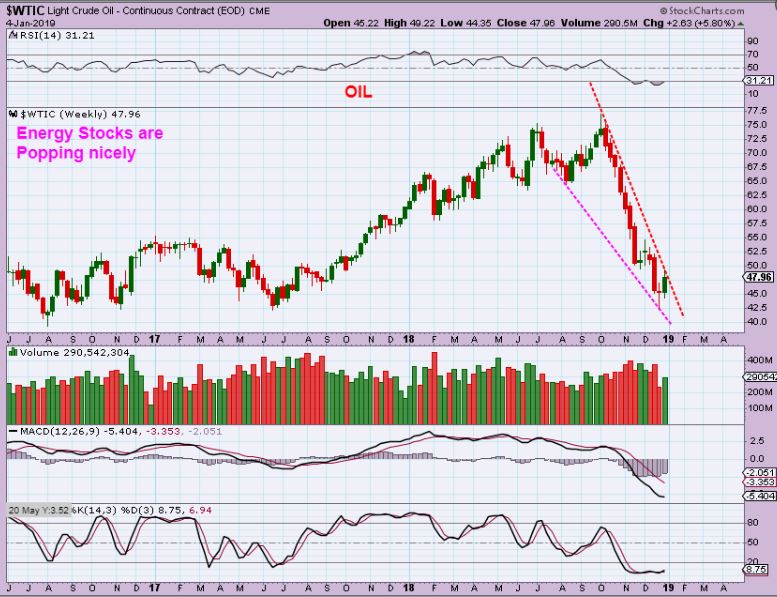
I put this in a prior report. Many lows were somewhat short lived, maybe 3-7 weeks, others blasted off.
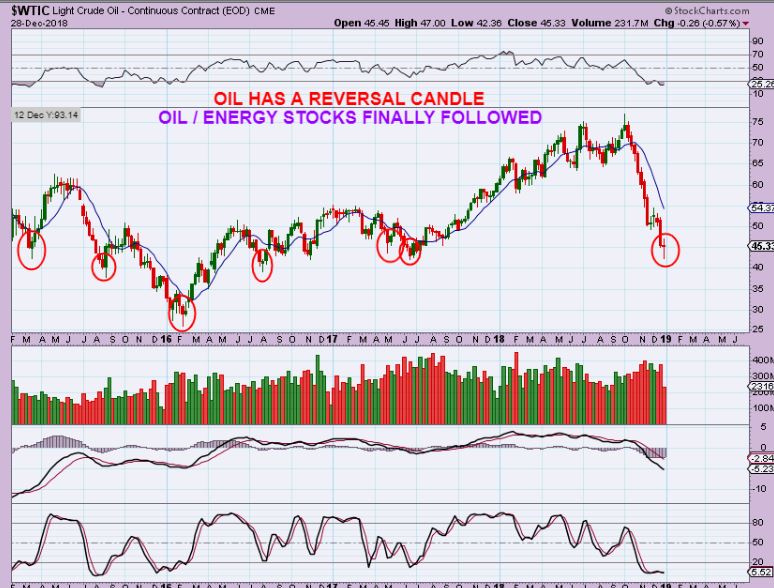
LAST WEEKEND – We would look for follow through and I was buying Energy / Oil stocks ( GUSH, OAS, DNR, QEP , etc) on the reversal.
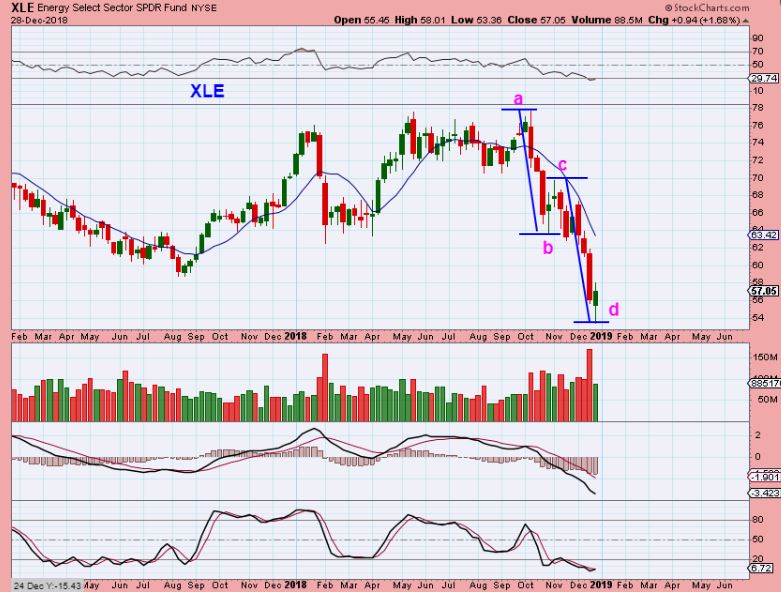
XLE WEEKLY – Nice follow through, we caught the lows here too.
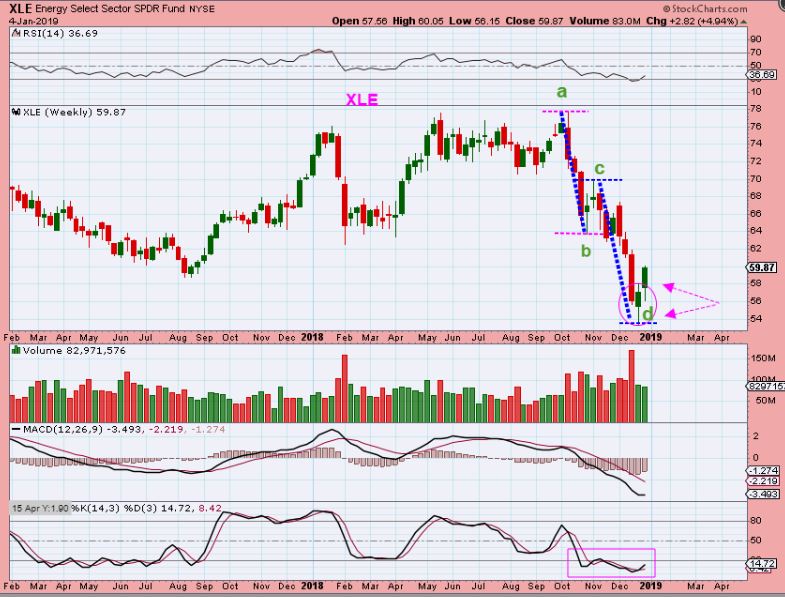
I bought GUSH fairly heavily, and mentioned buying GUSH or OILU, UWT – GUSH gained 26% this week alone. OILU & UWT gained 21%. These are great gains, and a stop at the lows was protection if needed. GUSH closed at the highs, the sector remains very oversold, so I am still in it.
It dropped for 11 weeks or so, maybe it can at least bounce for 5 🙂
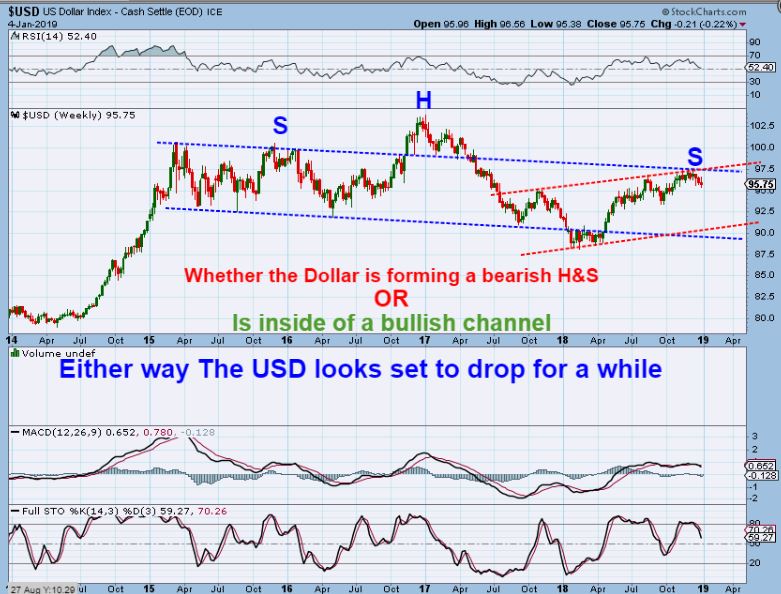
USD – On a daily, the USD could bounce, but Big Picture I have pointed this out. Read the chart please.
.
WHAT I HAVE SEEN IN THE PRECIOUS METALS SECTOR IS SURPRISING, WITH VARIOUS ‘SECTIONS’ OF THE PRECIOUS METALS ACTING QUITE DIFFERENTLY, AS YOU WILL NOW SEE. I THINK THAT THEY WILL ALL SYNC UP IN 2019. THE BIG PICTURE LOOKS EVEN MORE PROMISING AS OF THIS WEEK. Let’s Review…
.
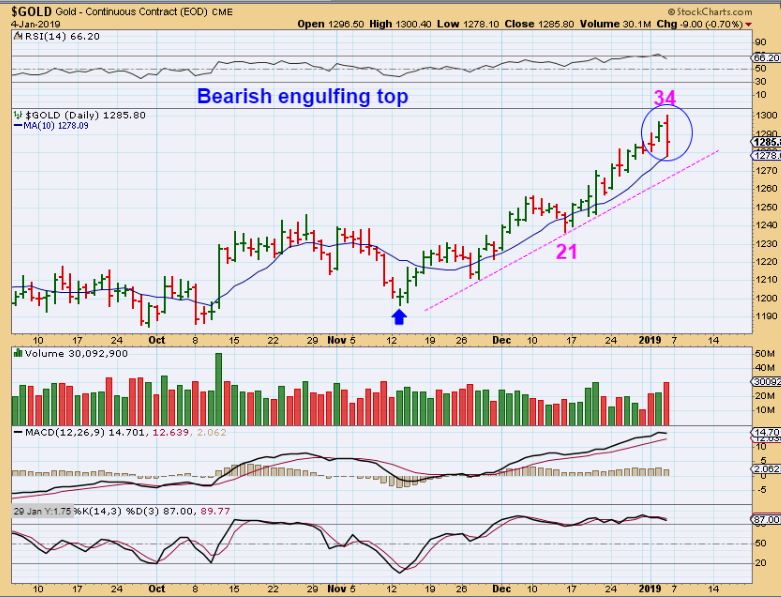
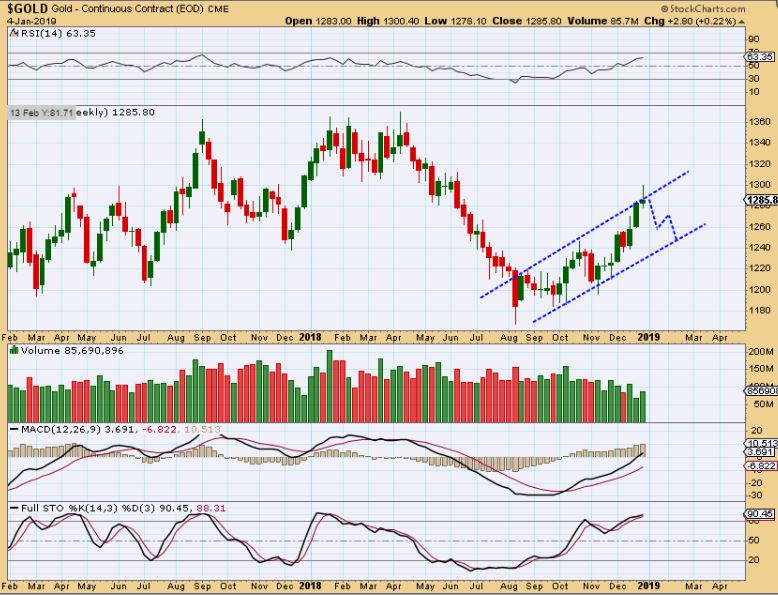
GOLD DAILY – Finally on day 34, Gold has a high volume ‘bearish engulfing candle’. I would have to expect a little follow through down, since we are on day 34. That was a nice run.
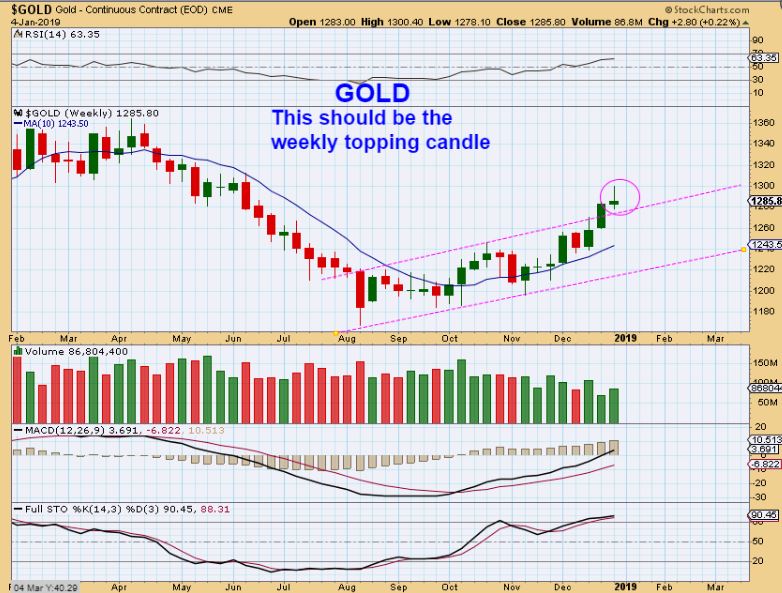
GOLD WEEKLY – The weekly also has a bearish reversal candle. When I say ‘Bearish’, it just means to expect some downside, but it does not necessarily mean a massive sell off. To help you see this, We had one in Mid October at the October highs too, for example.
GOLD – I could draw a ‘guess’ like this. A quick dip to a dcl. A last daily cycle bounce, and one more dip to a higher ICL. My next chart is going to help you see this better, because the next chart actually did EXACTLY what I was expecting Gold to do. Very interesting!
.
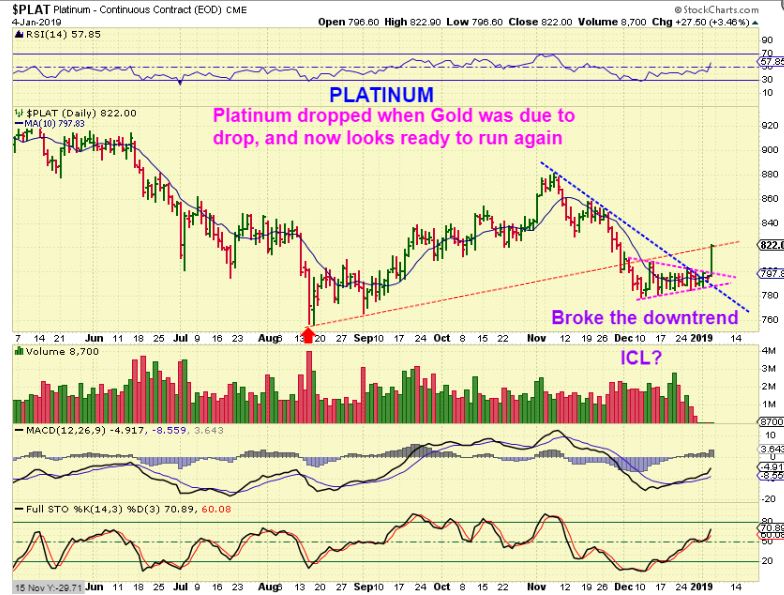
PLATINUM – Hmmmm, This is quite surprising to me. THIS IS WHAT I EXPECTED GOLD TO DO! We see that Platinum…
-
Followed Gold higher out of an August ICL
-
Dropped when Gold was due to drop in November
-
Broke the red trend line to signal a drop to an ICL
-
Surged out of a triangle low Friday, and broke the blue down trend line
-
That looks like a higher low ICL. This is EXACTLY what I expected GOLD to do, ICL to ICL!!
.
ALLOW ME TO DO A SUMMARY OF WHAT WE HAVE SEEN IN THIS SECTOR OVER THE PAST FEW WEEKS. IT IS VERY DIFFERENT FROM WHAT I HAVE SEEN IN OVER 20 YEARS OF TRADING THIS SECTOR, AND I FIND THAT QUITE INTERESTING.
.
SUMMARY:
1. GOLD ran out of the AUGUST ICL and never dipped yet, 4-5 months out of an ICL, yet…
2. Platinum Acted like a normal Bull run with an August ICL to what looks like a higher low ICL. This is exactly what I expected GOLD to do.
3. Silver never got off the ground for 4 months, until a bit over a week ago!
4. Gdx started to follow Gold while GDXJ (juniors) Hung down at the lows with Silver, until last week. Honestly, THAT IS A VERY DIFFERENT SET OF CIRCUMSTANCES FOR THIS SECTOR THAN I HAVE SEEN, but it all looks like different ways to form a lasting LOW in the precious Metals sector. A low that could be very profitable in 2019.
.
DO YOU SEE HOW CONFUSING THAT COULD BE? MIXED SIGNALS WITH SILVER LOOKING SO WEAK, JUNIORS LOOKING SO WEAK, AND GOLD PLUGGING ALONG HIGHER? THE GDX: GOLD RATIO WAS WEAK FOR LONG PERIODS OF TIME, BUT GRADUALLY ( With a mix of Gradual and sudden changes) THE PICTURE SEEMS TO BE GETTING CLEARER. THE BIG PICTURE has always been that 2019 Looks Bullish for Precious Metals, but the way various sectors within were trading was odd, really unusual. I LOOK FORWARD TO SEEING THEM SYNC UP, SO LET’s CONTINUE… 🙂
.
SILVER – At resistance, but at least it broke out of that base & moved off of the lows finally. That push got some of the Silver stocks playing catch up. This, no doubt, also helped the lagging GDXJ.
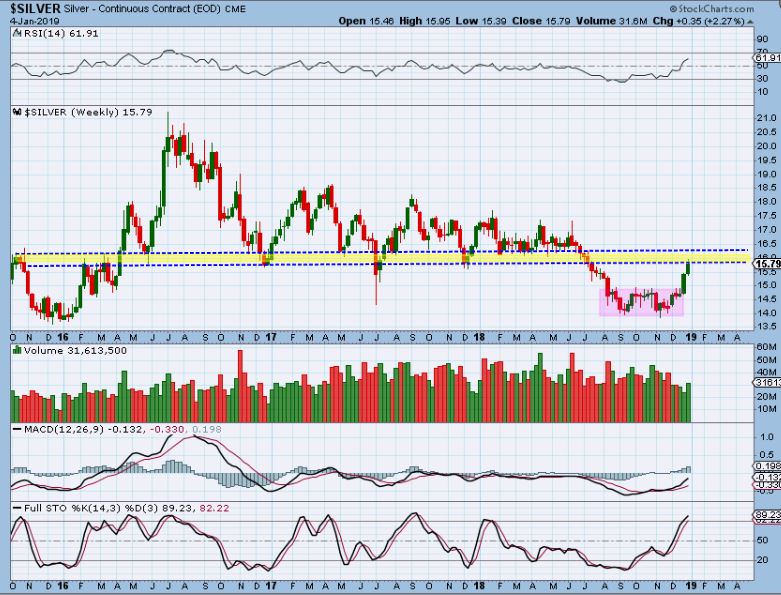
After sharing with you my observations and thoughts above about the MIXED SET UP, this is where I am wondering if Silver will now continue higher as Gold dips down? Or will it stay muted as Gold dips down? In my head, I see that Platinum looks like it put in an ICL and POPPED Higher Friday, as Gold dropped, and that is again odd, right? Silver even has a lower low in November. That said, I can see where maybe Silver MIGHT just want to keep moving higher on its own, but …
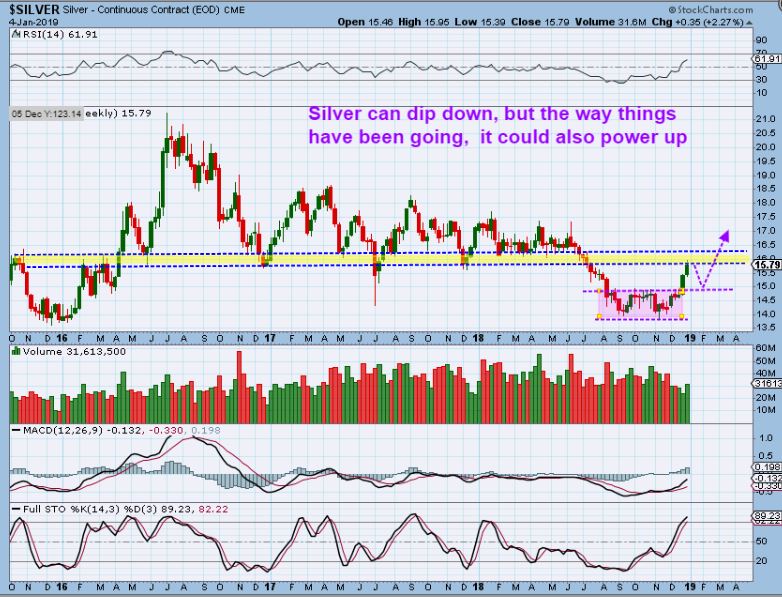
SILVER – For the sake of saying that ‘Silver will do as Gold does’, I will draw it like this as most likely. WATCH THE SILVER STOCKS. They are lighting up.
GDX DEC 31 – Last week I posted this and at the end of this week we would see a recovery or stall at resistance.
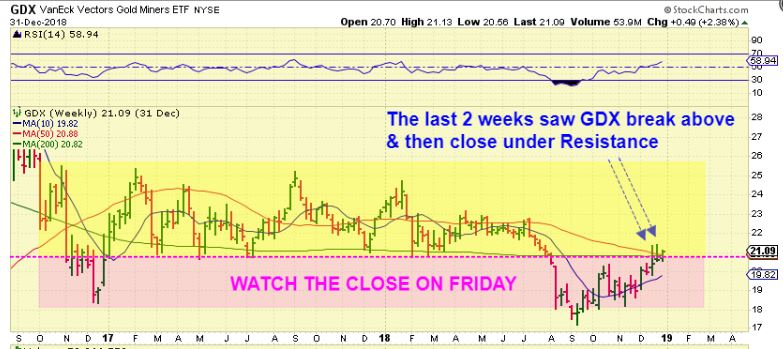
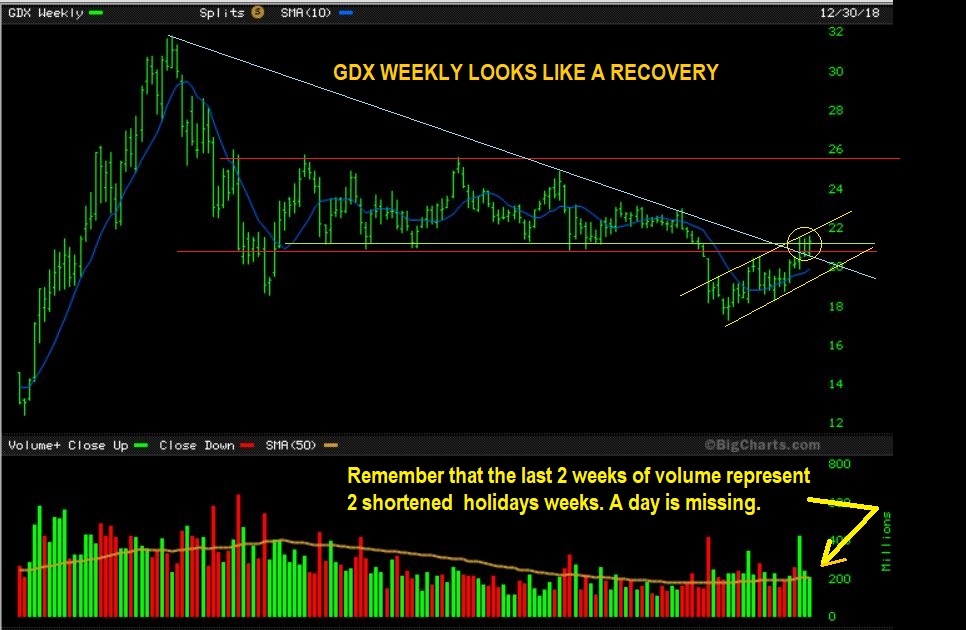
GDX WEEKLY RECOVERY – GDX did close above the break down. That should be Big Picture Bullish.
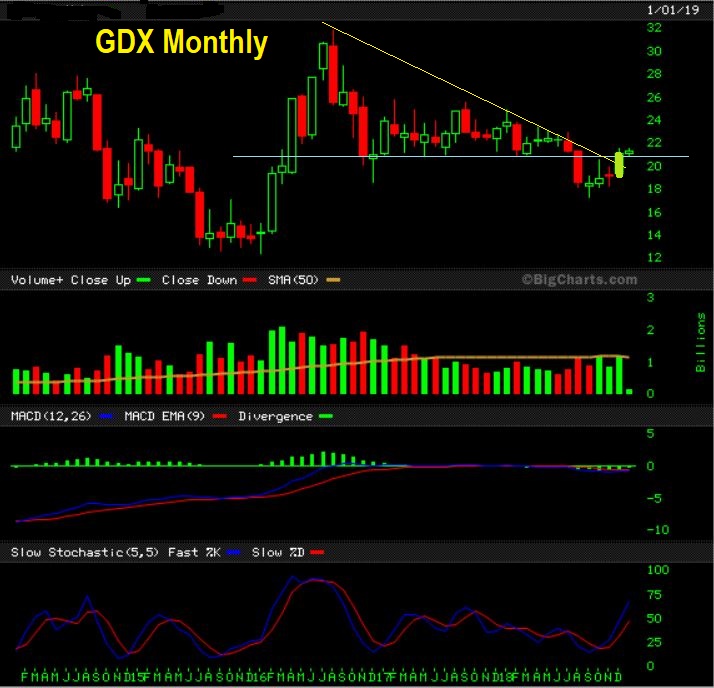
GDX MONTHLY AS OF DECEMBER plus 1st week of Jan – GDX closed above Monthly resistance. This looks like a shake out & recovery.
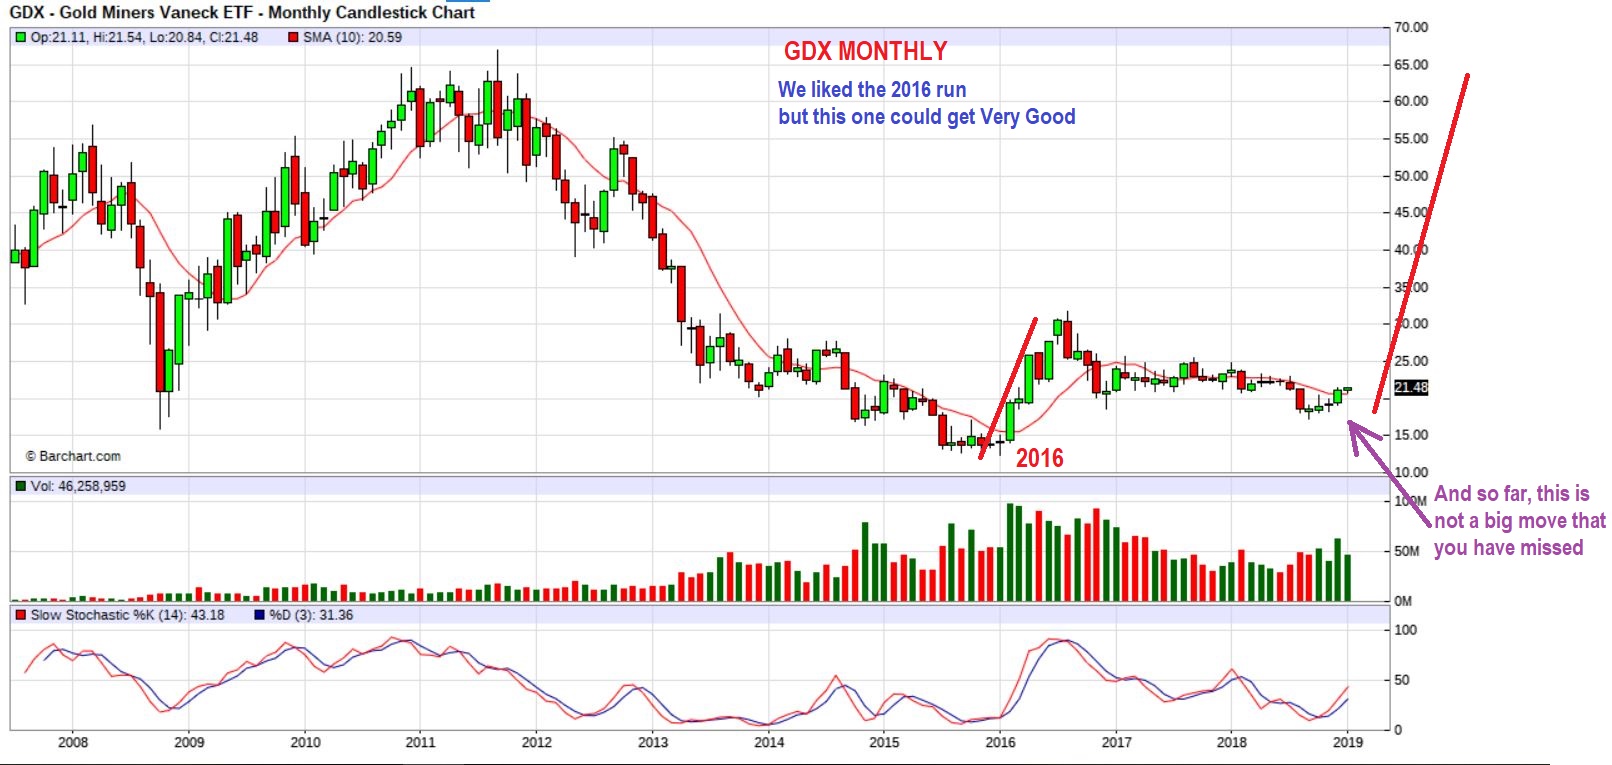
GDX MONTHLY From Fridays report – Here it is again friends. Do Not Feel that you missed a spectacular move, the move seems to be in its infancy. That red line could be the eventual path.
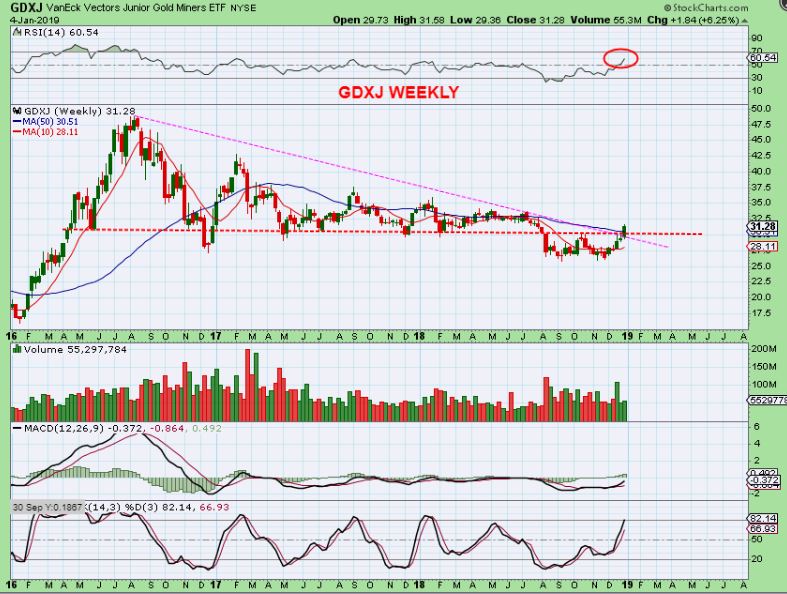
GDXJ – This also has recovered and closed above a break down level. GDXJ finally kicked into gear with Silver Miners beginning to add on some gains.
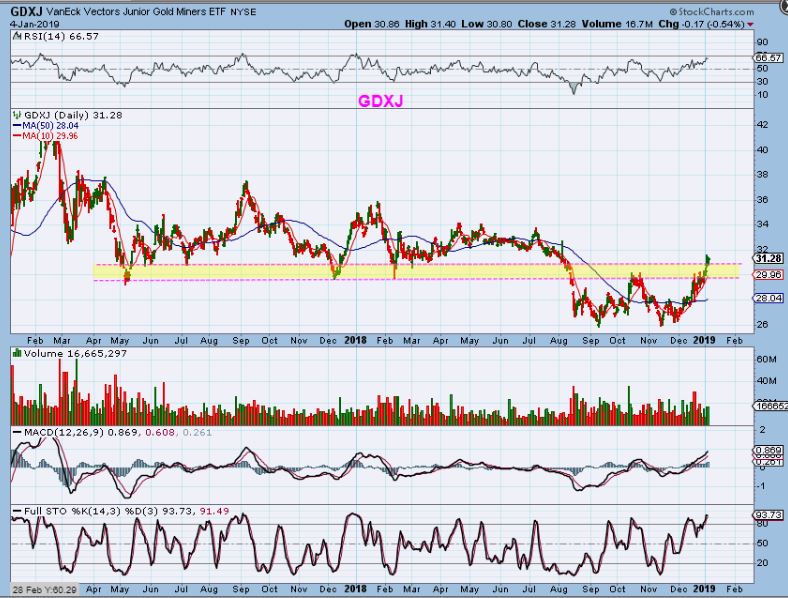
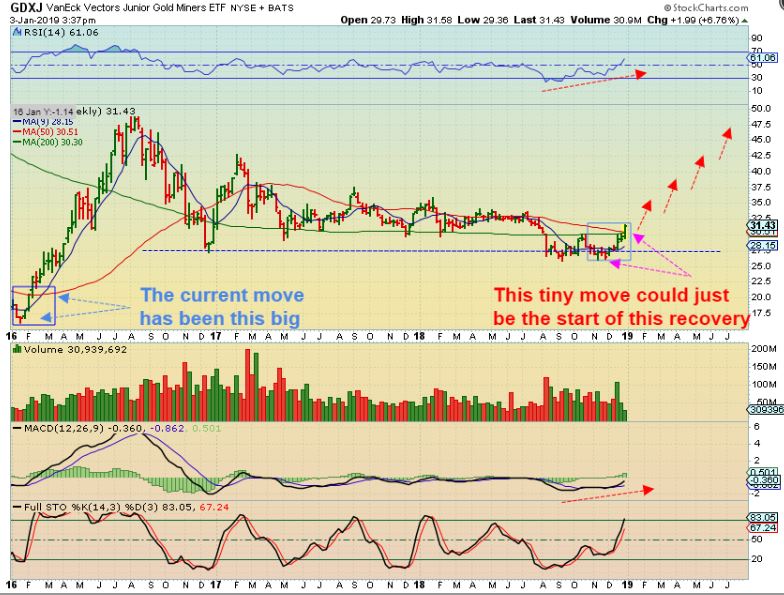
GDXJ WEEKLY – This looks very promising for the 2019 year. In my head, I add volume for the last 2 weeks, since they missed a day of trading.
GDXJ WEEKLY FROM FRIDAYS REPORT – Read the chart, it says a lot about the current move higher. See the blue boxes.
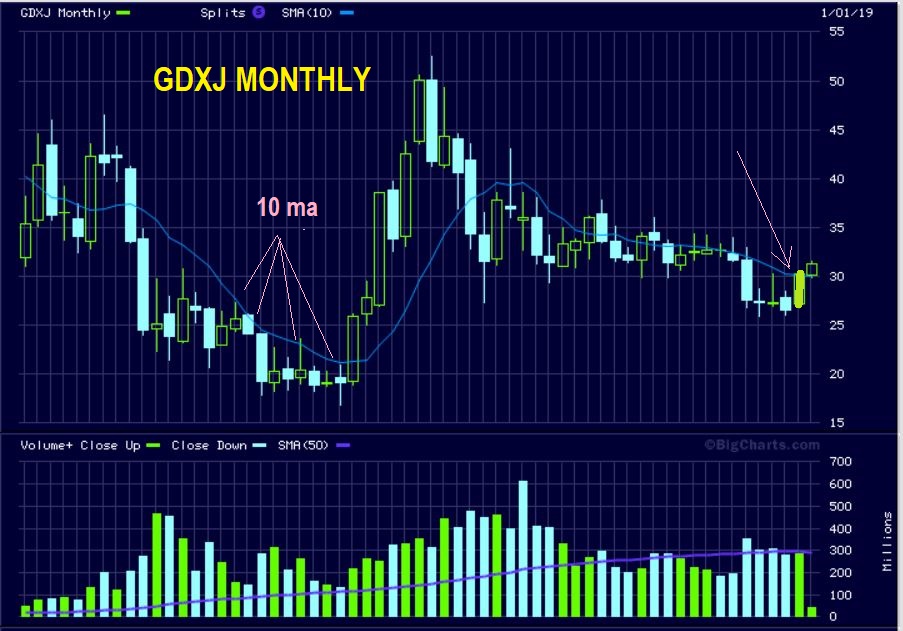
GDXJ MONTHLY END OF DEC (Plus 1st week of January) – 2 weeks closing above the 10 monthly ma.
.
Fridays report and others this week have covered the precious metals sector extensively. Fridays report listed several miners, why not go back and review it if you have time ? As you can see, The Big Picture looks brighter and brighter for the future of the Precious Metals Sector. The General Markets have put in a low, butthey’ll need some babysitting, and Oil should be viewed in a similar manner.
.
Enjoy the rest of your weekend!
.
~ALEX
.
My analysis: My daily and Weekend report are my analysis and how I am seeing things. This is important to you, in my opinion. I am analyzing a constantly changing scene, so it needs monitoring and we adjust accordingly. Picture finding a knife at a crime scene and concluding that the owner of the knife did it, period. Is there nothing else to know to understand things better? One Bias to cling to? What about the other DNA & Clues around the scene, that point to another possible path? The picture is clearer with more information gathered.
AS ALL HERE CAN CLEARLY SEE, There are times when there are 2 possibilities on the table (even more). For example: I think that Silver can do it’s own thing here & break higher with Platinum as Gold dips, or Silver can pull back following Gold. I shared Valid reasons for both, it could go either way – and I feel that you should have the opportunity to Know and Understand that.
I personally feel that I would be doing my readers an injustice by not explaining that 2 paths are possible and the reasons why. Then you know what to look for. Consider this: I have experienced and studied a lot over 20+ years of trading, but many here work full time, have families, and want to enjoy life, they cannot possibly take the amount of time to see what I have seen. In over 20 years of trading, I have seen a lot, and I share that on the job experience here.
I mention the above because someone in our comments section continues to publicly tell me that he only wants to hear of 1 possible path for each sector. Then I have had others email me and say, ” Please don’t change a thing, I’ve learned a lot with your reports”, and ” If you see 2 possible paths, I want to see it too- to eliminate surprises!” etc My reply is this. I started this site to share how I Analyze Charts & Markets. It is good to teach my readers how I got there and what I see. At first I did not do that as much, and I got tons of questions in emails and the comments section from inquiring knowledge thirsty minds… “Why do you say this? What did you see to make you predict that move? How did you know we were at the lows? What does a reversal candle with high volume mean? ” etc. My readers can gain an education if they’ll do more than just skim through the charts. I now take the time to share what I see and what I know. It often leads to more than one plausible idea, and time will help us to lean one way or the other. I often say ” I feel this is more likely”, but it may have 2 plausible paths, like Silver currently for example. I don’t plan on changing anything, and if I see 2 possibilities with good reasons, like “SILVER MAY FOLLOW PLATINUM HIGHER , OR IT MAY STALL WITH GOLD”, you are going to understand why I say that too 🙂 .
.
Moving on…
.
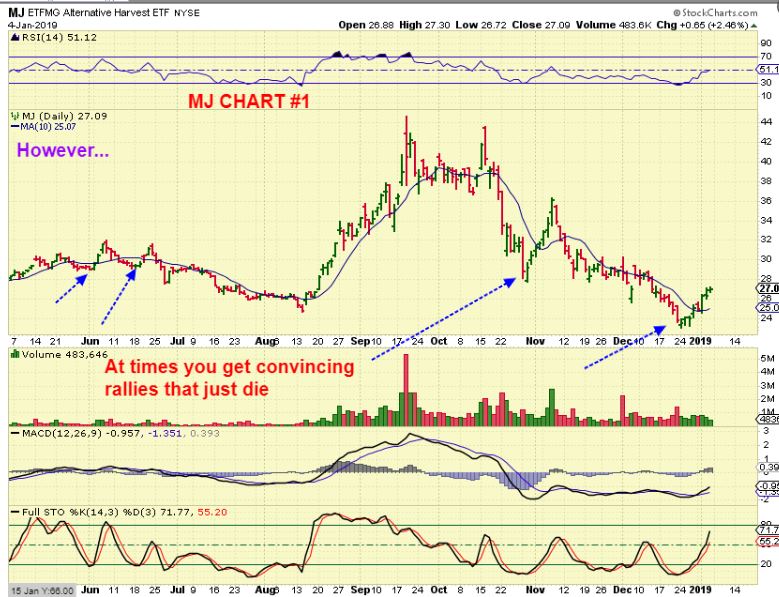
The MJ sector also continued to move higher and charts continue to improve one after the other. Some of these had already had amazing gains , so I wanted to look at the MJ ETF. Are there 2 possible ways for this to play out and valid reason to think so? oh yes there is…
MJ ETF #1– Look at the chart below. We do see several convincing false rallies that just die, so I remain cautious, but I remain Bullish too, when I found this…
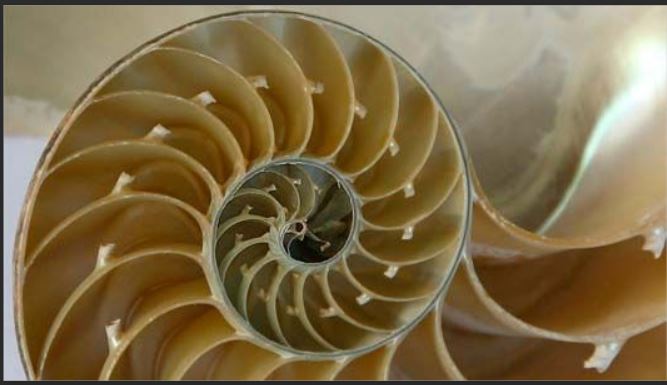
I LOVE FRACTALS IN NATURE– They are designs or Patterns that repeat over and over again. You will find them in flowers, pine-cones, bird feathers, seashells, etc etc

And they can be expanding patterns too. Starting small, these have the same dimensions, but grow in size as they move forward. I have seen these Fractals in the markets too, and I actually look for them at times….
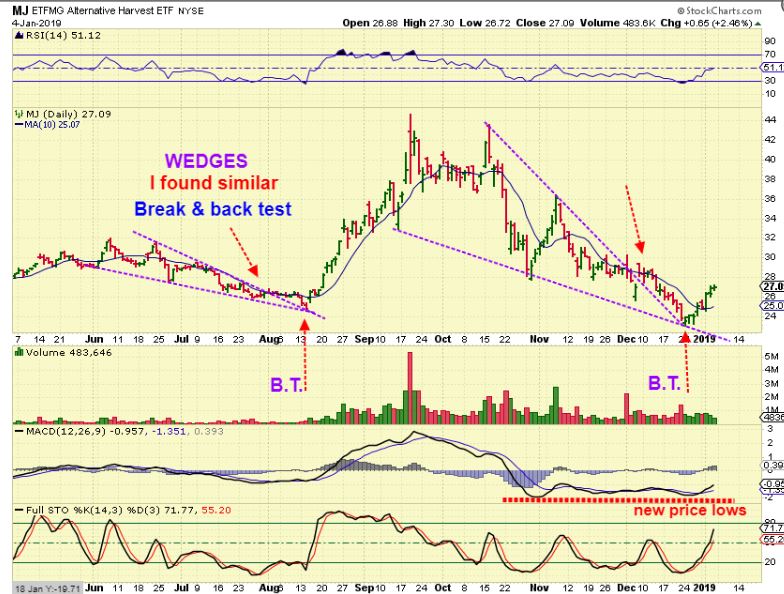
MJ ETF #2– I very often see Fractals in the Markets and this could be an example of one as a wedge pattern.
1. Here in June , July, and August, I see a wedge that broke out and back tested the trend line with a lower low before a massive rally.
2. Currently I see a Wedge Break out and back test of that trend line with lower lows ( and MACD divergence). Is this rise taking place before a massive rally? Conditions are favorable with talk of growth in this sector. I am still long several MJ stocks and have pointed out what I look for in these stocks. If this continues higher, I will continue to do so in daily reports.
.
I also see METALS taking off…
.
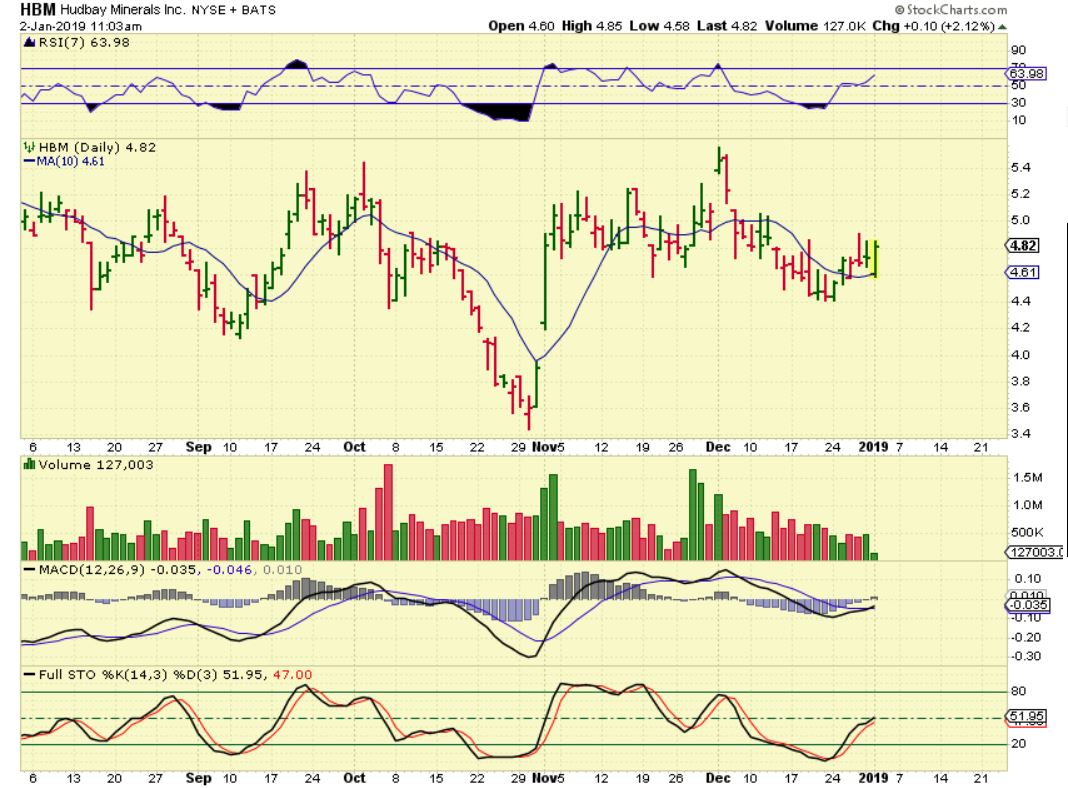
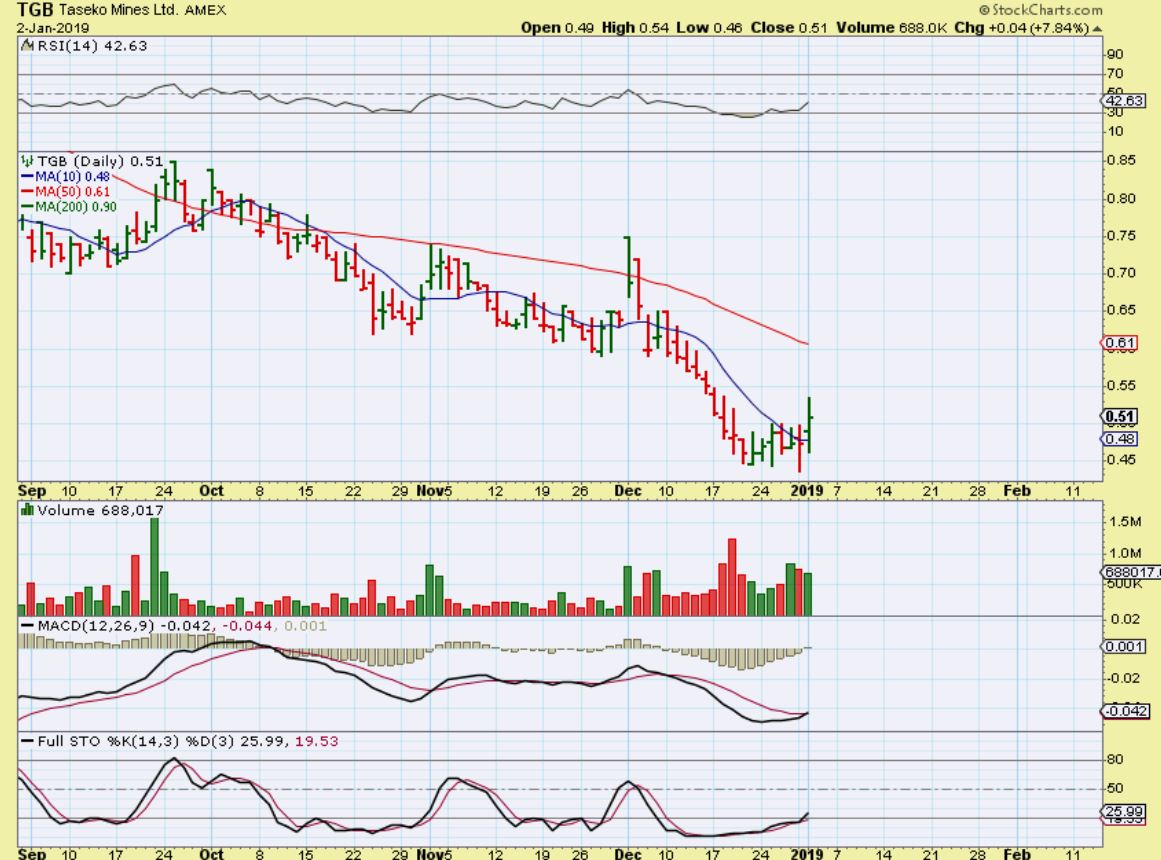
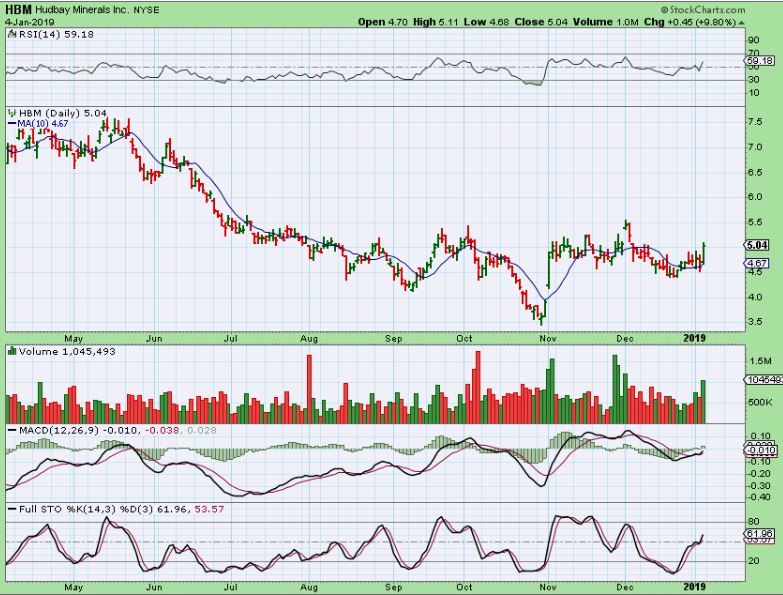
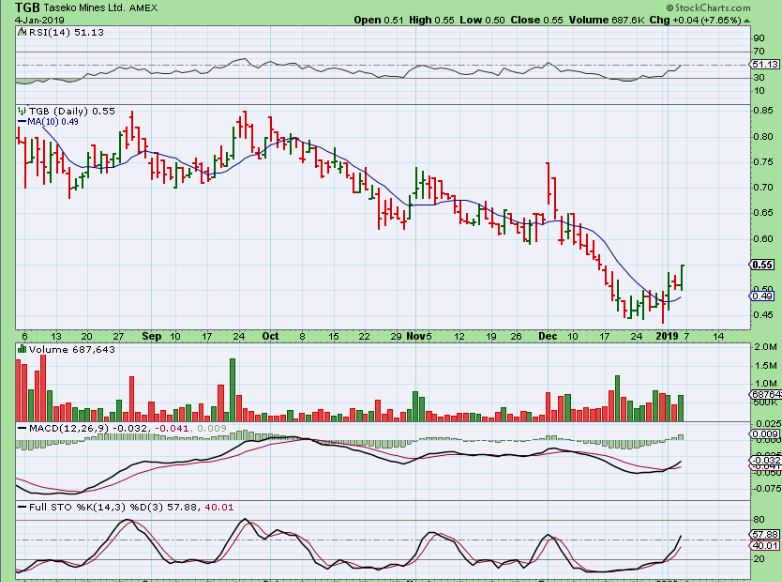
I pointed out a few stocks recently, like with the 2 charts below ( HBM had the inverse H&S and TGB popped ). I will cover those set ups in future reports too.
,
The follow through is seen here…
A bigger pop in HBM ( 10%) & in TGB ( 7.55%)
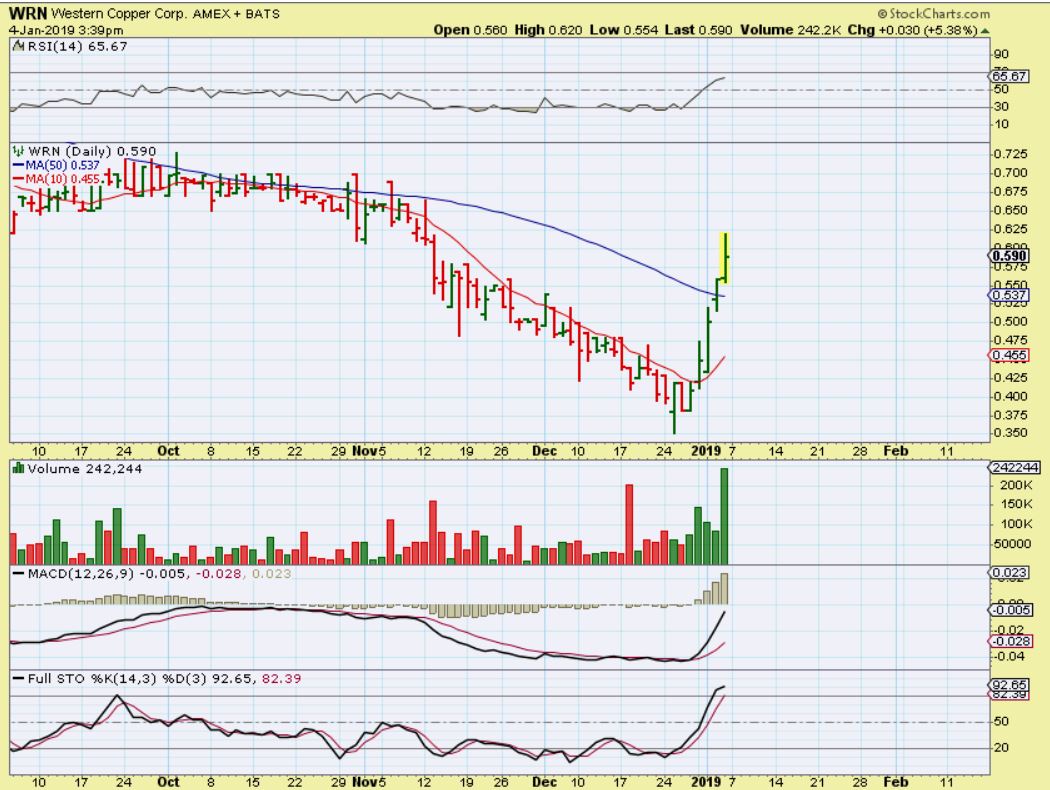
Others joining in …
WRN – Almost a 100 % move in just days off of the lows.
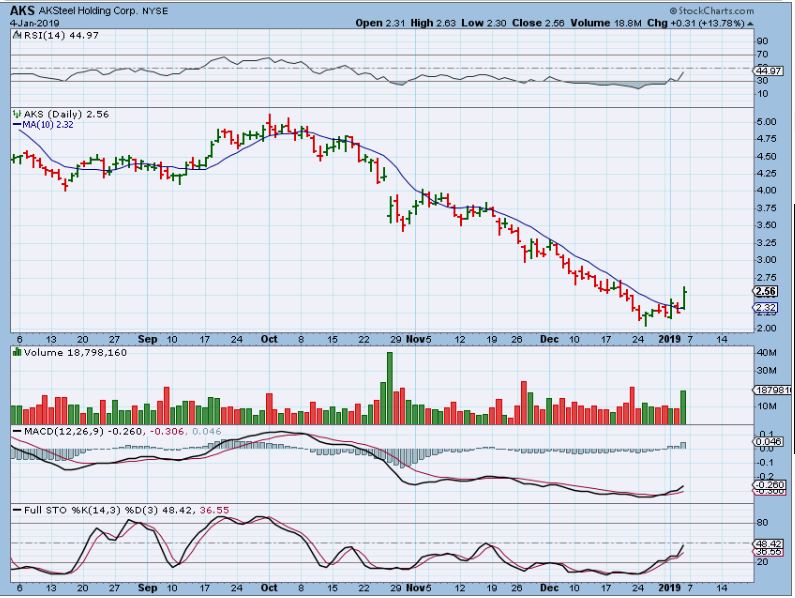
AKS = 14% POP breaking above the 10 sma, this is a buy. Use a stop under the 10sma or recent lows.
X- A 10% pop ,
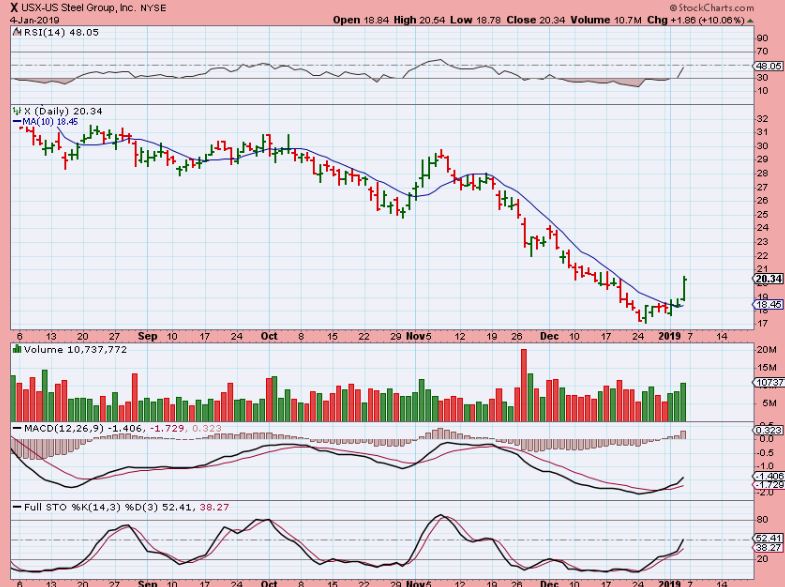
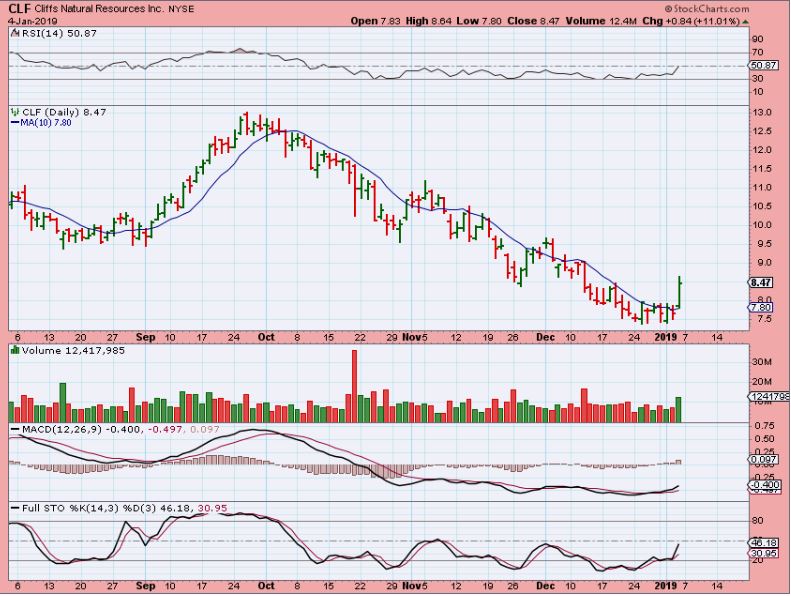
See also CLF (11% pop) , CLD, CPST, ZEUS, FCX, CENX, etc.
The BIG MONEY may be shifting their positions and entering Precious Metals and Metals at these lows.