Fridays Friendly Reminder
After a quick market review, Todays report will include a long section reminding us about a recent discussion that we had.
.
DJIA – The DOW dropped over 600 points on Thursday, but the chart does not show ‘damage ‘ at this point, though it did drop under the 10sma. It is a trend line back test so far.

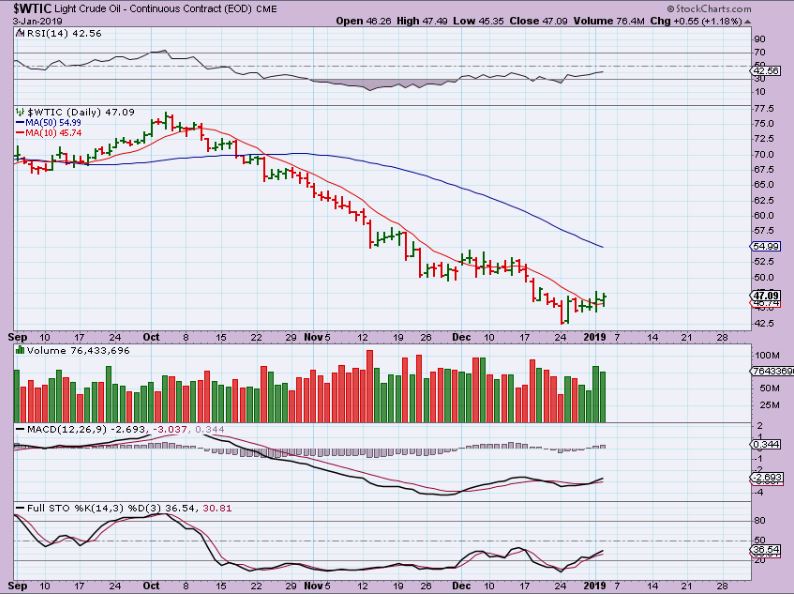
WTIC – Oil and Energy stocks ( And XLE, OIX, XOP) are still looking good to me. Price was a lower low and MACD was a higher low, that is bullish divergence. Oil still looks like it wants to move higher, I am still long this sector.
.
NEXT I WANT TO REVIEW SOME OF WHAT I SAID IN WEDNESDAYS IMPORTANT UPDATE FOR THE PRECIOUS METALS. I WILL COPY/PASTE SOME OF IT HERE, SO YOU DON’T HAVE TO GO BACK & RE-READ THE WHOLE THING.
.
I WROTE:
.
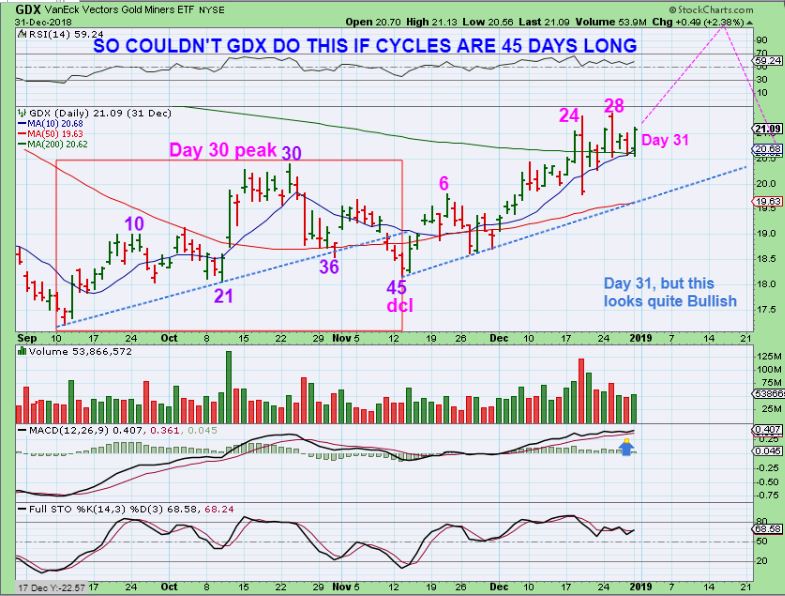
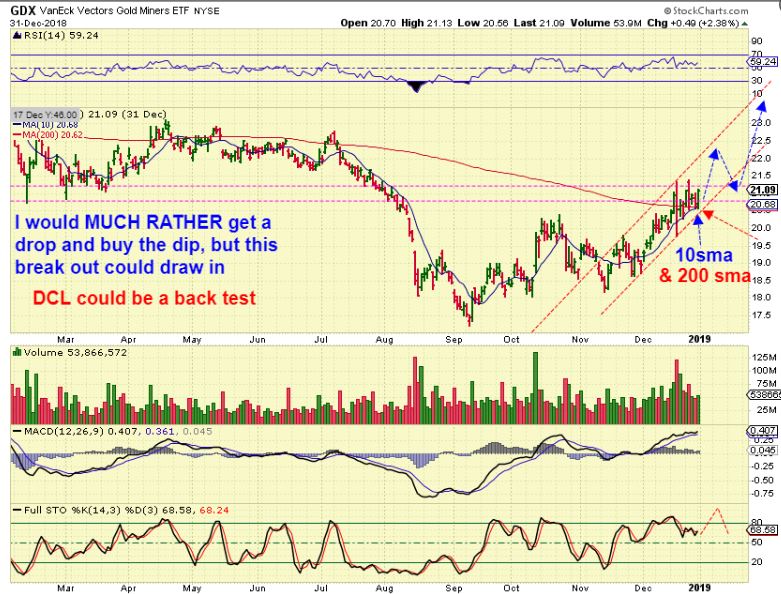
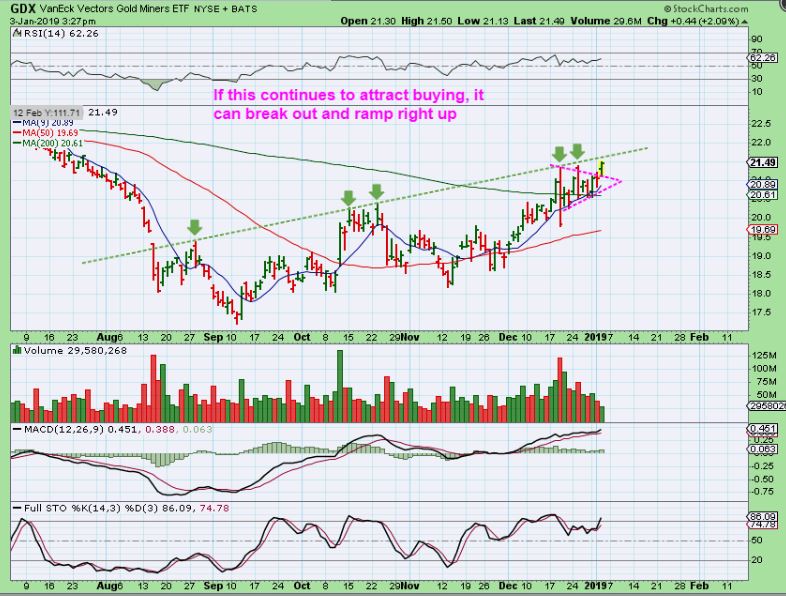
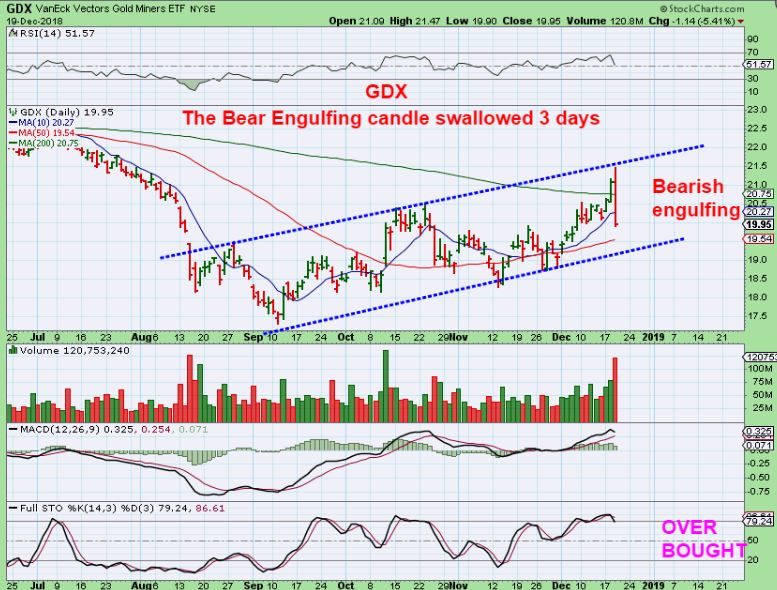
GDX – THIS LOOKED LIKE A BULL FLAG FORMING : It is currently crawling above the 200 sma & especially the 10 sma rather well. So now I want to examine a push higher off of this support as a possibility too, and I will explain why shortly. This chart shows a day 31 reversal on the 10sma. Bull flag looking too. What if it just breaks out and runs to say day 35, then drops to the 200sma as a dcl? That is possible.
.
I THEN WROTE:
.
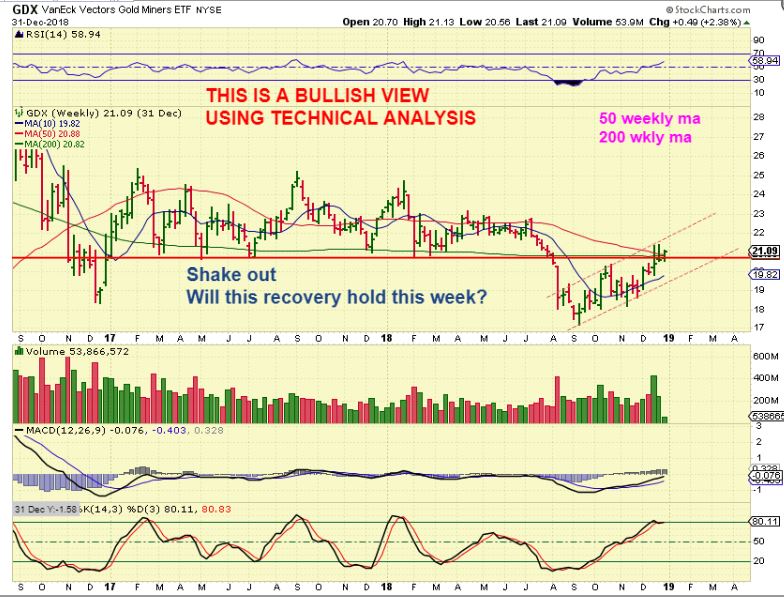
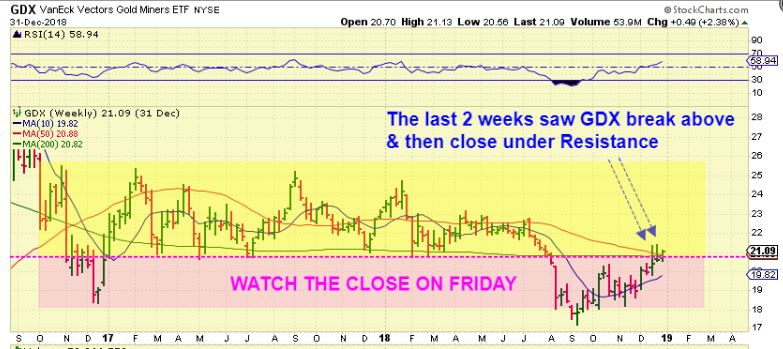
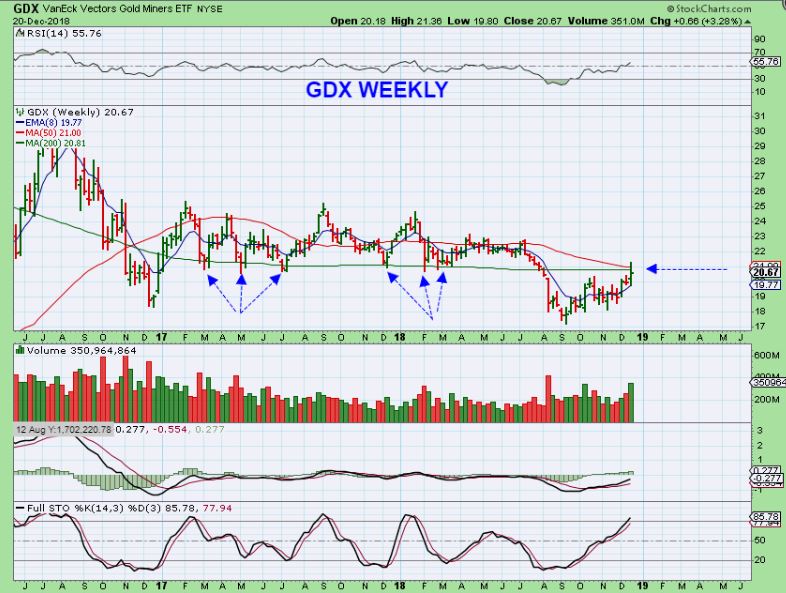
GDX WEEKLY – We are on day 31, HOWEVER , we only have 3 days left in this week, and THIS LOOKS LIKE IT IS RECOVERING ON A WEEKLY BASIS.
– Recovering the 50 week ma
– Recovering the 200 week ma
– Recovering from a weekly and monthly shake out. *If this closes here or higher by Friday, the weekly chart is a shake out & recovery.
GDX – Though I couldn’t normally recommend buying or adding positions this late in a daily cycle, but with an adjusted view of where we might be, this becomes a Big Picture “Low risk set up”. Why? If it breaks out higher, you can place a stop right under support, and DCL could back test. Look at the next 2 charts. GDX is on the 200sma, the 10sma,
ALSO in that Big Picture, it would be a weekly recovery of the shake out, depending on Fridays close. Using technical analysis, Support that was broken & turned to Resistance, then becomes Support again, and it could draw in a frenzy of buyers. 2019 Looks Really good for Miners at this point if this closes higher.
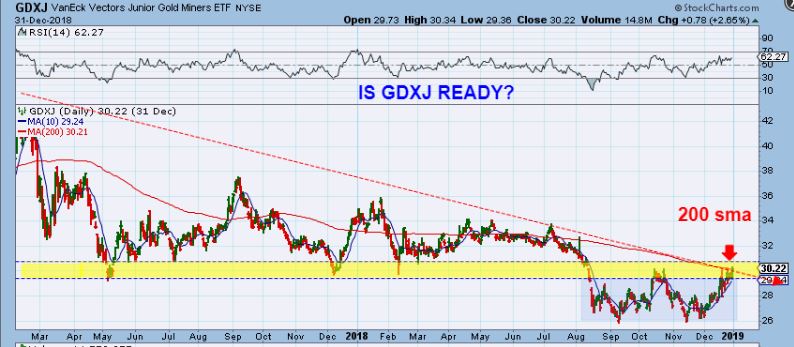
GDXJ – This is an important week. We now have watched GDXJ try to play catch up too, and it is in the same situation. If this breaks out higher, I can’t imagine that Buyers wont start entering GDXJ (Also shorts may cover). I will also show you another chart later that will be the exclamation mark on this thought.
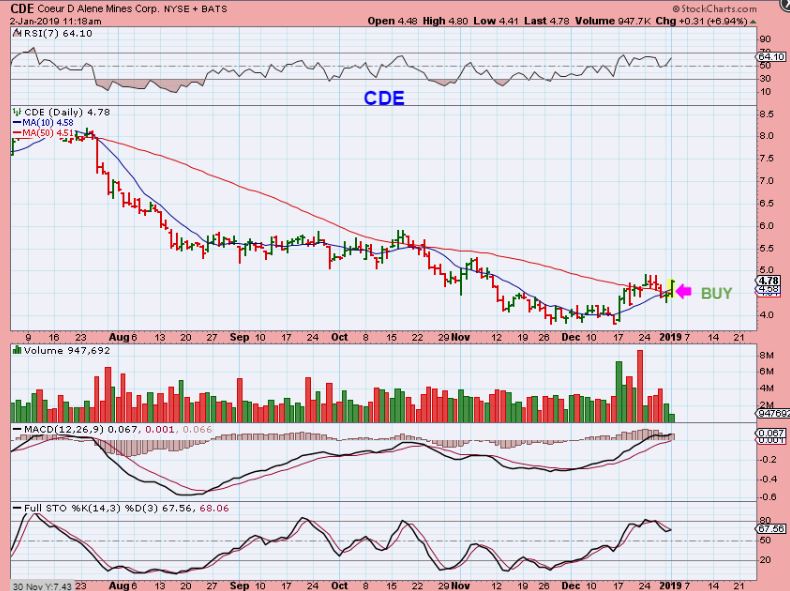
I THEN WENT ON TO POST SEVERAL MINERS LIKE CDE, SA, GPL, ABX, etc THAT LOOKED BULLISH AND A POSSIBLE BUY. THEY WOULD BE A LOW RISK BUY USING STOPS. THIS CDE CHART WAS POSTED AS AN EXAMPLE-
.
CDE – CDE made a reversal. Can it push above the 10sma again? If so, you may consider it a buy. SILVER may do its own thing from here.
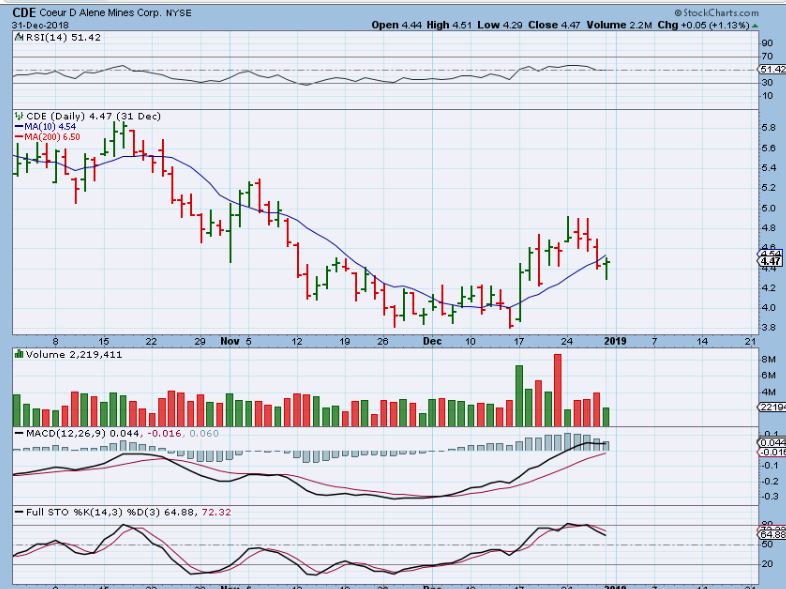
CDE THEN DID BREAK OUT, AND I POSTED THIS, BECAUSE PEOPLE THINK THEY MISSED A MOVE AND DON’T WANT TO CHASE. THIS IS NOT CHASING, IT IS NEAR THE LOWS. IF SILVER’s PLAYING CATCH UP TO GOLD, THESE CAN RUN LATER ON THEIR OWN.
.
AND WEDNESDAY I SAID THIS AS AN IMPORTANT OBSERVATION GOING FORWARD:
.
Yes, this is an adjustment from the normal way of approaching the ‘high Cycle count set up’ that we have before us. I would NEVER talk about owning Miners on day 31, but this set up has added bullishness. Yes, The Miners can still drop and be frustrating if they sell off to the dcl and do not break out above resistance, but this report is being presented as more of the ‘Don’t lose sight of the Big Picture that I have been presenting too”. We are discussing
1. What is currently right in front of us as of this week, and
2. An adjusted way of looking at it. Technical Analysis.
GDX WKLY – Watch the Wed-Fri trading, but this is Bullish at this point.
I CONCLUDED WITH THIS ( I will post a Partial of what I mentioned in conclusion).
.
I repeat: I would hate for Miners to Break out of this big shake out type base, and finally start a surprise MELT UP PHASE and leave anyone ‘flat footed’ so to speak. This report is to get you back the Big Picture view as this week is about to end. – So yes, we are due timing-wise for a normal dcl. Are these Normal times, or will the extremes that we have seen in other sectors flood over into a GDX GDXJ Break out? Now is the time to consider both sides of that coin. If Big Money was flushing out of OIL & The GENERAL MARKETS, are they now going to begin entering the Miners at a steadier rate- pushing cycles a bit? Time will tell, especially by this Friday. There are plenty of set ups in Miners to buy, if we do start a ramp higher. When you see the charts at the end of the report, it may hit you the way it hit me. WOW!
.
The final 2 charts in the report were these BULLISH MONTHLY CHARTS…
.
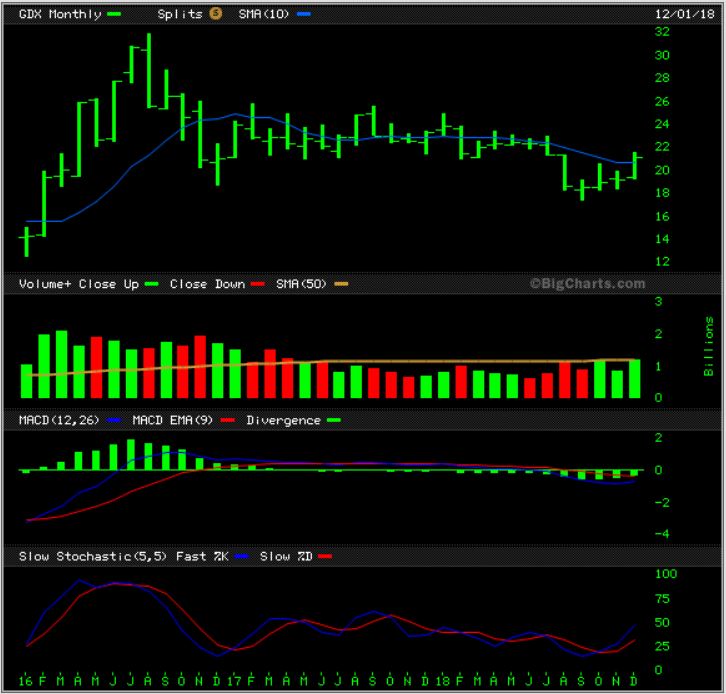
THE MONTH OF DECEMBER HAS NOW CLOSED, AND THERE IS NOTHING BEARISH ABOUT THIS MONTHLY CHART. THIS IS A VERY BULLISH LOOKING CHART! THIS LOOKS VERY BULLISH FOR 2019!
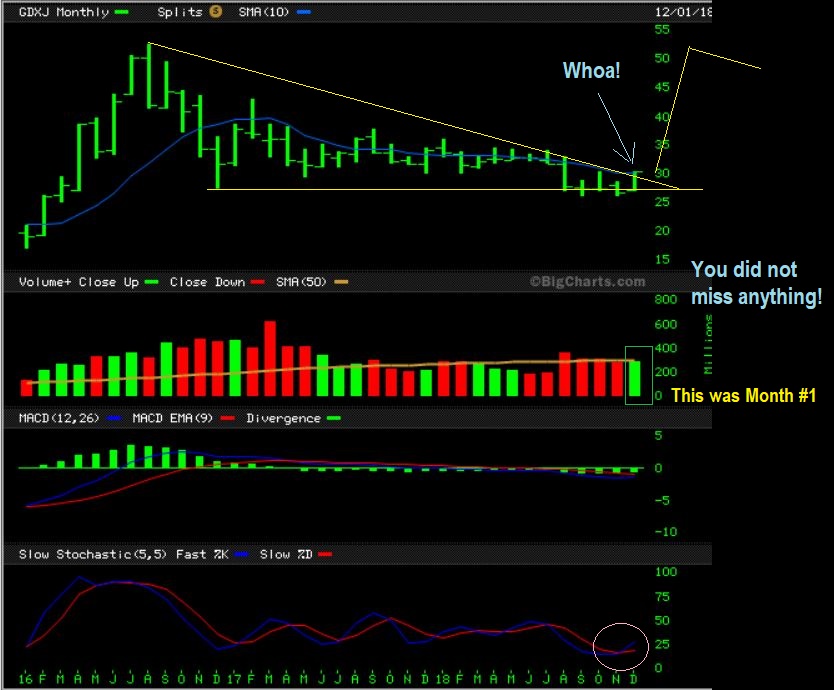
GDXJ MONTHLY – December has ended and this is the first Positive Month since MAY! I pointed out that down trend line last weekend, and it has been broken! Again, I see NOTHING BEARISH about this chart. 2019 Could be a very profitable year !
.
SO HERE WE ARE 2 TRADING DAYS LATER, AND YOU HAVE SEEN WHAT HAS HAPPENED RIGHT? FRIDAY IS THE LAST TRADING DAY FOR OUR WEEKLY CHARTS. LET’S CONTINUE OUR DISCUSSION:
.
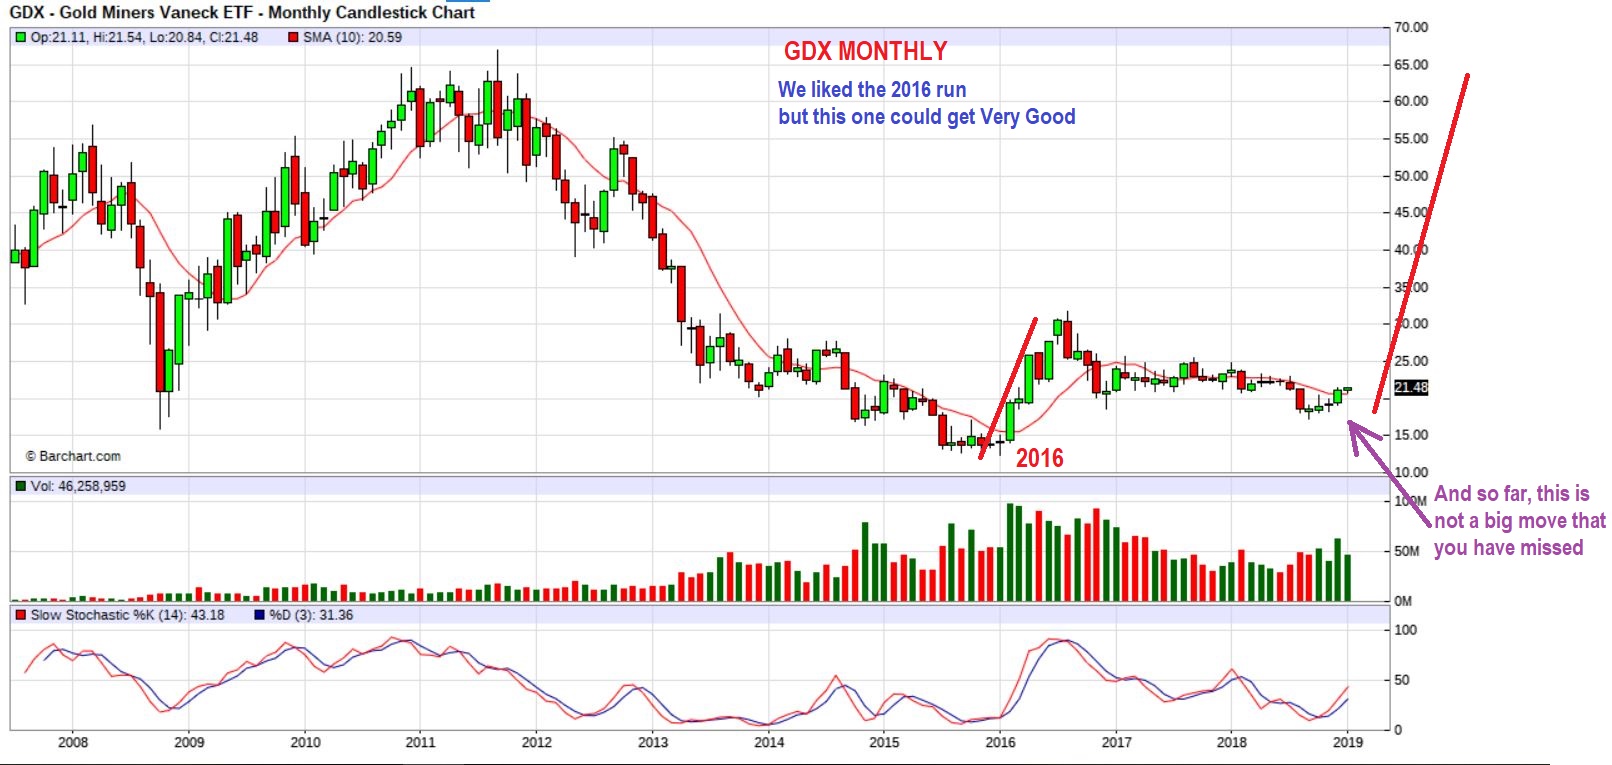
GDX MONTHLY FOR PERSPECTIVE – TO START WITH, AS YOU CAN SEE, THIS HAS NOT BEEN A HUGE, RELENTLESS, RIP-YOUR-FACE-OFF TYPE OF A RALLY IN GDX, LEAVING YOU BEHIND IF YOU SOLD MINERS. LOOK AT THE RECENT MOVE. IT IS A BLIP ON THIS CHART, BUT WHAT IS COMING COULD BE VERY REWARDING IF WE KEEP FOCUSED GOING FORWARD. PLEASE READ THE CHART .

.
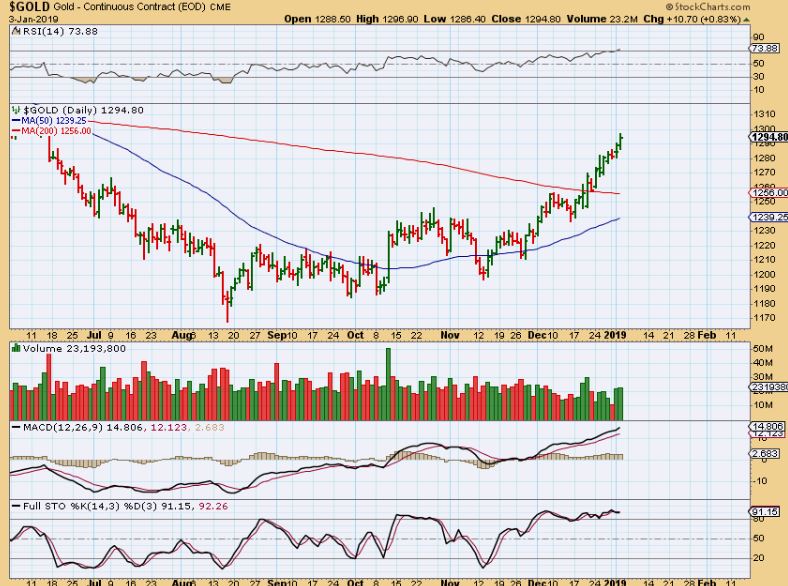
GOLD #1 – Gold has broken out and does seem to be in a MELT UP PHASE. What could cause a Melt Up Phase? A Melt Up Phase can happen when people ‘shorted’ that upper trend line and Buyers push it higher. Shorts have to close their positions (or Buy). Buyers see the break out and also enter. ALSO…
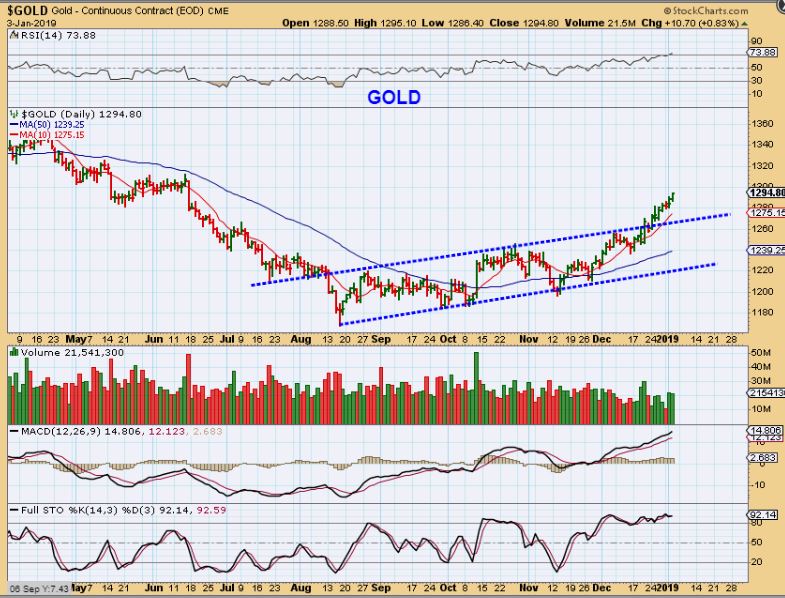
GOLD #2 – People may have also shorted GOLD at the 200sma, and as it broke out, that drew in Buyers and shorts need to cover. At times like this, it is hard to gauge how long this can continue. CYCLE-WISE, Gold is on day 33. As mentioned in Wednesdays report, it can get extended.
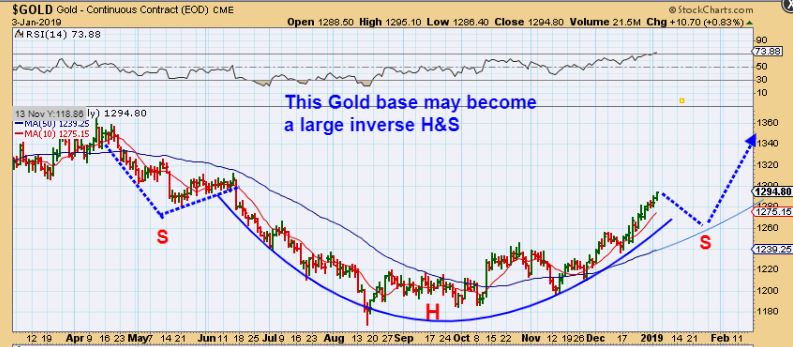
GOLD #3 – if the resistance from the left shoulder plays out soon, we could see a dip and a large inverse H&S could form. Again, Gold is on day 33.
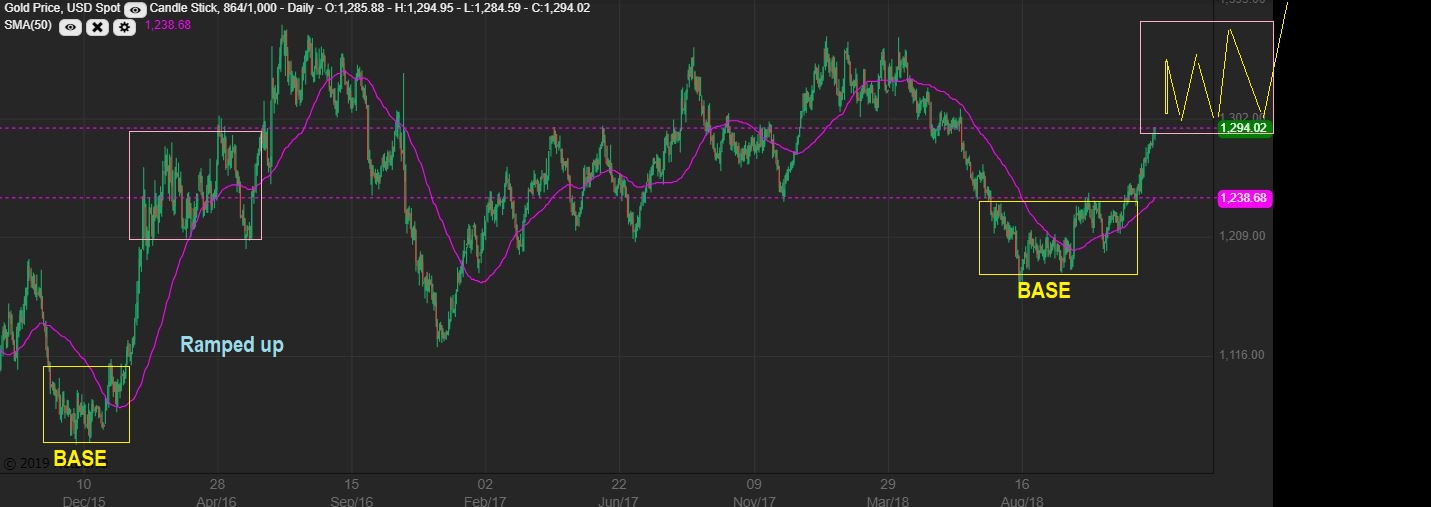
GOLD #4, The BIGGER PICTURE – I just wanted to take a look at 2016’s base, break out, and run. THAT MAY HAVE BEEN SHORT COVER OUT OF THE BASE, and it melted straight up. If we got that here, we would ‘melt up’ for a lot more than a normal daily cycle. Also the DCL comes higher. You really wont know until later, but consider this…
.
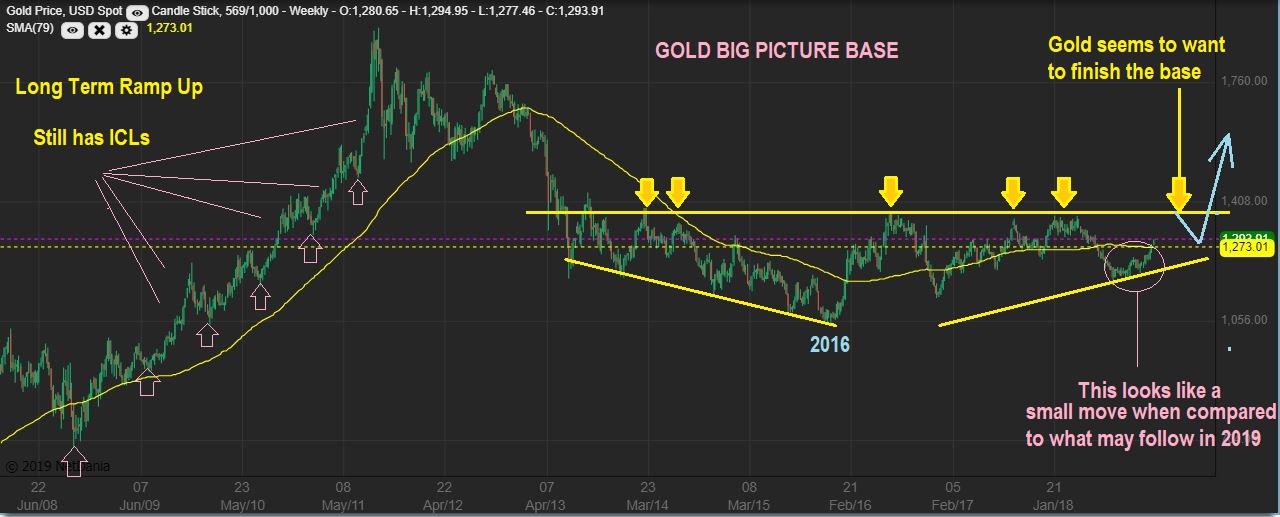
GOLD #5 – IN THE BIGGER PICTURE, GOLD CONTINUES FORMING A GIANT BASE. The move so far does not look that big. In technical analysis, It would be easy for Gold to run to the yellow line. THAT LINE IS ONLY 100 POINTS HIGHER ( $1380 ish).
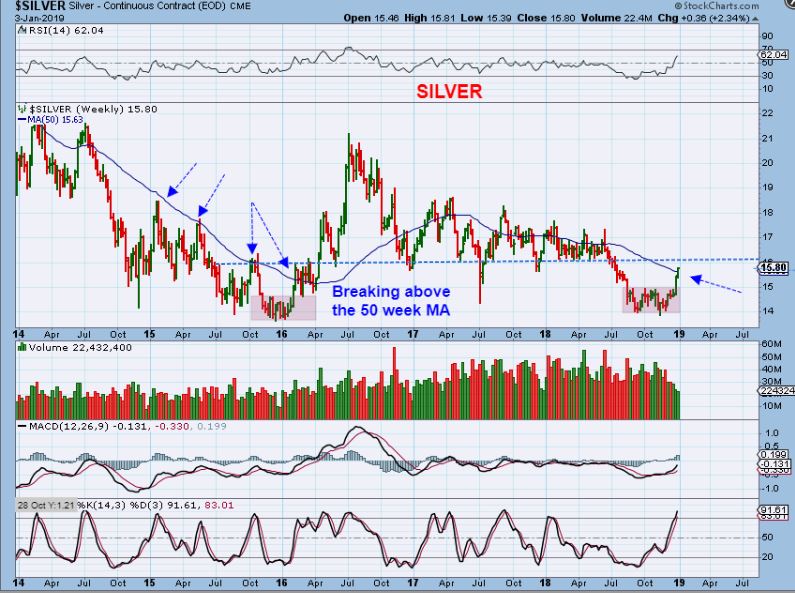
SILVER WEEKLY – Silver was Really lagging GOLDS progress, but it started playing catch up and broke from its base last week. It may close above the 50 week ma today . Silver actually looks like it is just getting started, and that is why many Silver Stocks are still near their lows.
GDX #1 – GDX broke out from that BULL FLAG Thursday. It continues to climb along the upper trend line, but it could break out if shorts cover too. It went sideways for 2 weeks to form that flag, so it lagged Gold, but broke higher Thursday…
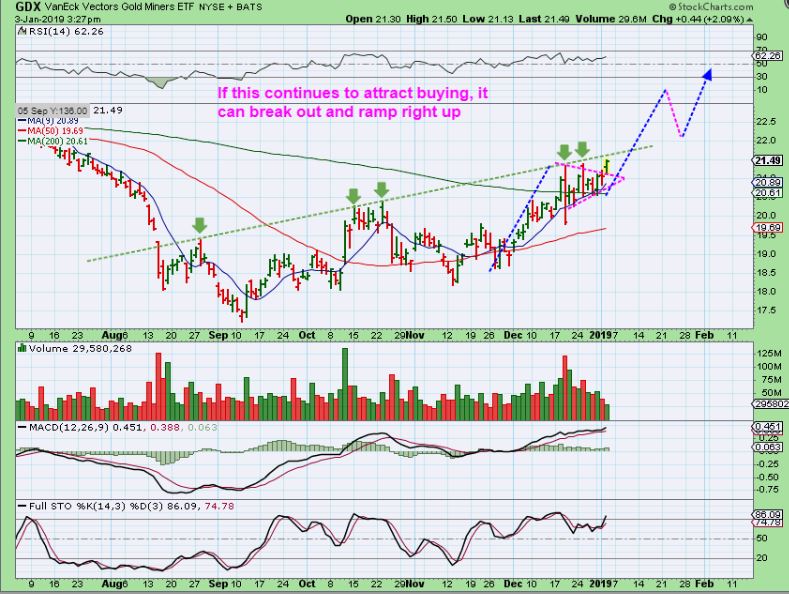
GDX #2 – Will it now play catch up with GOLD again? It could if it enters a melt up phase of its own. an A-B = C-D move is shown below. You add the flag pole length to the flag. The eventual DCL could simply be a back test. My point here though is …
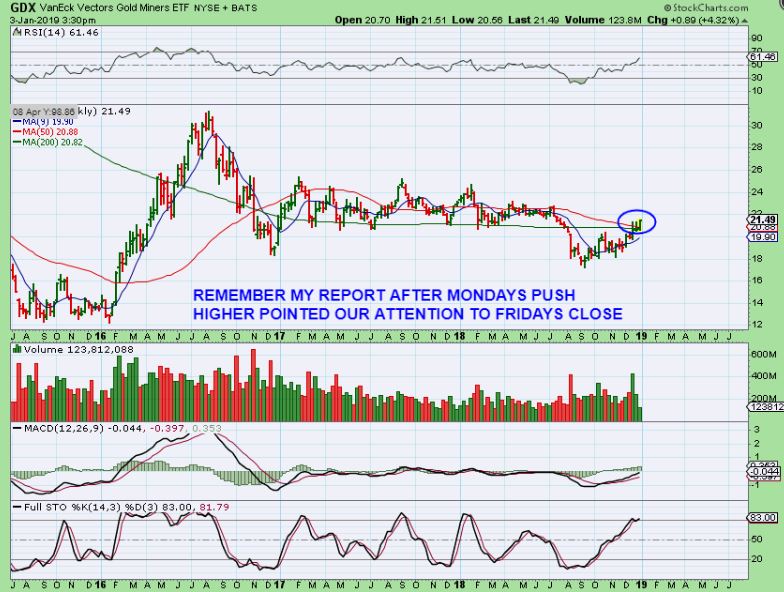
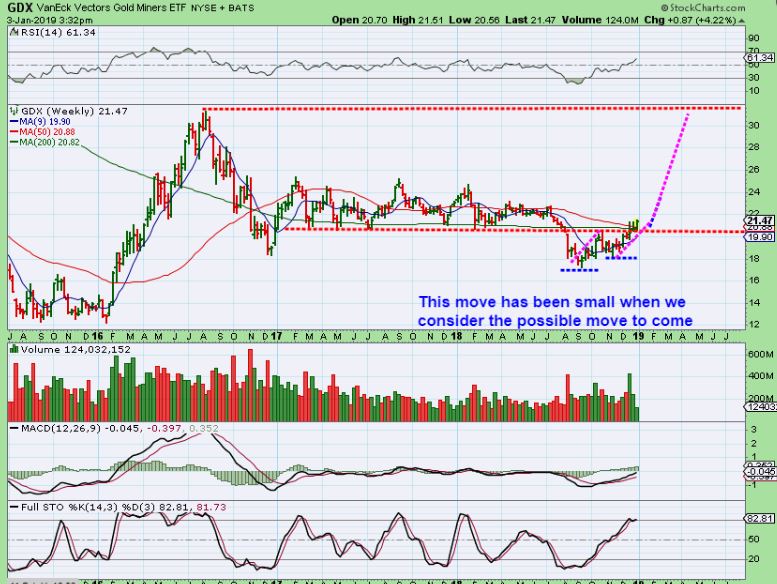
GDX WEEKLY – My point here is to remind everyone about what I pointed out in the important update after Mondays trading. Friday closes the weekly chart. THIS IS A BREAK OUT above the weekly 50 & 200 weekly ma so far.
IT IS ALSO A ‘SHAKE OUT & RECOVERY’ . In Technical Analysis, I would have to believe that this is going to attract BUYERS. I AM GOING TO WATCH THE CLOSE FRIDAY.
WHEN I DREW THIS ON DEC 20, YOU CAN SEE THAT THIS IS WHERE RESISTANCE IS OBVIOUS, AND THIS IS WHERE PEOPLE WOULD SHORT GDX. AS GDX BREAKS HIGHER, ‘Shorts’ may now have to cover, and technical buyers would be drawn in.
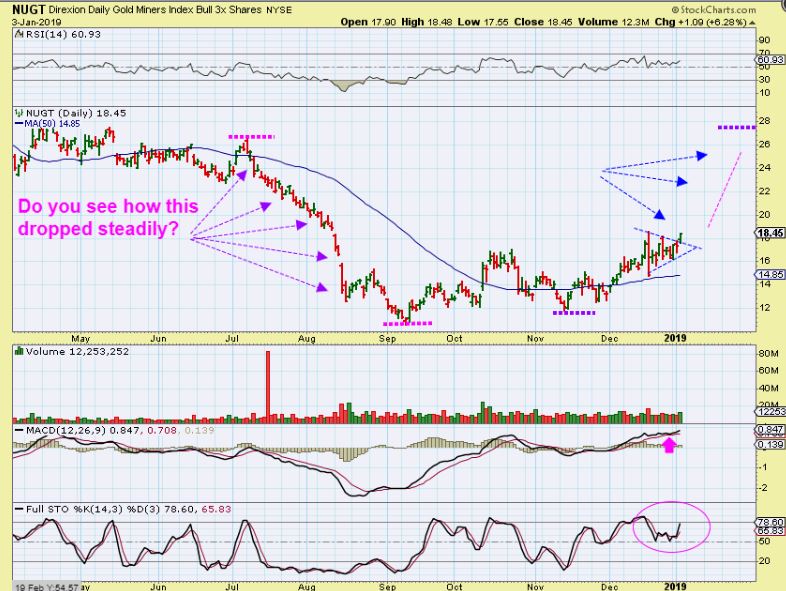
NUGT – A melt up phase from the base can run, so if one wanted to buy this break from the bull flag, the flag is your stop. If it drops from here, the next run could melt up. We had a melt down this summer, an extended sell off. We could get a melt up too. Basically this is a long base in technical analysis.
A Reminder: GDX did not just ramp up & run away here. It was 3 months of choppy, sloppy, sideways and tricky trading all along. This was the GDX as of DEC 19, over 3 Months out of the lows. GDX was Only $2 dollars off of the lows after 3+ months of trading!
GDX MONTHLY – Here it is again friends. Do Not Feel that you missed a spectacular move, the move seems to be in its infancy. That red line could be the eventual path.
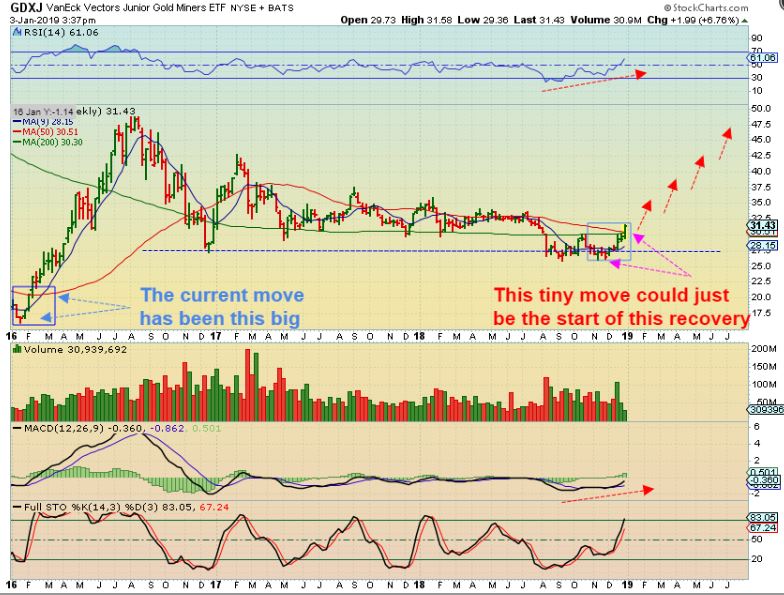
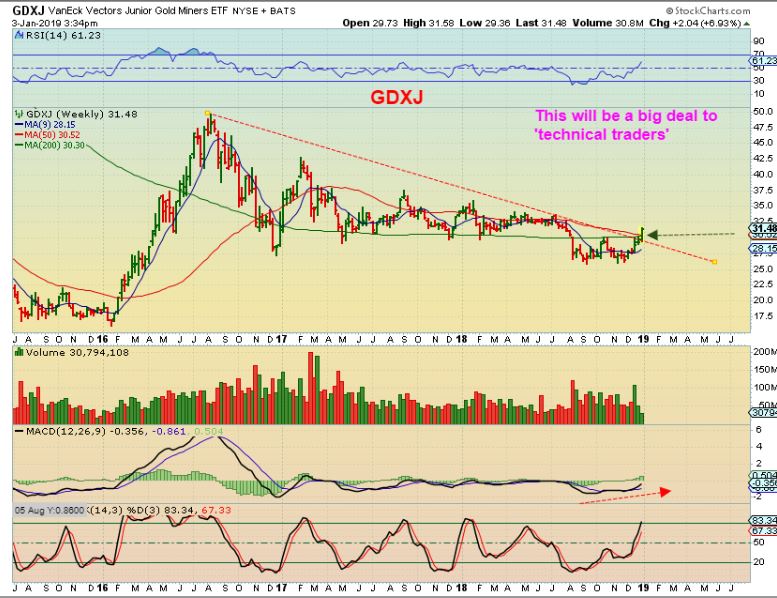
GDXJ WEEKLY – Read the chart, it says a lot about the current move higher.
GDX WEEKLY – Read the chart. A close here today makes this look like a ‘shake out & recovery’. Some Buyers may be drawn in due to that set up.
**IMPORTANT **
After recommending buying some Miners last week and this week, like BTG, CDE, NGD, ALO, AEM, etc – I had a couple of readers say to me, ” I don’t like to chase, so I will wait for a deeper pull back”. For one thing, you don’t need to ‘ Go All In’, use what you think is a safe position size, However, I need to show you something to adjust your view point. My report after Mondays trading was designed to ‘adjust your viewpoint’. …
.
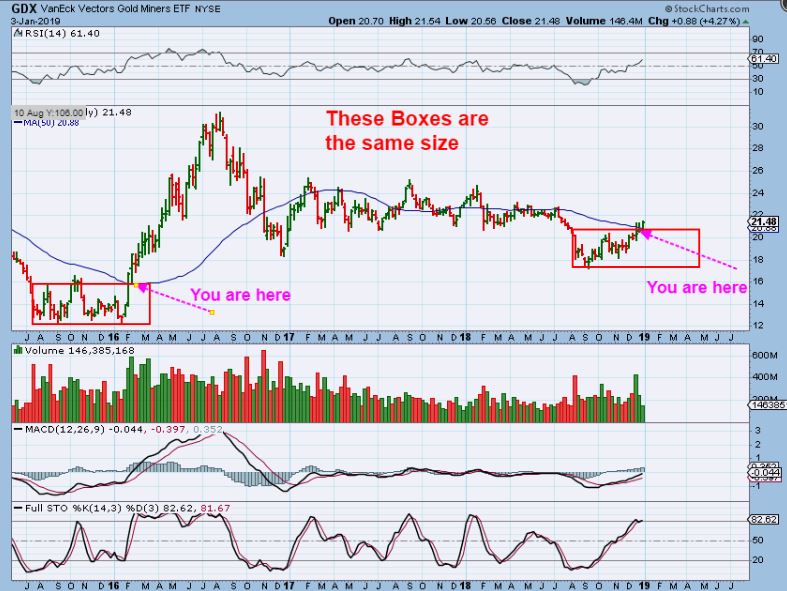
GDX BOXES– Look where we could be. These are bases. These Boxes are exactly the same size, they both tag the 50 weekly ma too. When we got a burst of short covering, and then a burst of Buying, the run of 2016 was just beginning. If we drop, you stop out. But also …
GDXJ WEEKLY – Again, I am focusing on The close Friday. This looks like a Shake Out & Recovery, and we shouldn’t really drop below a recovery, it should become support. This is getting interesting. Watch todays close. Does entering here look like ‘chasing’ vs 2016?
.
First we saw that the action in this sector was BULLISH for GOLD.
Then GDX started to perk up.
Silver and GDXJ were still lagging at the lows, but then recently they started to perk up too.
After seeing the bullish trading last Friday and Monday, I wrote that report that pointed out many Bullish features and character changes that needed to be considered, especially with the Weekly & Monthly charts and Shake outs and Recovery. I have included a lot of that report in this one too, with updates.
.
The MAIN POINT was that the weekly charts end this Friday. Monthly charts ending in December were very bullish. Now for the Weekly Charts: ARE WE SEEING A SHAKE OUT & RECOVERY IN GDX & GDXJ? It does look that way. That would be viewed as bullish, because it could cause ‘short covering’ and additional ‘technical buyers’ trying to enter positions. This could cause a slow melt up, extending cycle counts by who knows how much. We saw extended cycles in Oils sell off , and also a relentless selling in July & August for Precious metals. This was tricky, because it was a choppy, lack-luster move sideways in GDX and especially GDXJ hanging at the lows, until just a week or 2 ago. I have been trading in & out of positions, trying to catch gains and sell the pops, but with a shake out & recovery, allowing Miners to do their own thing and raise stops may be the best method. I will point out a few more lower risk entries for some Miners, and even a few still right at the lows in the section below.
.
GDXJ WEEKLY is a very important chart. It shows you
1. A possible weekly shake out & recovery, and
2. It shows you that the Move is really just starting, it is actually still in its infancy, and
3. The gains can be very good in 2019.
4. For weeks DCLs look like simple pauses or Bull Flags in 2016. We just saw a bull Flag too.
.
I look forward to seeing where GDX & GDXJ Close this week, don’t you?
.
~ALEX
.
How do I buy Miners without chasing? Easy, many haven’t been running all that strongly.
.
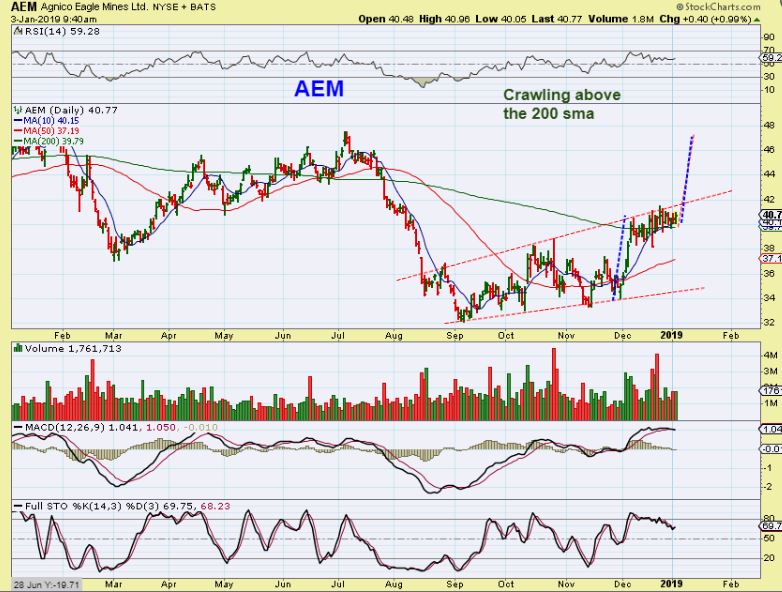
AEM – This has been a multi week correction on top of the 200 sma. The base looks similar to GDX itself. It can be bought with a stop under the 200sma.
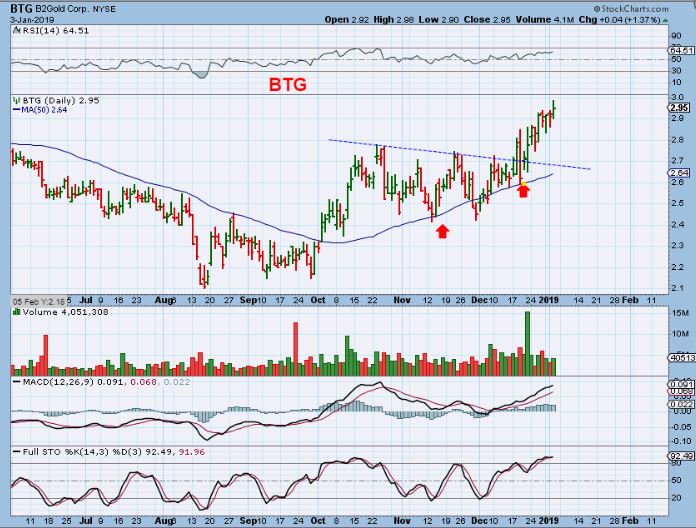
BTG was mentioned here several times as a bullish set up. It was similar to AEM now. This was Dec 7th and…
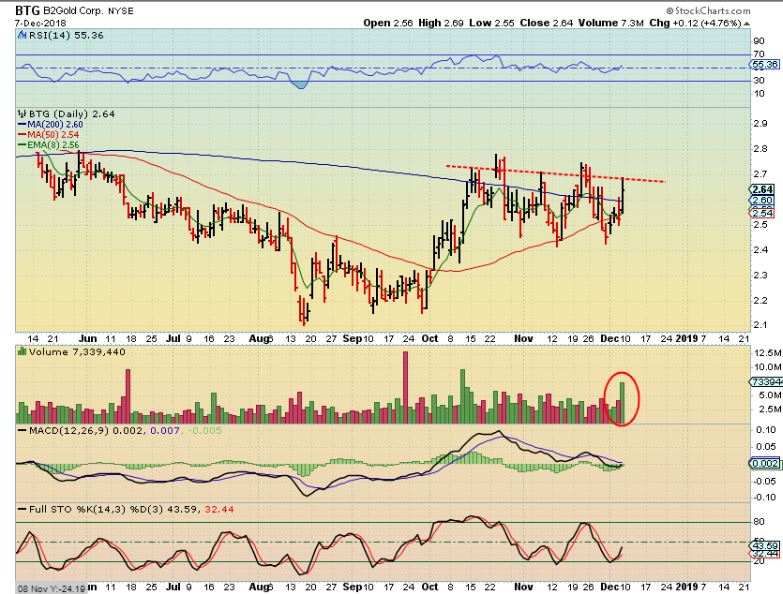
It broke out & ran. I have pointed this one out several times. AEM looks very similar.
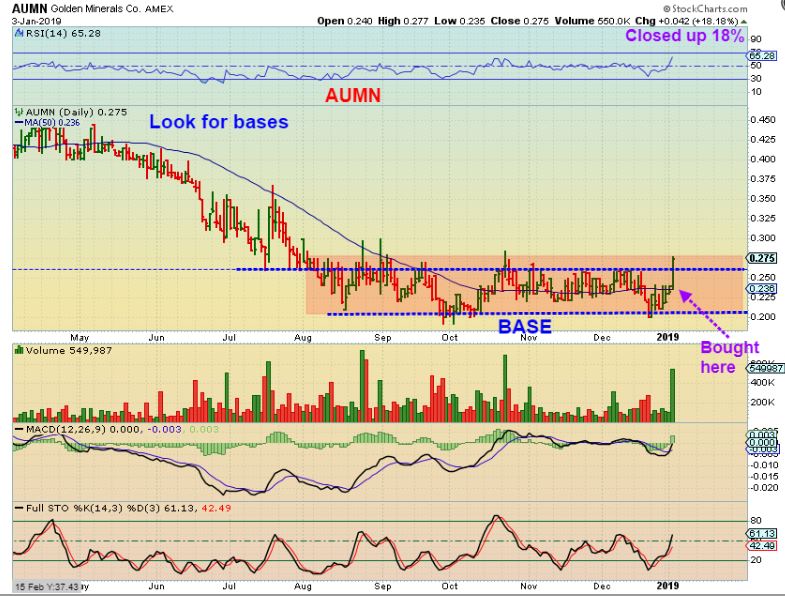
AUMN – Yesterday Maria pointed out that AUMN was up at 24 cents, and it was moving above the 50 sma. This has a personality of putting out Big Moves and I liked the volume early in the day, so I grabbed it and mentioned it in the comments. It moved up all day and is now looking like it could break from a long base. Bases can add fuel to the fire, I will continue to point them out to you.
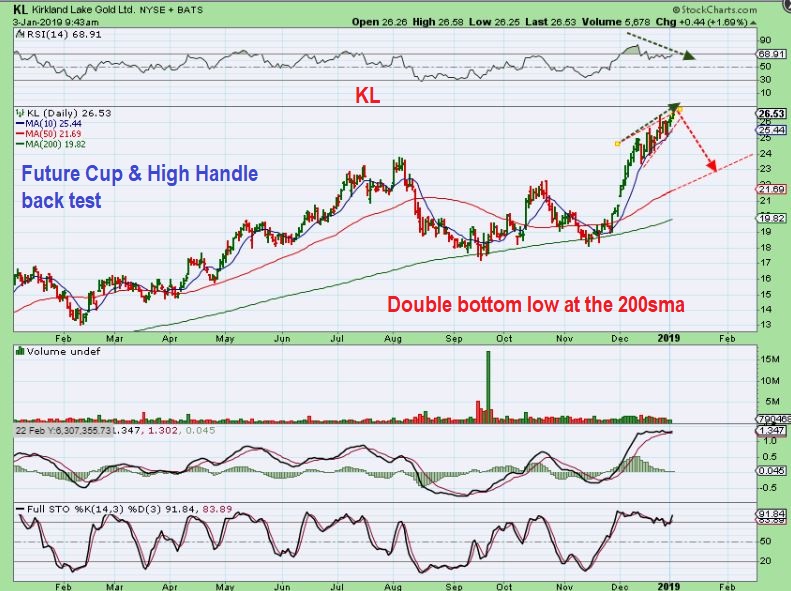
KL – If you see some like this? AU & KL? This is extended, so I personally wouldn’t be buying it up here, but a normal pull back may offer a good entry. #Watchlist
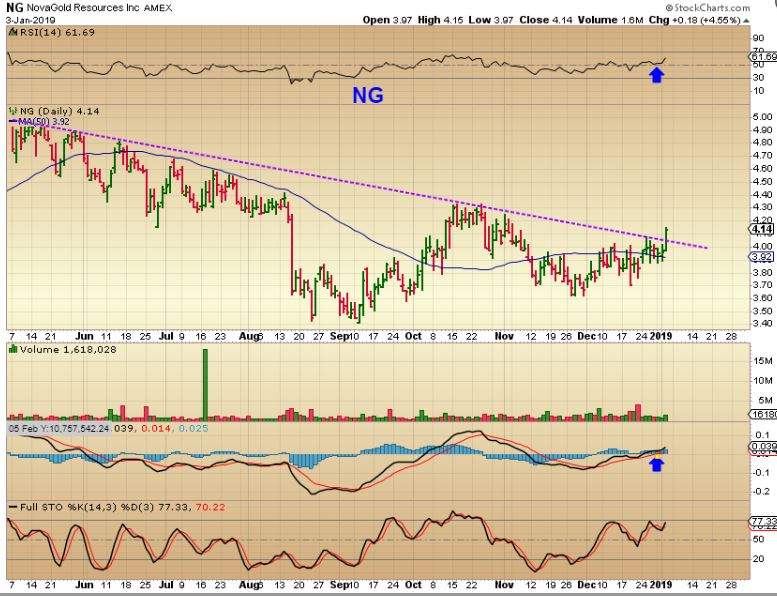
NG – This is just breaking out of its own base too, and still basically near the lows. It can be bought with a stop loosely under the 50sma .
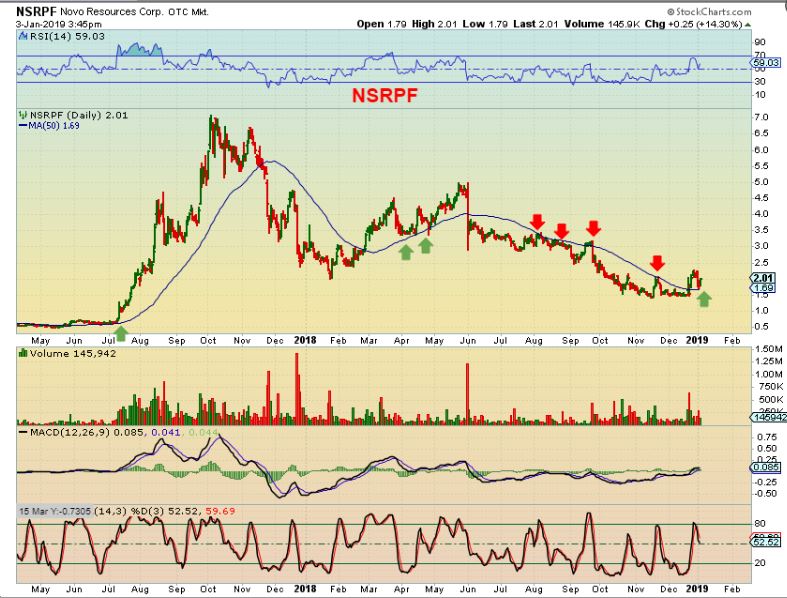
NSRPF #1 – NSRPF popped above the 50sma and dropped back for a back test. This looks bullish, so lets zoom in…
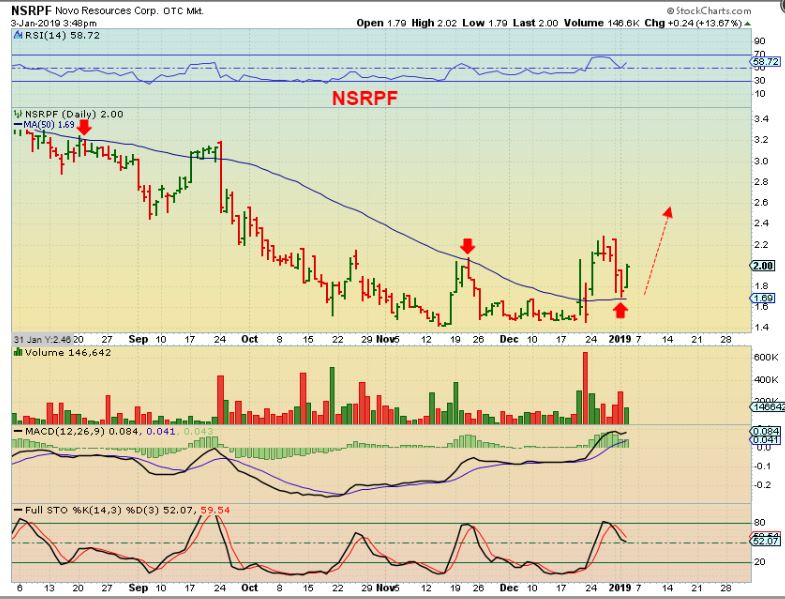
NSRPF #2 – It put in a nice reversal off of the 50sma . $1.40 to $2.30 was a big 2 day POP, and now with a back test, it may run higher from here.
.
I POINTED OUT NICE BASES , AND HOW THEY CAN RUN. YESTERDAY I DISCUSSED ALO & NGD & GORO, SO LET’s TAKE ANOTHER LOOK…
.
ALO – ALO moved up another 10% today. This is a long base and it could just fly. I hope someone grabbed it. Then…
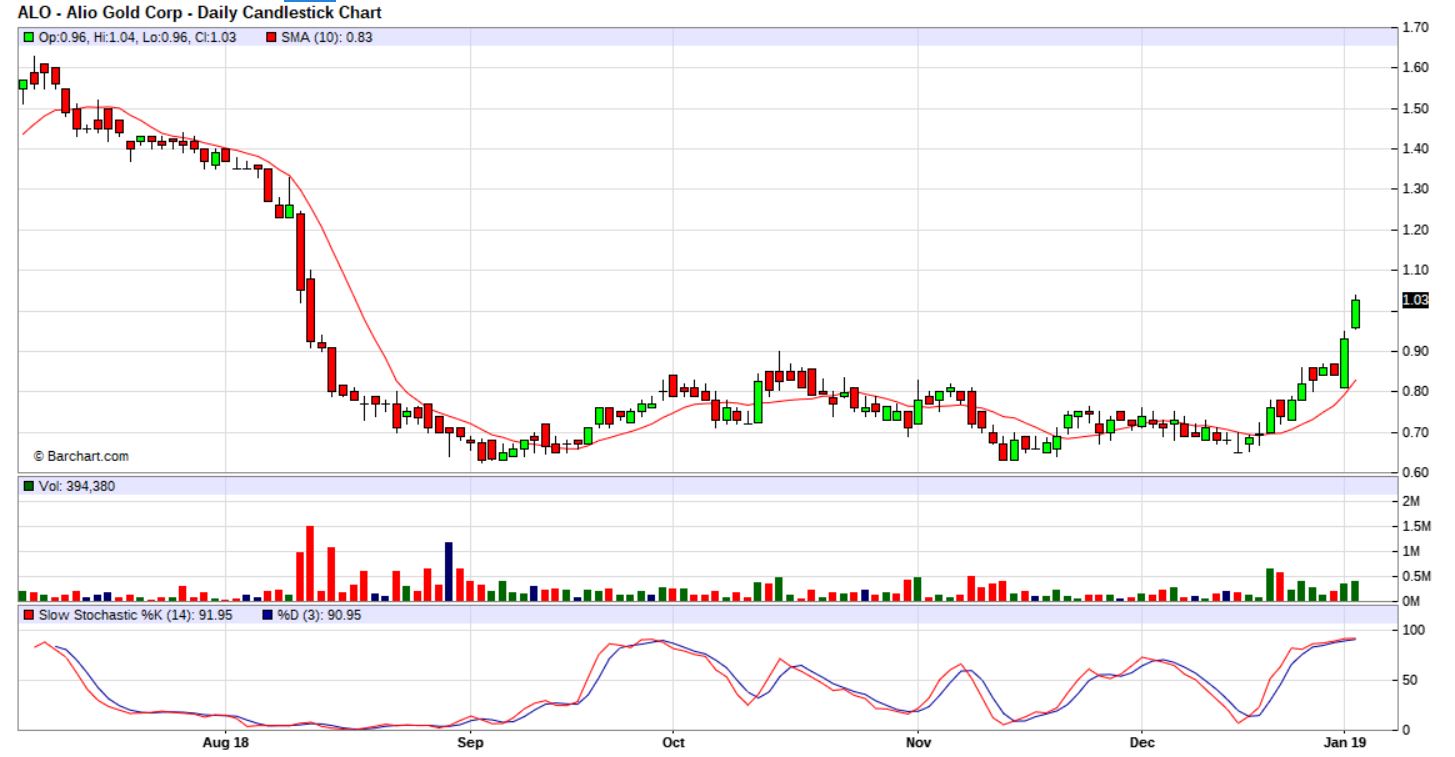
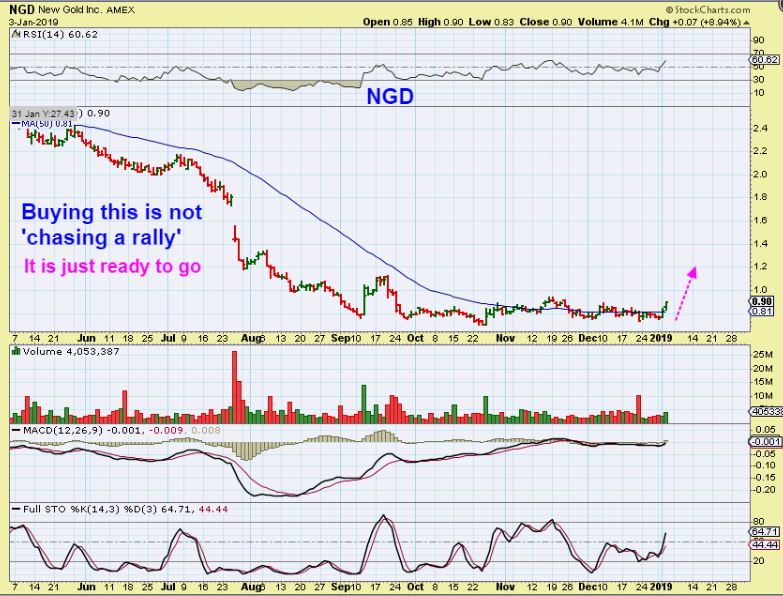
NGD – I compared ALO to NGD. Well, NGD moved up 10% Thursday too. This is a great looking base. If this sector stays bullish, this could just run higher.
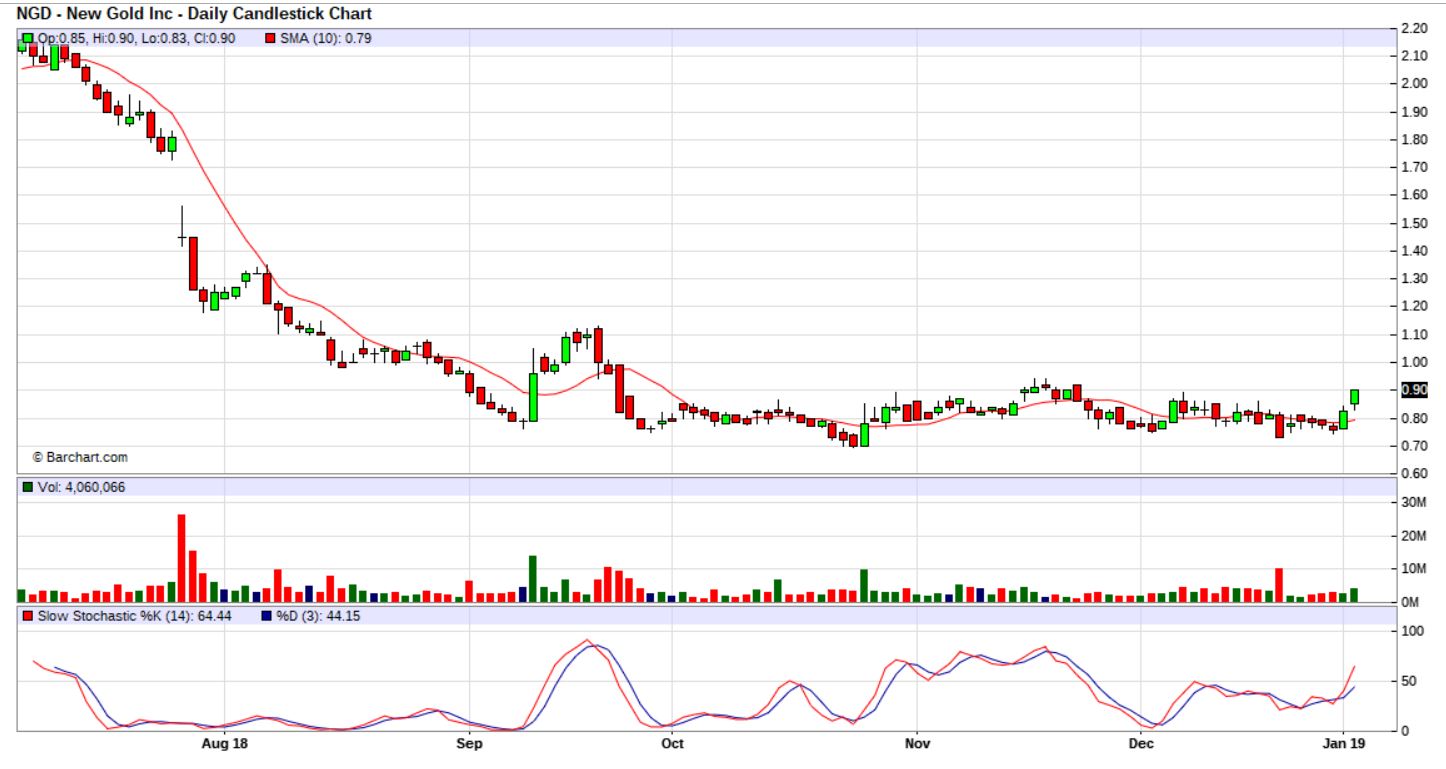
NGD – NGD was up another 10%, so 20% for the week. Let me ask you, Does buying a stock in a base like this look like you are ‘chasing it’? No, because it is trying to play catch up. These are just breaking out from a nice base.
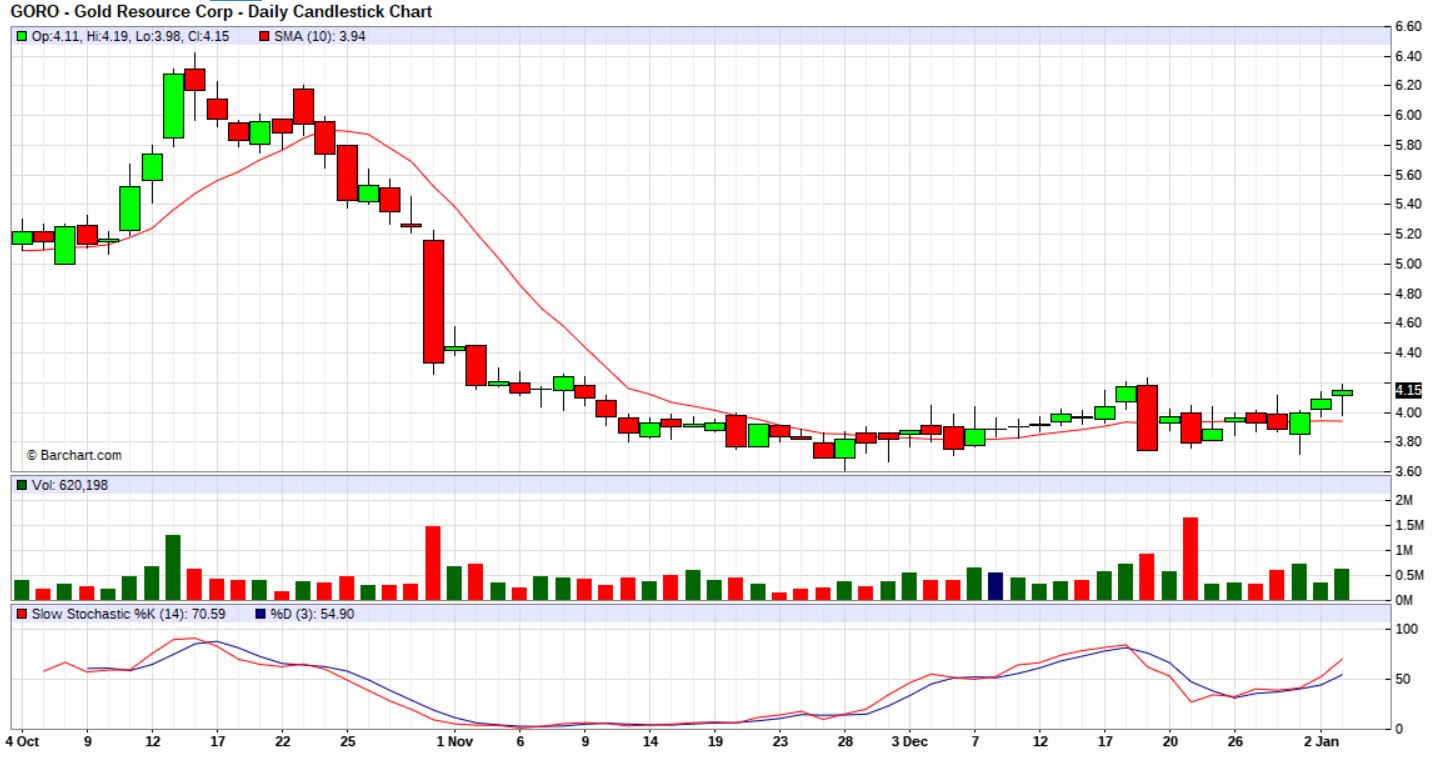
GORO – I pointed out GORO, and said that you may want to watch it for progress, since it is RIGHT AT HE LOWS.
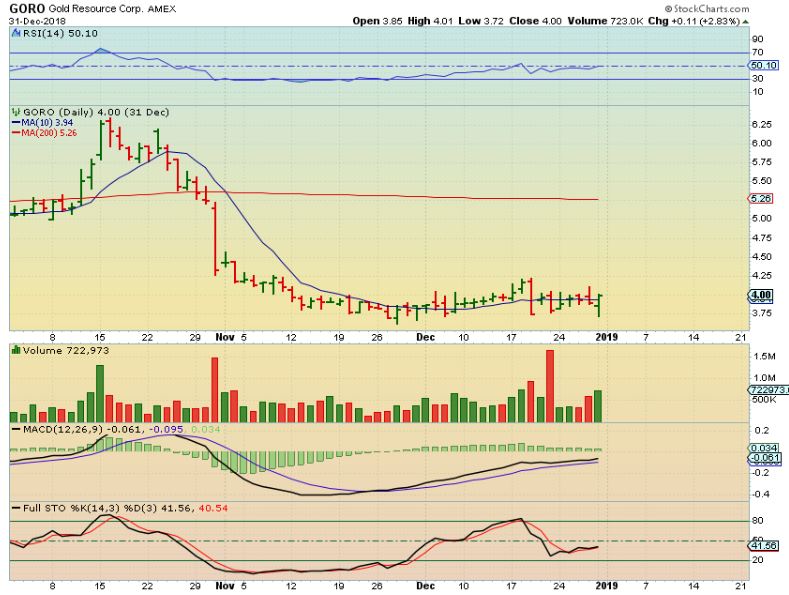
GORO – 2 days later it has moved higher and may break out from the base too.
NOTE: With these Miners, there is always the fear of a bad earnings surprise and a gap open lower. That risk can lowered with smaller position sizes and buying a basket of Miners. Anyone that doesn’t want to ‘chase this move’ could grab 3 small positions in these 3 Miners moving out of their bases, along with a few others near support, and use stops.
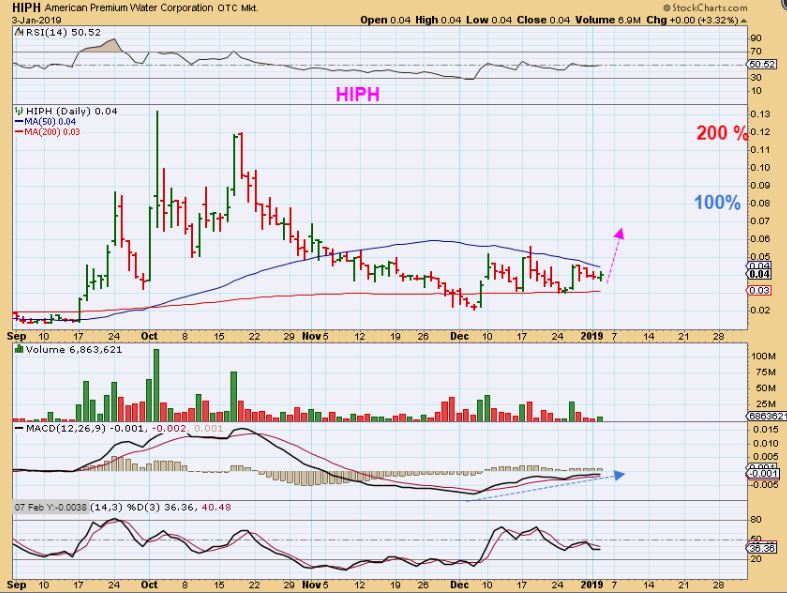
HIPH – I discussed this several times as a BUY & HOLD Hemp / MJ Stock , and I liked the way it was pinched between support and resistance. I bought it few times at the 200 sma….
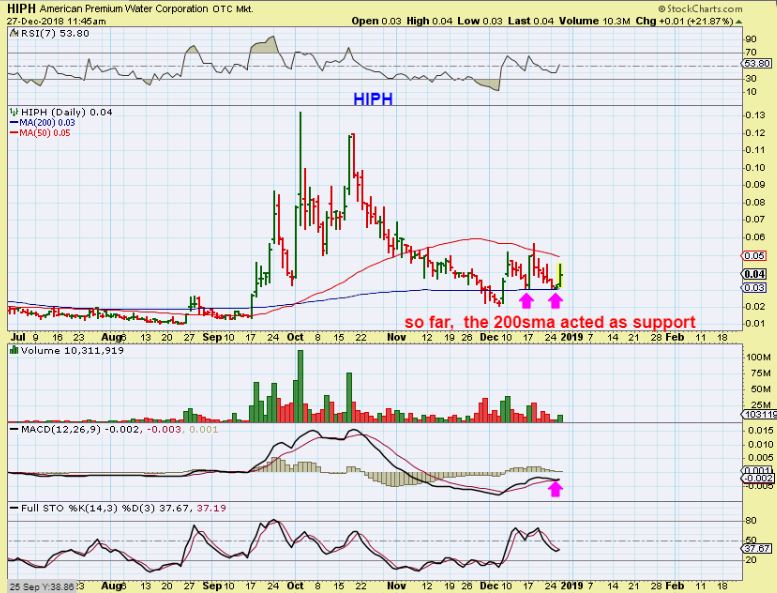
HIPH – This sector has been on fire, and it may be ready to break out. The last break out was 100 & 200% gains. That said, please don’t go ‘ALL IN!” this moves fast & can crash too. Take a reasonable position and just hope to make some money to take your loved one out to dinner. 🙂
MNTR – Speaking of Dinner, this sector is HOT. I saw MNTR ramp up with BIG volume for 1 hr. I decided not to buy it, but…
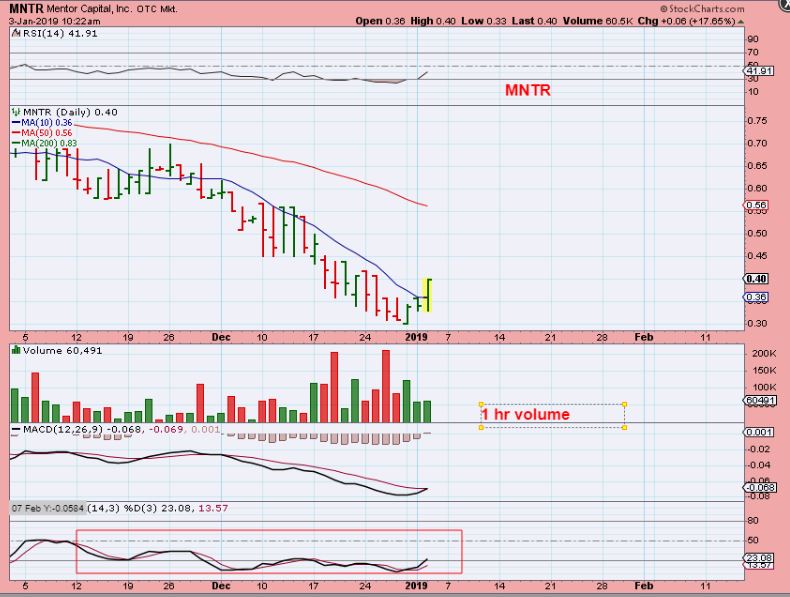
MNTR –
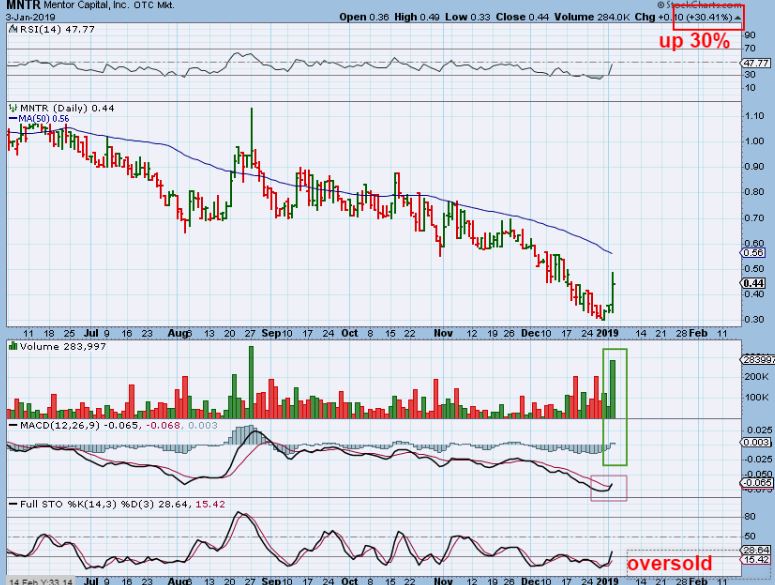
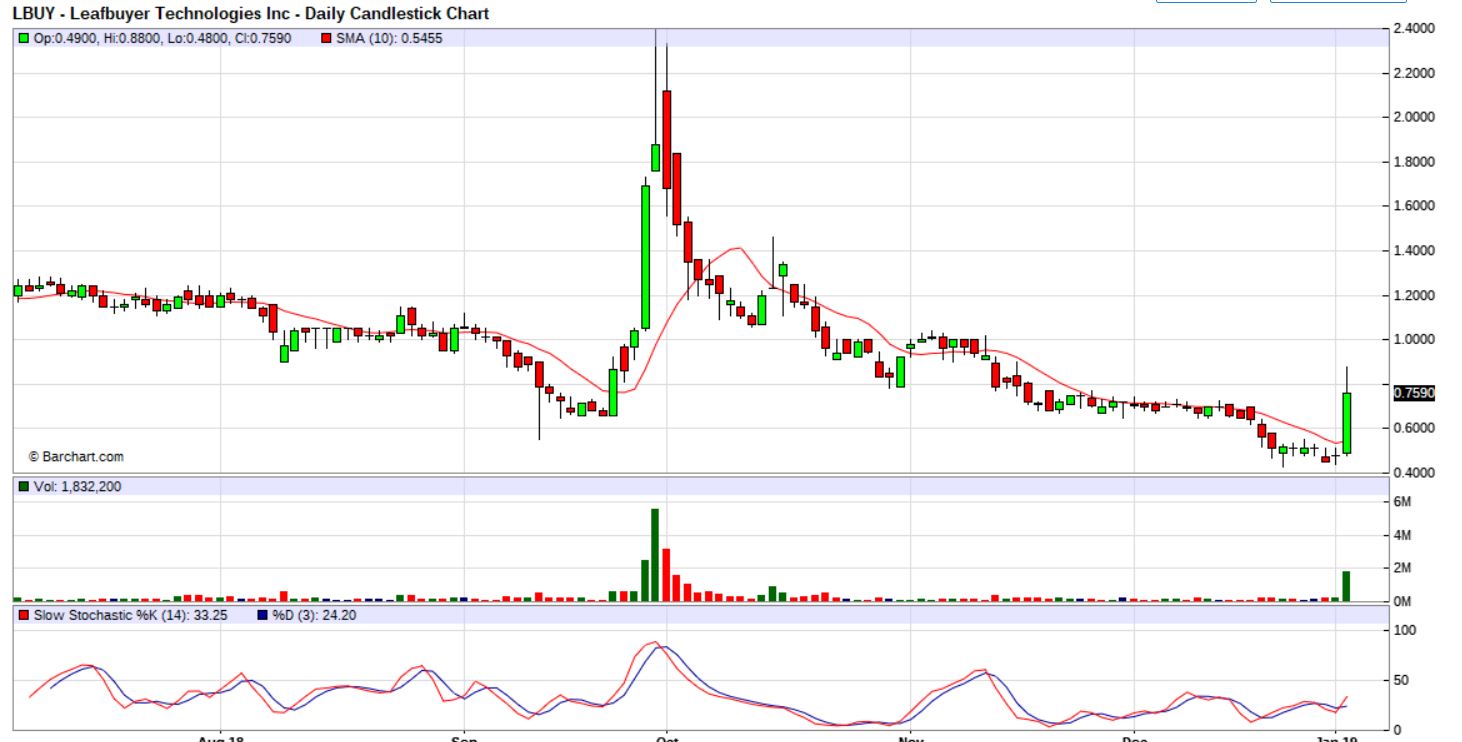
LBUY – I saw LBUY just burst higher even before 10 am, and the volume was almost what it had all the prior day. I mentioned it in the comments, but it would be too late to buy, since it was already up 30% in just 1/2 hr of trading. Right?
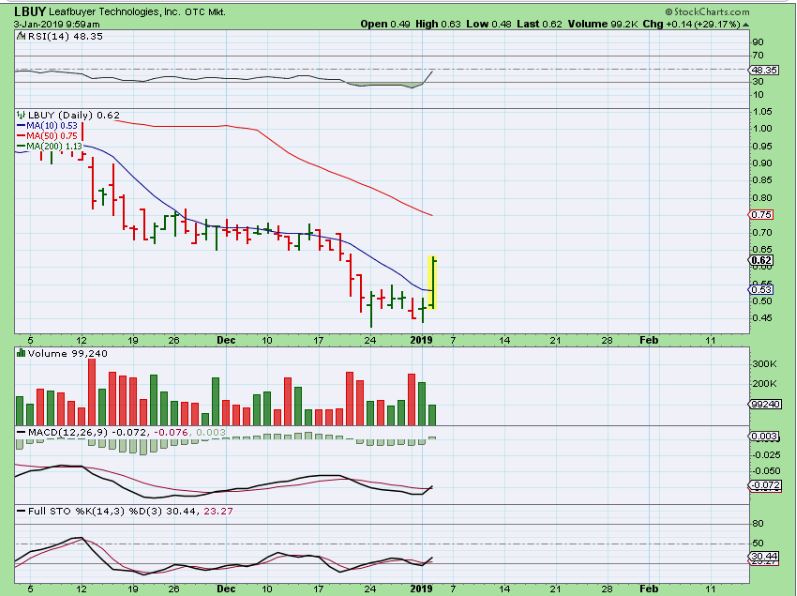
LBUY – Well, it closed up 60%, remains oversold and in the past it ran like a Cheetah!