Dec 29th – The Weekend Check Up
I would venture to say that by now, after the past several weeks of choppiness and selling off, most if not all here know my thoughts on how things could play out going forward. It does seem that things are lining up now. let’s let the charts speak for themselves. Let’s get right into it…
.
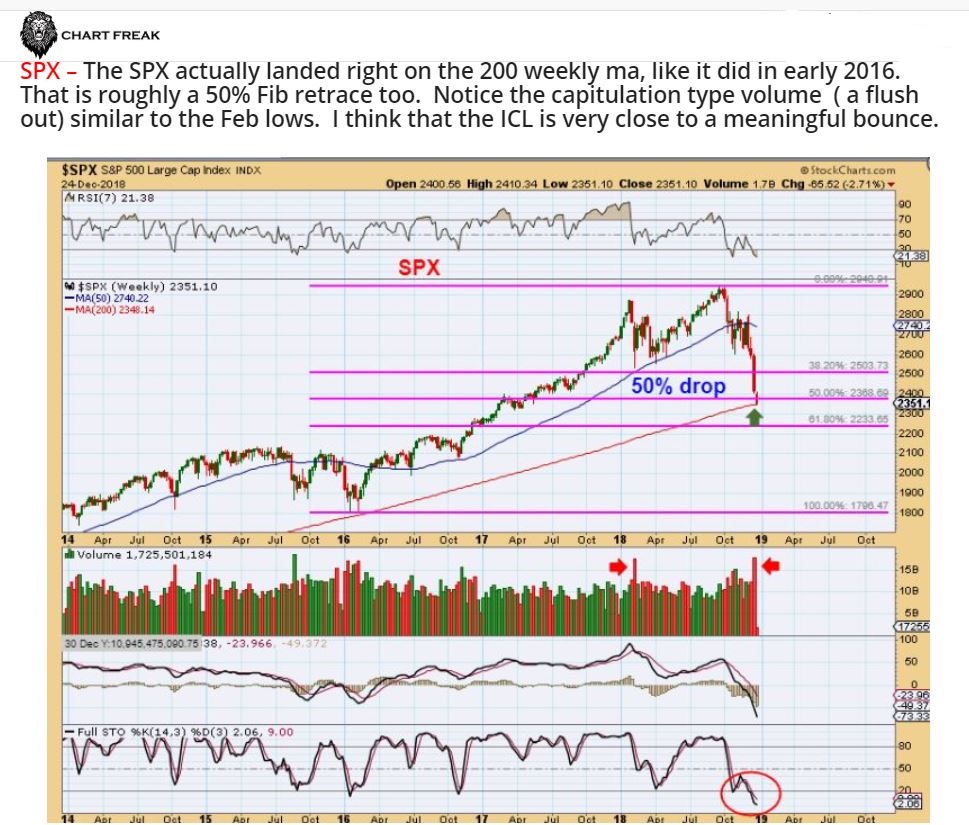
SPX – On Dec 24th, I gave several reasons that this should be the ICL that I have been expecting. I mentioned the PUT / CALL Ratio, Sentiment, etc, so a reversal here is a buy with a stop under the lows…
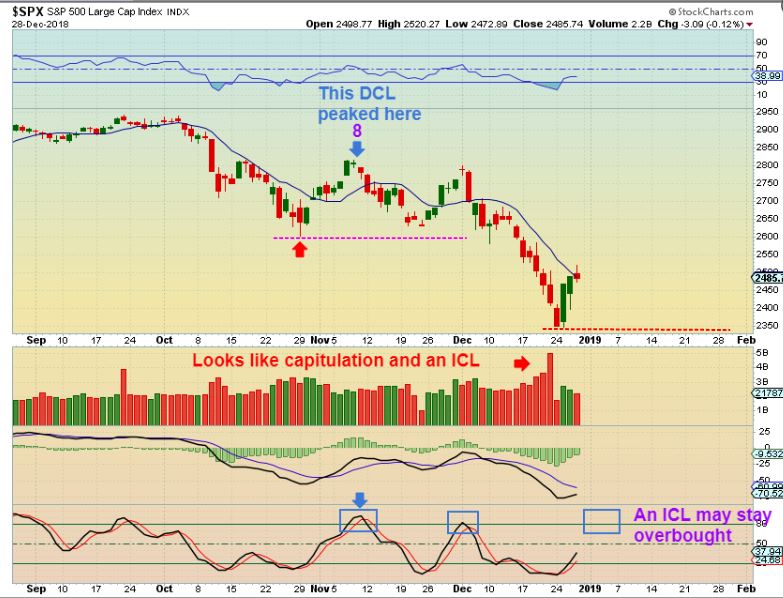
SPX – Capitulation volume came in on day 38, and that is good timing for a DCL/ ICL. The 3 day bounce is not even near ‘Overbought”.
This is where it gets important…
Important Note: When I give a BIG PICTURE or LONG TERM OUTLOOK, I am giving my best current observation and analysis, based on many things that I am currently looking at. Please Understand that as the Markets Moves forward and things play out, you then get even a clearer picture of what to expect. So with that I always say, STAY FROSTY, and I also want to add, STAY CURRENT. 
.
Is it possible that todays Big Picture idea could be slightly altered in a month or two? Yes. Similar to when a Guide takes you on a tour, a sudden storm or change in some current circumstances can raise the need to take another path. Do not form a unbreakable bias here, just use this information as a guide going forward, and we can make adjustments along the way. 🙂
.
SPX – So my current big picture look is that these mighty bull markets have seen their top. I see a double top and a crash that broke support. It is OK to go long here after an ICL, and I am watching how these daily cycles play out over the next few weeks. RESISTANCE MAY BE A PLACE TO GO SHORT LATER. See the chart.
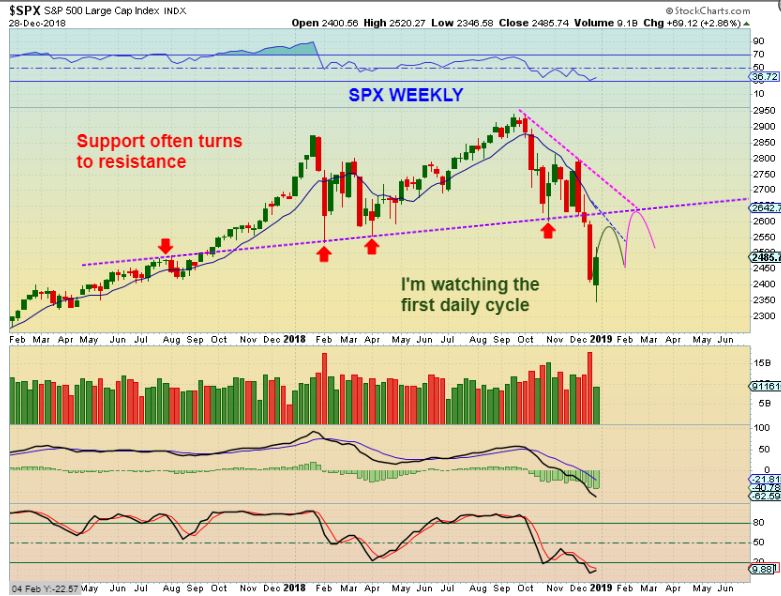
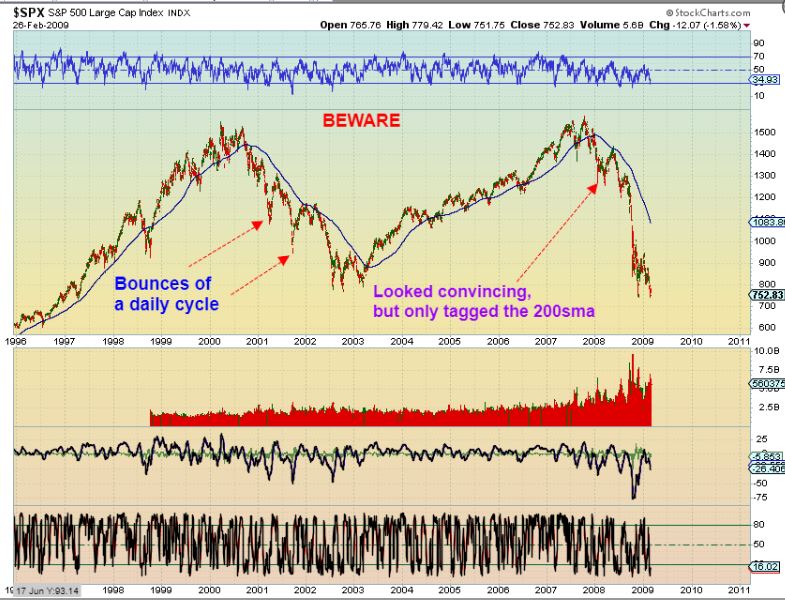
SPX – In the 2000 and 2008 crash, Markets broke the 200sma, ‘paused’ (Magenta arrows) for a daily cycle or two, and crashed further. This chart is my CURRENT Thinking.
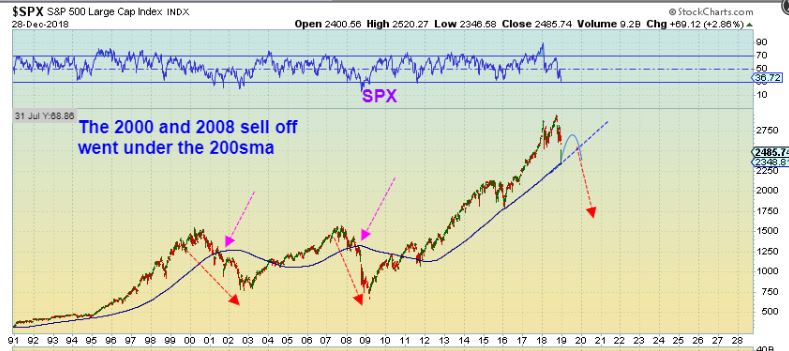
SPX – So the daily cycles would look like this. Trade-able, but do not MARRY the positions. When we reach the 50 or 200 sma, we can look to see how things look (weak or strong).
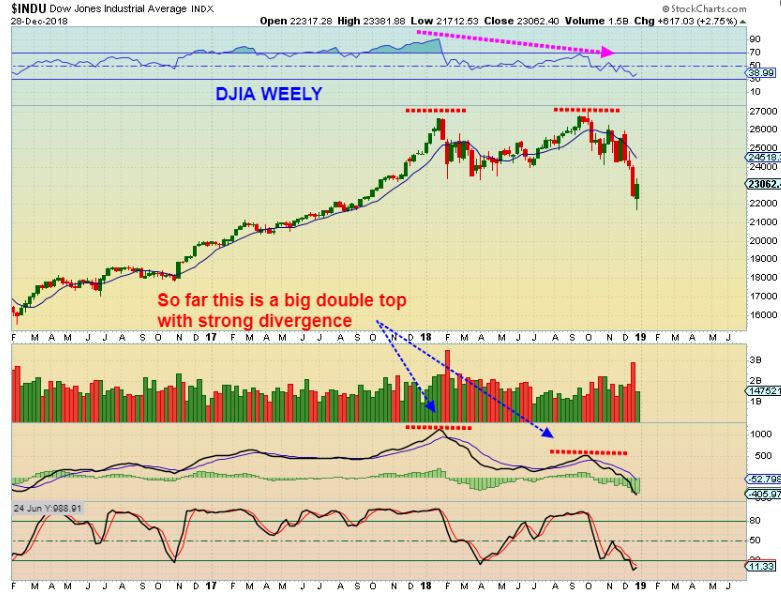
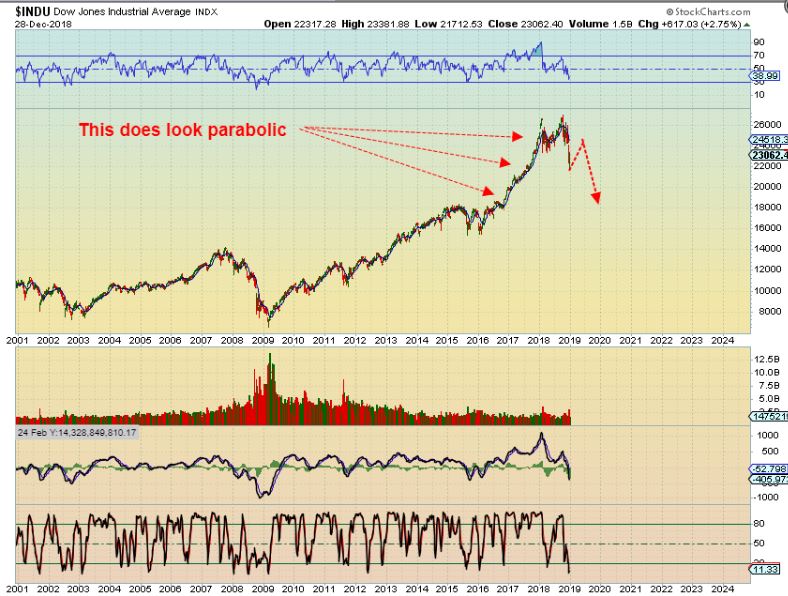
DJIA – This is a double top with divergence so far. Now it became oversold & we have a weekly reversal candle. Expect a bounce.
DJIA – This is what I am thinking we could see. It is a WEEKLY CHART, so this bounce would take weeks to play out.
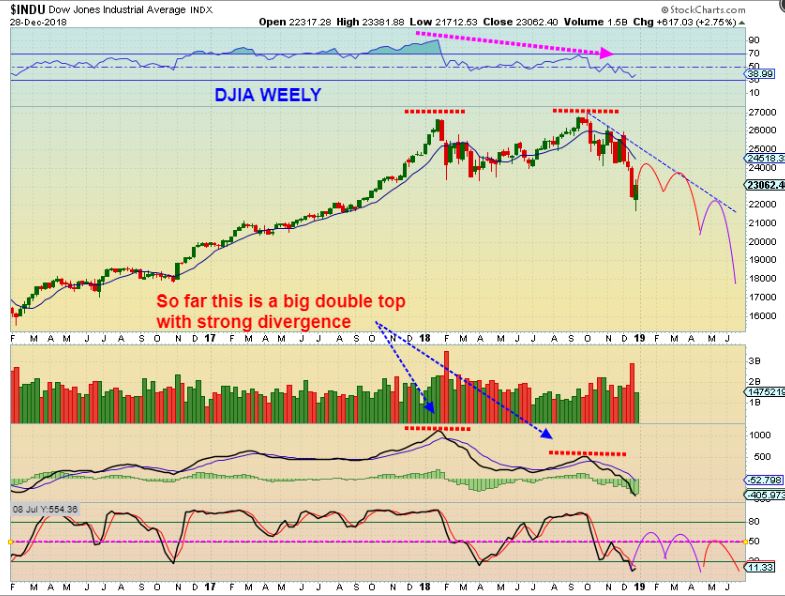
DJIA – Was this a parabolic type run? The Dow does look fairly straight up. The sharper the rise, the sharper the drop usually.
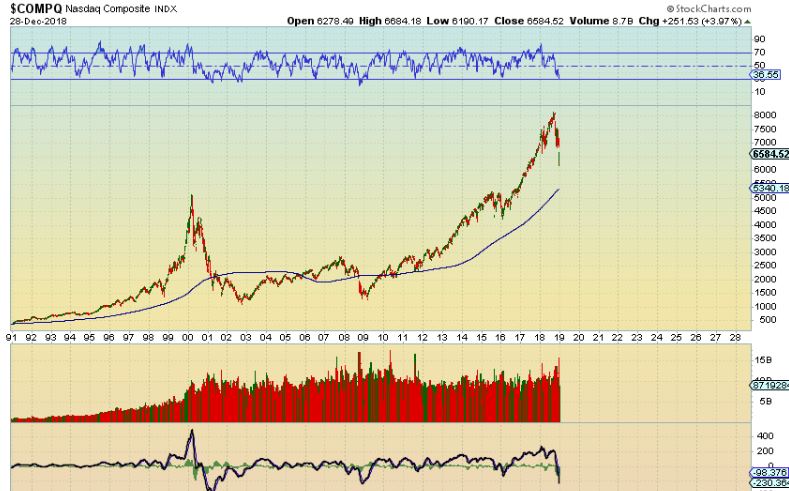
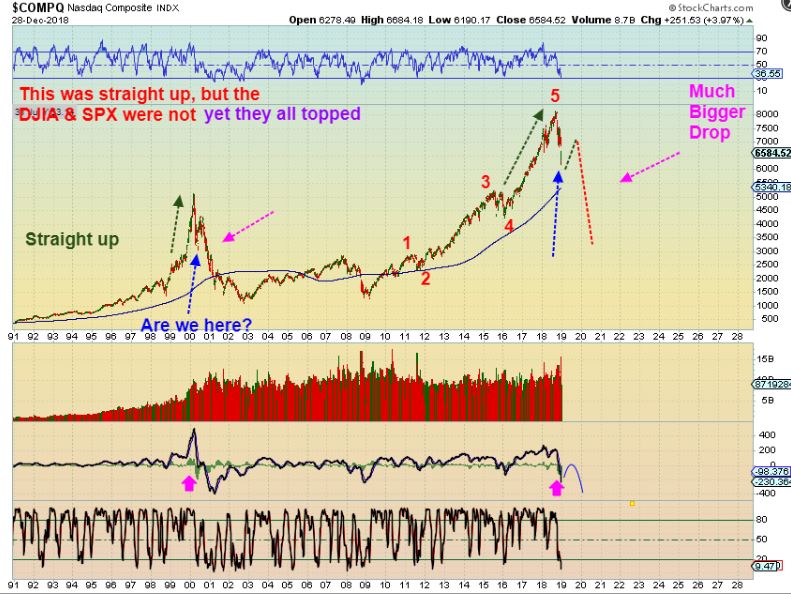
NASDAQ – Look at the 2000 parabolic blow off top and the current one. That could be a 1-2-3-4-5 to the top, as mentioned in past reports. A-B-C down? or 1-2-3-4-5 down would be next.
NASDAQ – In 2000, the DJIA & SPX were not straight up, but they topped too. This is what we could see next.
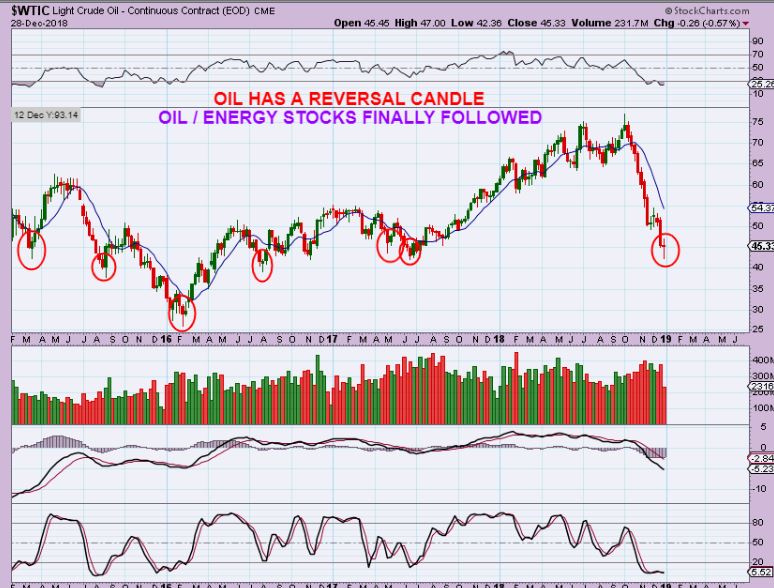
WTIC #1 – We have a weekly reversal in Oil, but the last one failed after 3 weeks,so I will Stay Frosty.
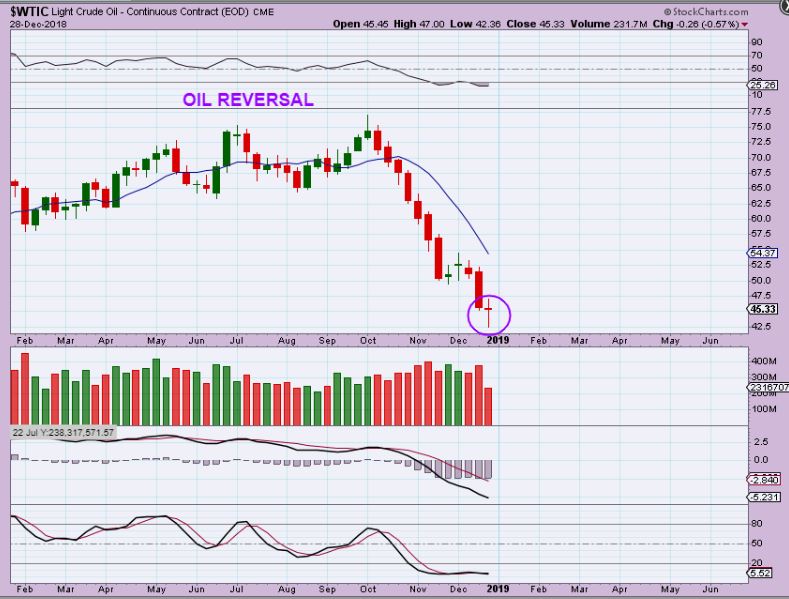
WTIC #2 – Not all reversals just take off higher, but a steep sell off can have a strong bounce, and this was steep. Either way, it is important to use stops.
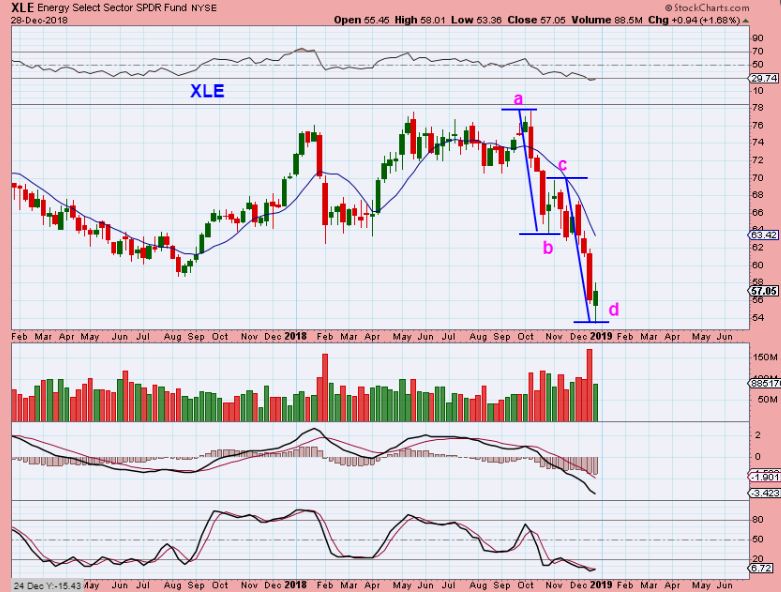
XLE – This 2nd leg down was pretty close to equal length of the first one down, and now we have a weekly reversal in Energy Stocks too. I BOUGHT A FEW ENERGY STOCKS.
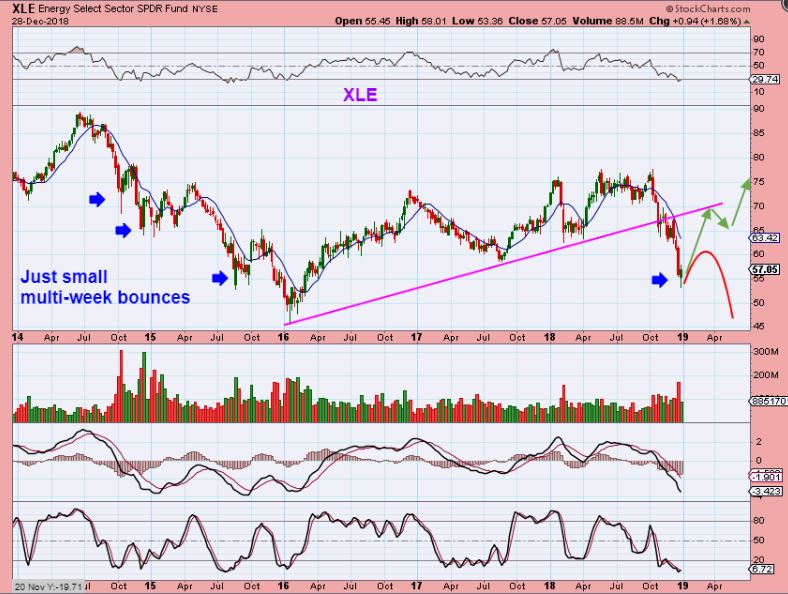
XLE – I’m going to watch this trend line if Price gets that high. You may want to Trail stops if you own Oil / Energy stocks, but this should be an ICL.
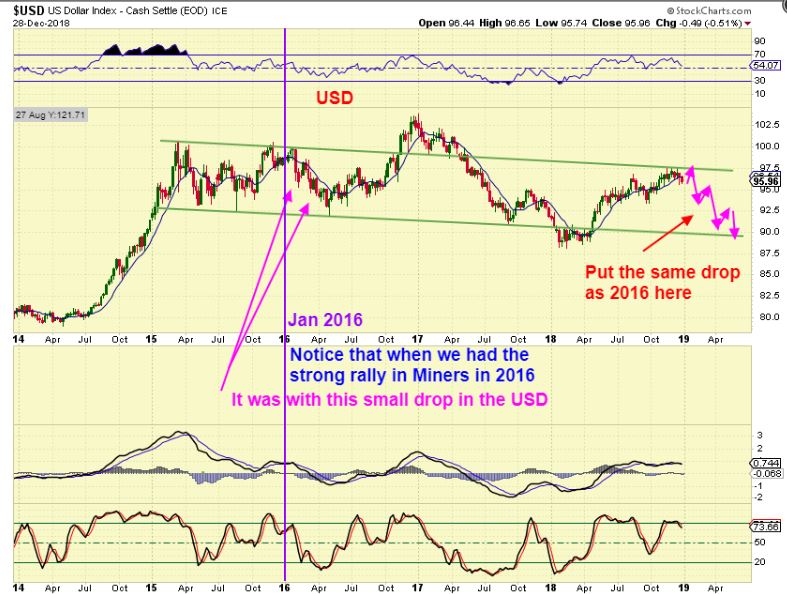
USD #1 – Honestly, The USD has been bullish in 2018. It broke down & recovered, but seems to be curling down the upper resistance..
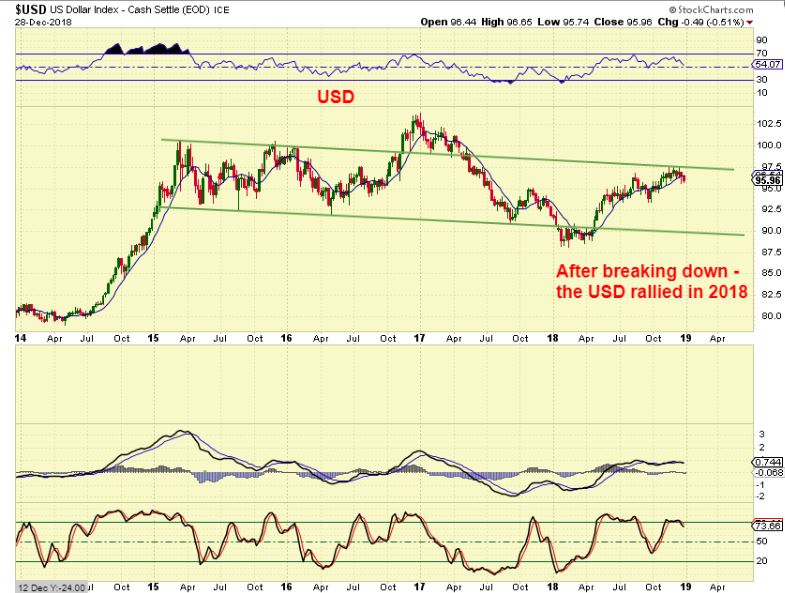
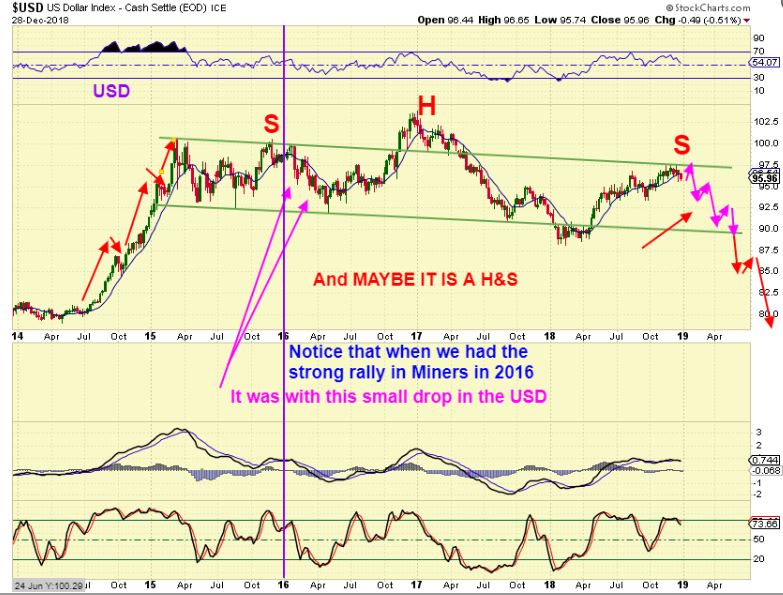
USD #2 – If it drops like this in 2019, Precious Metals could really take off. Notice that this drop is exactly what we saw in 2016. Also…
USD #3 – That could then form a H&S, and extend the drop in the USD & Rally in Gold & Miners.
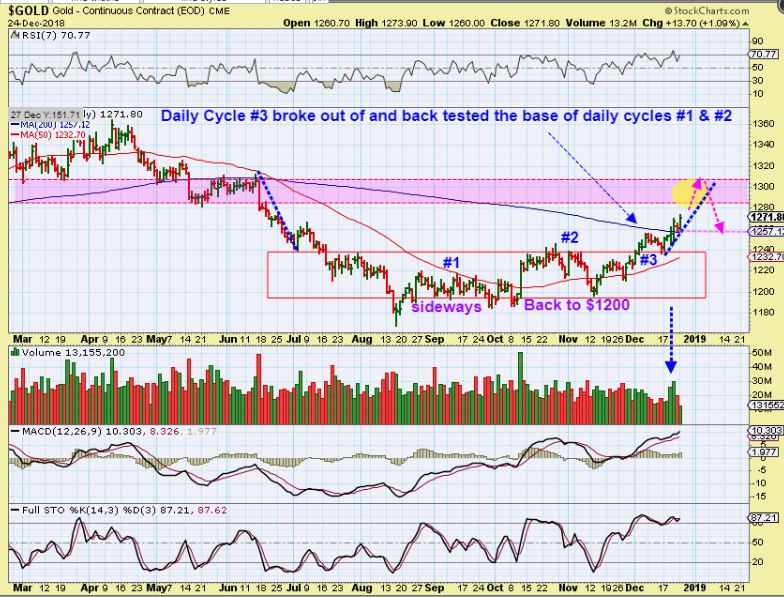
GOLD – After 2 sideways choppy daily cycles, Gold has put in an impressive 3rd daily cycle. This was my DEC 24th chart showing possible resistance, and now
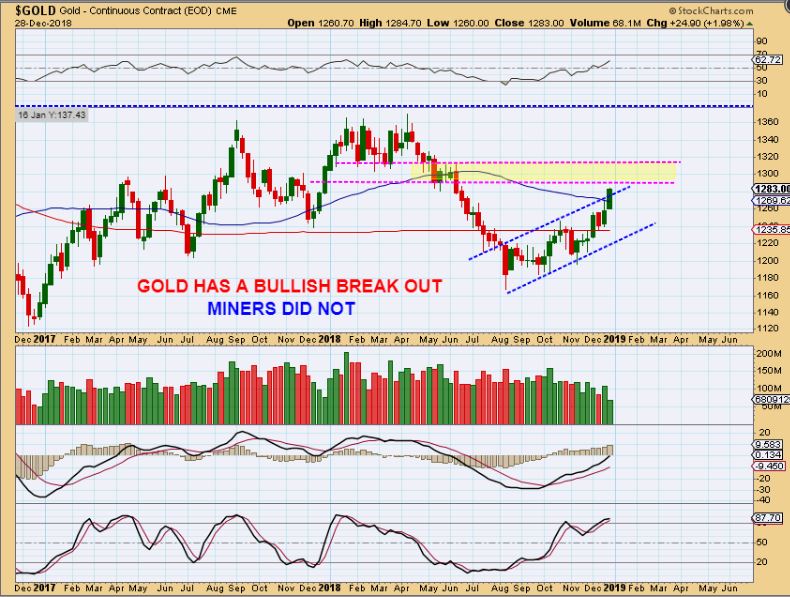
GOLD WEEKLY – Now the weekly chart looks quite bullish, closing at the highs Friday. I still have to expect that pull back though, because the Miners have slowed down. So , is this a false break out above the 50 weekly ma and an overthrow of the channel? We’ll see. It does look very bullish, and …
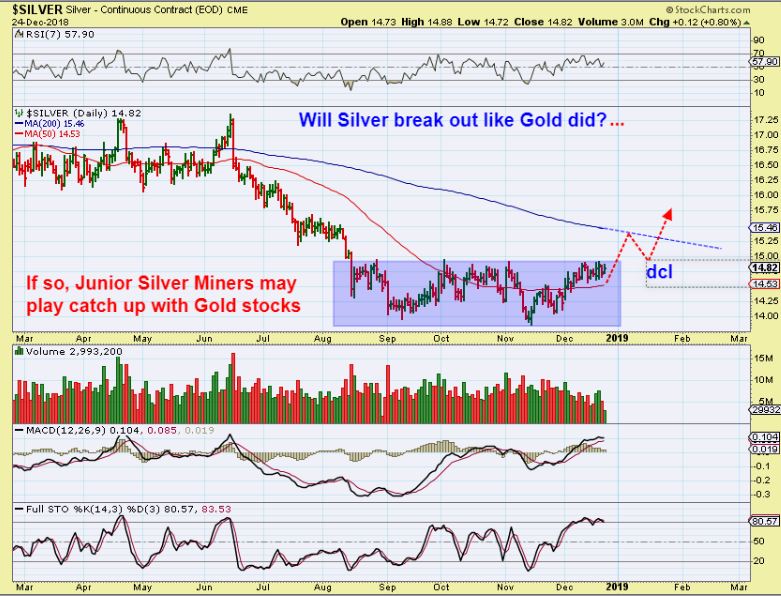
SILVER – I posted this after Mondays trading. Can Silver break out?
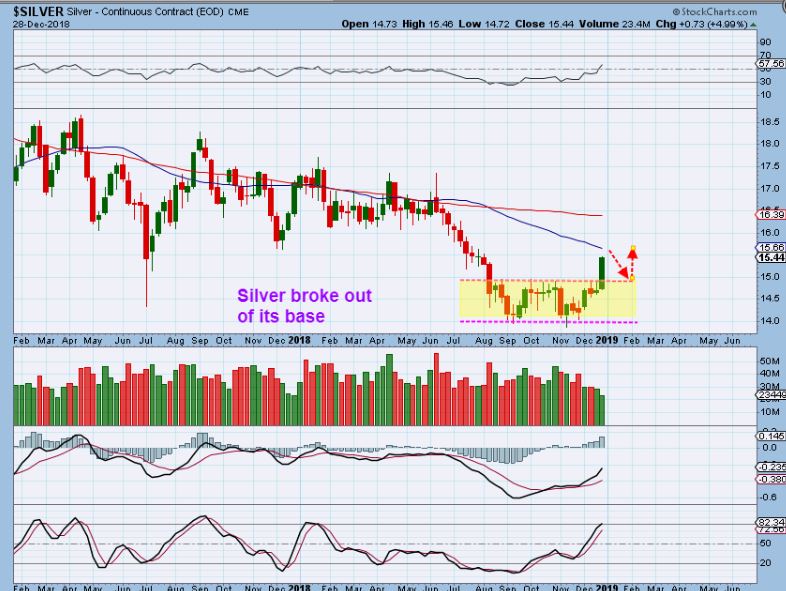
SILVER – Silver broke out from that base in a BIG way this week. This looks very bullish – The problem? Silver Miners did not follow. Friday saw many Miners down.
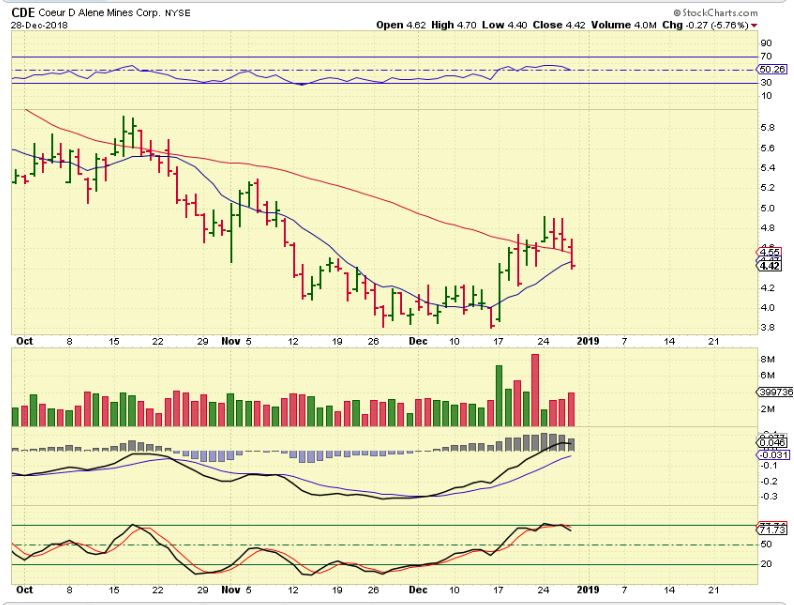
CDE – Silver broke out, and CDE gave up both the 50 sma and the 10sma, and is still overbought. This looks like a sell off is starting. AG, HL, PAAS and a few others dropped as Silver Popped too.
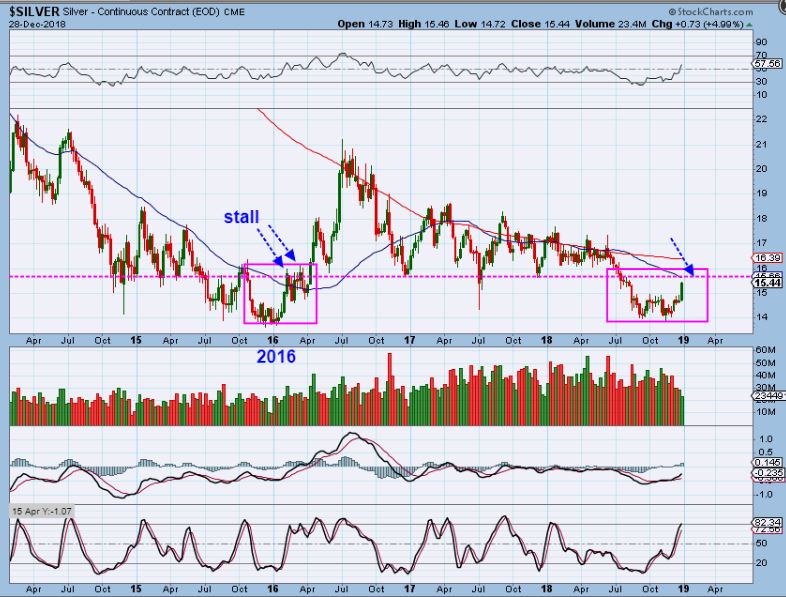
SILVER – So I stepped back and noticed that in 2016, before the big Run, Silver looked very similar to the current set up, doesn’t it? But then it then stalled, so we’ll see what happens. I have to expect Miners to pull back a bit.
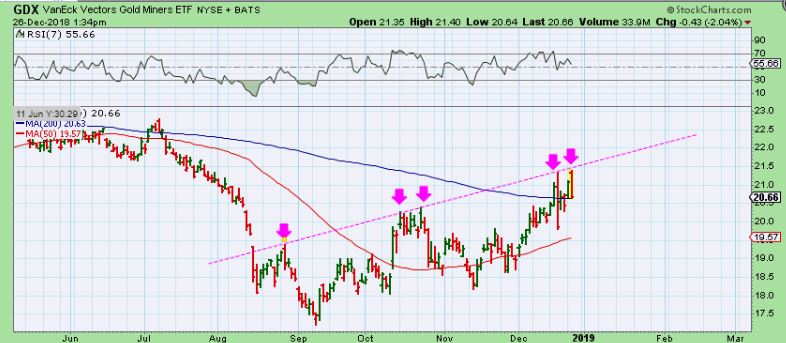
GDX DEC 21 – LAST WEEK I pointed out the weekly reversal candle at resistance. We could then drop, or I also mentioned….
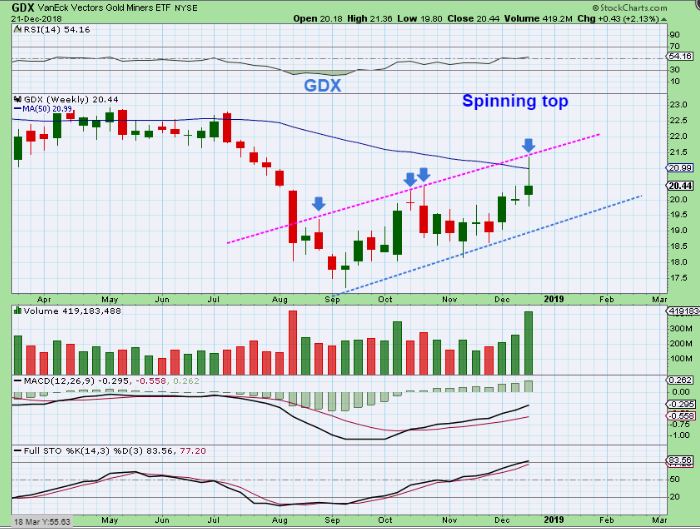
GDX DEC 21 – That during the holiday week, Miners could run to highs again into day 30 or so, and form another reversal candle. They did that in October too.
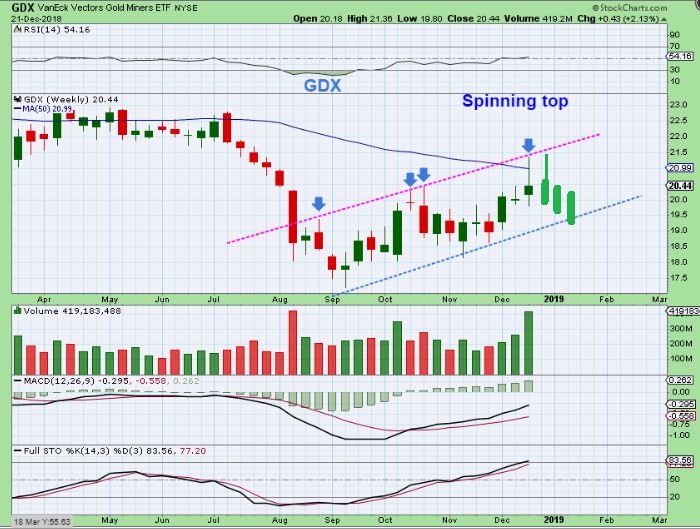
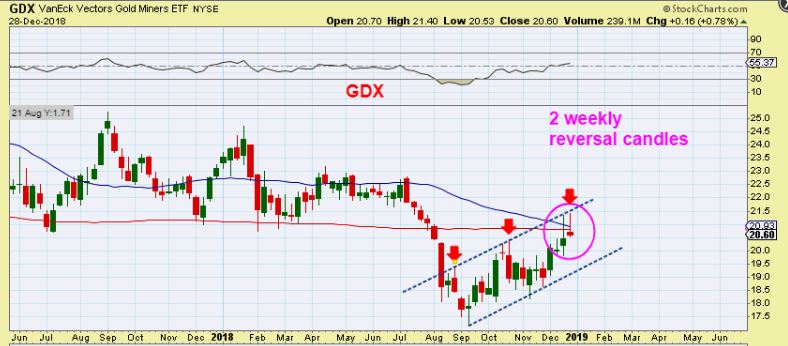
GDX – Now we have 2 GDX Weekly reversal candles, closing under the 50 & 200 weekly ma. NOW CAN WE GET THAT PULL BACK?
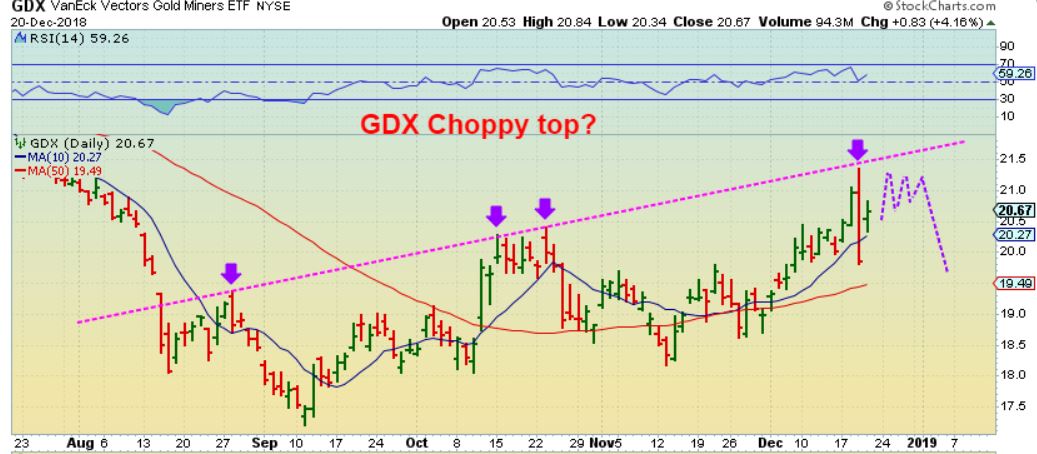
GDX DEC 20– Back on DEC 20- I thought that the MINERS were looking stronger, so I mentioned that they could hang at the highs & become choppy. I said that I might short them there if they do.
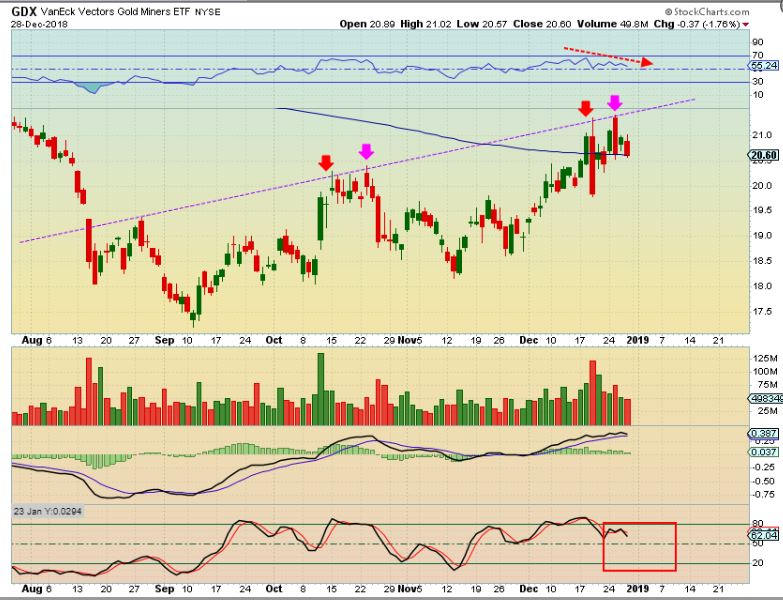
GDX – I bought DUST & added to it on this double top, and I will use a stop if GDX breaks above this channel
So far, GDX, GDXJ & SIL has NOT followed GOLD & SILVER as they broke out to new highs. This could be the sign that the drop to the Daily Cycle Low is coming next week.
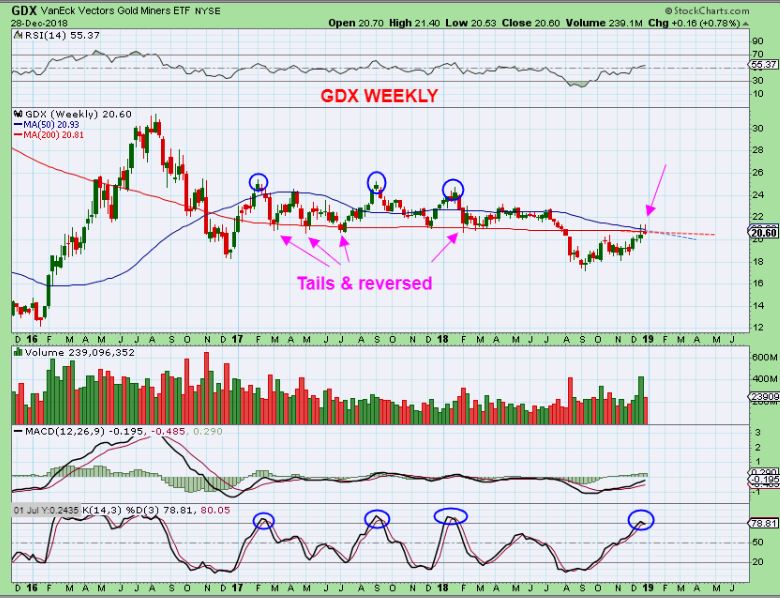
GDX – Weekly Tails at support or resistance do often signal a reversal.
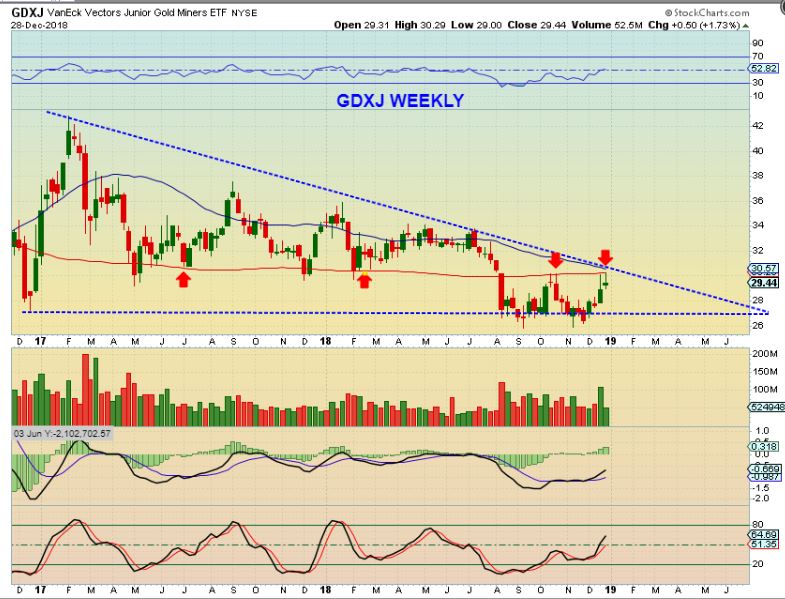
GDXJ – Weekly Tails here too. 1 more pull back would be a GREAT buying opportunity.
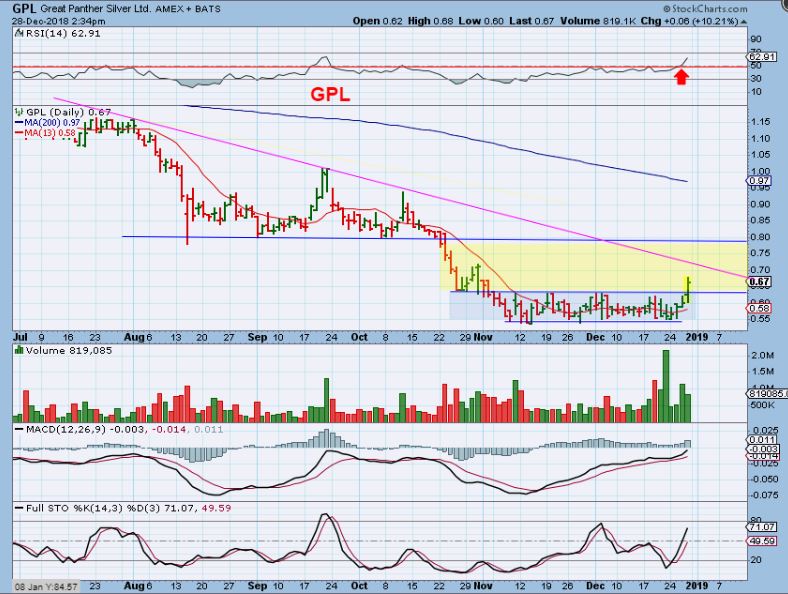
GPL – I mentioned that GPL looked ready to go, and a break out could be bought.
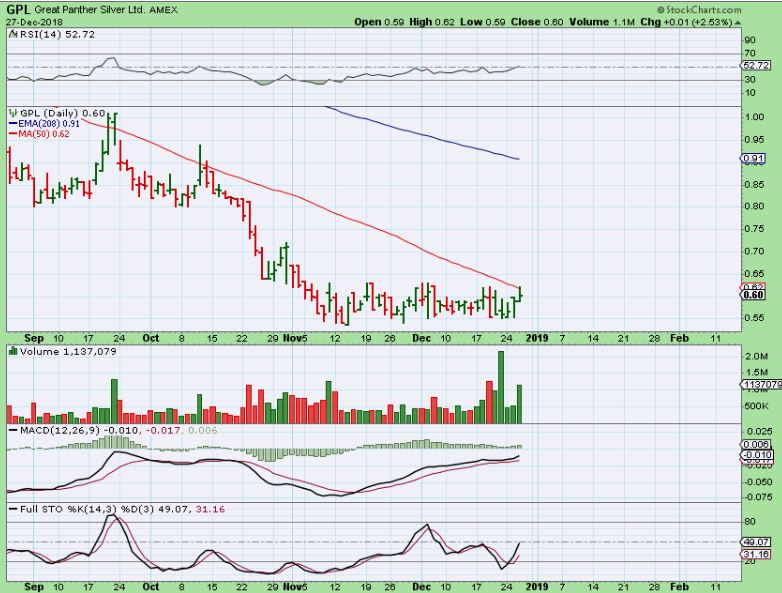
GPL -It broke so I grabbed it and it closed up 11%. It is weird, but I bought GPL and I own DUST, and both were green Friday. I may cut this one loose quickly if we get the pull back as expected.
That is your weekly wrap up. I really feel that things are lining up here. The General Markets should have an ICL in place, and therefore can bounce or short term rally. I am hoping that OIL & the Energy Stocks do the same. This could cause profit taking in Miners ( money flowing out of Miners and back into the markets). This would give us out 3rd daily cycles low.
.
I am going to just mention a few trade ideas or possible set ups below, enjoy your weekend !
~ALEX
.
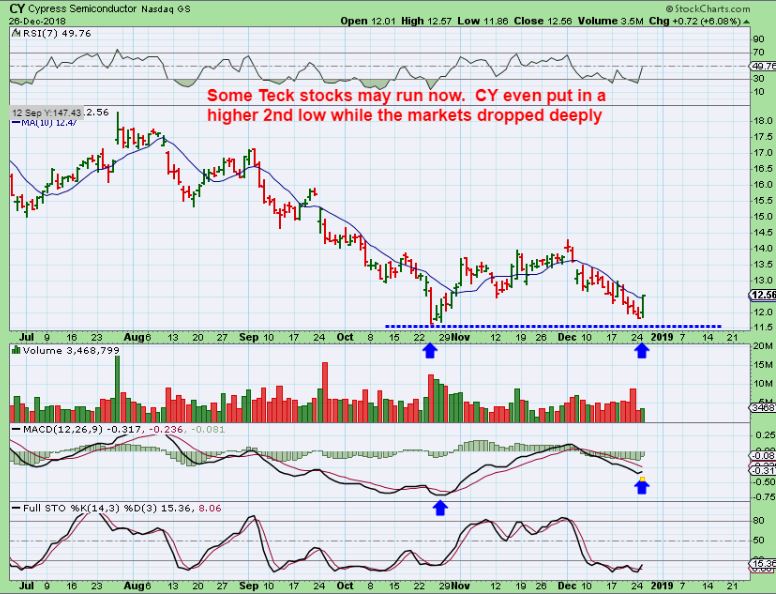
I posted a chart of CY because as the markets sold off day after day, it formed a higher low double bottom. Let’s look at just a couple more that I found looking better than the markets themselves.
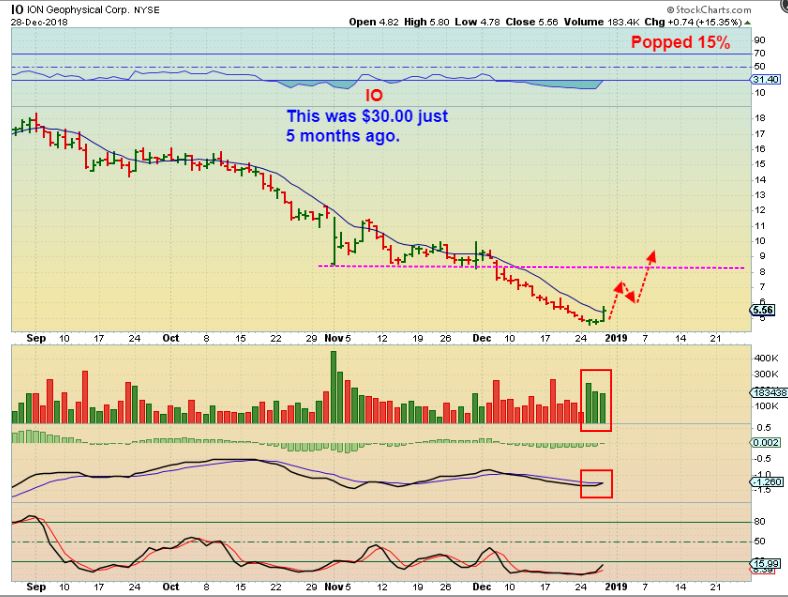
IO – This kind of bounce would be a 100% move. After volume piled up for 2 days, it Popped 15% Friday.
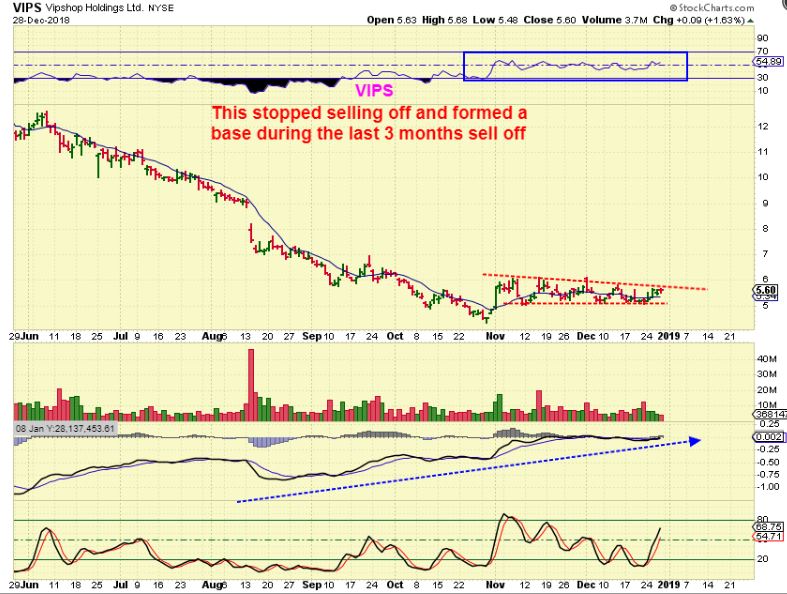
VIPS – This is the type of set up I often see in a BULL market. If this pops from this base, a run from $5 to $7, $8, $9, $10 or more is attainable over time.
See also RNWK, LX, SAIL, HUYA, COUP, etc – I think those former Bull market performers may be setting up too.
.
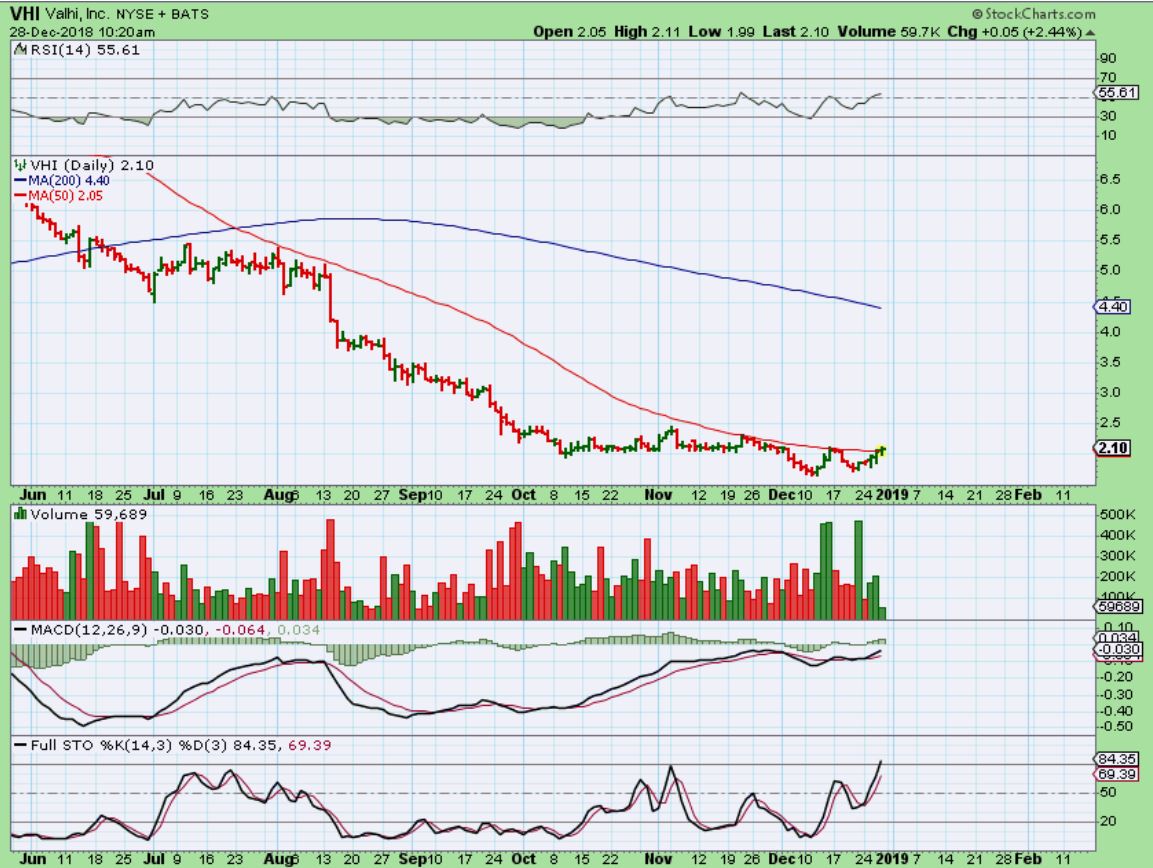
VHI – If this breaks higher above the 50sma, I think it would do well. It has NOT been crashing with the markets either.
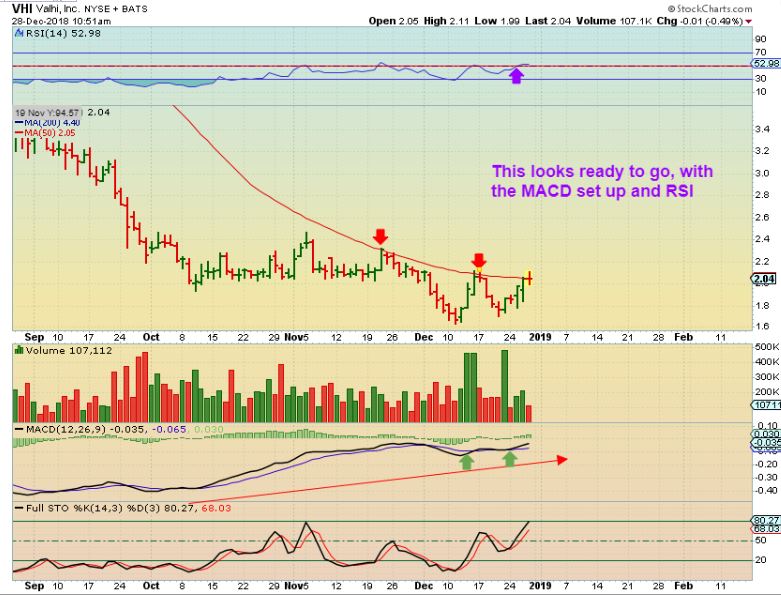
VHI – I like the recent green Volume spikes.
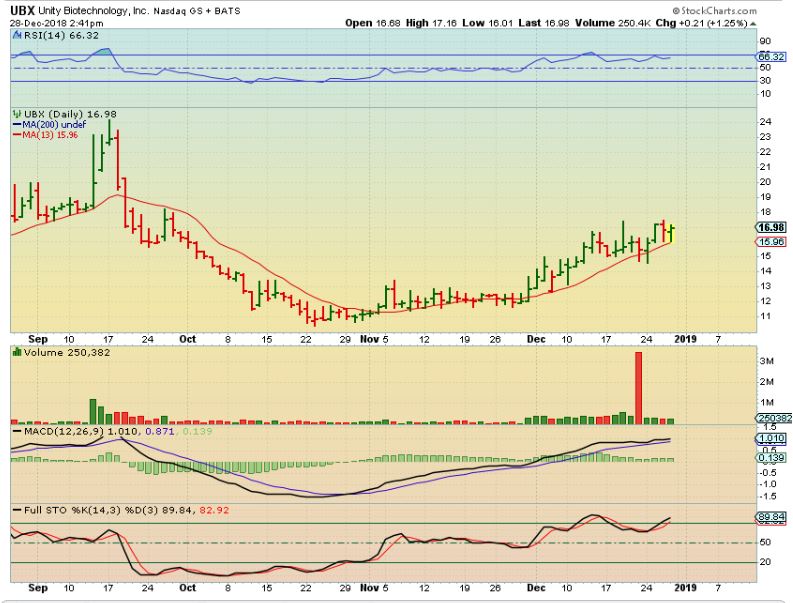
UBX – This has been a steady climber through out the sell off. That alone is impressive.
.
The MJ Sector: This sector is great when it is Bullish, it is VERY DIFFICULT during pull backs and consolidations. Timing this sector is really important, or else you may enter and just end up riding the waves for weeks. I have made some very nice gains in this area, and also I think that the growth potential is real, so I continue to watch it and look for signs that it is possibly setting up for some more upside action after each consolidation periods. Lets take a look at a few stocks, they seem to be ‘setting up” bullishly.
.
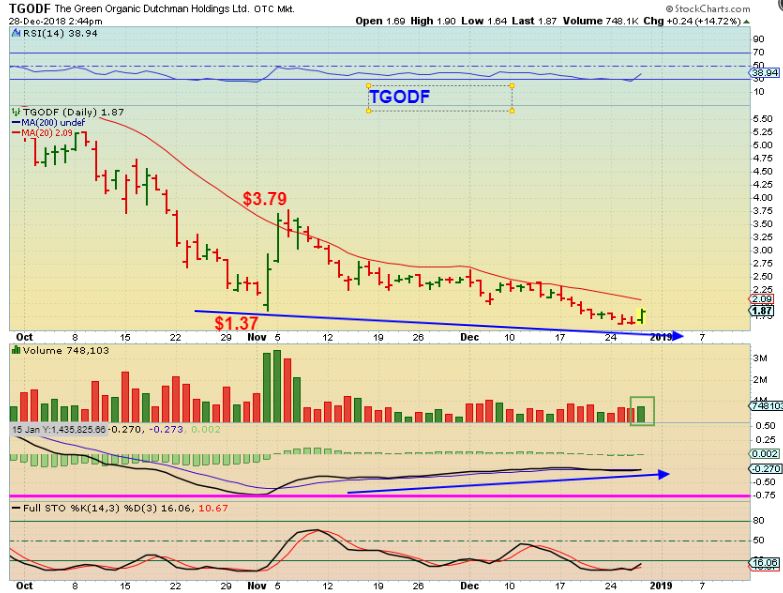
TGODF – This is a double bottom with divergence. One thing that you may notice is that on quite a few of these stocks, they did not sell off that much as the markets crashed. This tiny pop was 15% Friday. When they move, They MOVE!
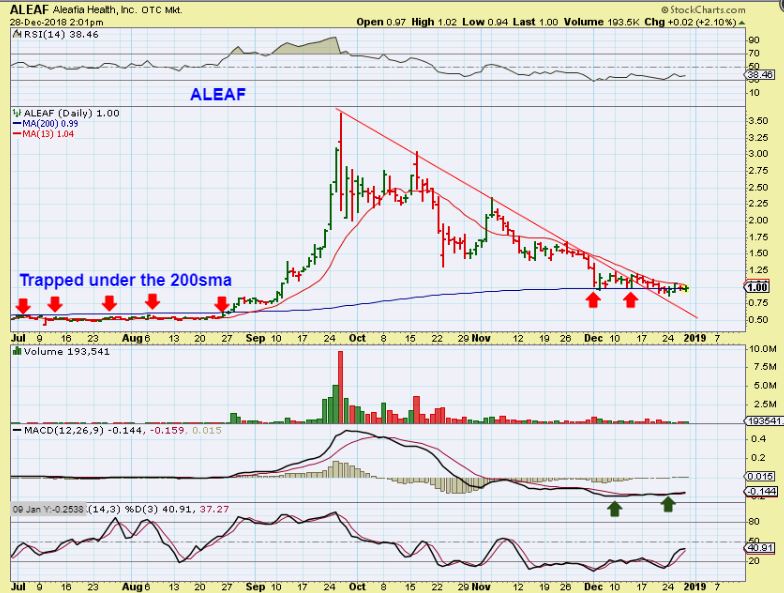
ALEAF – This went sideways along the 200sma in December. See the chart.
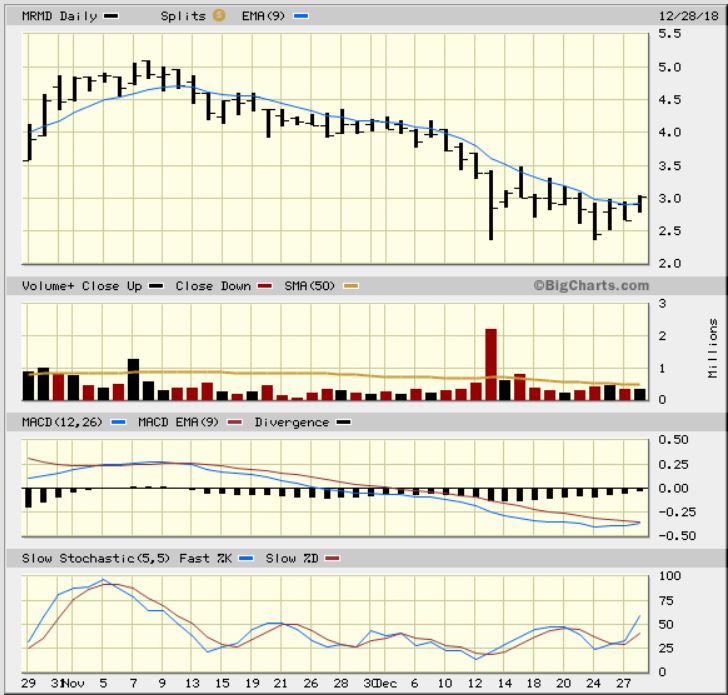
MRMD– I captured this chart of MRMD as it broke above the 10sma. I did not buy it, but I was tempted to.
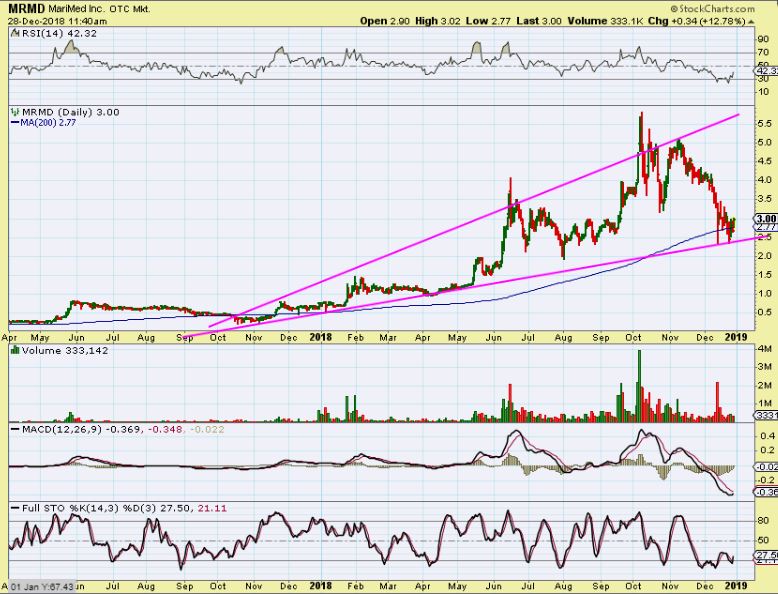
MRMD – This is a bigger picture and it may have done a shake out at the 200sma on its very choppy climb higher. It is still a series of higher lows and the next run ( when it is ready) could run to the top of the channel near $6.00, or 100%.
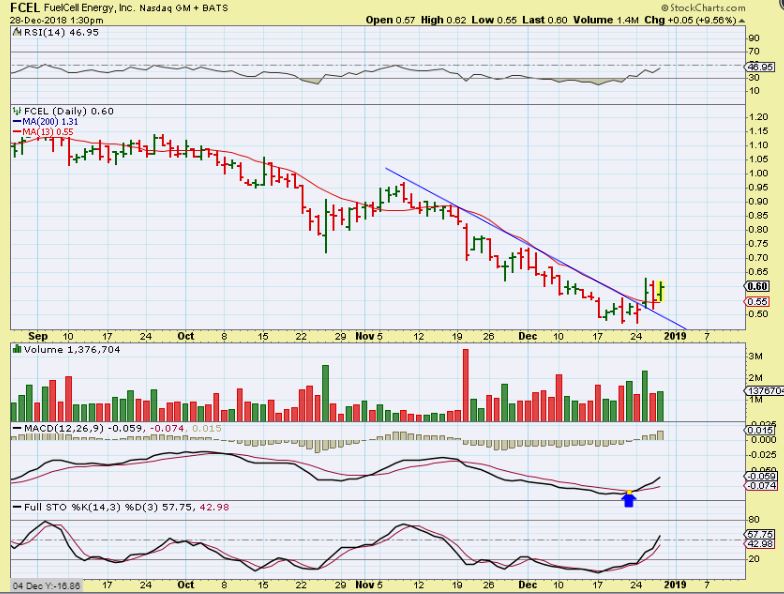
FCEL – I liked this bullish looking Pop, so I posted it in the comments section Friday. FCEL closed with 3.3 Million in volume. This is a buy with a stop under the 13 sma.
I will discuss more BUY SET UPS next week, as they present themselves in TECH, ENERGY, and so on.
.
Finally …
,
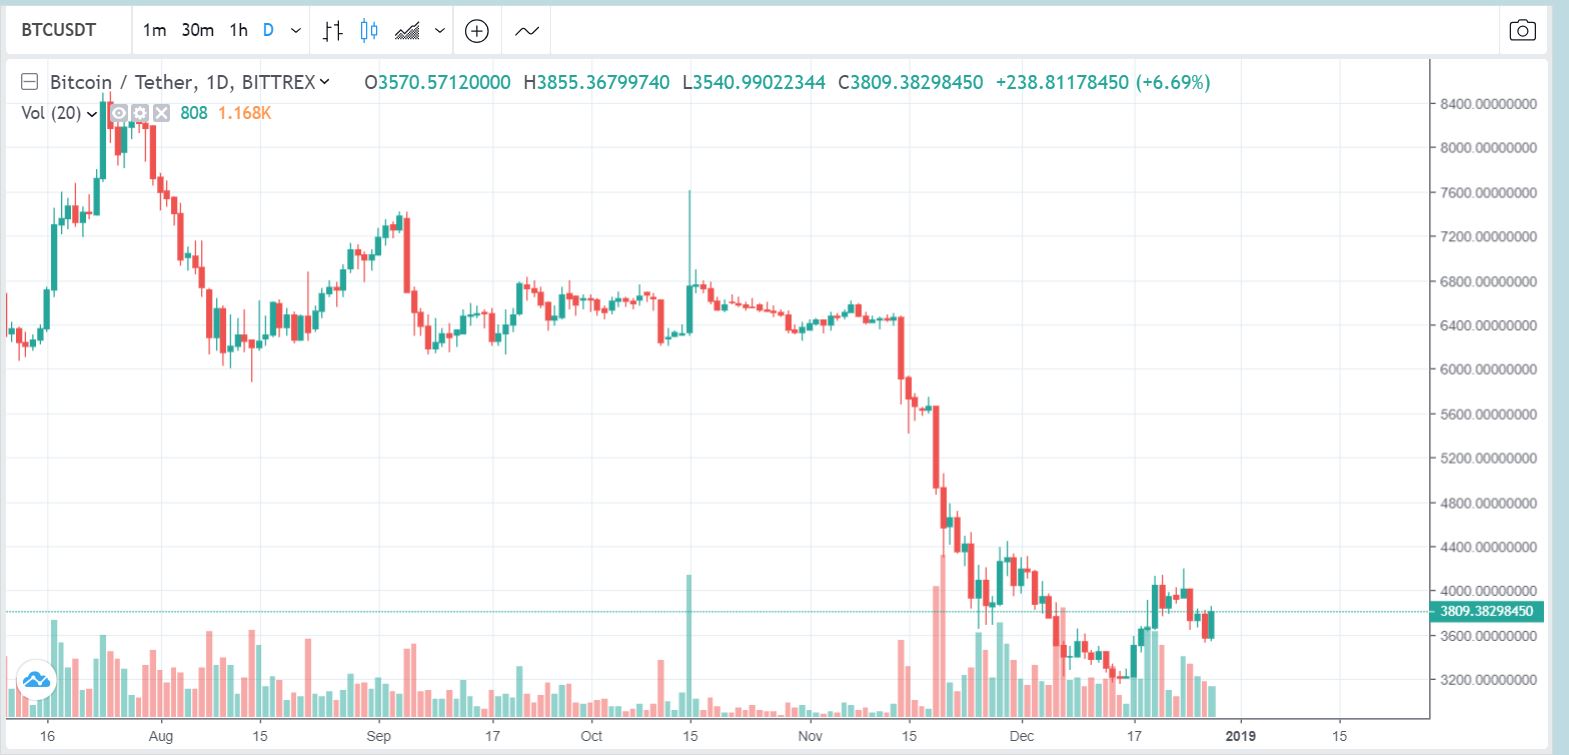
BITCOIN – Bitcoin looks like it may be forming an inverse H&S, so I have been watching the stocks related to Cryptocurrency or block chain too.