Dec 21st- Stock Trading For Dummies
Well, it started to get choppy and difficult in various sectors a few weeks ago, and then we went into full sell down mode in October for the General Markets. Miners were sideways and choppy, forming bases but difficult to hold at times, and suddenly many of those bases have been breaking out higher. It has been a rough ride in the Markets, even the crash test dummies are complaining, but today is Friday, the last trading day of the week.
We will be heading into a weekend that is followed by a 1/2 day of trading Monday ( what’s the point?) and a closed market Tuesday, so let’s take a look at a few things before this week of trading finishes up….
.
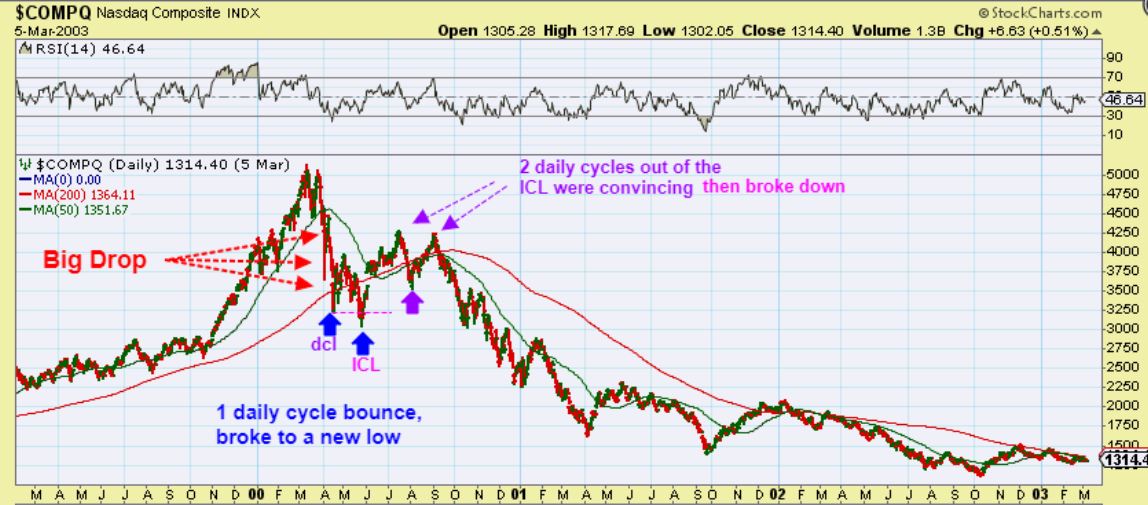
NASDAQ TOP year 2000 – SO this is what I modeled my expectations after. We see here a steep drop to a daily cycle low, and then a bounce into a bit of a double bottom that makes an ICL. 2 Daily cycles peak as it bounces and chops sideways, and then a BIG SELL OFF. This is what I was thinking we could see. THIS CRASH LASTED FOR YEARS AS IT NOW BUILT ANOTHER BASE.
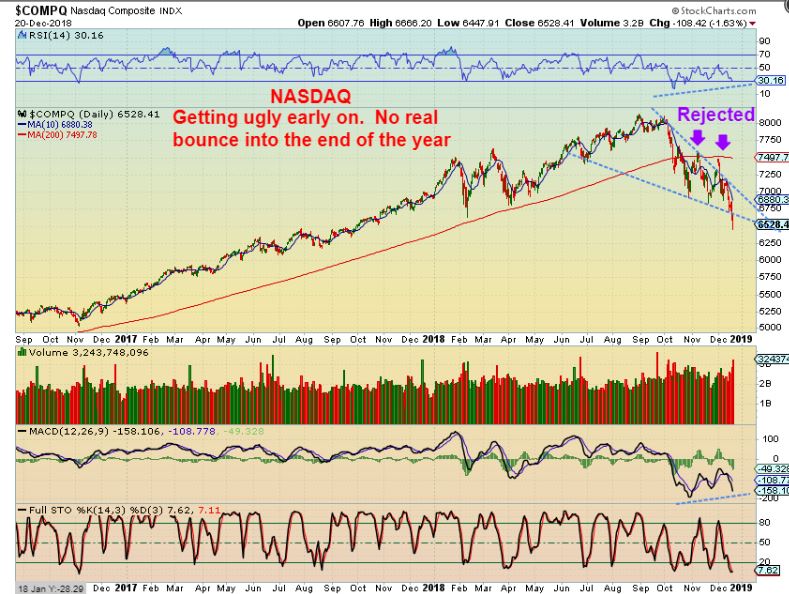
NASDAQ – This crash looks a bit uglier really. It dropped sharply, but so far each bounce has a lower high and a lower low. We see price rejected 2 x at the 200 sma. I do see divergence and expect another low soon, so lets look at that count…
THIS WAS IN YESTERDAYS REPORT- Day 35 and they can drop into the 40+ days, so I said we’d wait for a swing low. DO NOT TRY TO CATCH THE FALLING KNIFE.
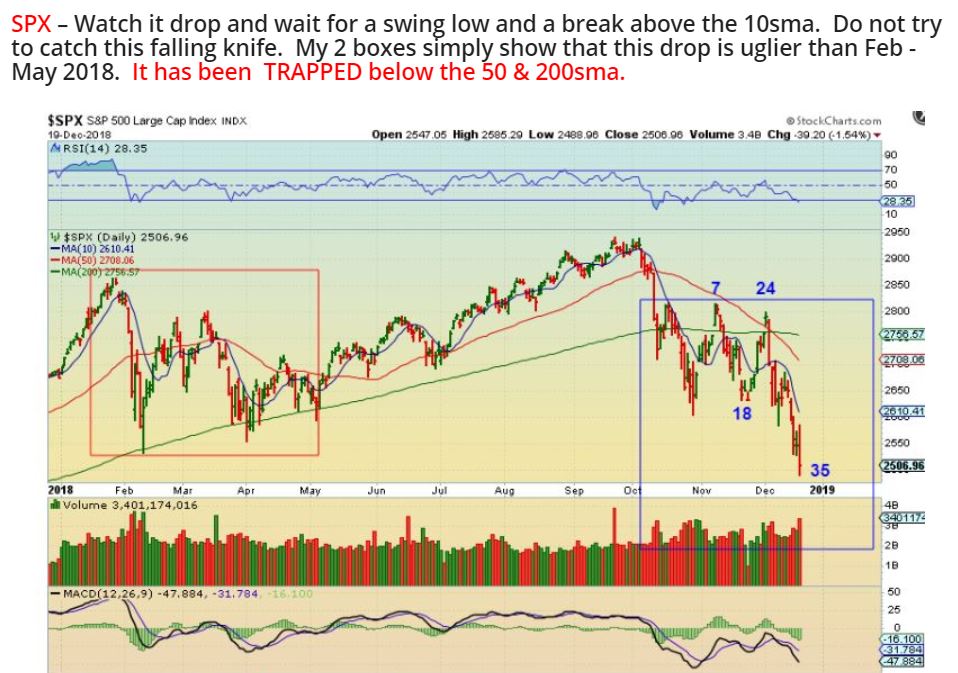
QQQ – So we are on day 36. A POSSIBLE reversal candle showed up, but this could even sell down more, and it does look to be accelerating when you look at the ABOVE chart. .
In fact, think of this idea: What if it sells down to 40+ days? Friday is day 37, Monday is day 38, Tuesday closed, Wednesday Day 39, Thursday day 40, Friday day 41. THAT MEANS that this could sell off all the way through next week. A wash out to close 2018. Will it? We don’t know, but it could be that THESE are the TAX LOSS SELLING before the end of the year, not MIners.
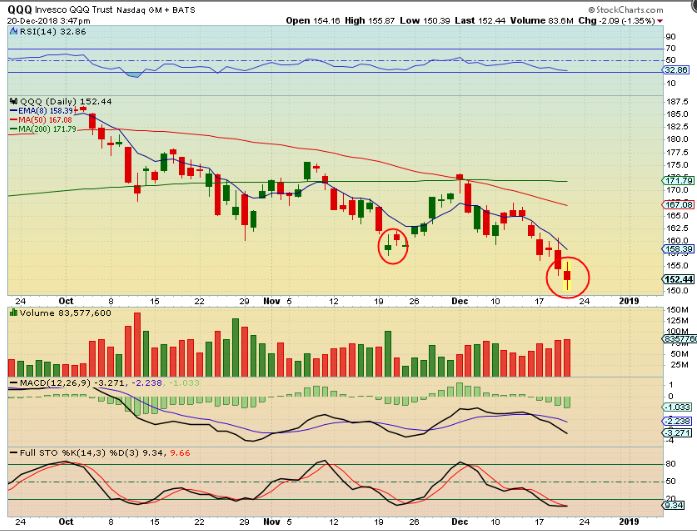
I did show how this happens close to bottoms, so we should be close to a dcl, and I would think it’s the ICL. Then we can bounce around higher in Jan & Feb.
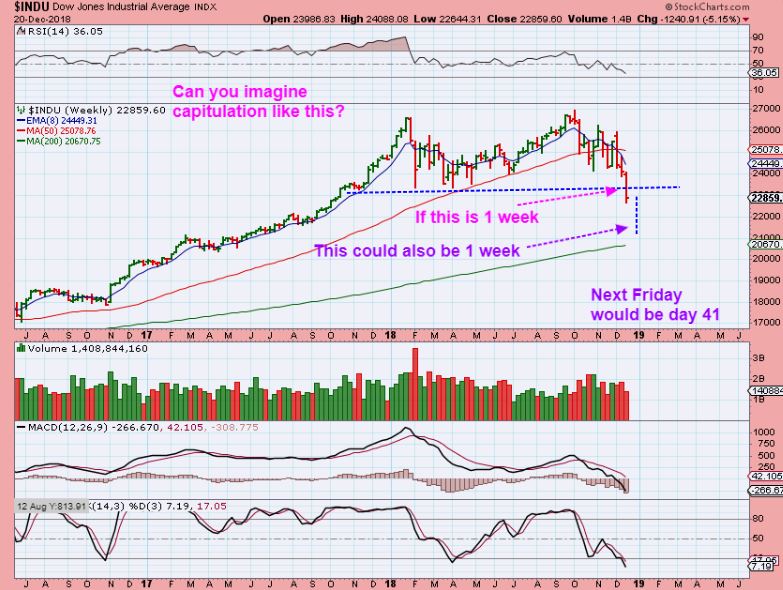
DJIA WEEKLY – Look at the weekly chart break down. This week alone has been a Big Down Candle. If it continued Selling next week, that could drag this to the 200 weekly ma. Wow! I do tend to think we will get a year end bounce though first, like a false break down, so…
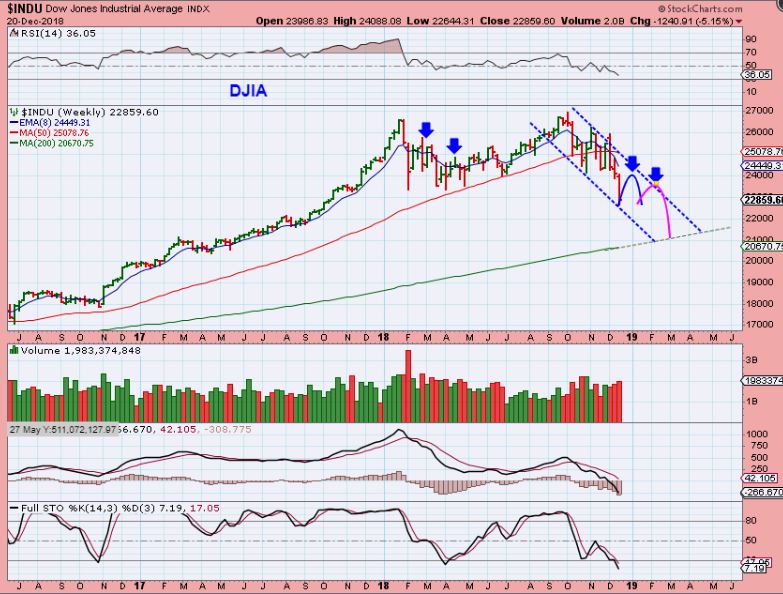
DJIA WEEKLY – I am picturing more of something like this for January & February, but this market, this ultra strong Bull that seemed invincible, is turning into a giant 2018 double top.
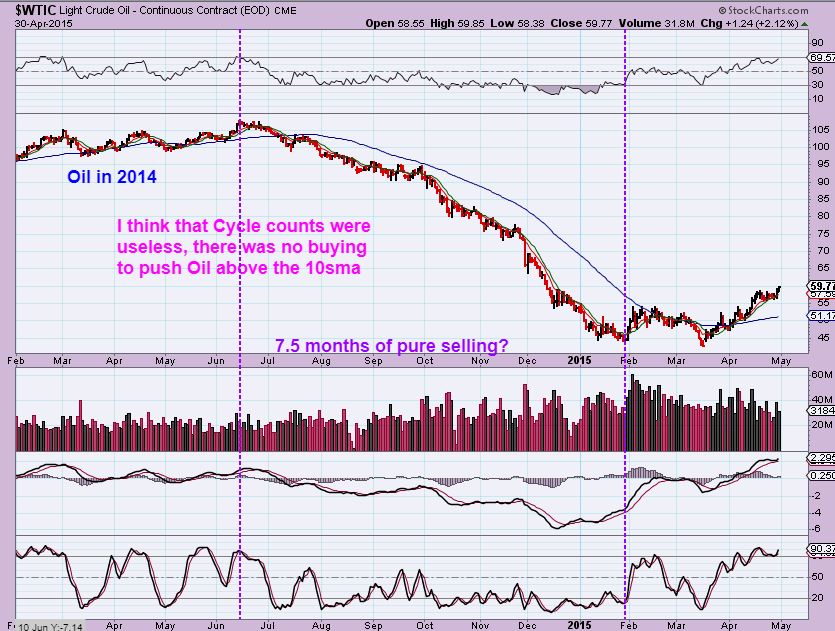
Do you remember a while ago I showed this chart and said that when OIL sold off in 2014, it just dropped without a bounce for 7.5 Months! No visible ICL. I wondered if I was seeing a bear flag 2 weeks ago that would continue down?
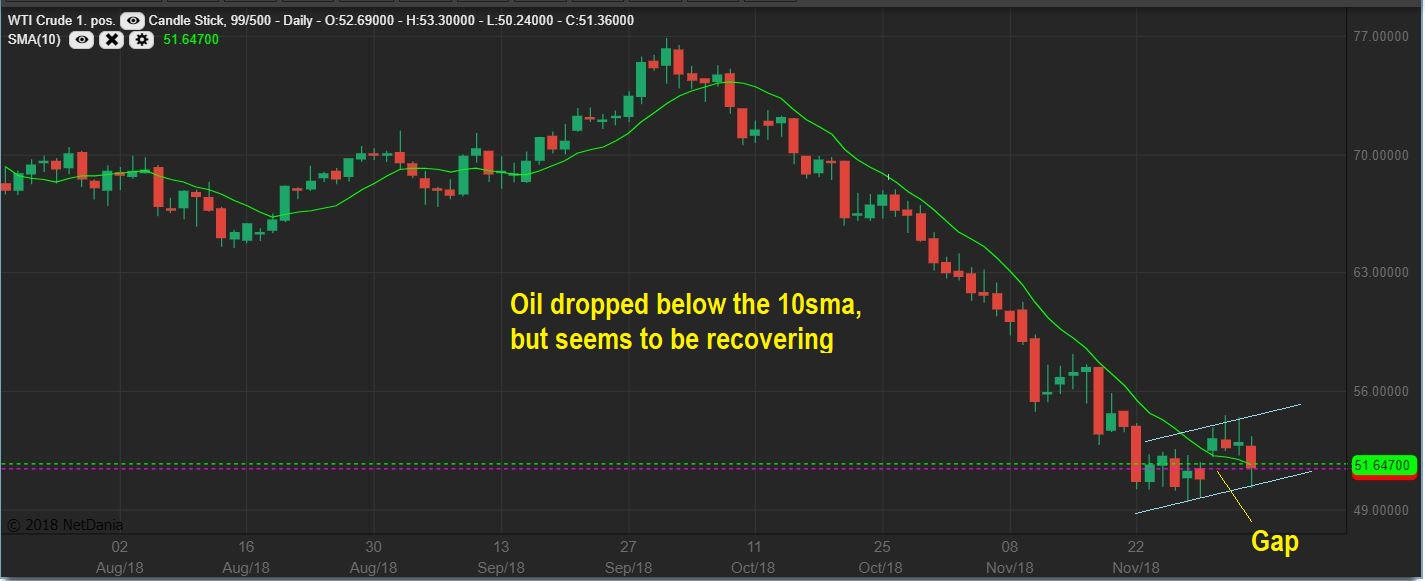
Well at that time, this looked like a good low, and I took a chance and bought DNR & NOG & GUSH, however…
.
Oil broke down, and I got stopped out.
.
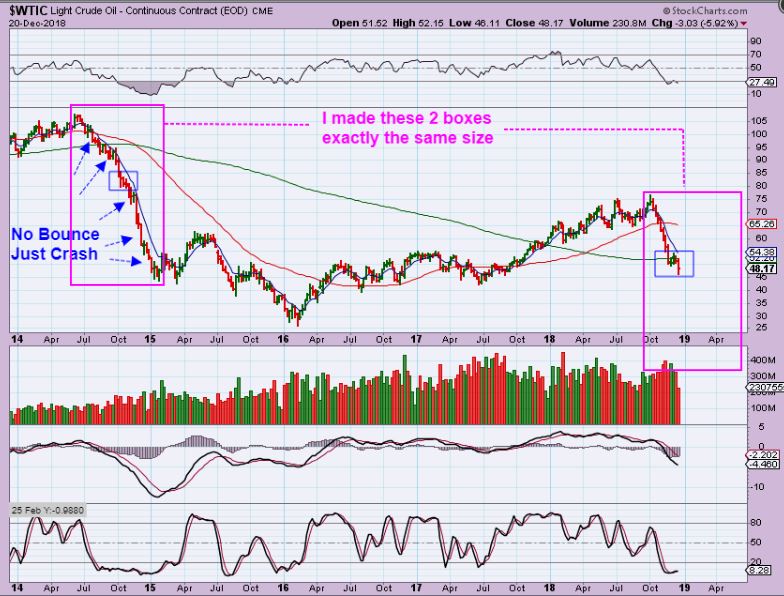
WTIC TODAY – Just like 2014 (blue square) , that daily cycle broke down. Now look at OIL. It is trading BELOW THAT 200 sma, so I again look back at the long deep 2014 drop. This one has been only 3 months long, that one was double that. Look at the boxes in the chart! Was that just a mid-point pause? It is not clear, so I am staying away from Energy / Oil for now.
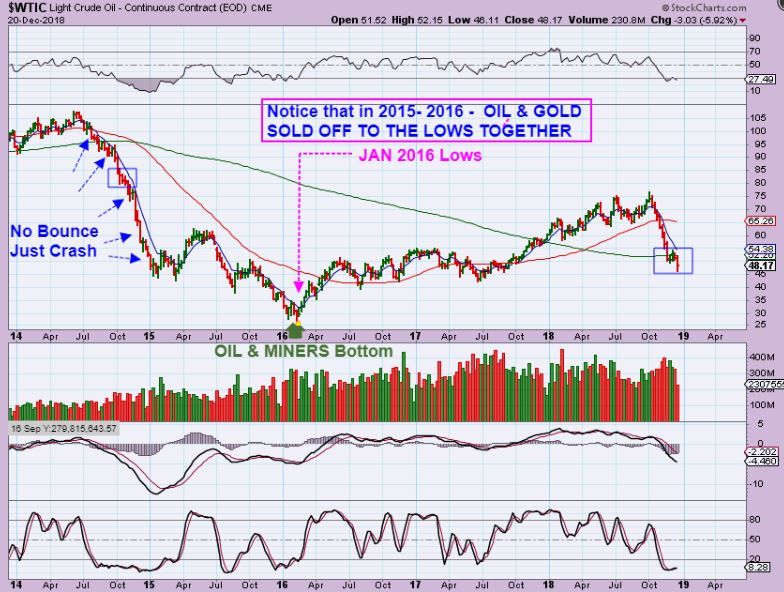
WTIC – One big difference was that OIL Bottomed with Miners in January 2016, currently Miners are moving higher, but Oil has not stopped dropping. I’m just watching this from the sidelines now.
UUP ( For the USD) – This looks to be weakening and the USD is due to drop. If it rolls over and trends lower, you would think that Gold would ‘trend’ higher, so these 2 areas have not been in sync. Both GOLD & the USD were rising together October – Now. What happens if the USD drops after a bounce?
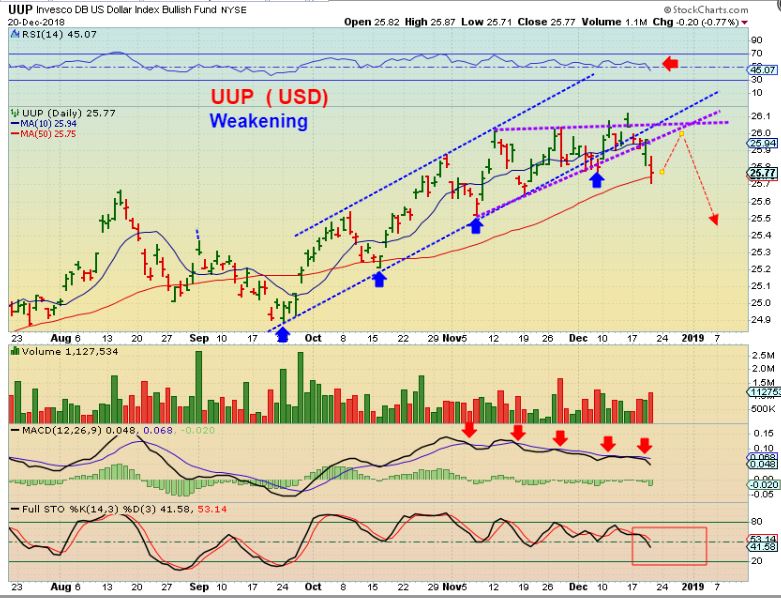
IF THE USD BOUNCES LIKE I HAVE DRAWN ABOVE, GOLD & MINERS CAN DROP TO A DCL. THEN WHEN THE USD ROLLS OVER, MINERS CAN MAKE ANOTHER RUN. WE’LL DISCUSS THAT.
.
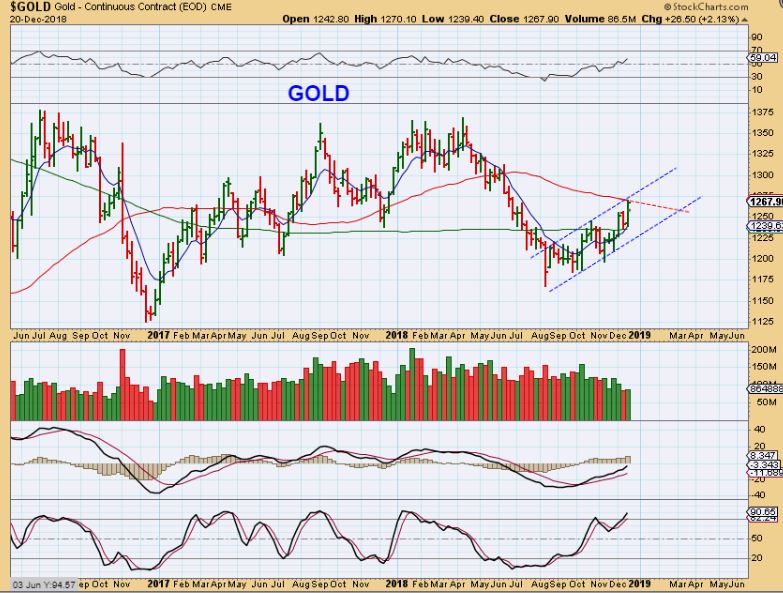
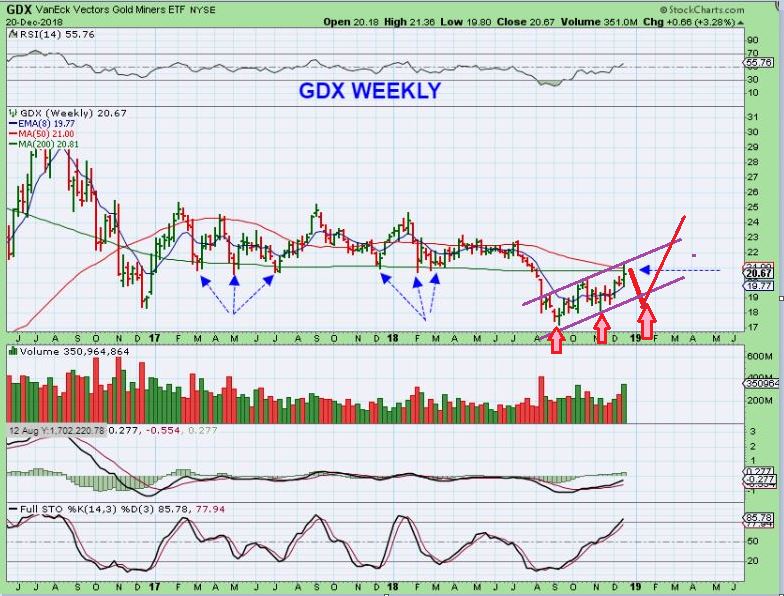
GOLD WEEKLY – I just wanted to show Gold from the Big Picture view. Blue trend line and Red 200ma act as resistance so far. Today is Friday, it is important to see where FRIDAY CLOSES THIS WEEKLY CHART.
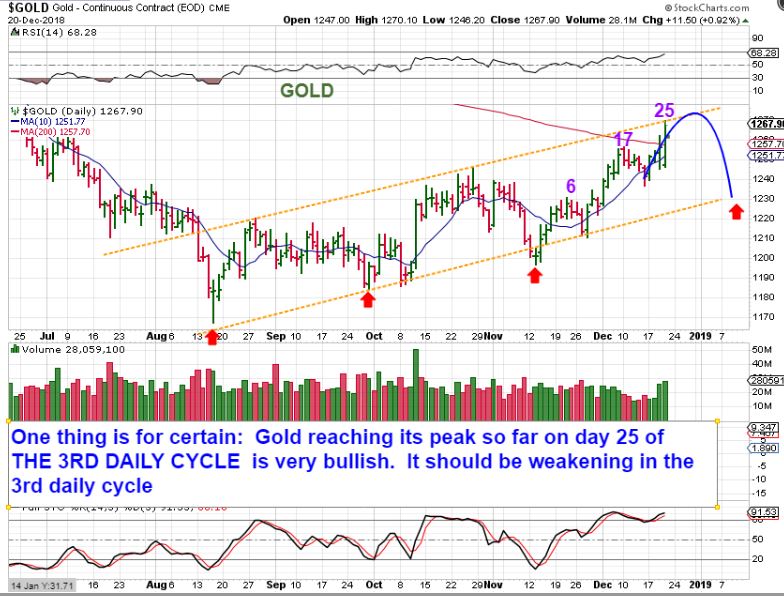
GOLD DAILY – Gold has been Bullish all along, though sideways at times. Now with a peak on the 3rd daily cycle at day 25? That is quite strong, right? Silver is still near lows, Miners are playing catch up. This has not been the normal move out of AUGUSTS ICL ( Sept ICL for Miners). AT this point I will just say that we are due for a dip into a daily cycle low ( 30+ days). WHAT FOLLOWS THAT DIP IS TRICKY IF THE USD ROLLS OVER & DROPS. IS that just a higher ICL in a BULL MARKET?
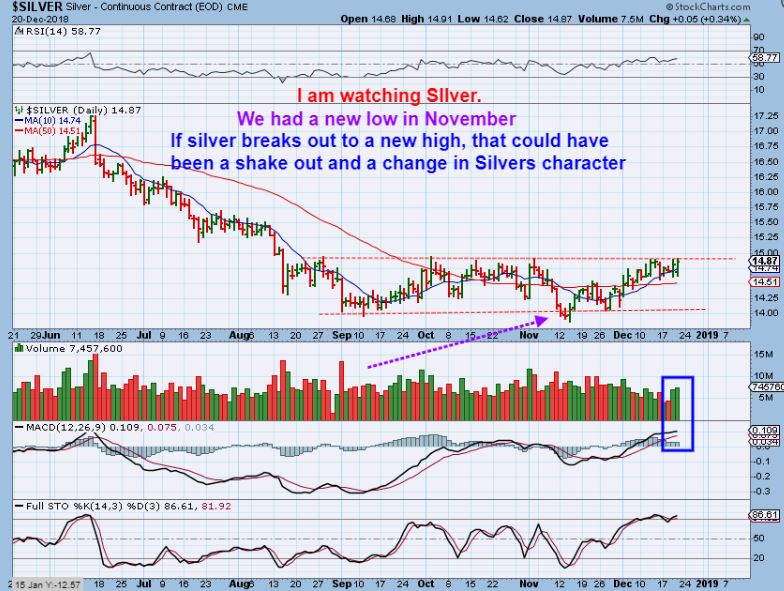
SILVER BASE #1 – This is Silver currently. Buying Silver Miners should pay off well when this tries to catch up. Silver moves very fast when it gets going. I am even going to discuss Silver Miners at the end of this report.
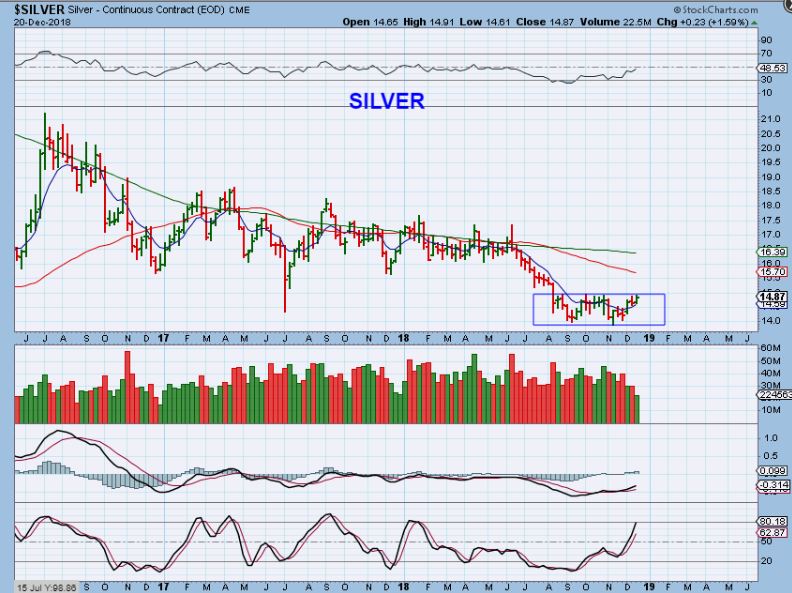
SILVER BASE #2 – Are we seeing an important change in character for Silver & that base building process? Silver stocks will rin very well when Silver breaks & runs from this base. I will discuss a few silver stocks.
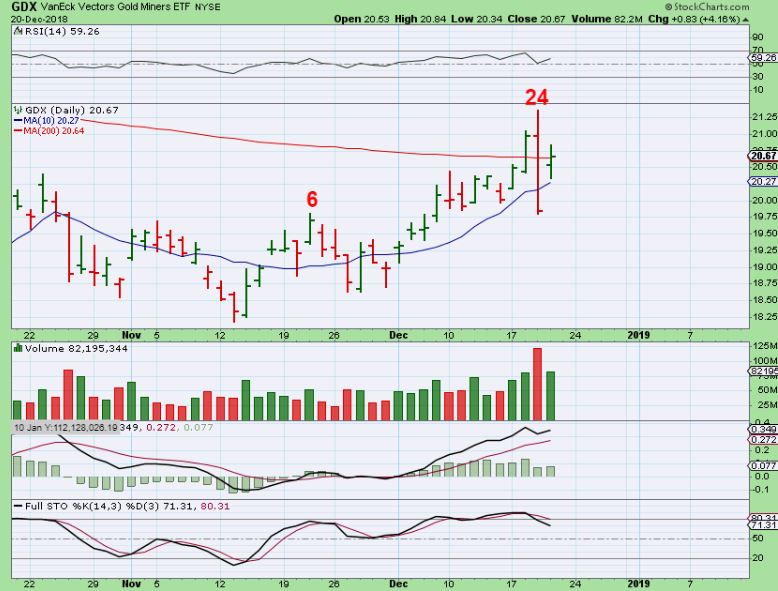
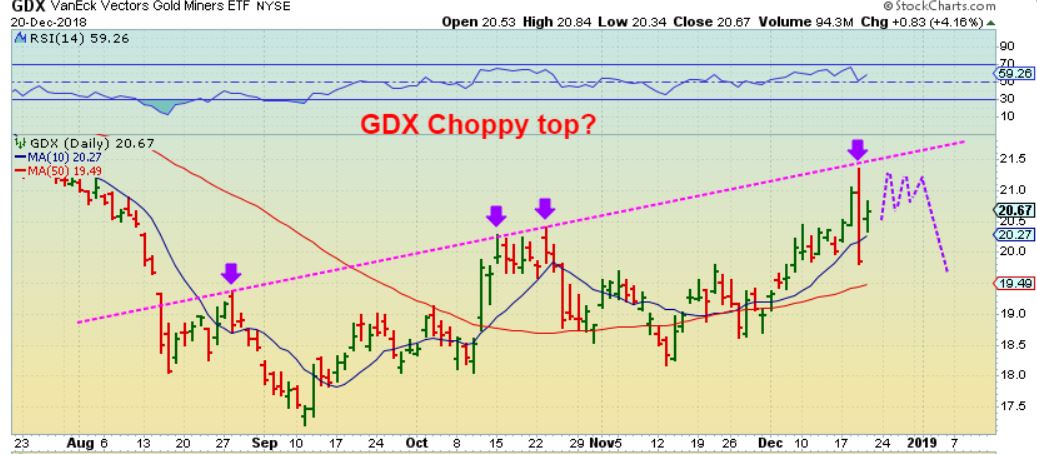
#1 GDX DAY 25 – Miners Crashed down after the rate hike Wednesday. Thursday, Miners pushed against the 200sma again, broke above, but closed pretty much right at the 200sma. It is back above the 10sma. Let’s see what Friday does. Why might that be important?
GDX – Friday will complete our Weekly chart. This is where it stands right now, a doji after tagging the upper trend line. I am expecting a dip into a dcl soon.
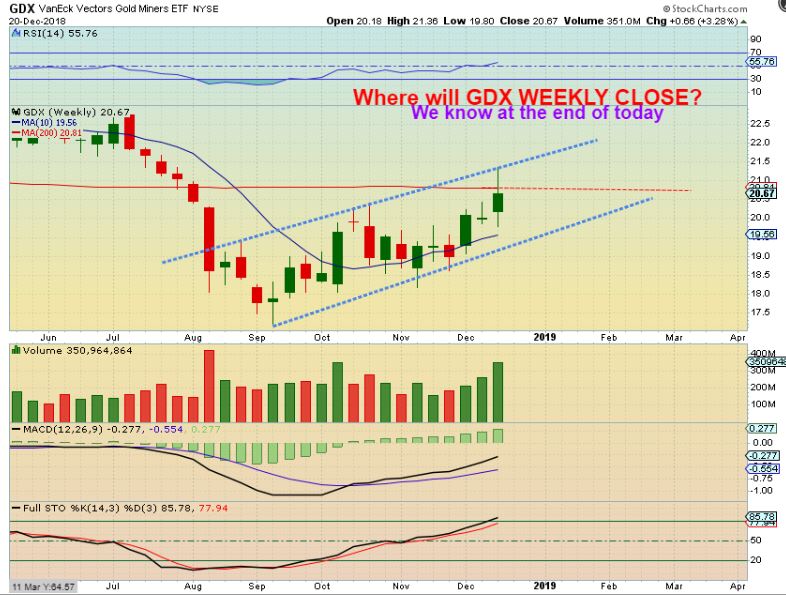
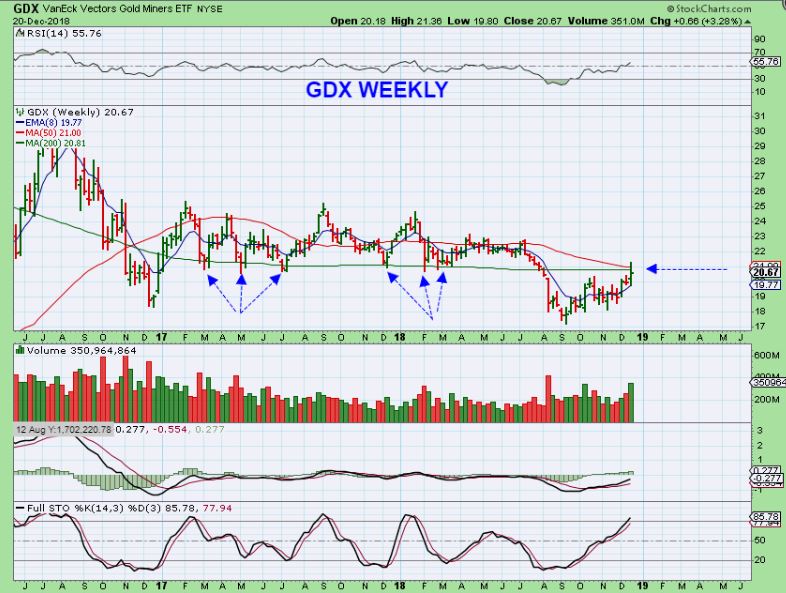
GDX WEEKLY – Notice that the weekly chart here is also right at critical resistance/ support. It lost support in the July sell off, it is back at that area, which will act as resistance until price can break above.
.
GDX WEEKLY – I have an idea. If GDX drops to a dcl, and then the USD keeps dropping, GDX could then break out, so we can watch for that. I just don’t think that it will break out right now, until we get a daily cycle low first.
.
I took a look at some of the Silver Miners. They are still near the lows, but are popping now. IF GDX Tops like this for the next few days, Silver stocks could play ctatch up the way GDXJ just did. You could buy one or two with a tight stop now if you felt that Miners were going to continue to push higher.
So If the Miners ran higher to day 30 or so like this , before dropping into a dcl, that would be 5 more days (all next week). So let’s look at SILVER STOCKS …

.
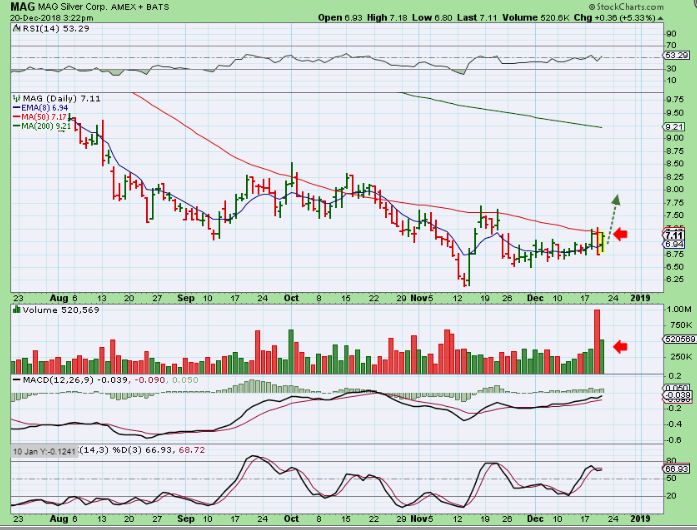
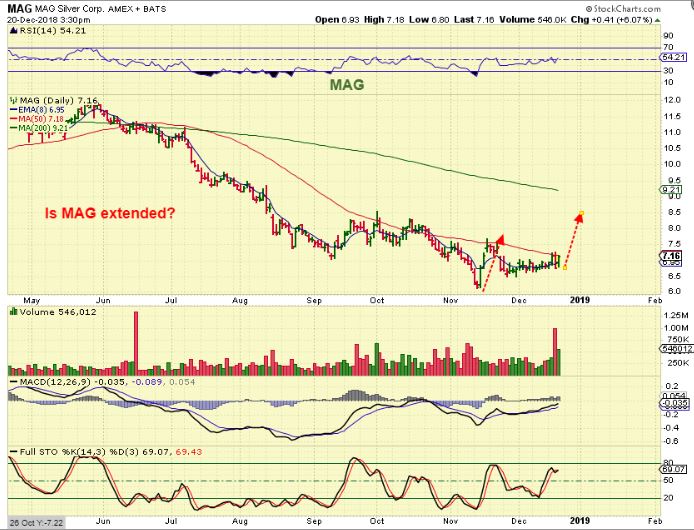
MAG -Mag for instance, has not really done a run away move, it has stayed below the 50sma. It perked up Thursday with good volume. You can see that a quick run to the 200 sma could be $7 to $9. Low risk if your stop is right below Thursdays lows.
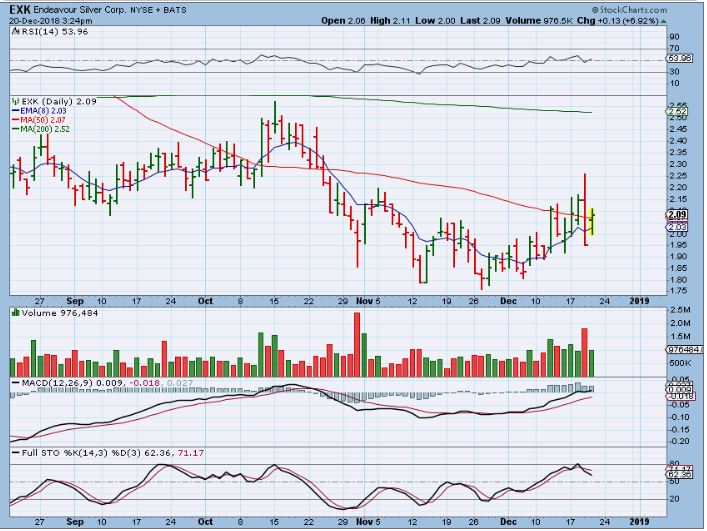
EXK – Just pushing above the 50sma, a quick 4 day run to the 200sma could be $2 to $2.50. Not bad.
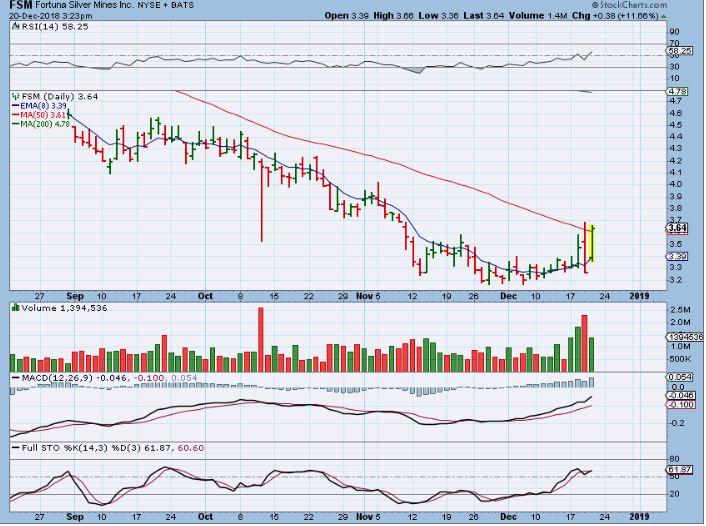
FSM – I sold my FSM, and it popped 11%. Could this quickly move to the 200sma from $3.50 to $4.70? Maybe, and That would be big if it did.
MAG – I accidentally grabbed 2 charts ( I bought this under the 50sma, just in case it wants to run for a few days to $9+). If it drops , I can take the small loss. Its good risk vs reward.
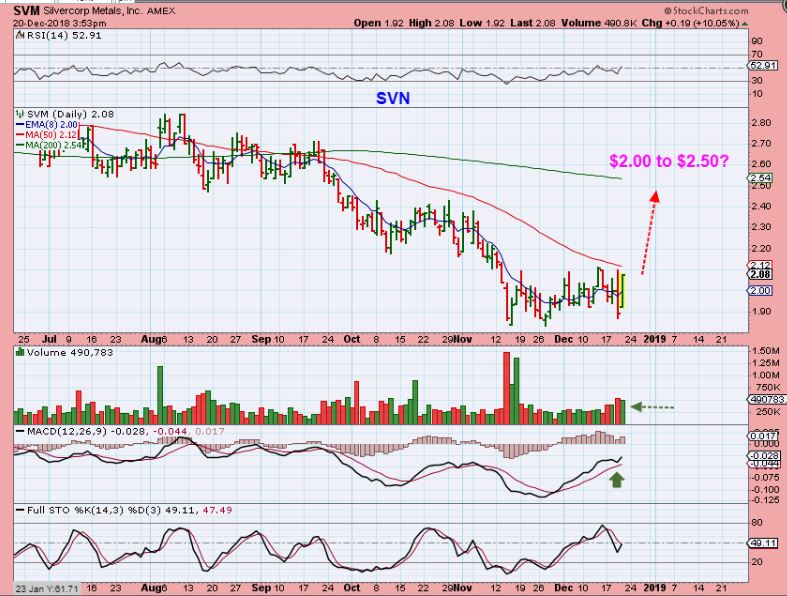
SVM – (sorry, that’s a typo on the chart, the ‘N’ is right next to the ‘M’) SVM could run from $2 to 42.50.
So I am just discussing these Silver stocks because they have not really ‘joined in the run higher’ yet, but they may play catch up if the sector holds these levels for a few more days. It is risky, since we are coming due for a dcl, but may be rewarding for short term traders. GDXJ just played catch up Monday & Tuesday. Well, these Silver stocks are still near their lows or their bases, but some started to push against the 50 sma and started to Pop Thursday.
IF GDX just chops around for the next few days, it may allow time for the Silver stocks to pop & run before the DCL comes into play. Again, something like this is what I am picturing…
.
It’s just a trade idea for some laggers, if the Miners spend time near these highs. MAybe only short term traders participate here with good stops in place. I do Own MAG & FSM again.
.
Enjoy your Friday trading & your weekend!
.
~ALEX
.
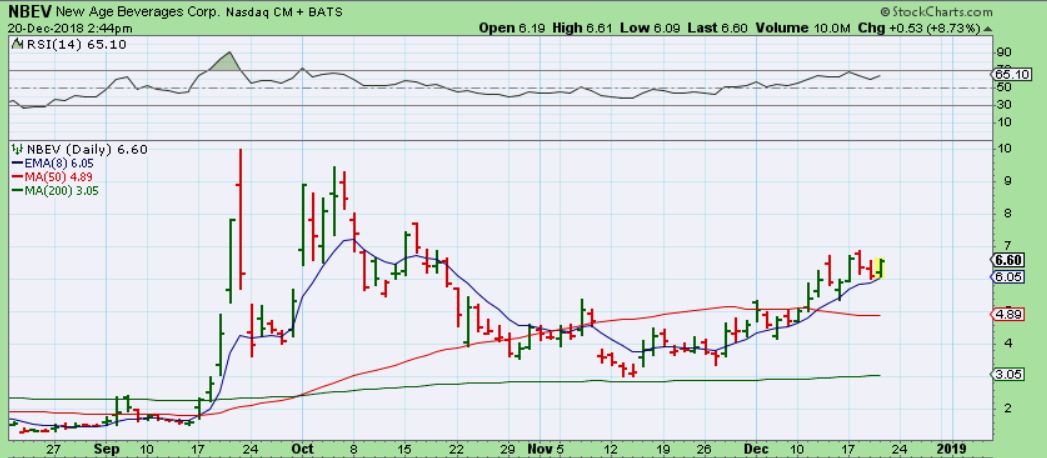
NBEV – Still acting correctly at the 8 ema so far.
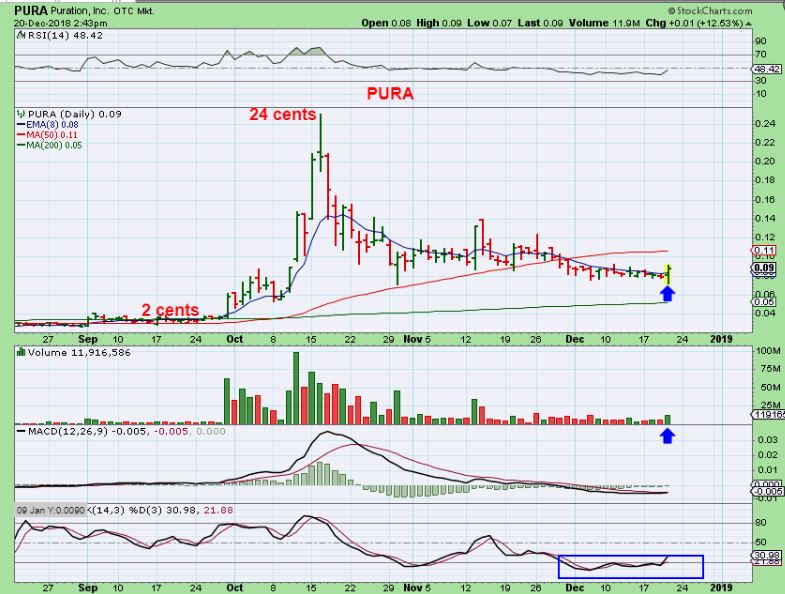
PURA REPORT – PURA was dropping to new lows yesterday, and intraday they released a report. A clip of that report is right here. They announced yesterday that expect double, triple, even quadruple revenue…
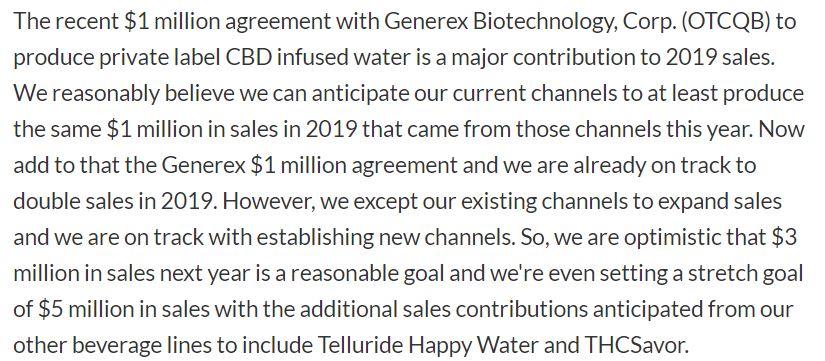
PURA – I sw the report, added to my position, and posted this in the comments at 2:45. Pura had quickly flipped to green and moved higher, here up 12%. It then closed up 20%! I am hoping for follow through to this reversal, and not a 1 day pop.
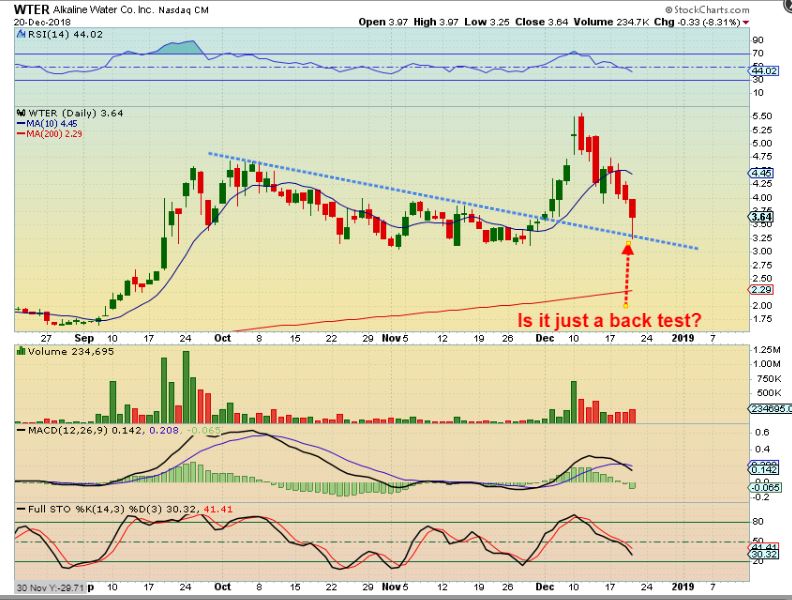
WTER – I have been tracking WTER, as mentioned here. I wanted to buy a dip to the trend line, and it looked like a cup & handle. Well…
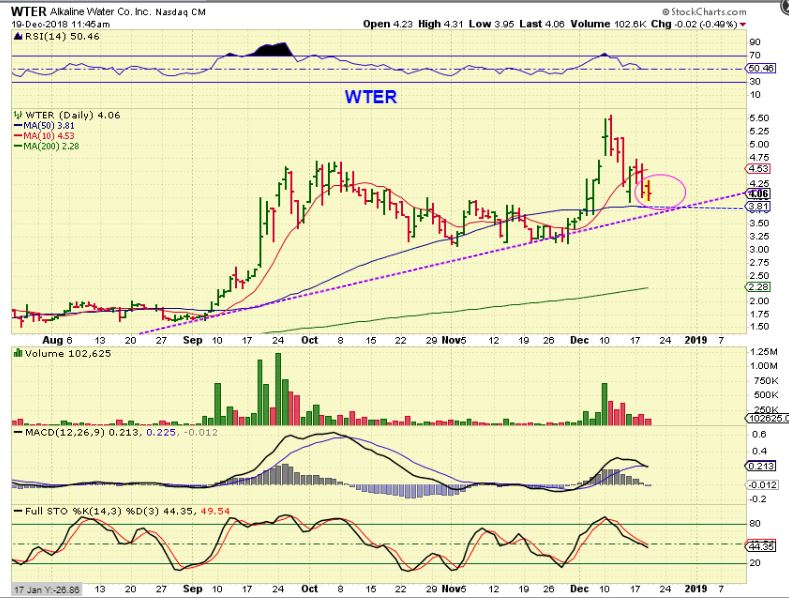
The Water Broke – It broke down, but it did reverse as a back test of the trend line. I did not buy it, because it sold down pretty sharply at one point, and is not oversold. I will still watch it.
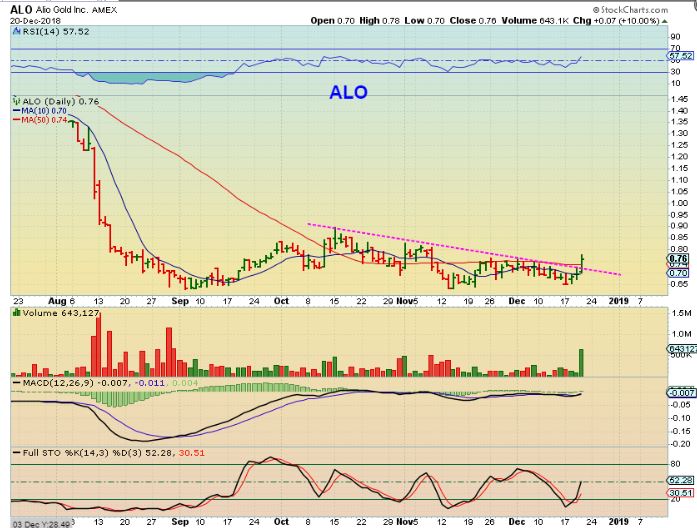
ALO- I love this set up as a low risk POP, I really do. I am expecting a dcl in Gold & Miners, but I love this base as a technical set up with a nice volume surge. The volume was several times the average volume lately. Great 3-4 month base.
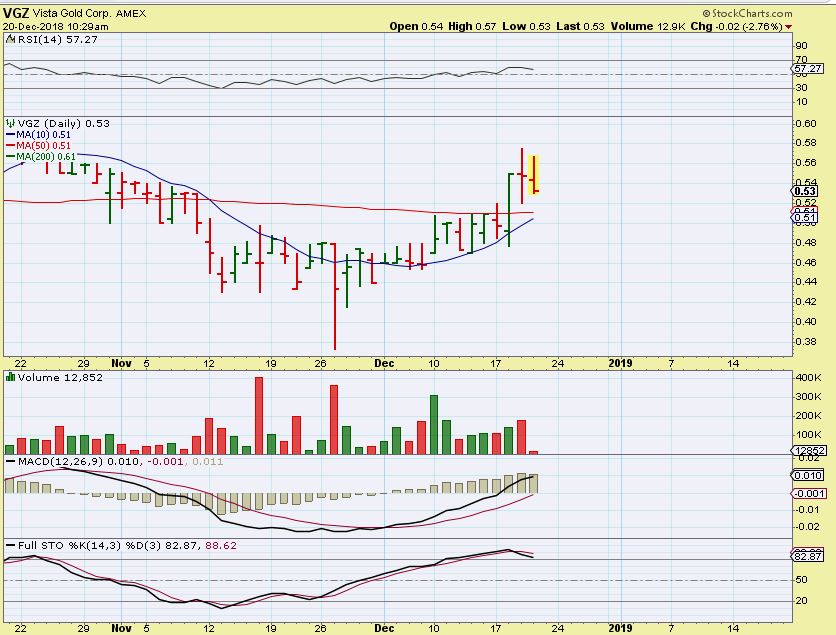
VGZ – All miners were not higher yesterday, Some stocks Popped and dropped, so for those, I’d like to see if the 50sma acts as support.