Friday Dec 14th – Still A Little Choppy
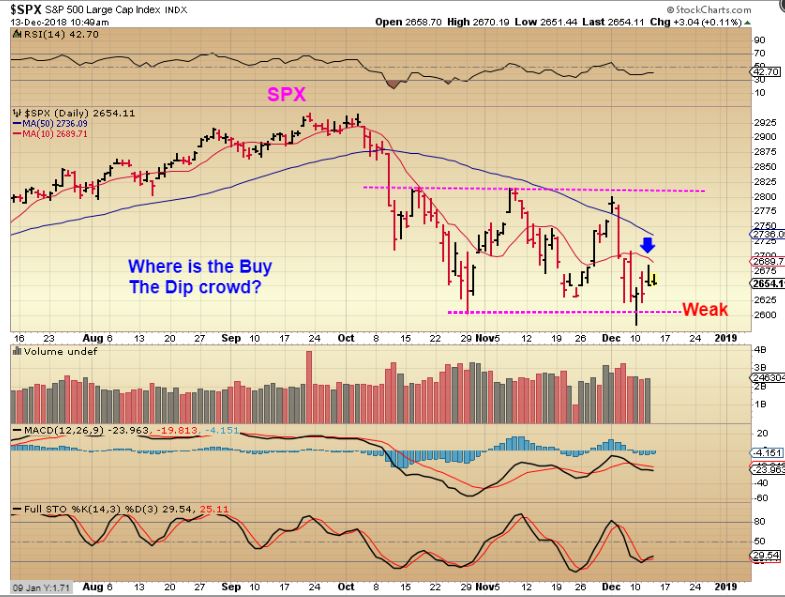
SPX #1 – I captured this after the first hour of trading and I posted it in the chat area. Each morning Gap higher ends up selling off. Would this be bought up into the close this time ?
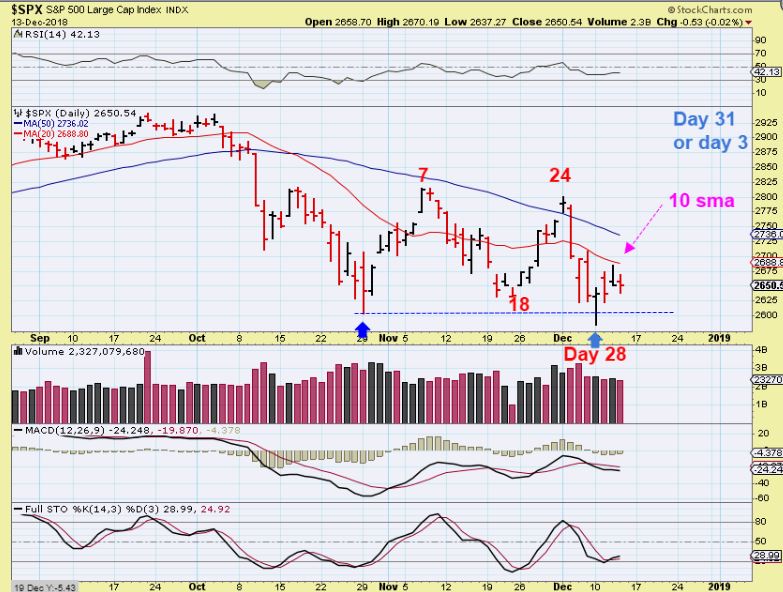
SPX #2 – No, it closed slightly red. I have been watching the Cycle count in anticipation for a DCL ( ICL). I said that day 18 was too early and now we have a day 28 low. THAT might also be a bit early too, since many daily cycles extend to 30 plus days. This could just surge higher and be counted as day 4 Friday, but take a look at this…
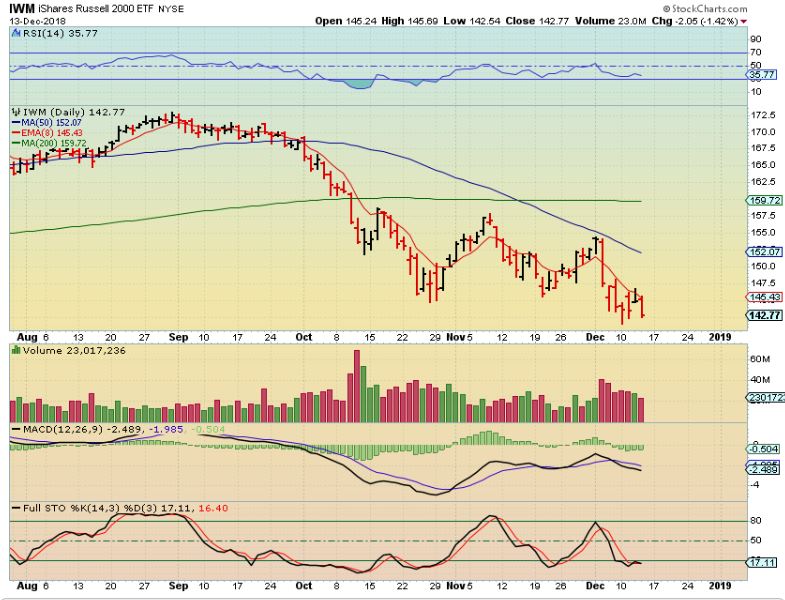
IWM – The Russell 2000 certainly doesn’t look promising for a surge higher as it broke toward the lows, so we may break the day 28 lows and find a low on day 30+. The good news? With Friday at day 32, any selling now should be fairly short lived!
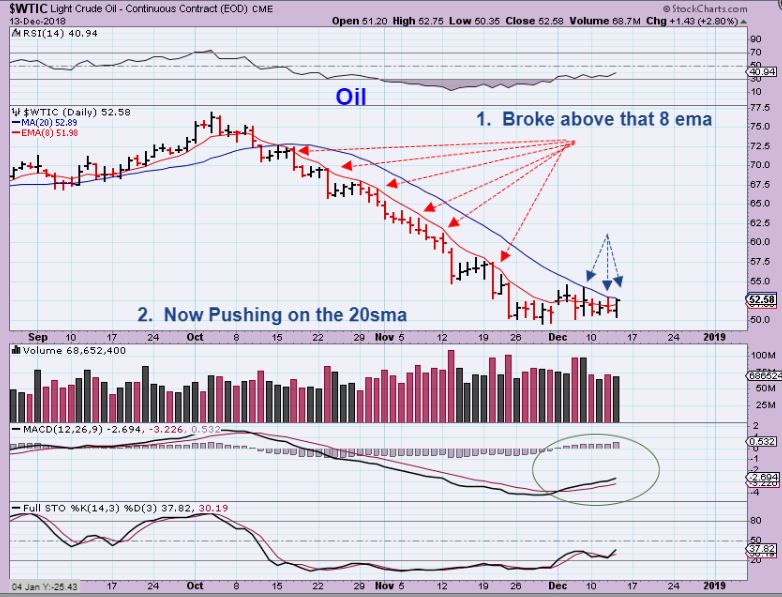
WTIC – Oil seems to be basing after putting in a low 9 days ago, and the MACD is rising. This looks pretty promising.
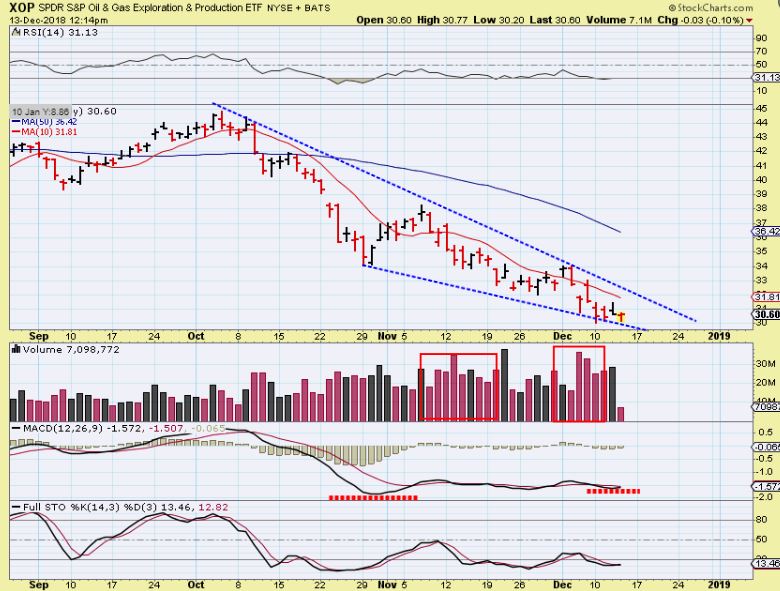
XOP – The XLE looks a bit better, but the OIH and XOP are at the lows and looking weak. MANY Energy stocks have been beaten way down ( they look like bargains really). They may be waiting for the General Markets to put in a final low and push higher with conviction at that point. There is divergence and I would expect some upside soon, especially if the Equity Markets can get moving upside.
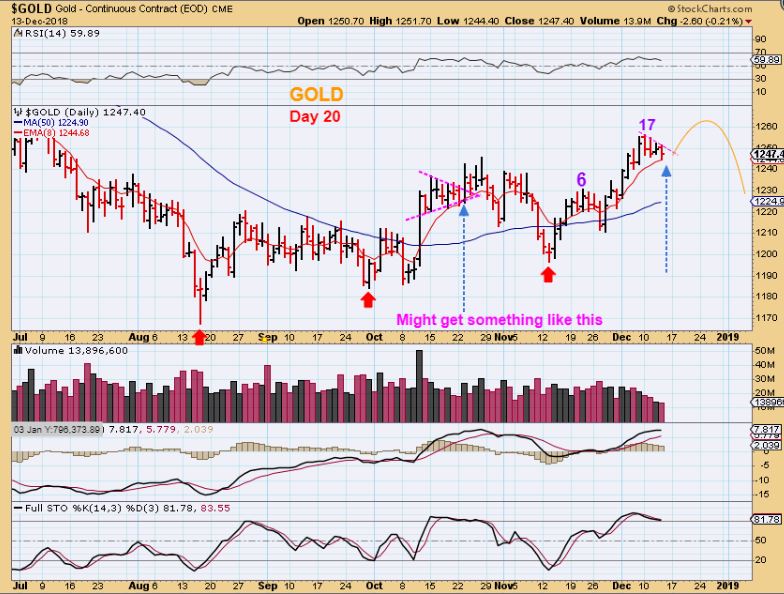
GOLD chart from yesterday – Gold is up at resistance and is in the timing for a pull back towards its 3rd daily cycles low.

GOLD – Gold dropped a bit more Thursday and has a day 17 peak so far. It rested on the 8 ema. It can dip down from here or Pop one more time (Similar to early October). The Miners still look like they have a little pop left in them.
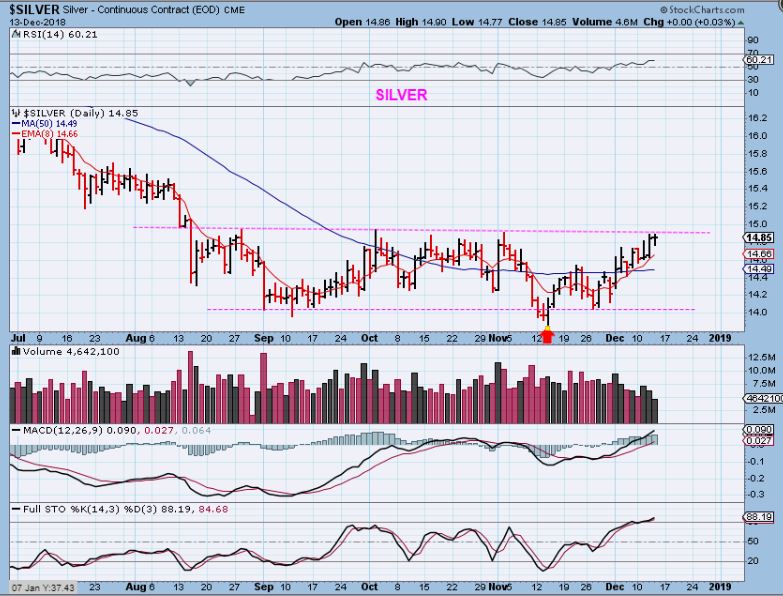
SILVER – Silver is now up against the top of the base, and has a day 19 peak after a shake out low in November. Friday we can see if Silver stops its climb here or breaks higher.
GDX – Miners were very choppy for weeks near the lows, until last week when they started to climb higher. They are at the resistance from the October highs, and will also reach more resistance around 30 cents higher at the 200sma.
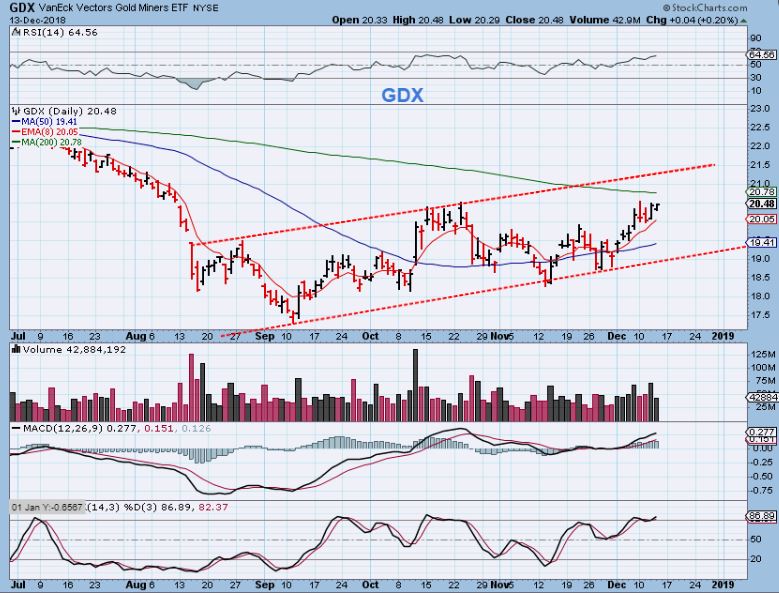
We have seen : SOME MINERS HAVE BEEN EXCELLENT, Other are still at lows.
.
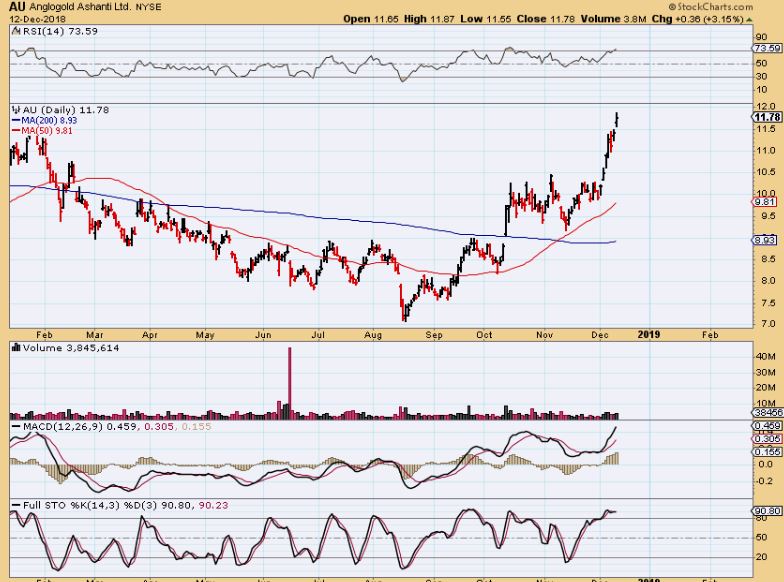
AU – Notice that before the recent run higher, we had a sideways consolidation. I like to buy those as they break out.
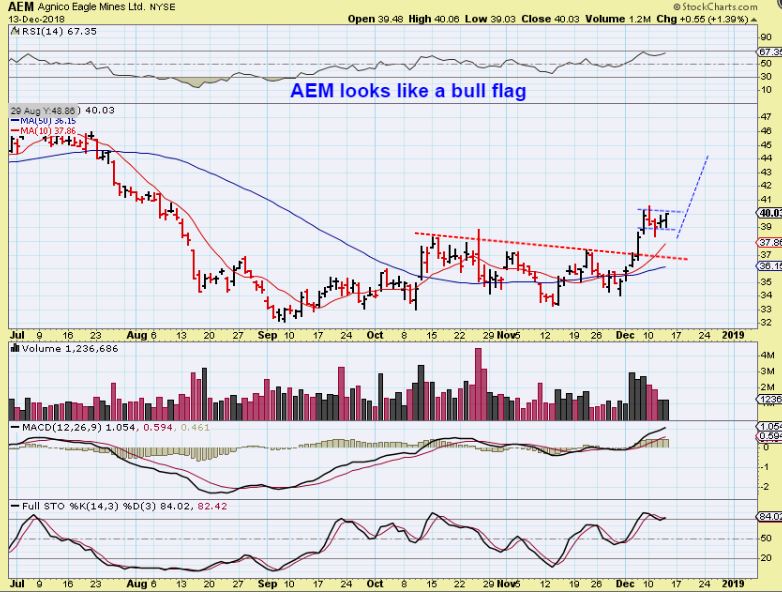
AEM – This had a similar consolidation, and now has what looks like a small bull flag. If Gold just goes sideways, this can run higher, but if it starts to sell off into a dcl, this may drop back down too.
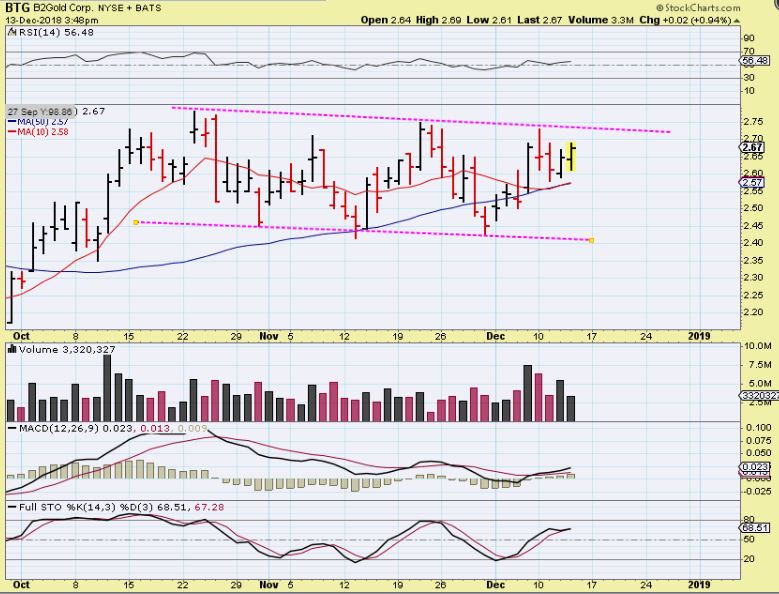
BTG #1 – This was BTG on Dec 7th. I saw this sideways consolidation (Similar to AU) and bought the break out above the 50sma, expecting a run higher….
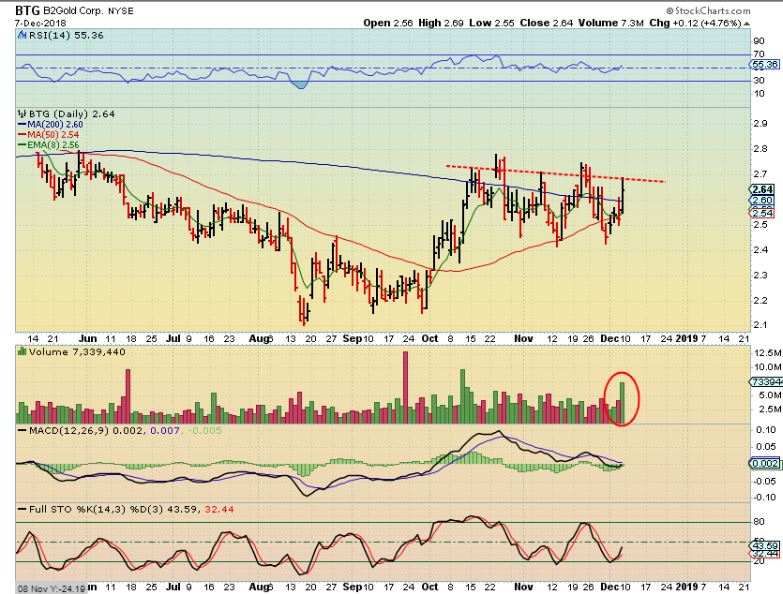
BTG #2 – As you can see, it has continued to chop sideways above that 50sma. I would love for it to break out and run, but I also am aware that if Gold starts to sell off, the Miners, no matter how good the set up is, can just fall back too.
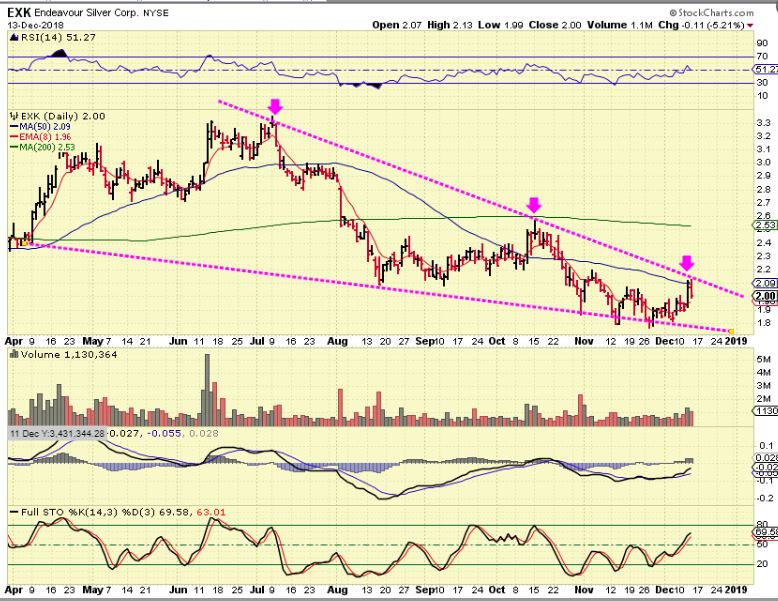
EXK – I pointed out that EXK & IAG looked possibly set up to break out from their lows in yesterdays report…
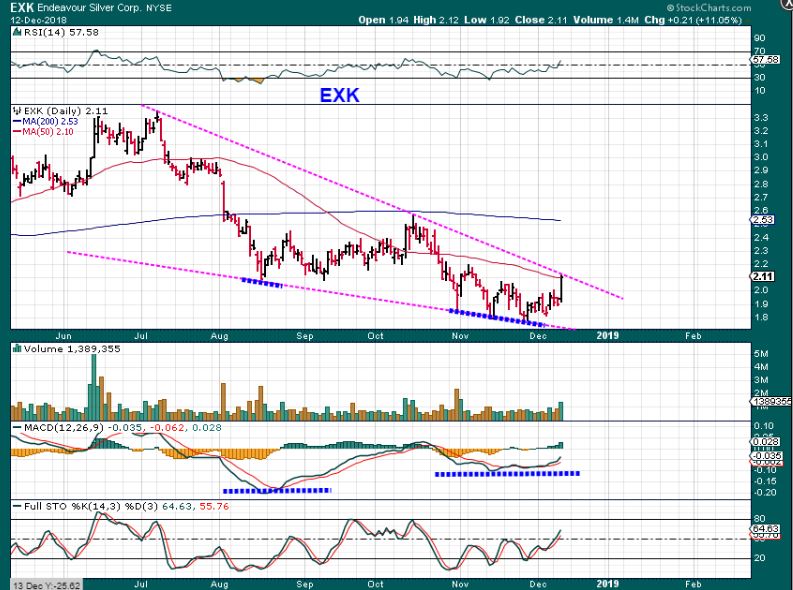
EXK – No break out, they both sold off for now.
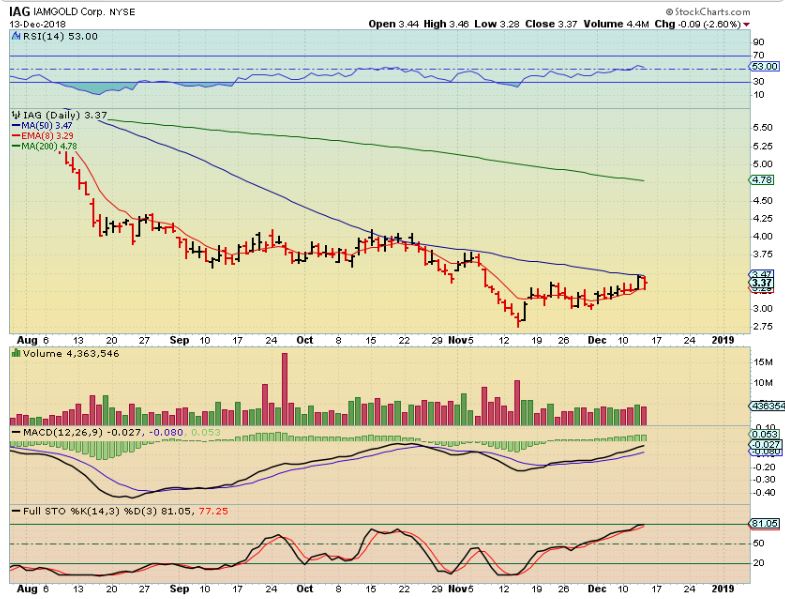
IAG – We’ll see what they do on Friday and into next week, but time could be running out for a good break out & run.
Today is the last trading day of the week. I have listed a lot of trade set ups over the week, so I won’t add too many here on a Friday. I am going to add one that I meant to put in yesterdays report, and then review a few below.
.
Enjoy your Friday trading, and have a great weekend. I should have the Big Picture report out by Saturday night.
.
~ALEX
.
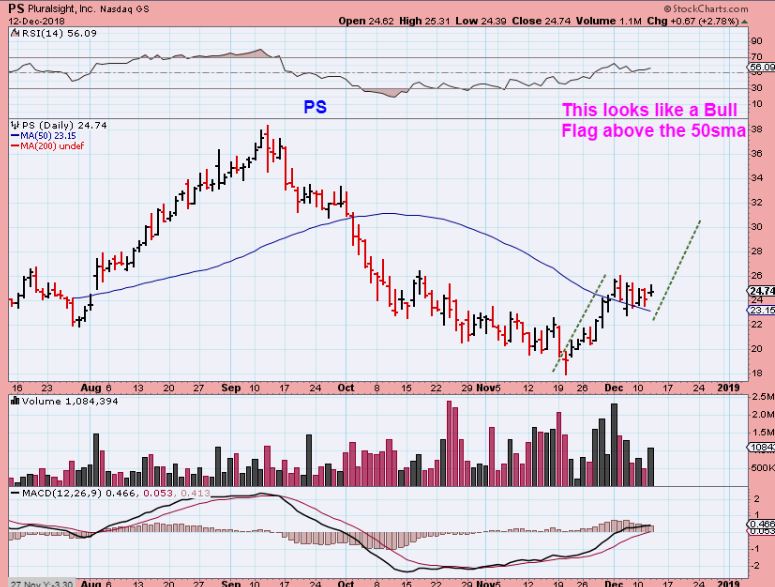
PS – This was supposed to be in Yesterdays report, but I missed it. It didn’t break out, so you can watch this set up today too. I like this set up a lot as a bull flag right on the 50sma. That is where I would put my stop, and I may buy this if it starts to move higher. I like the volume on the first run out of the lows.
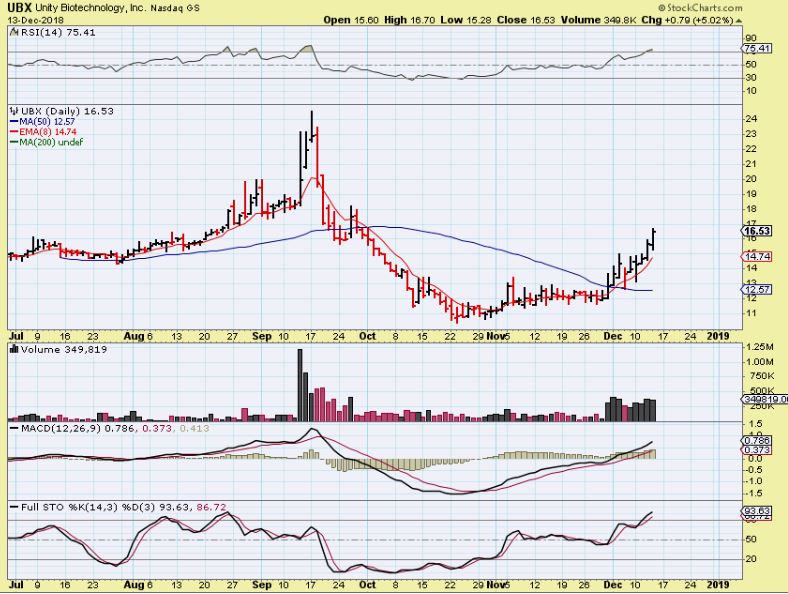
UBX – This stock just will not stop 🙂 $12 to almost $17 since last week. I liked this one for the volume coming out of that base too.
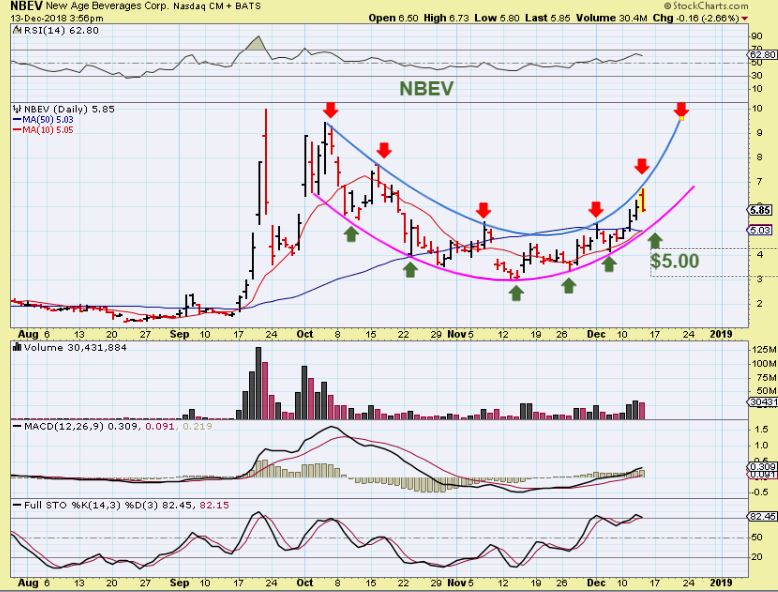
NBEV – NBEV Reversed Thursday, and I think that it could drop to the $5 area, if this is a back test of the 50sma.
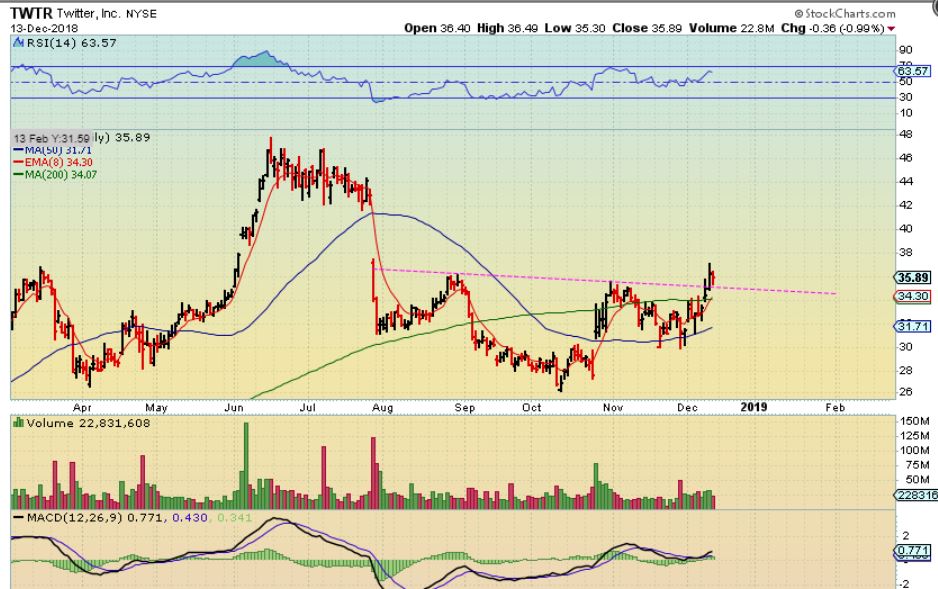
TWTR #! – TWTR also reversed, so I drew this chart, but Buyers stepped in by the end of the day. It actually closed back up at $35.89
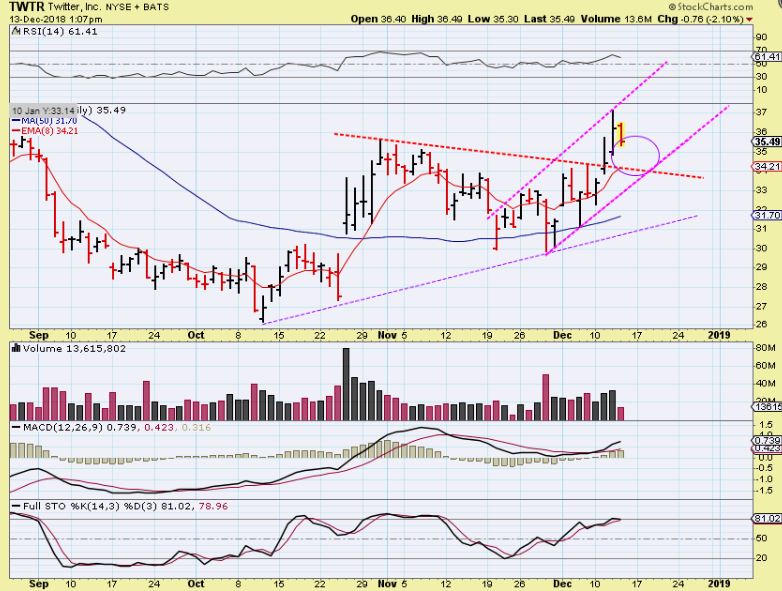
TWTR #2 – This remains a bullish set up. I personally would not use too tight of a stop on a set up like this. A stop under the 200sma should keep you in the trade and not have to worry about the wiggles. This has rallied since the October lows and did NOT follow the markets back down to the lows, so it is a bullish set up.
.
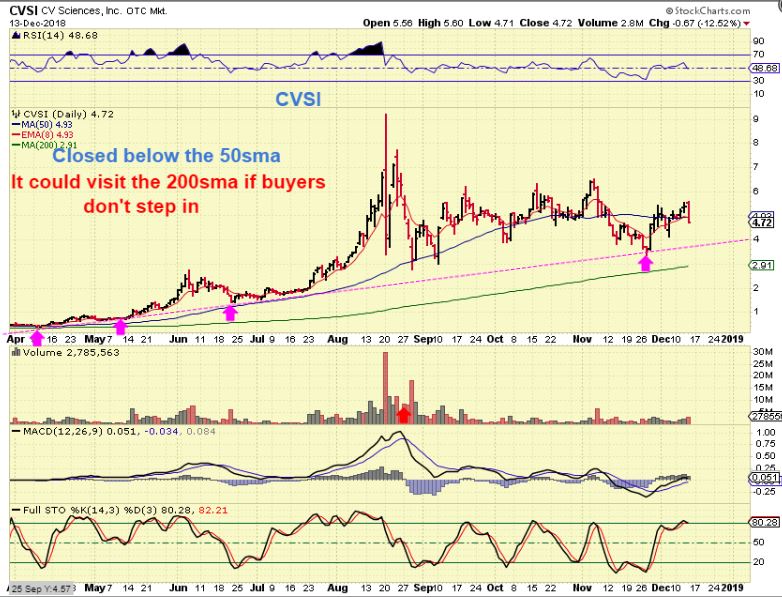
Finally: I mentioned that I owned CVSI, so I just wanted to post a review of what happened Thursday. Honestly, I should be stopped out, but my position is small and I did not. Let’s discuss CVSI…
.
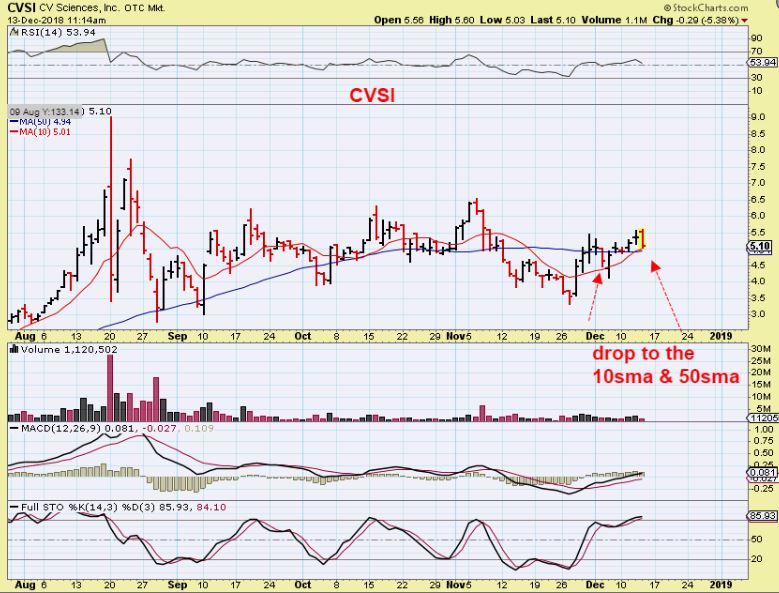
CVSI #1 – In the morning CVSI started to drop. I was hoping that it wouldn’t break & close below the 10sma, and 50sma. I drew this to show support.
CVSI #2– Then I saw a possible wedge, and that could actually be where it wanted to drop to, and then it could bounce (or fail). Unfortunately that is below the 50 sma.
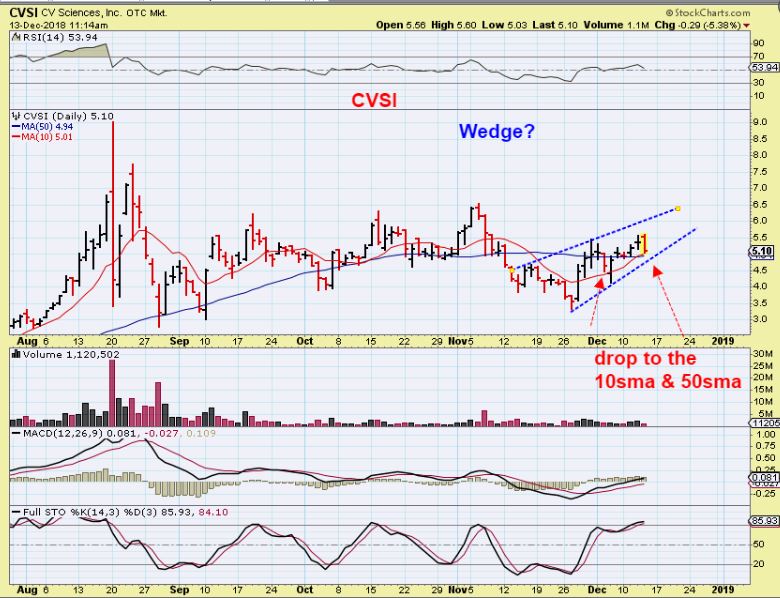
CVSI #3– And it DID close under the 50 sma & 10 sma, and I owned it. THIS SHOULD BE A STOP OUT to be safe, but I did not sell it. In the Overall Bigger Picture, it has been bullish, and I just wanted to see if this bounces Friday ( and as I mentioned, my position on this one is small). A drop to the red trend line would also be normal in this uptrend, but that is down to $4, so you really can’t mess around and stay in these too long.