Tuesday Dec 11th
2 Ideas have been on the Table.
.
1. We could have had an Intermediate Cycles Low (ICL) in October. IF SO, those lows would not be broken for several weeks with the first and part of a 2nd daily cycle.
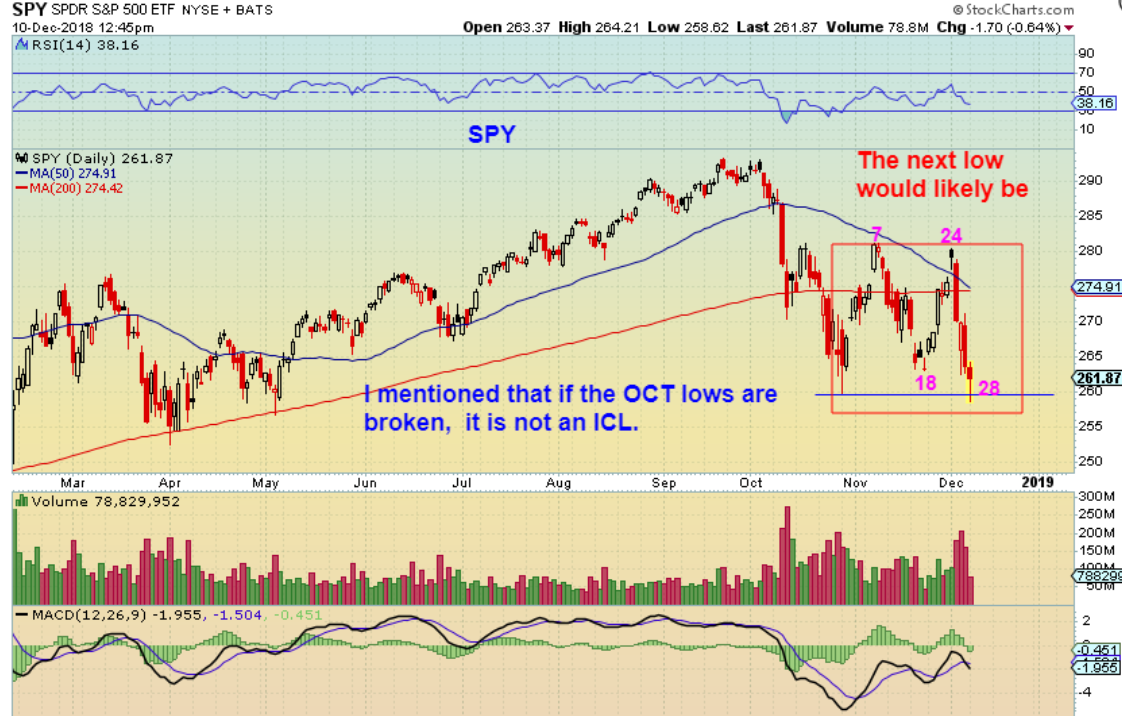
2. IF those lows are taken out within that daily cycle, the ICL is most likely still ahead. An ICL doesn’t usually fail in the first daily cycle.
3. We have now taken out the OCT lows in the Russel 2000 (shown in the weekend report) and the NASDAQ, and on Monday we saw the SPX and DJIA break the low. Let’s look at the Markets, the CHOPPY CHOPPY MARKETS.
.
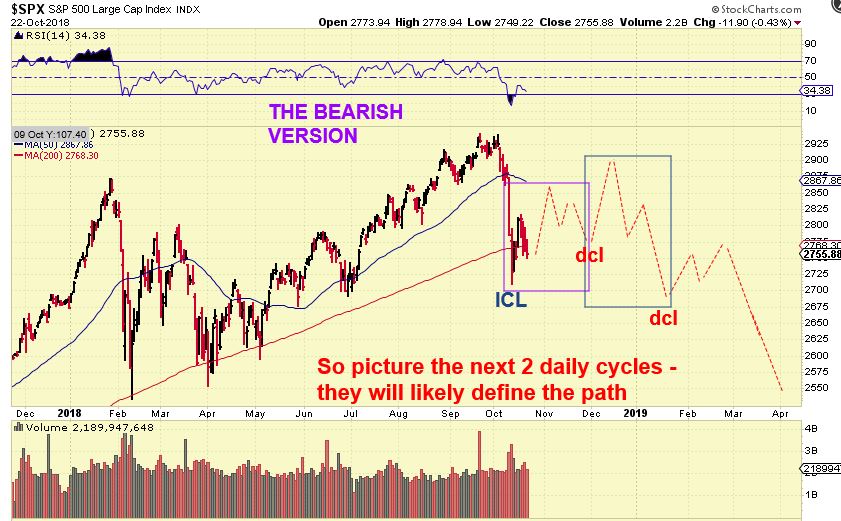
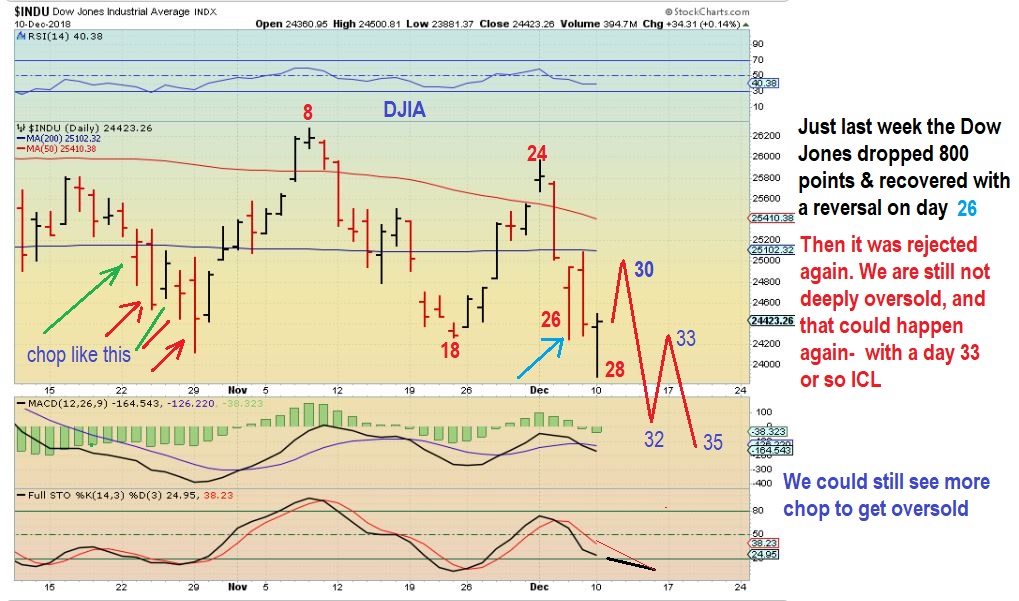
I DREW THIS CHART IN OCTOBER TO SHOW HOW THOSE 2 DAILY CYCLES COULD UNFOLD, AND THIS COULD STILL BECOME THE START OF A BEARISH SELL OFF. The difference now is that this sold off even deeper 1 more time & most of this has taken place below the 50 & 200 sma. It has been choppy (as expected) and weak.
THIS WAS THE SPY midday Monday – The markets sold off & pulled a reversal again. Last week we saw the Dow drop 800 points one day, only to recover by the close. That pretty much happened again. These are difficult tricky markets to trade.
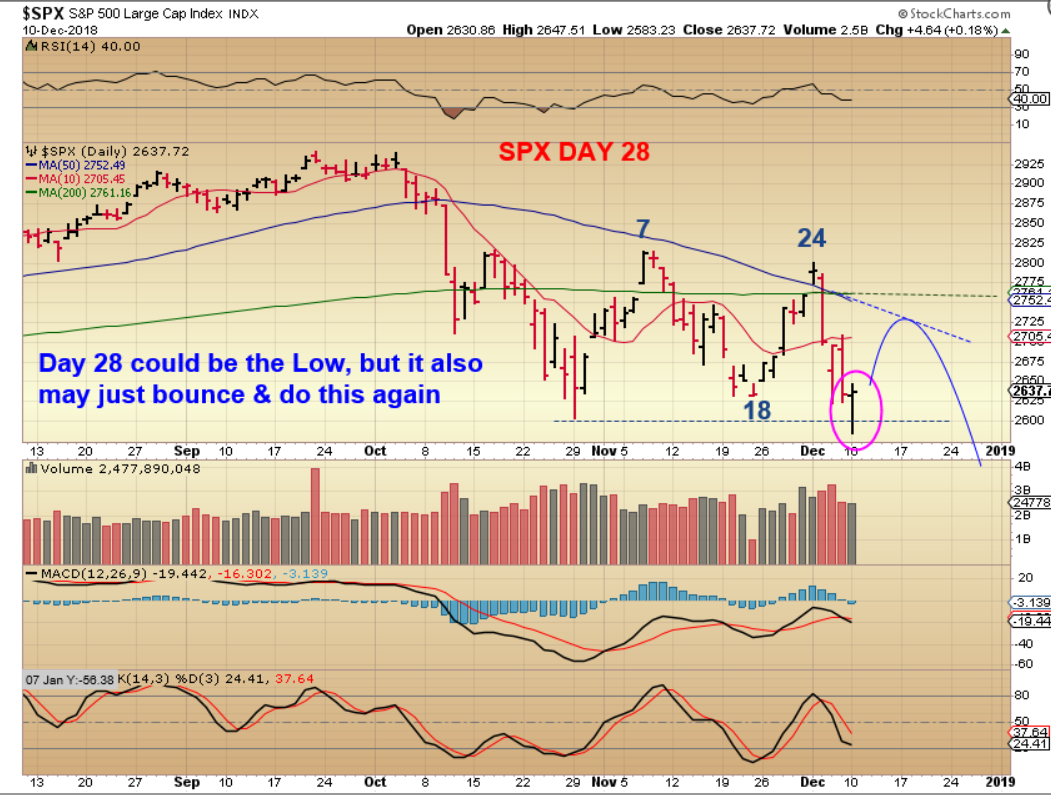
SPX Day 28– You may recall when we had the day 18 low, I said that it was too early for a DCL (or ICL). This is now day 28, and that is not too early, but it is earlier than many daily cycles. So while ‘technically’ this can be bought with a stop & raise the stop later, but we still might just do one more run & drop as drawn here too, at the 50 sma again. LET ME ZOOM IN AND SHOW YOU SOMETHING ELSE…
LET ME ZOOM IN AND SHOW YOU SOMETHING ELSE…
THE STOCHASTICS IS NOT QUITE OVERSOLD. THE MARKETS ARE CHOPPY AND THEY MAY STAY THAT WAY FOR NOW. DO YOU REMEMBER THE DOW JONES LAST WEEK RECOVERING AN 800 POINT DROP ON DAY 26? DAY 28 MAY STILL NOT BE THE LOW.
.
So these reversals are often bought with a tight stop right under the lows, and that is fine, but day 28 still may or may not be enough time using cycles, and the choppiness can continue. I will discuss trade ideas that are acting a bit less choppy at the end of the report.
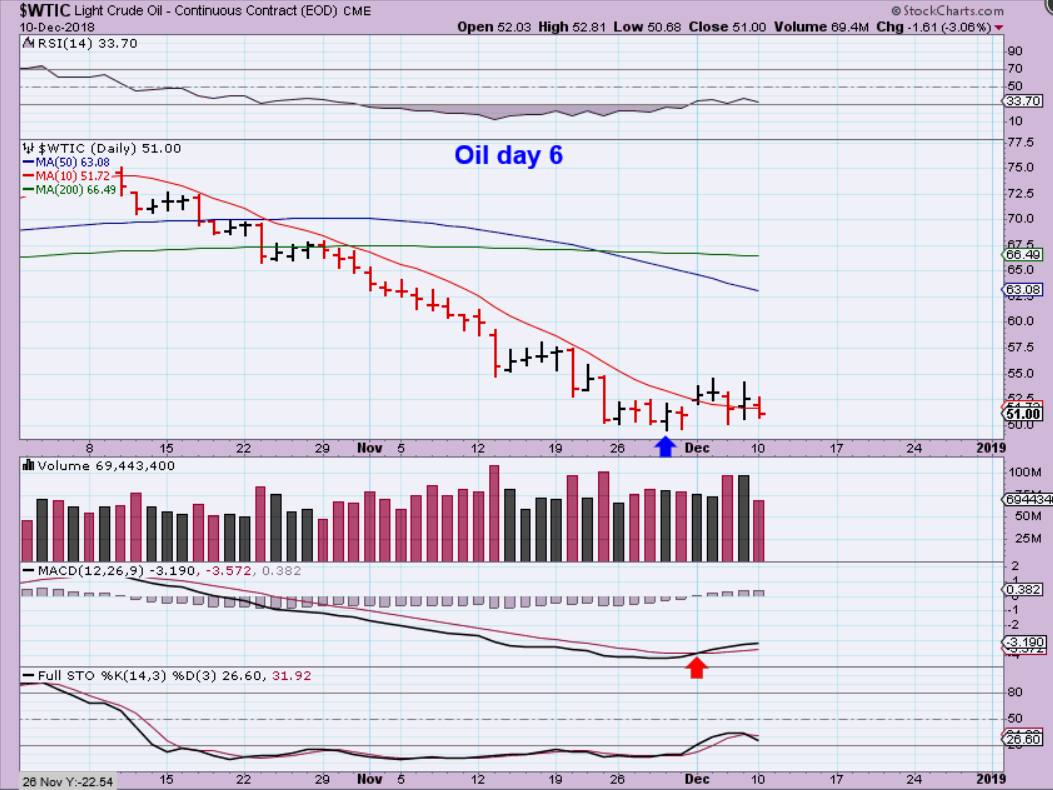
WTIC – Oil is on day 6 and seems to be putting in a small base instead of a V-Bottom. This is a normal base so far, however…
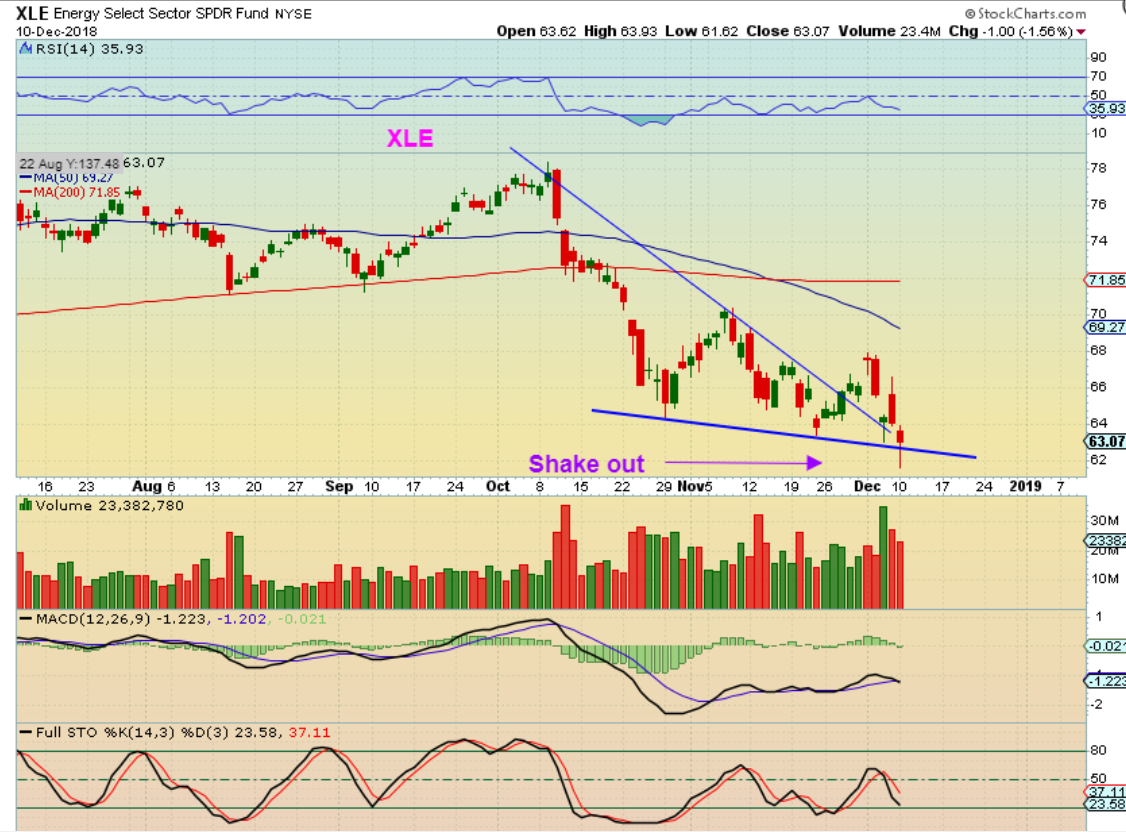
XLE – Oil did not break the low, but the XLE dropped rapidly Monday morning ( Shaking me out of my long GUSH position) and then put in a reversal. I did not buy back the reversal like I normally do. I still have a few other trades on Like CRMD, ENPH, CVRS, NBEV, etc that are ignoring the markets gyrations and are doing ok , and I may just stick with those for now.
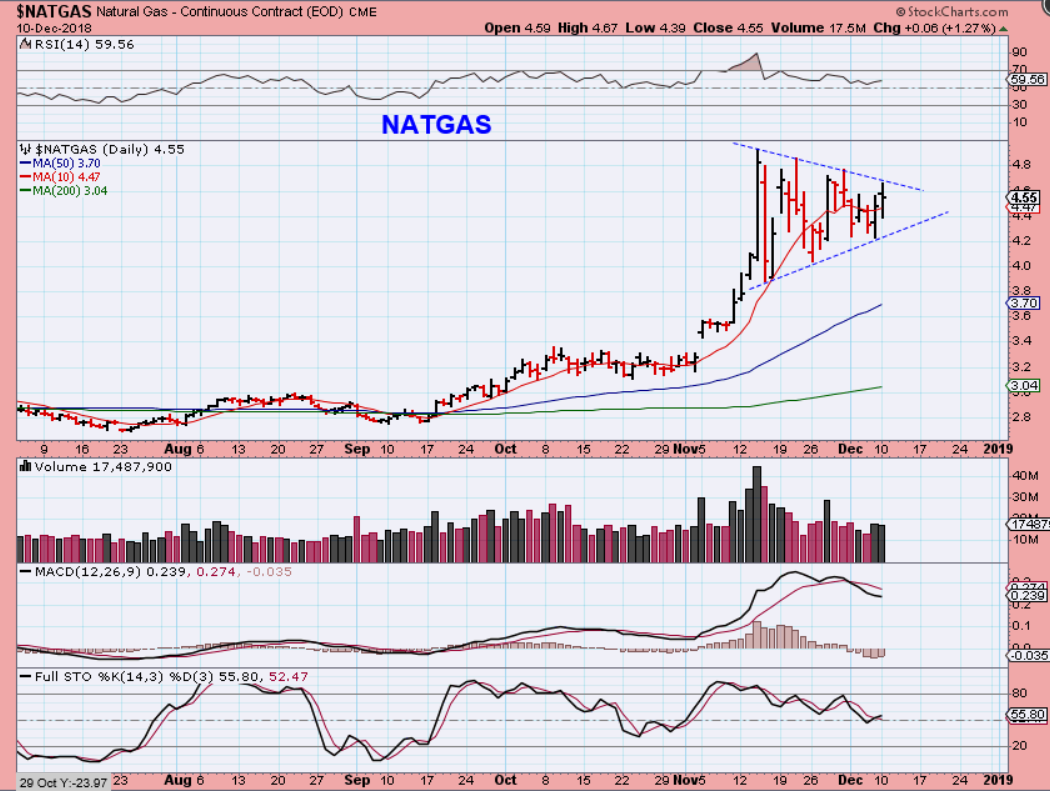
NATGAS– This Bull Flag just keeps on forming. I have a feeling that NATGAS is going to get a lot more expensive than it was just this past September. High risk traders with nerves of steel can trade this with BOIL or UGAZ leveraged 🙂 When that Pole formed, UGAZ ran from $75 to $200 . Please keep it to a small position & use a stop in case of false breaks, if you choose to trade this.
GOLD – Gold broke higher Monday morning, but reversed into the end of the day. We have seen 3 pretty equal measured moves out of the Cycle lows, and sometimes that is all you get ( a measured move similar to the last). See the next chart too…
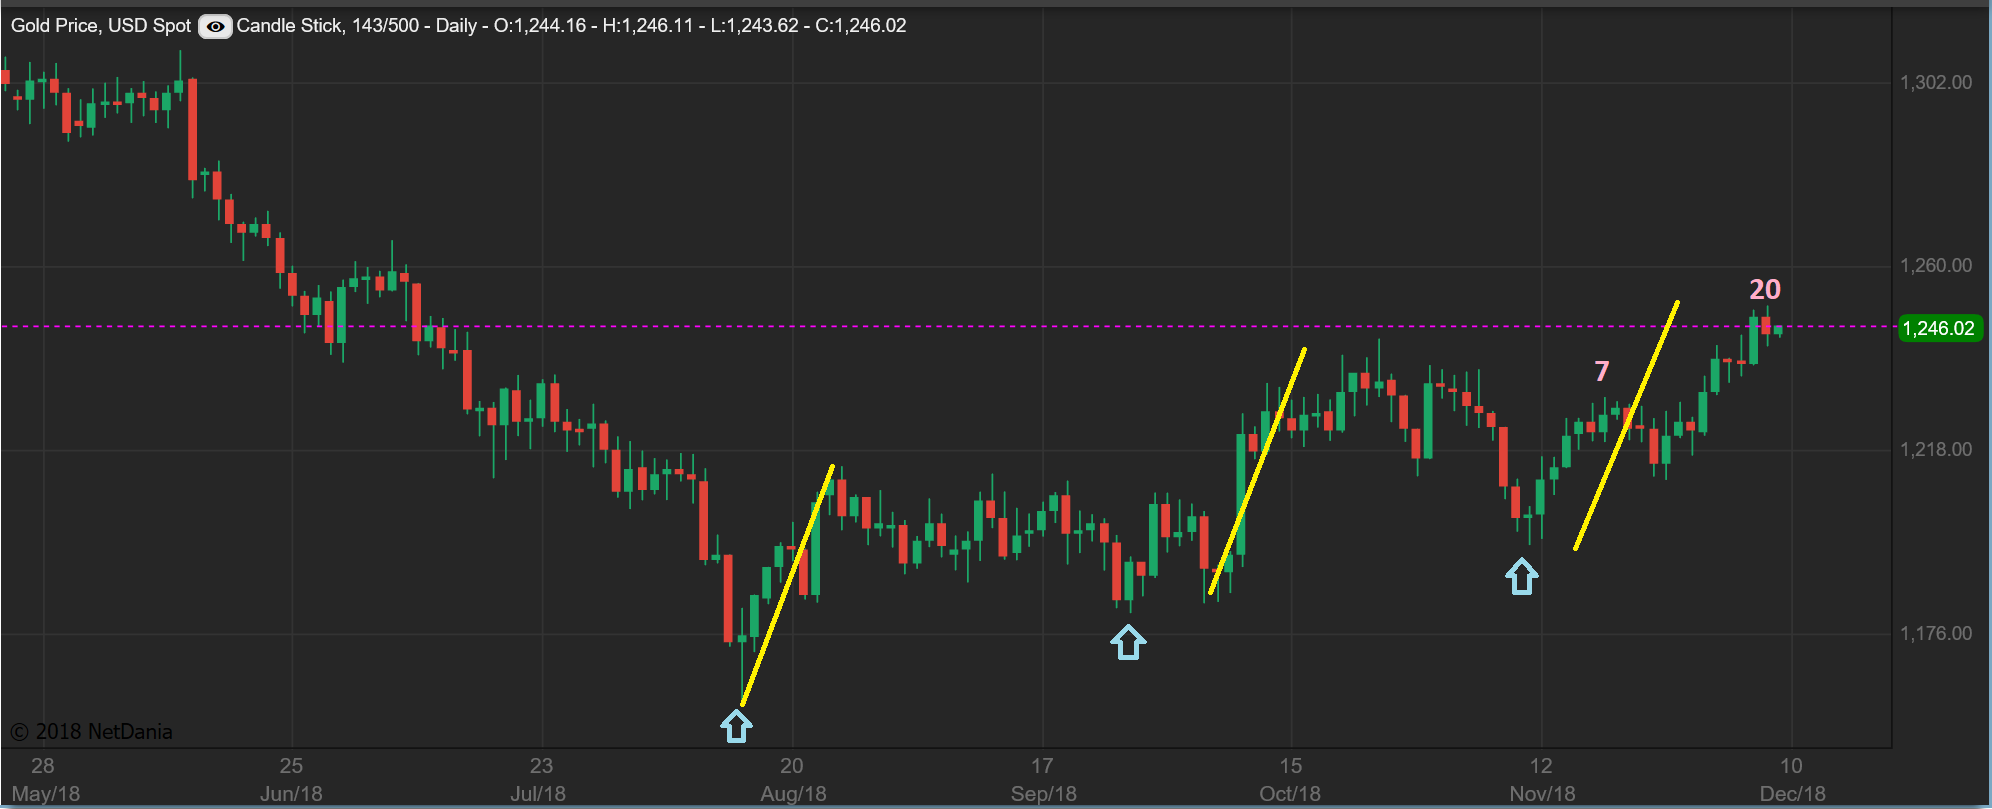
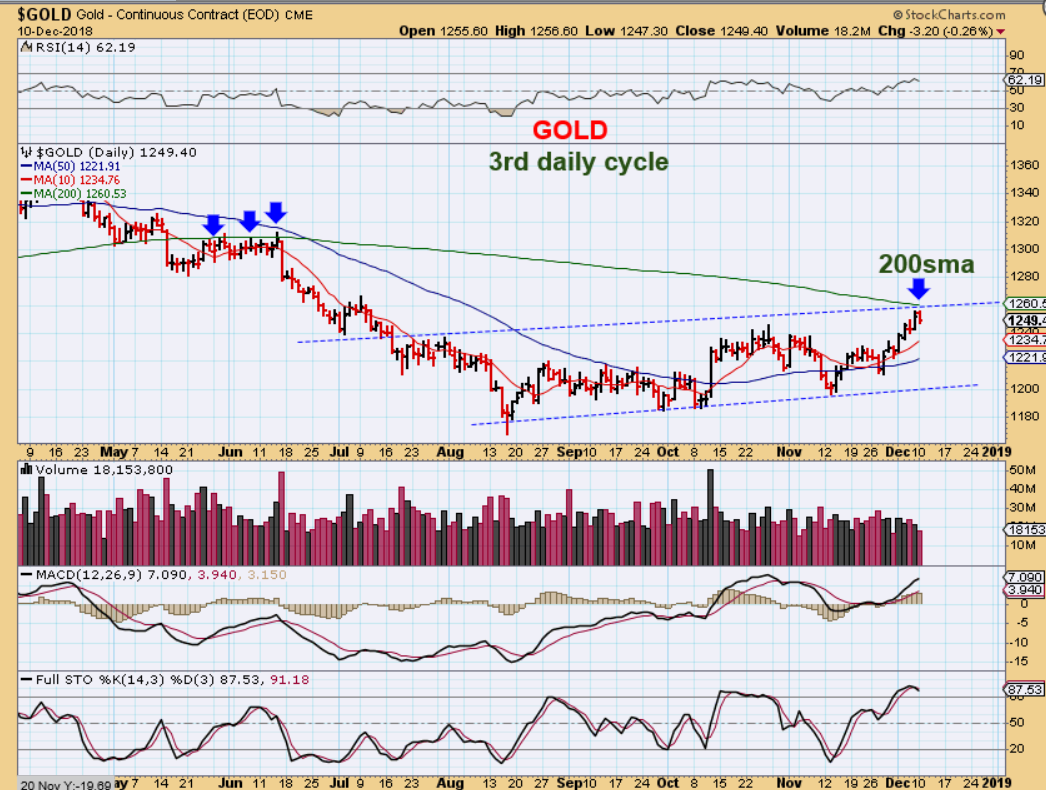
GOLD – Monday was also near resistance at the 200 sma and the channel that I have been showing for weeks. Once Gold broke higher, this is where I have been thinking that Gold could top for this 3rd daily cycle. The 200 sma. It still didn’t quite tag the 200sma, but this might be all we get. I have been saying that GOLD was a bullish set up, and GDX / GDXJ were weak, needing to catch up…
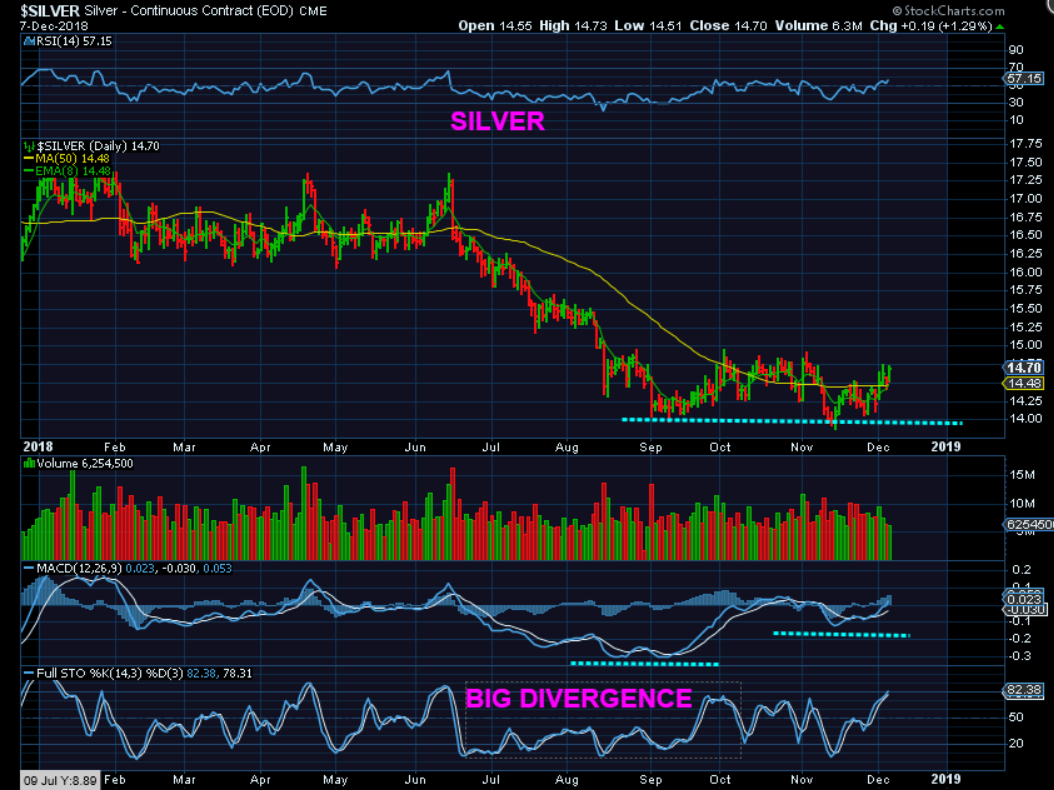
SILVER – From the weekend, this is a big base so far, and closed down 9 cents Monday.
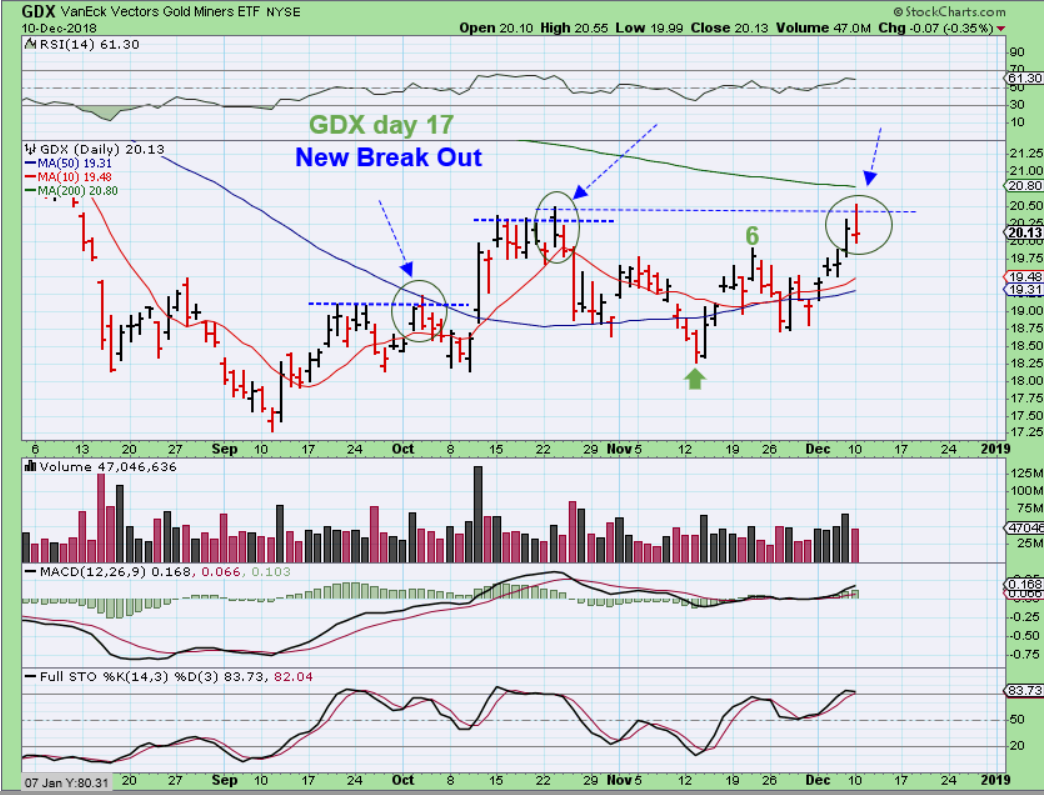
GDX – Notice how GDX would break to new highs in the past and then drops into a reversal that day – it becomes a false break out. Todays high might be the high for this daily cycle at day 17, unless it can tag that 200 sma .
GDXJ- And GDXJ broke out & closed back under the 50 sma. I have also mentioned how the choppiness of this sideways ‘complex base’ makes it look bullish one day and bearish the next. We need a trending move.
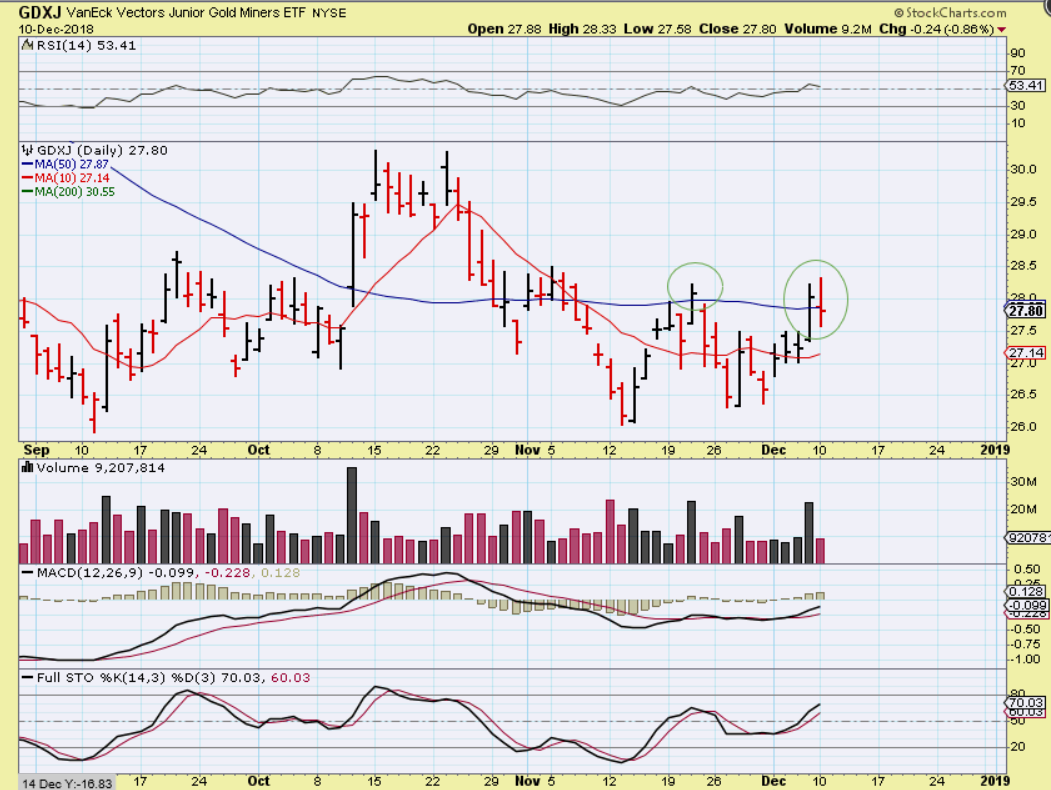
As pointed out in the weekend report – This has just been a long sideways base for months, so far, even though some individual Miners have been trending higher.

So it has been discussed that some individual Miners are ignoring Gold & other Miners and are bullish, like AU, KL, BNV AEM, ABX, etc…
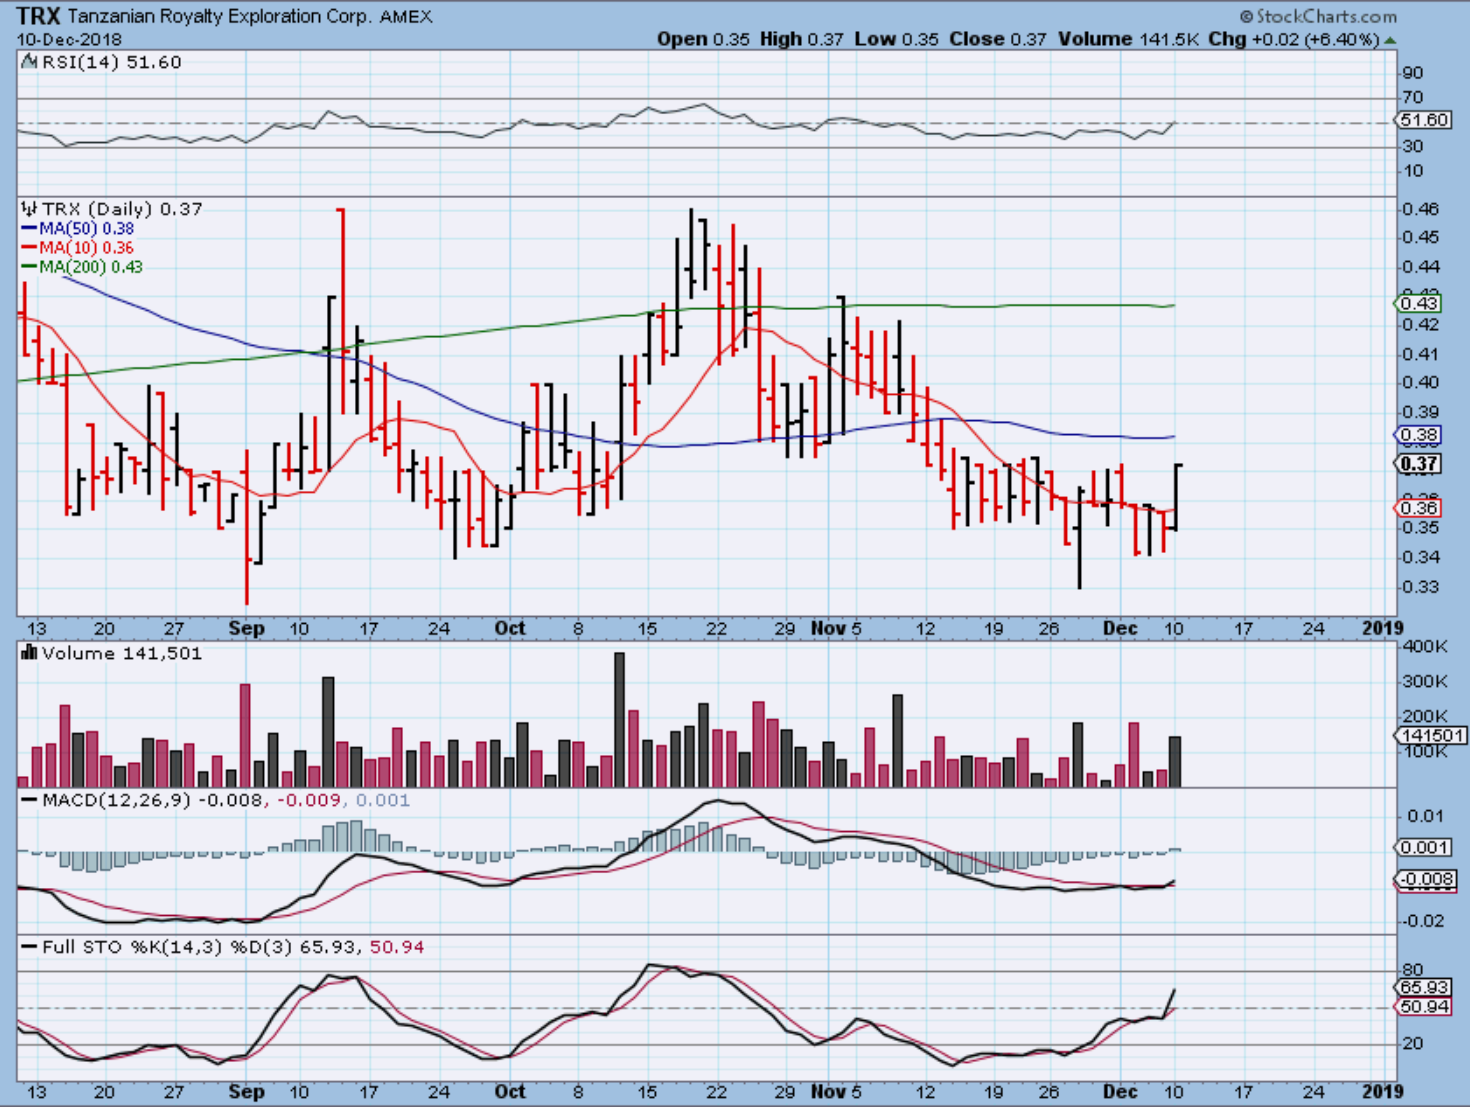
TRX – TRX was actually down when Gold was up in the morning, and then when Gold dropped TRX pushed higher.
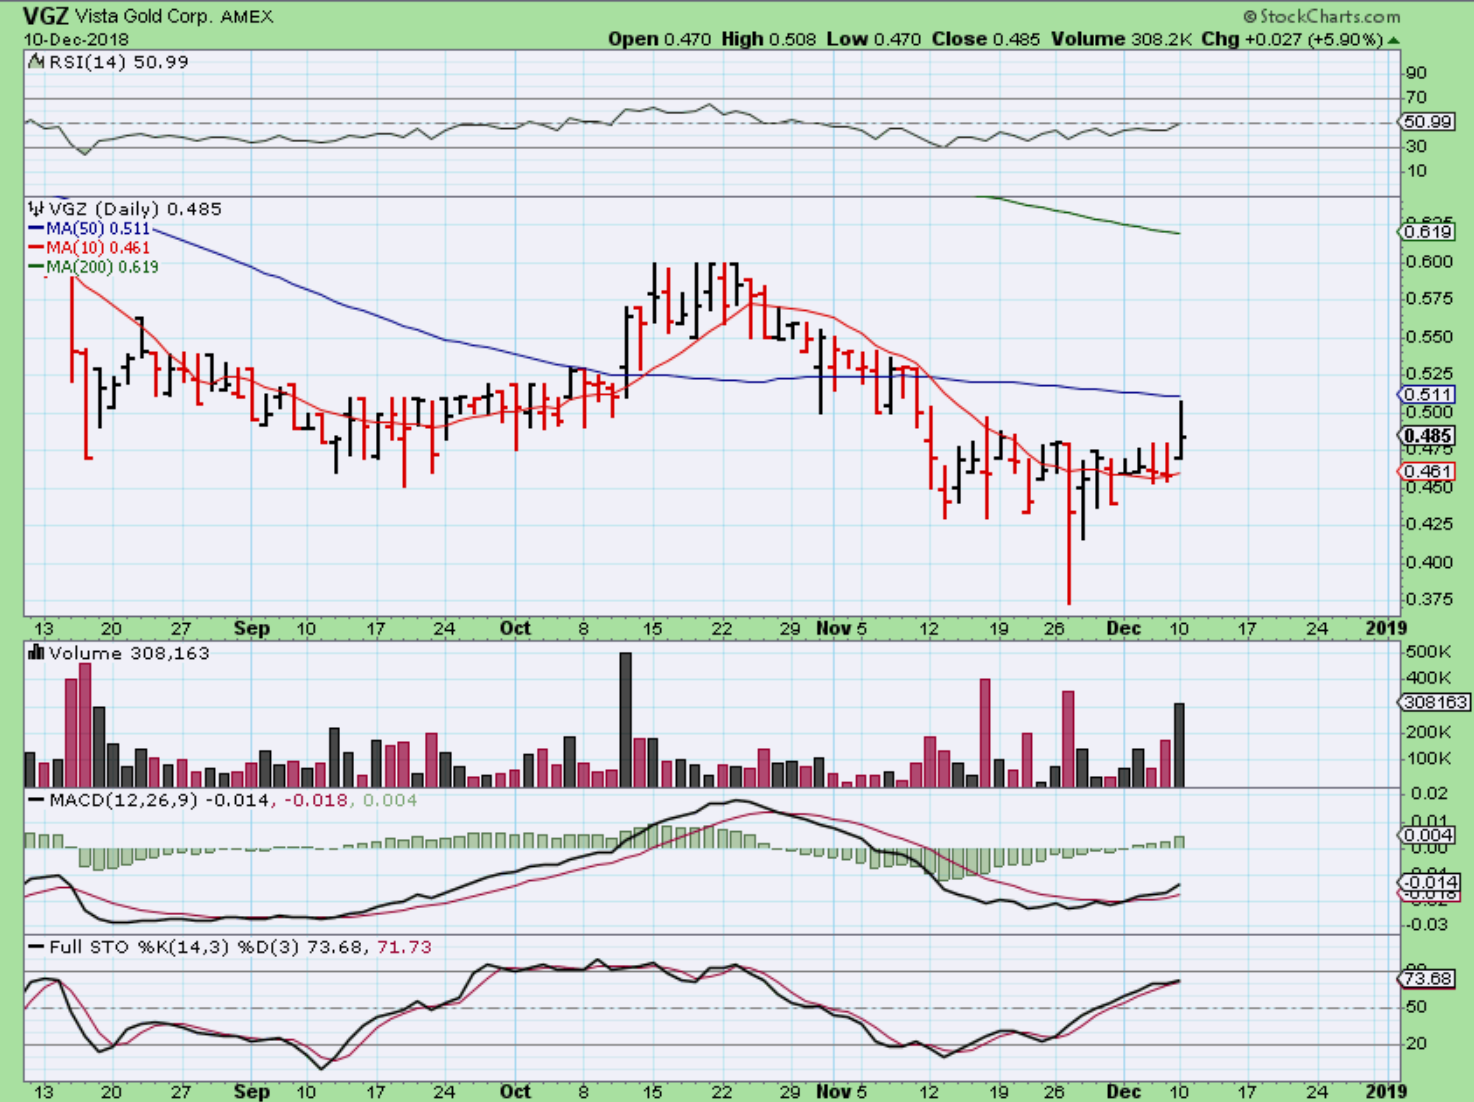
VGZ – VGZ, AUMN, and a few others also tried to POP from their recent bases as their MACD crossed higher, so the choppiness continues for now wit GDX & GDXJ, but some Miners are trying to stabilize.
Nothing has really changed on Monday, we are still getting a lot of choppy back and forth action. Trading and holding on to gains has been difficult and will remain that way until things settle down a bit more & start trending. For some, it may even be a ‘Buy & Sell the pops’ to lock in gains quickly type of a market, buying & only holding for a 1 – 2 day period. I will show a couple of trades below that are acting fairly well, despite the sector chop.
Try to enjoy your Tuesday trading!
.
~ALEX
.
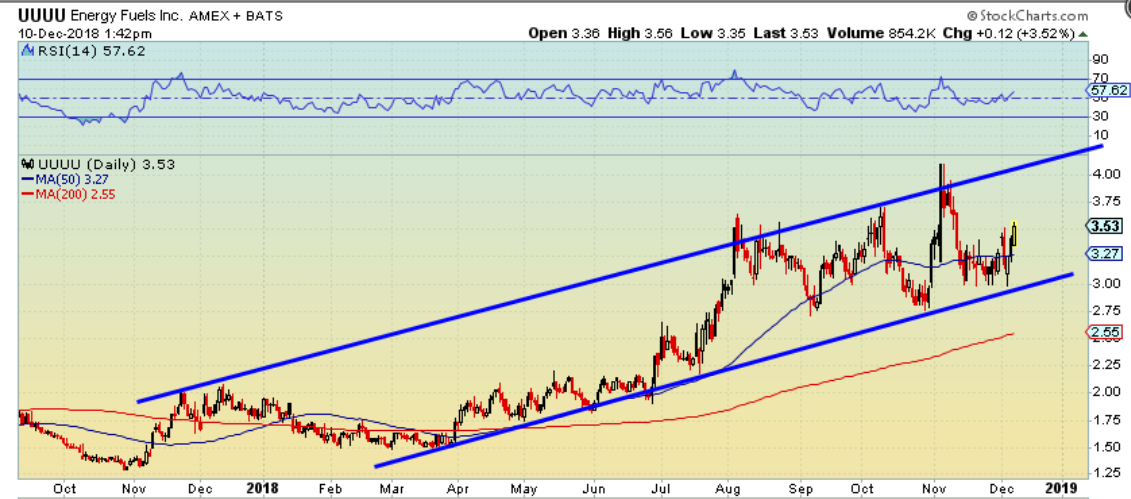
UUUU – We have traded UUUU here a few times, and it is a buy again, as it runs above the 50sma. One of these times this long consolidation could break out & keep running, but this has been big picture sideways for 4 months now. See the next chart too…
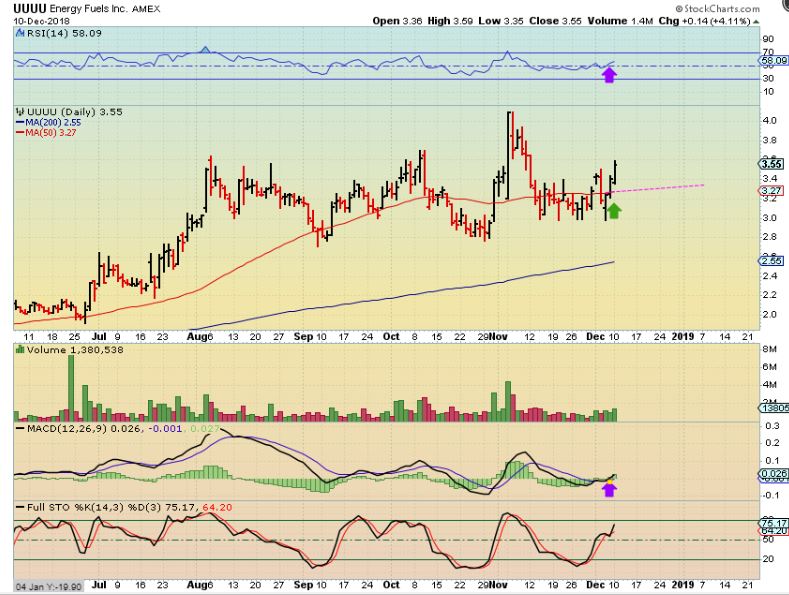
UUUU – If you can buy & hold and ignore the wiggles, UUUU rises and crashes and chops around, but it has been climbing overall in this channel for the 2018 year. In fact, It’s actually even up 100% from March. We have traded this several times, but it is choppy and NOT ALWAYS AN EASY RIDE. It does look like it could run to over $4 now.
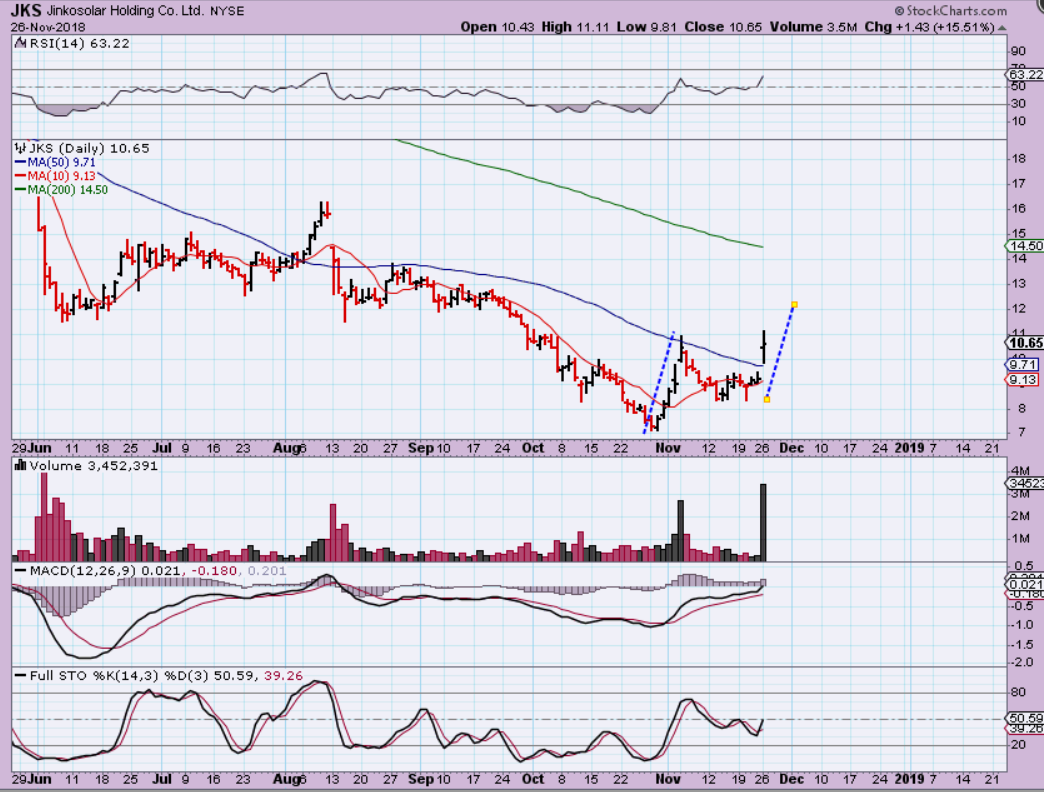
JKS November 26– JKS was one of the ‘Solar’ buys recently. A measured move to $12+ was shown here & looked likely, but then what? A run to that 200sma is what I was thinking…
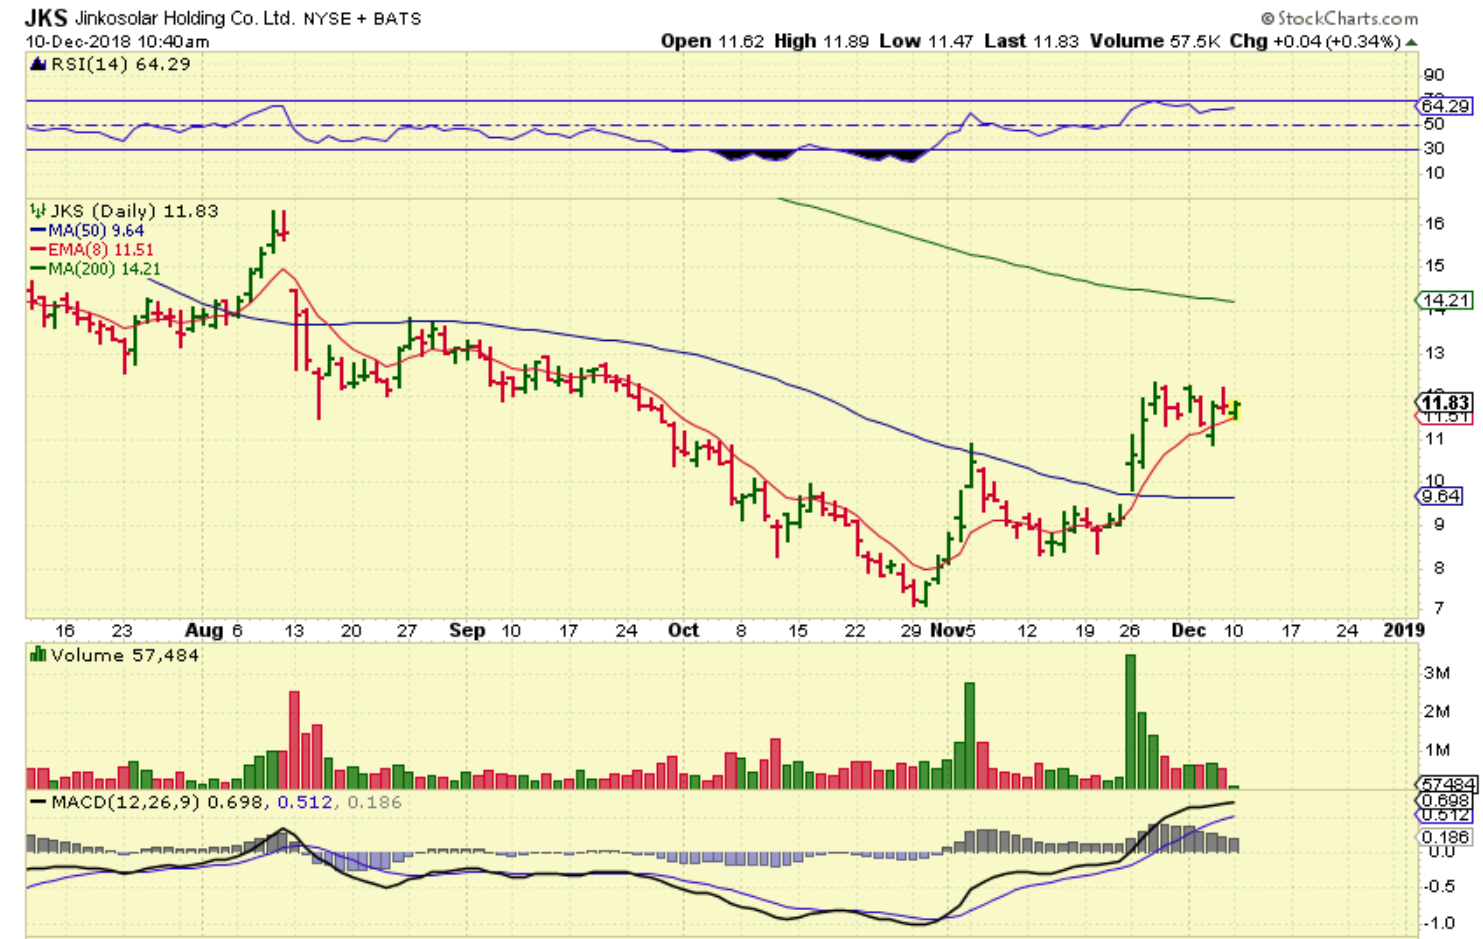
JKS – So far it is consolidating ( or flagging) over to the 10sma ( 8ema shown) and this still looks like a buy too, because Solars have ignored the General Markets sell off. It should run to the 200sma.
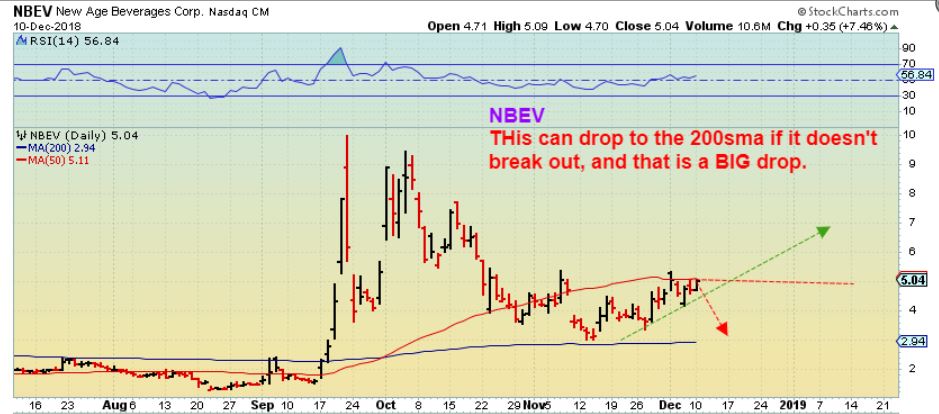
So I mentioned that I bought NBEV recently. I think you’ll appreciate this story. I was watching NBEV & WTER in this Infused Beverage area. Both were running to the 50sma and a break out looks like it would be a BIG move higher…
NBEV – WHAT A RUN IN SEPTEMBER! I bought NBEV instead of WTER and it moves fast. It is pushing on the 50sma, so lets take a look at WTER.
WTER 1 – WHAT A RUN IN SEPTEMBER HERE TOO! This was WTER last week as it pushed on the 50sma. I thought that the volume was too light to break through, so I bought NBEV and …
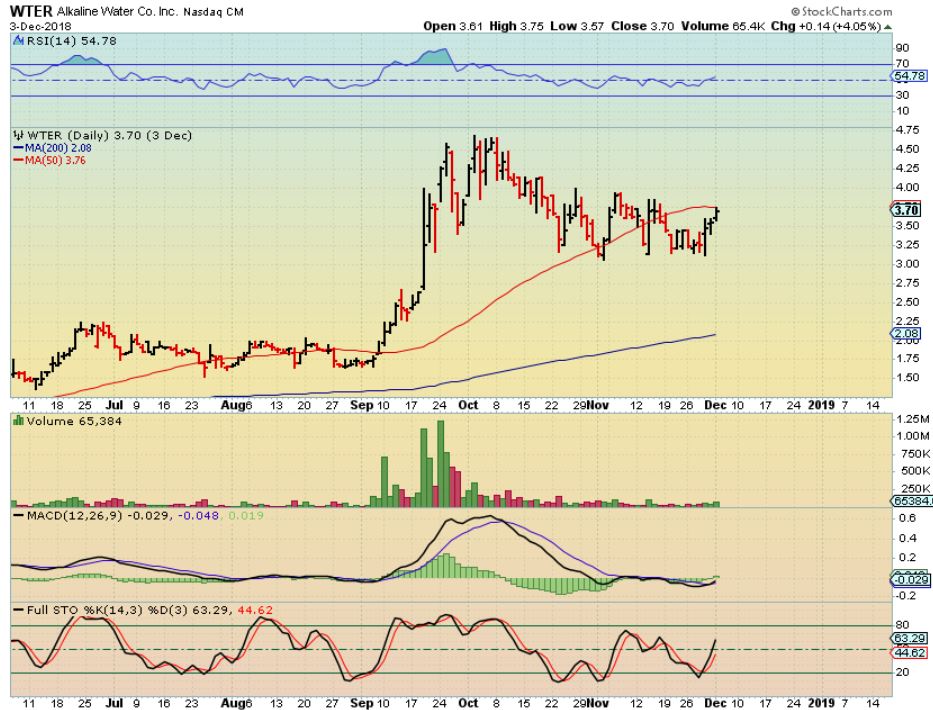
WTER 2– Hmmmm, So I bought NBEV ? 🙂 Well, they looked very much the same after that explosive September run, so it was really a coin toss at that point. Now I’m hoping that NBEV follows what WTER did, since they both ran similarly in September.
.
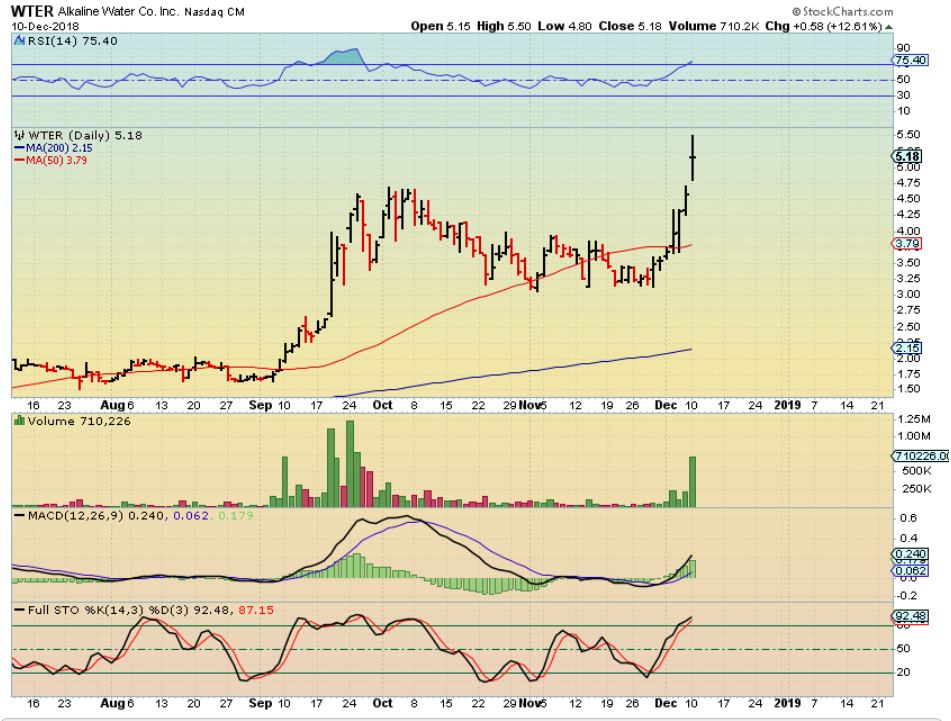
SAME WTER CHART, just a different point that I want to make: Notice how chioppy that sideways move was in October into November. That was $3 to $4, then to $3 and back to $4 repeatedly, BUT WHEN IT STARTED TRENDING, THE GAINS WERE RAPID. My point? I just want to show that this current choppiness in many Miners as they ‘base out’ or ‘consolidate gains’ can lead to nice trending moves when they are ready to run higher.
.
SEVERAL BIOTECH / PHARMA STOCKS HAVE BASICALLY BEEN IGNORING THE GENERAL MARKETS SELL OFF
.
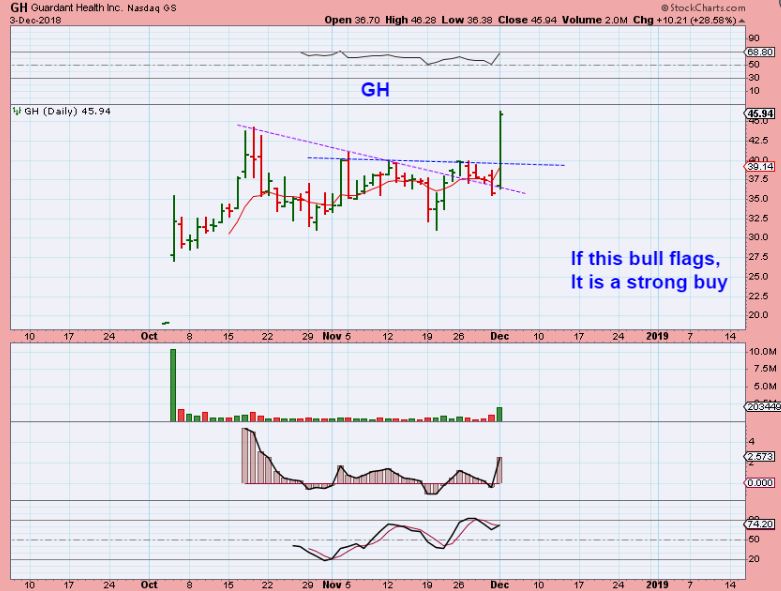
GH – Do you remember this chart? I watched it run away from me all day that day from $27 to $36! Notice what I wrote on the chart…
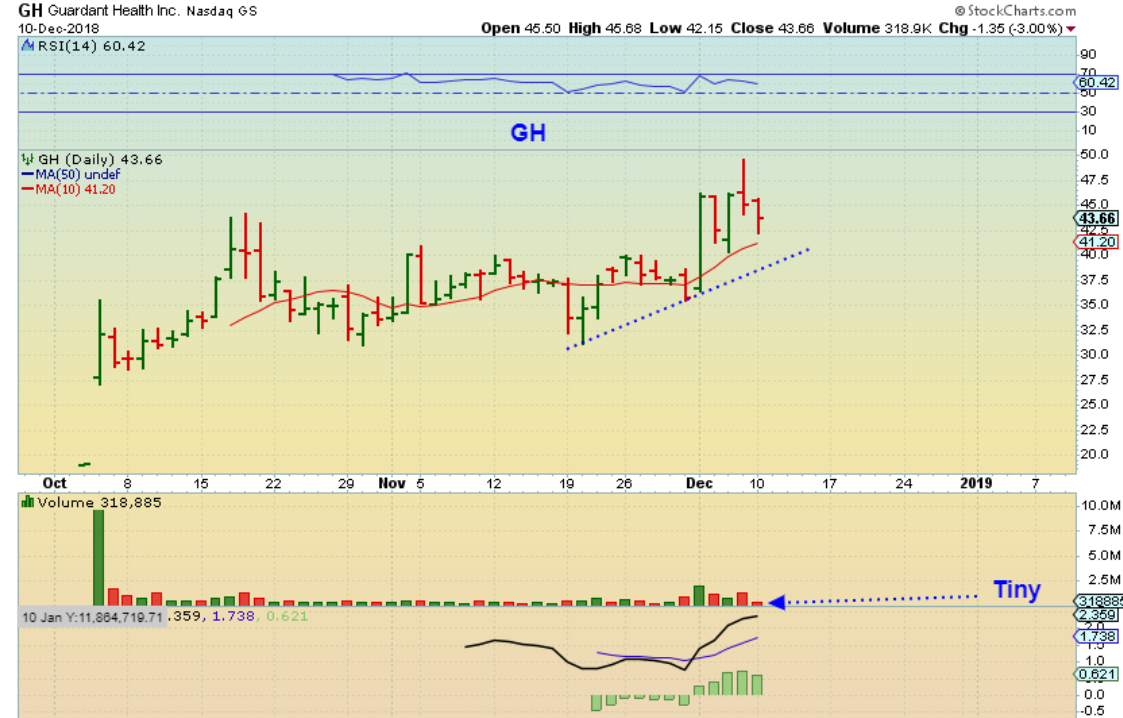
GH – It isn’t quite as bullish as a bull flag, but it is pausing. It could just take off higher, but it also may drop to the blue line. This sideways chop for October & November does look like it wants to start trending higher. I do not own it yet, but I am trying to see if a low risk entry on that blue line sets up. Look at these numbers, $32 to $50 in about 2 weeks along that blue line.
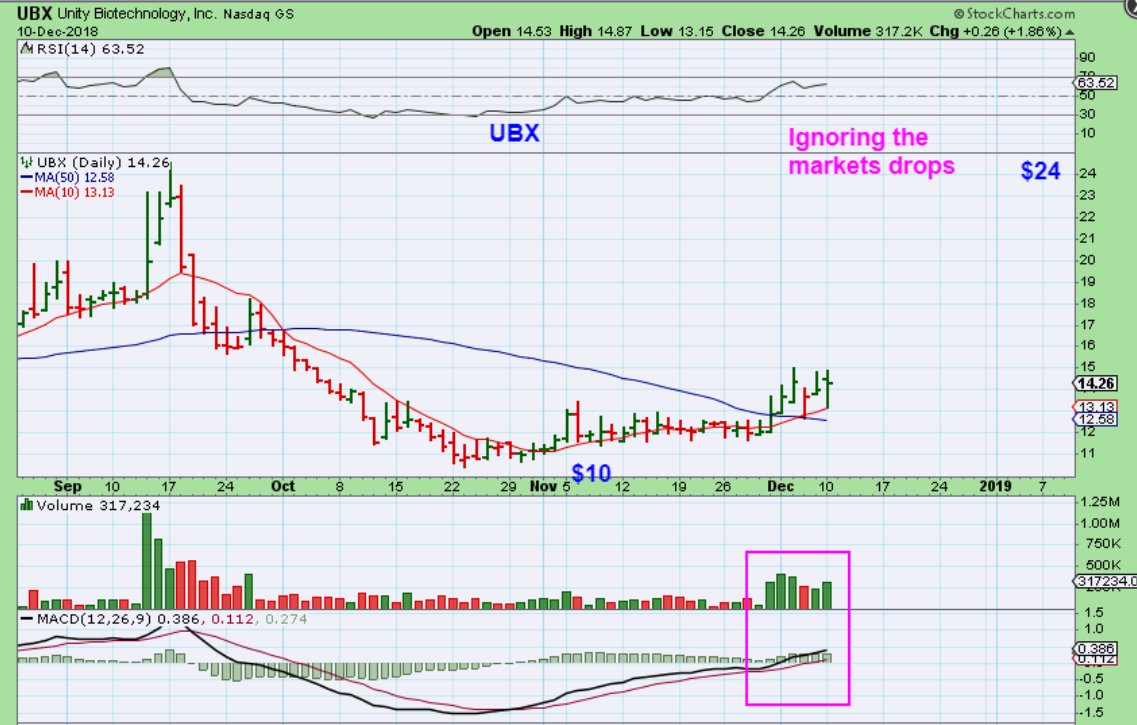
UBX – Do you remember UBX as a Buy as it broke above the 50sma ? It was going sideways in November , but popped with good volume. Well…
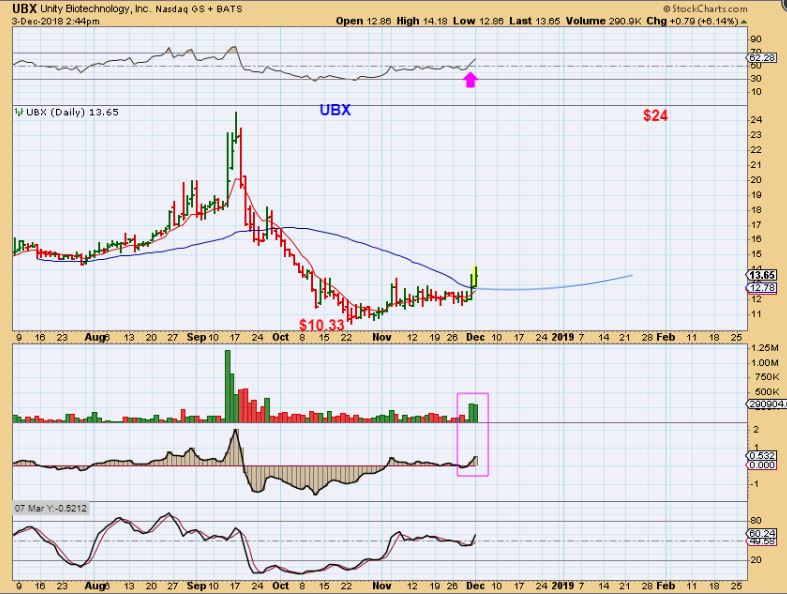
UBX– This one dropped to the 10sma on Monday, but then closed higher again on Monday with volume. I like the potential and this is one that I bought as it crossed the 50sma. It has actually hit my buy price twice since then, but remains bullish above the 50ma.
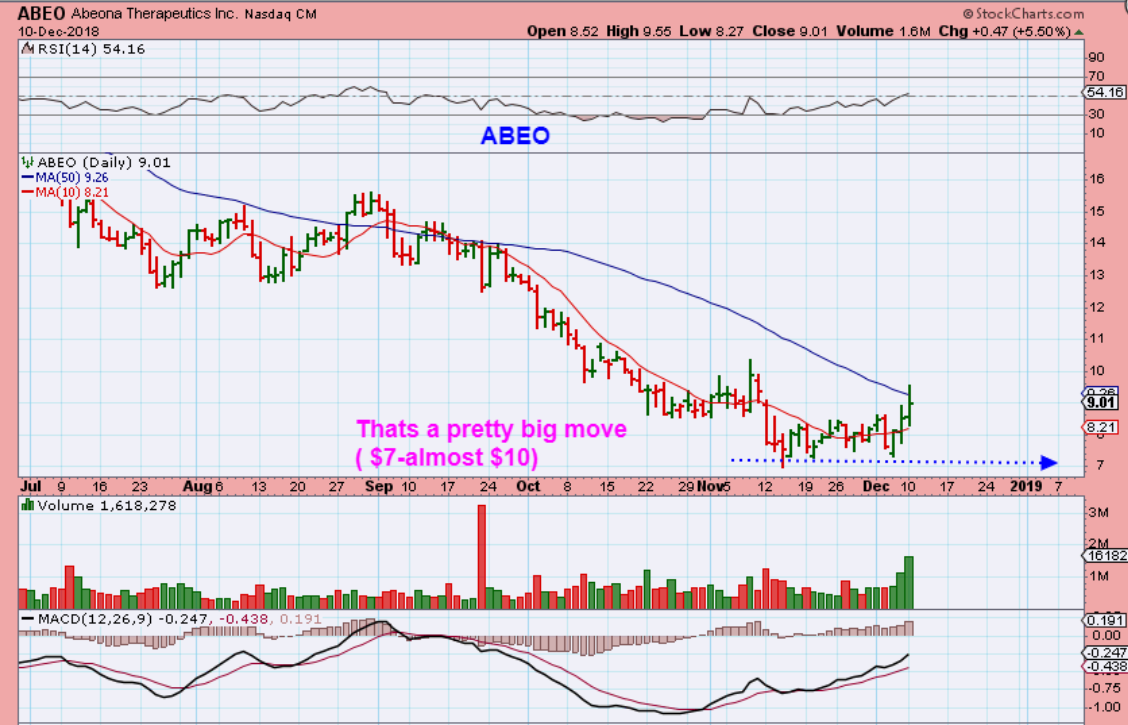
ABEO – Some of these look like small moves, but take a closer look. These are really pretty big moves, and this was almost $7 to $10 in 3 days. It did not close above the 50sma yet, but put it on a watch list. It may crawl bullishly along the underside and you can enter before it POPS through it.
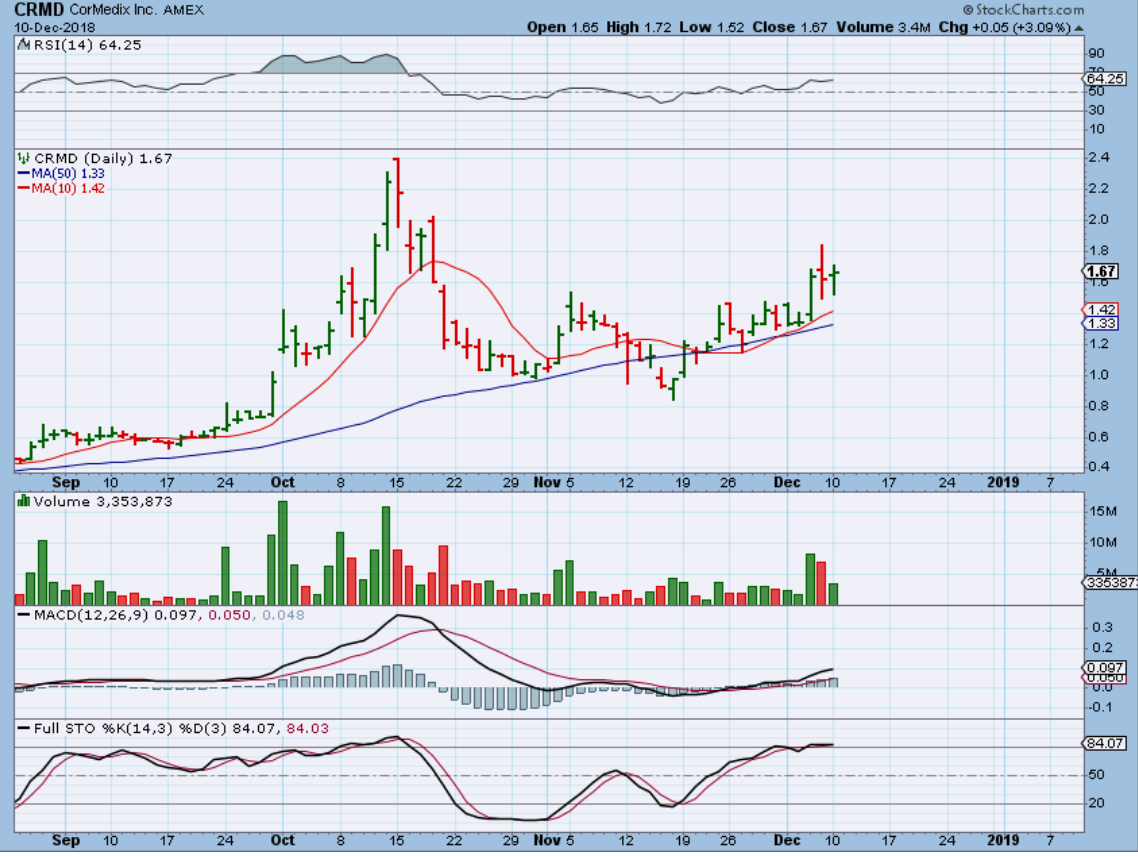
CRMD – I still own CRMD too. After a shake out at the 50sma, it seems to be on track climbing toward the October peak
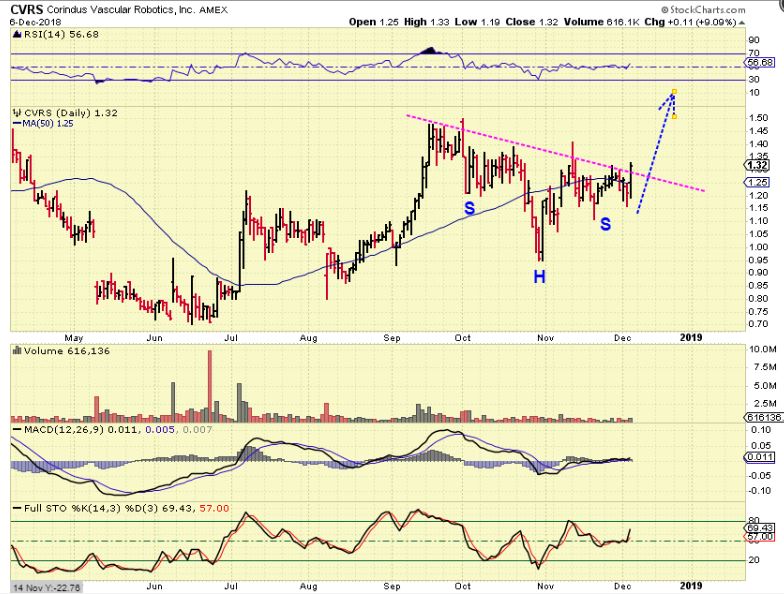
CVRS – I also bought CVRS and used this chart a week ago to point out the buy as it crossed the 50sma. It also moved above the 200 sma (not shown) . Well, it is still right here at this price for any that want to consider an entry.
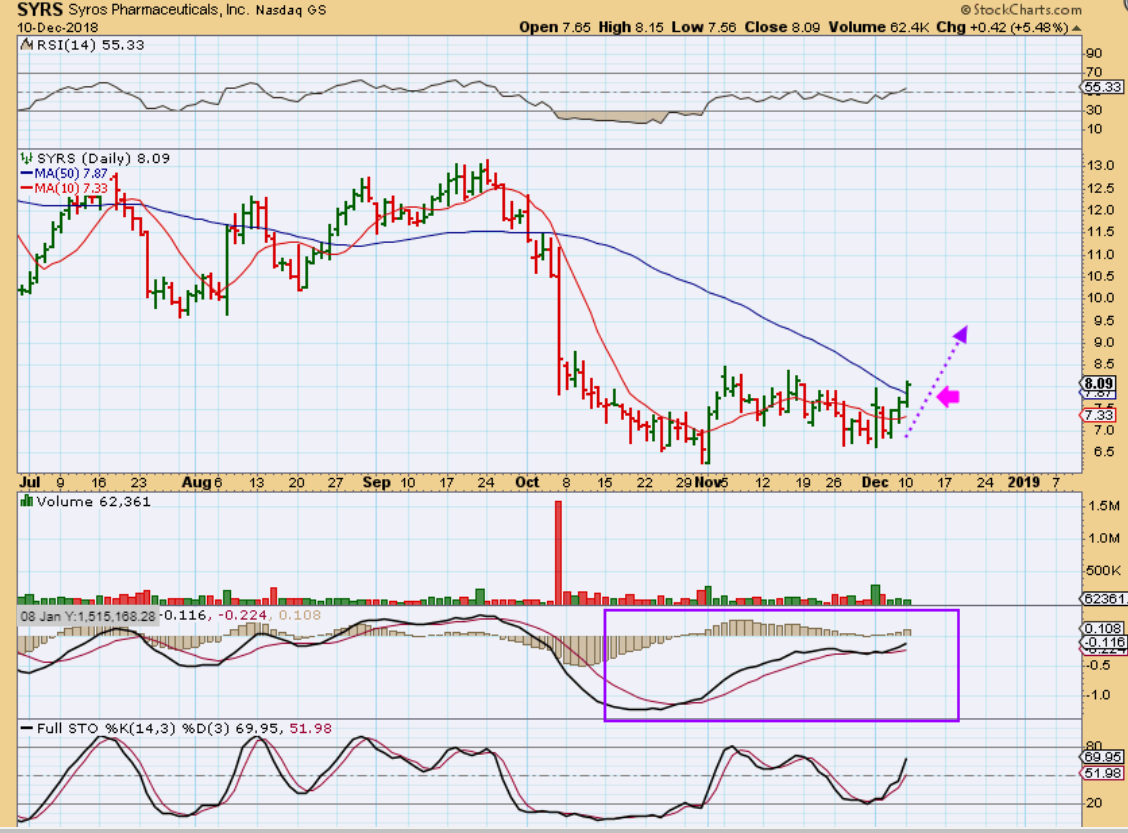
SYRS- With large divergence at the lows , this now closed above the 50sma. Volume is a bit weak, but it may increase on the way higher.