December 6th – Thursdays Trading
Well, it has only been 1 trading day since my last Tuesday morning report, what has changed since then? The Theme Picture of this report is a hint. Wow!
.
Review for those that need it: The markets have been very volatile lately. Since the Sell off in the month of October to a trade-able Low, the trading has been very choppy ( as expected). As of last week, we had a ‘Powell Pop’ 5 trading days ago, and then price moved to the 50 & 200 sma as we approached the ‘G20 Weekend Meeting’. The daily cycle was getting old at day 23, and that 50 & 200 could be strong resistance, so what would happen after that G20 Meeting? Well, Monday had another Gap open higher, right above both the 50 & 200 sma, but it closed in a doji candle with a gap under it. That looked very strong & convincing for this daily cycle, but I did note that the Doji could indicate a dip down to close that gap. A stop under the 10sma was advised. Well, from there, we can discuss Tuesdays trading, a day that actually saw the Dow lose 800 Points!
.
I am releasing this Wednesday Night, to prepare us for Thursday.
.
I have written extensively about the current market set up as it has unfolded in our daily reports. ” Long term trend lines have broken, Former Bullish leaders NVDA, AAPL, GOOG, FB, etc are breaking down” etc etc. I’ll take some time to review it again, using charts in past reports, to give the current view of our general markets.
.
LET’s QUICKLY REVIEW THE GENERAL MARKETS AGAIN – NOV 27 – Read the chart. I mentioned the length of a daily cycle may only give us this tag of the 50sma and then we could break to a deeper low ( meaning that the ICL or ‘Intermediate Cycle Low’could still be ahead). SO THE ICL WOULD BE AHEAD IF LOWS ARE TAKEN OUT.
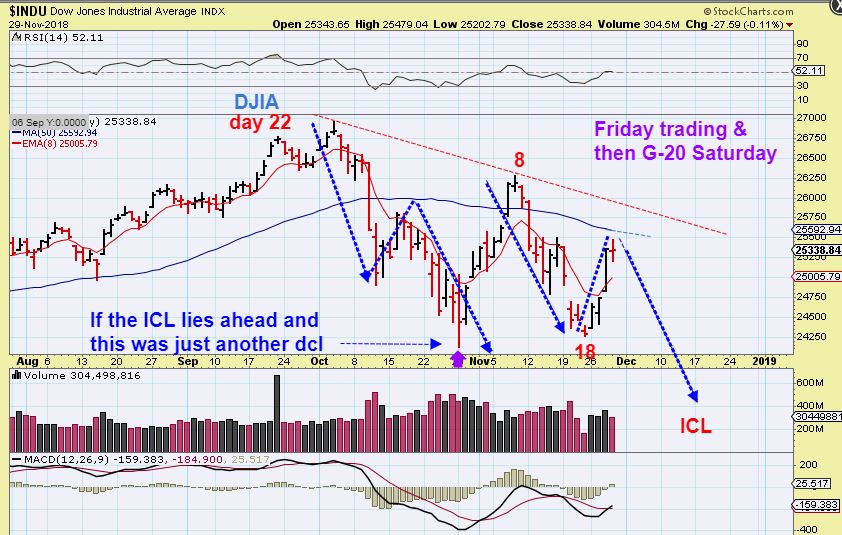
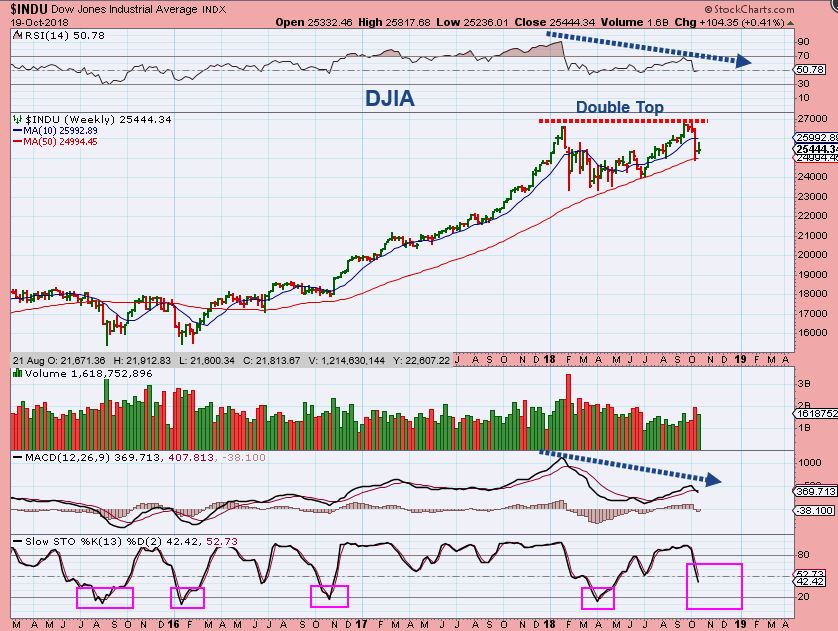
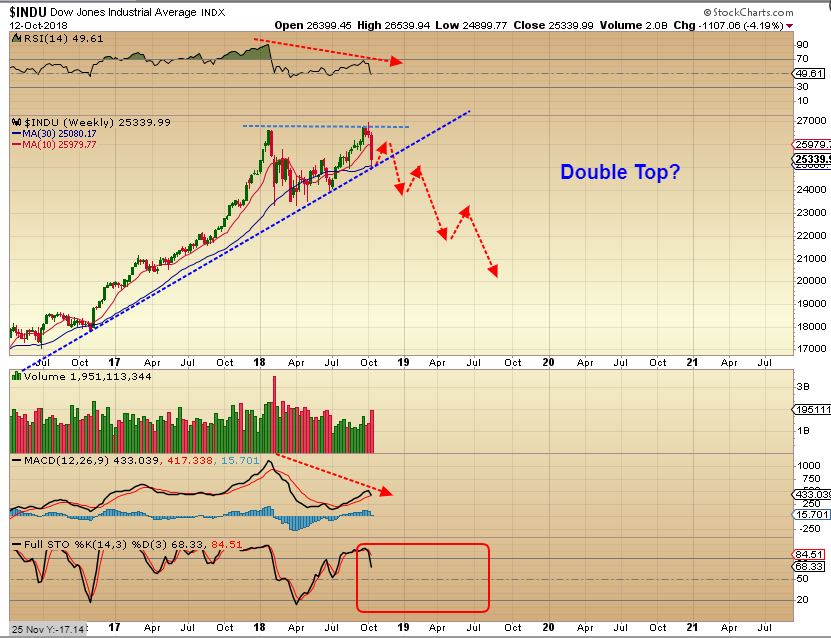
NOV 29 DJIA- I also pointed out what the DJIA would look like with a break to an ICL recently. I thought that we might turn down at the 50 sma and fall to that new low …
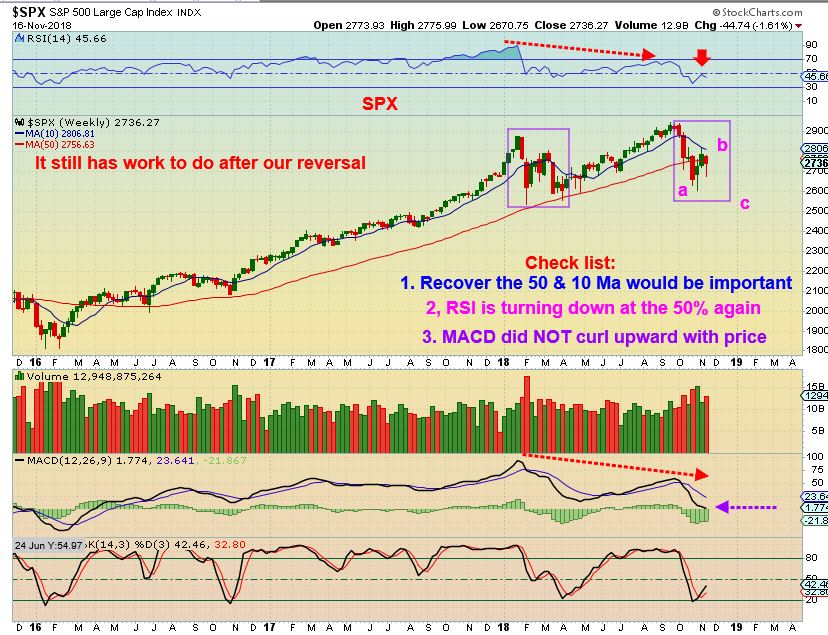
NOV 16 WEEKLY CHART – I showed a possible bounce out of the Oct low as an A-B-C drop to a deeper low ( ICL) If ‘a’ was not the ICL. A bounce to ‘b‘ seems complete now , and now the drop to ‘c‘ make an A-B-C down.
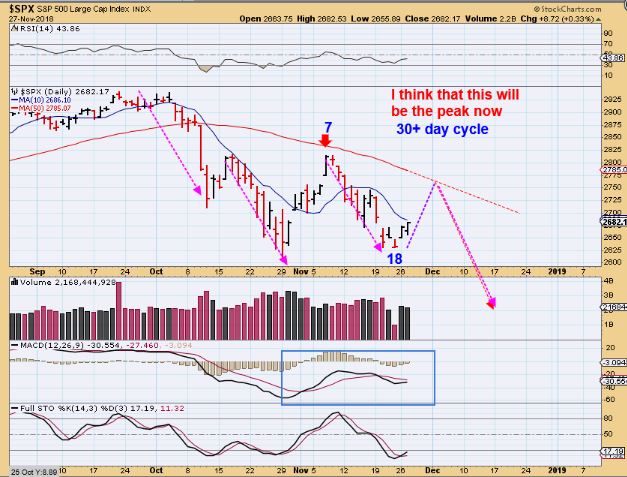
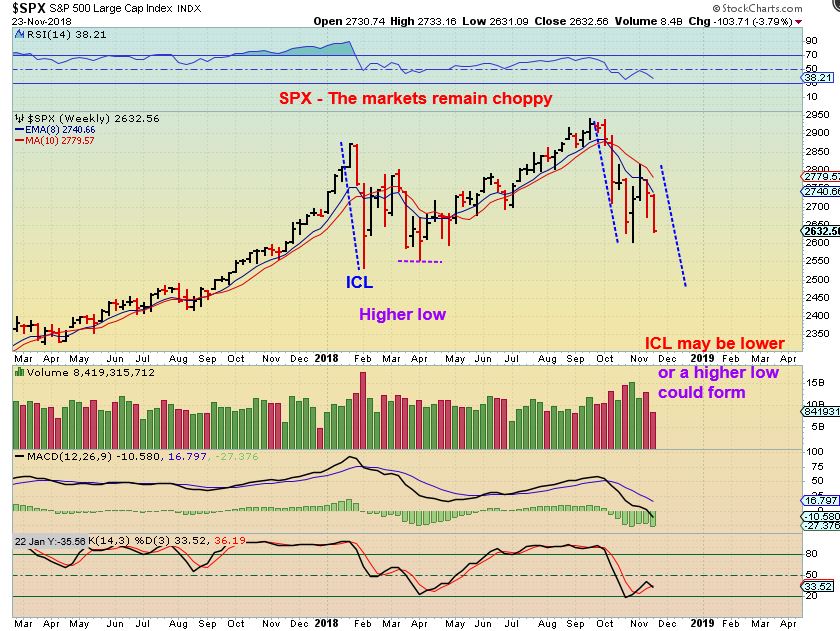
SPX Nov 23 – 2 weeks ago I mentioned that a lower low could mean that it is possible that the ICL is still ahead We had a HIGHER LOW in April, but this could drop again. So Where are we currently?…
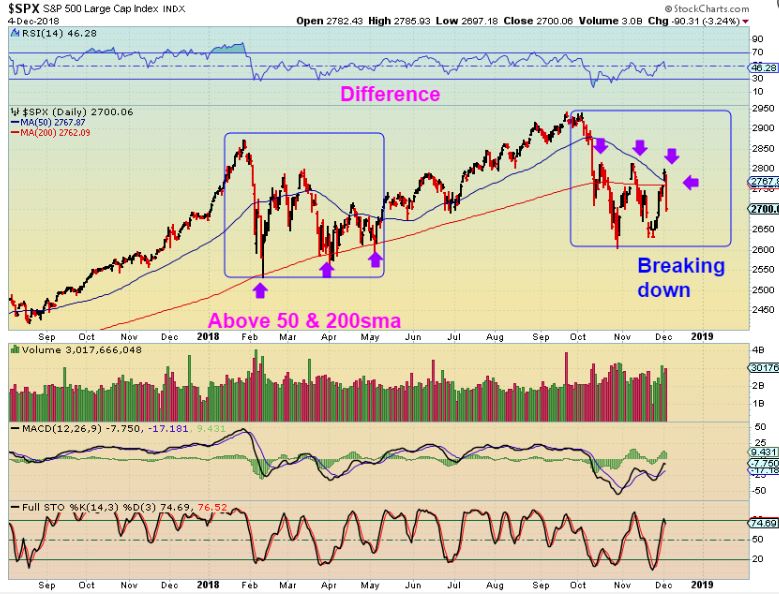
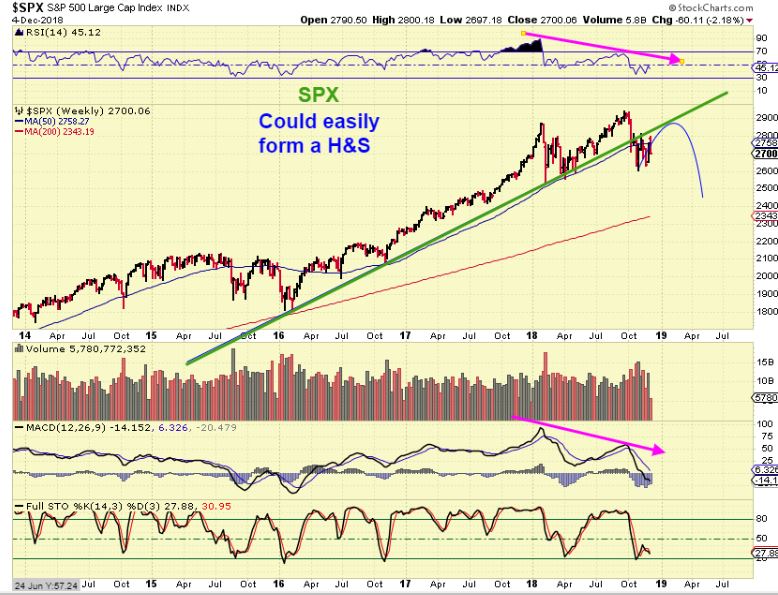
SPX – I didnt really think that we would break the 50sma, but after the G20 Mtg, we gapped over both the 50 & 200sma. It is getting late in this daily cycle at day 25, and down it went Tuesday. Note: I did mention that we night get a quick gap fill, but this drop was sharp to the 10sma. At day 26, This could easily sell off into this Daily Cycles Low (DCL). Look at the stochastics.
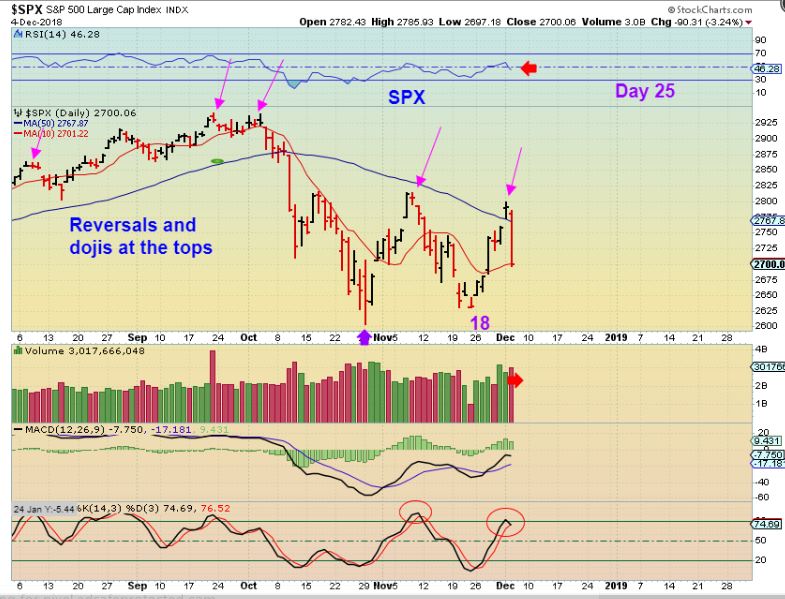
I do like the divergence on the MACD, but we can drop to a daily cycle low now (DCL) that can be 30+ days long. It also could be the ICL as mentioned. Whether this bounces Thursday or not, I think it has more downside short term for a dcl. That would make that a false break out above the 50 & 200 sma.
.
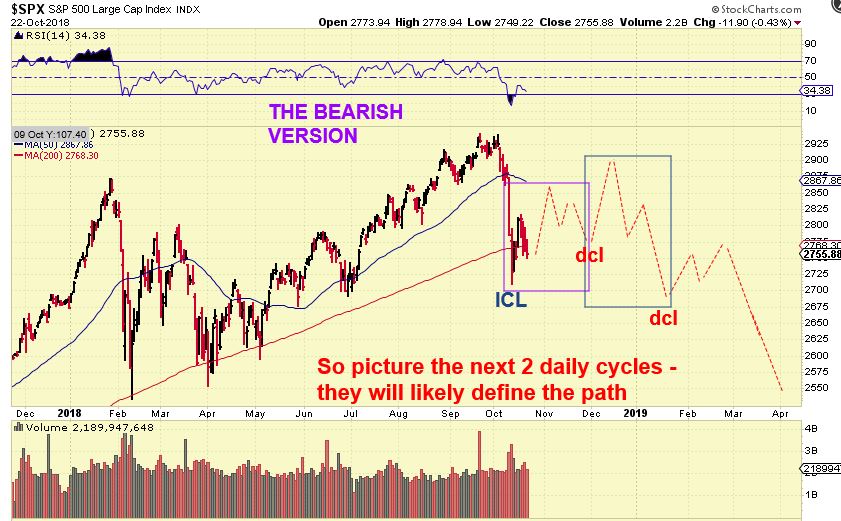
Reminder : SPX on October 23 – There was a Bullish or Bearish possibility after the sharp first leg down, so we needed to watch the next few weeks of progress. I said that at that point, 1. It could match a very choppy sideways consolidation, like we saw in Jan – March. or 2. It could become a bear market as shown here. As time goes on, you get to see more evidence or clues as to how this would play out, and I would examine the daily cycles for clues. Currently we are seeing weakness and warning signs.
DO WE HAVE SIMILARITIES TO JAN – MARCH CONSOLIDATION? YES WE DO, BUT THIS TIME IS MORE BEARISH TO ME. WHY? …
SPX – Similarities are
1. a massive drop,
2. a bounce to a double top in Price & RSI, and
3. now another drop. See the chart. The Green line shows a HIGHER LOW in April, but now we may break recent lows. And also this time is different because…
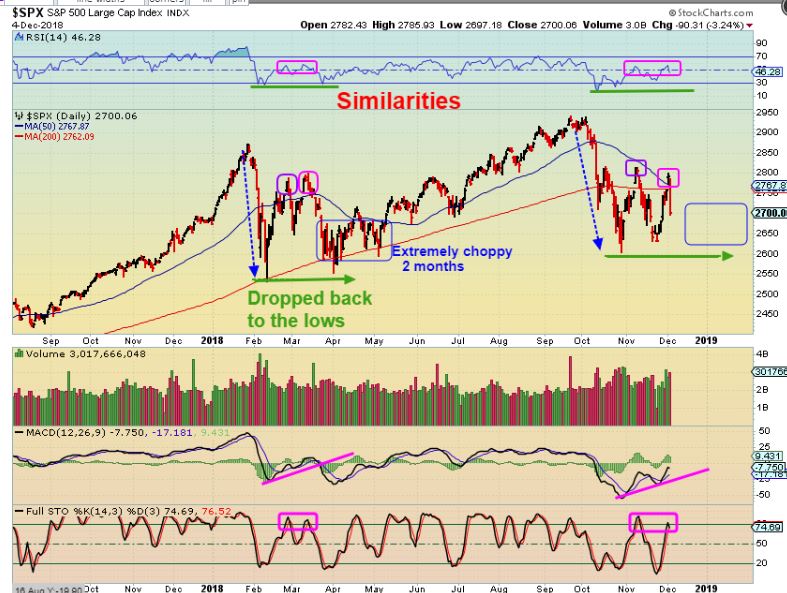
SPX DIFFERENCES – See the chart. All of the above happened on support of the 200 sma in Feb, April, and May. We have currently been crashing easily below the 200 sma & notice that the 50 sma is curled down and about to cross under the 200 sma. THIS LOOKS LIKE A BREAK DOWN OF SUPPORT, and it is overbought, not oversold.
I have posted charts of GOOG, NVDA, NFLX, APPL in October & November to show what they have been doing. Up-trends are breaking , supports are giving way, warning signs are being posted. The markets have been weak and choppy and breaking support levels. This does not look good for 2019.
.
On OCTOBER 19 I posted this warning- watch the 50 weekly ma. We have broken that 50 ma 3x since then.
NOVEMBER 3rd I posted – Watch for a possible H&S forming as the daily cycles rally out of an ICL.
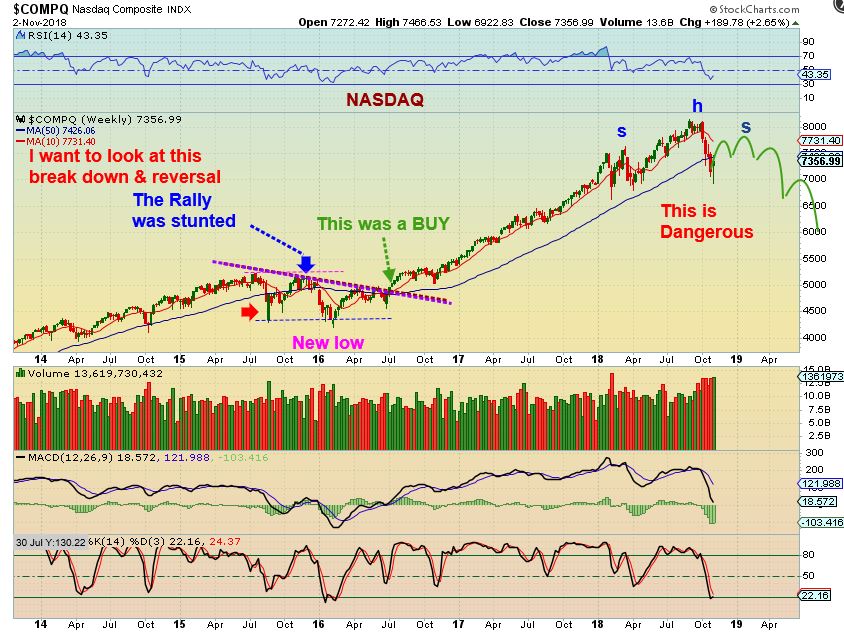
SPX – On Nov 30 I posted that the Uptrend is broken . Watch for a possible H&S forming on the Weekly under the broken trend line as the first 2 daily cycles unfold. THE UPTREND HAS BROKEN.
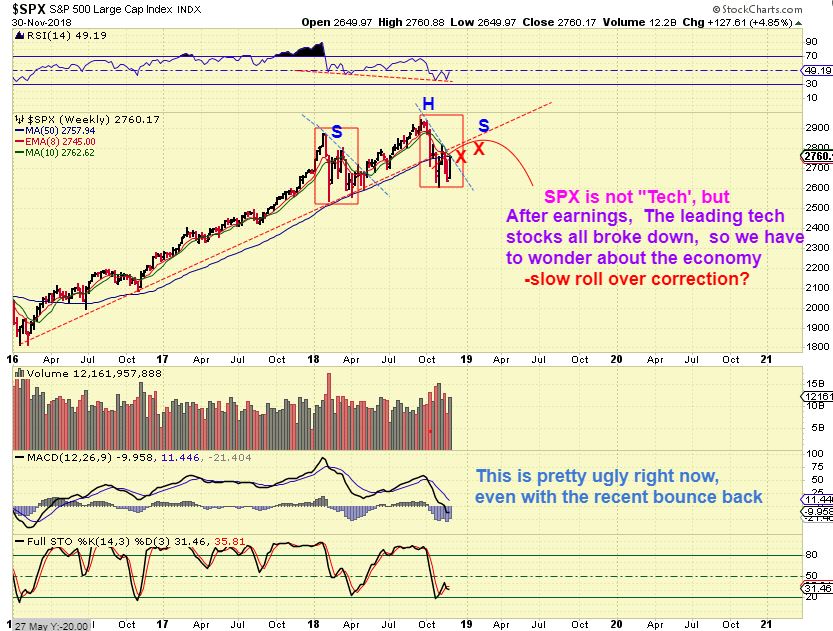
SPX CURRENTLY – After a DCL ( possible ICL ) , we should bounce again, draw in Bulls, and roll over again.
DJIA OCT 12th – I was warning about the possible break of a trend line way back in early October. It has now happened. If it doesn’t recover quickly, it may just back test and drop further, so 2019 looks to be setting up as Choppy and even Bearish.
I am posting all of these past charts now because I said that I would look for clues along the way. I have posted these and MANY more as clues of what the markets are currently saying to warn the readers that 2019 is looking to be bearish or at least choppy & volatile.
What conclusion can we draw, other than that this is a market in trouble, and we haven’t seen improvement yet. I still think that we can get 2 daily cycles of ‘hope’ out of an ICL, but it is looking like a false hope at this point. Short term trades and 2 daily cycles out of an ICL may see some short term gains, but I remain cautious long term.
.
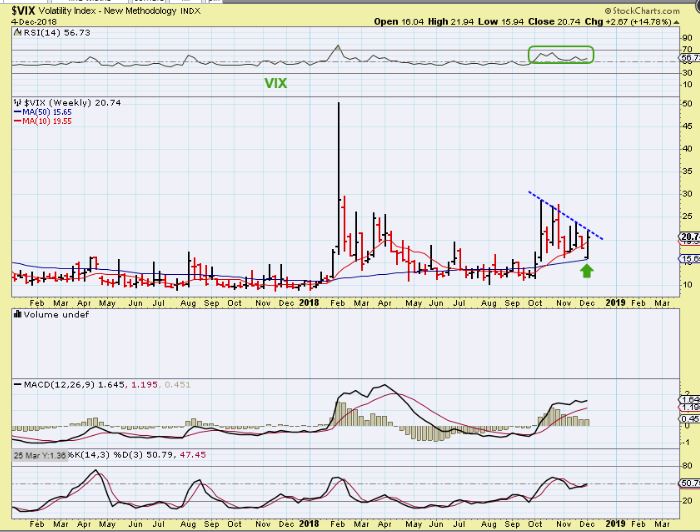
VIX – The break out by the Vix is bad for the Markets. Do you see where the Vix Peaked at the Feb ICL? We could see that again, if the Markets ICL is just ahead.
.
I HAD A PUBLIC UPDATE ON OIL WEDNESDAY-
THIS IS A PARTIAL TO GET US UP TO DATE
.
WTIC NOV 29th, we had a reversal or pause and it was late time-wise, so we stayed on alert for a break out
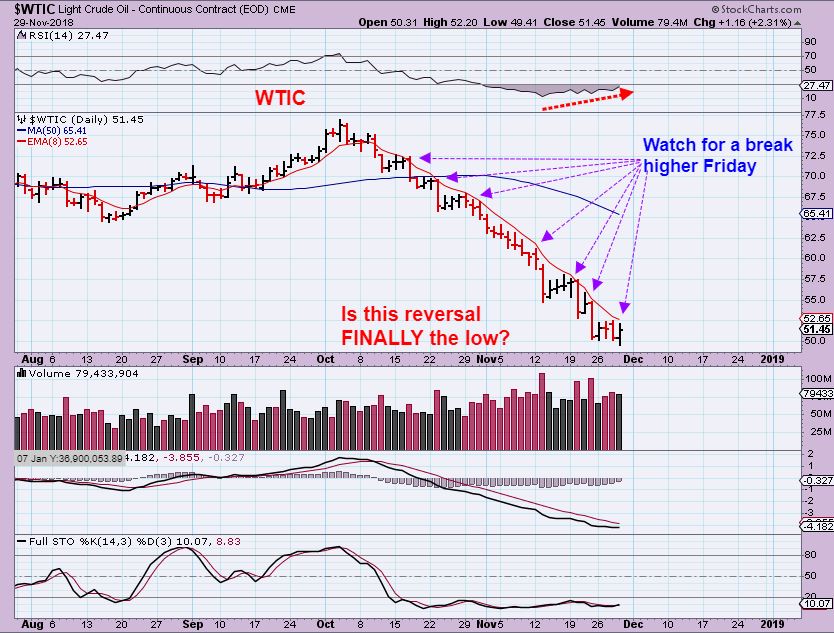
We finally had our break out, and this could be a signal to go long (with a stop) .

DEC 5th , Oil Traded Wednesday – So far , so good. We have a swing low and a back test so far.
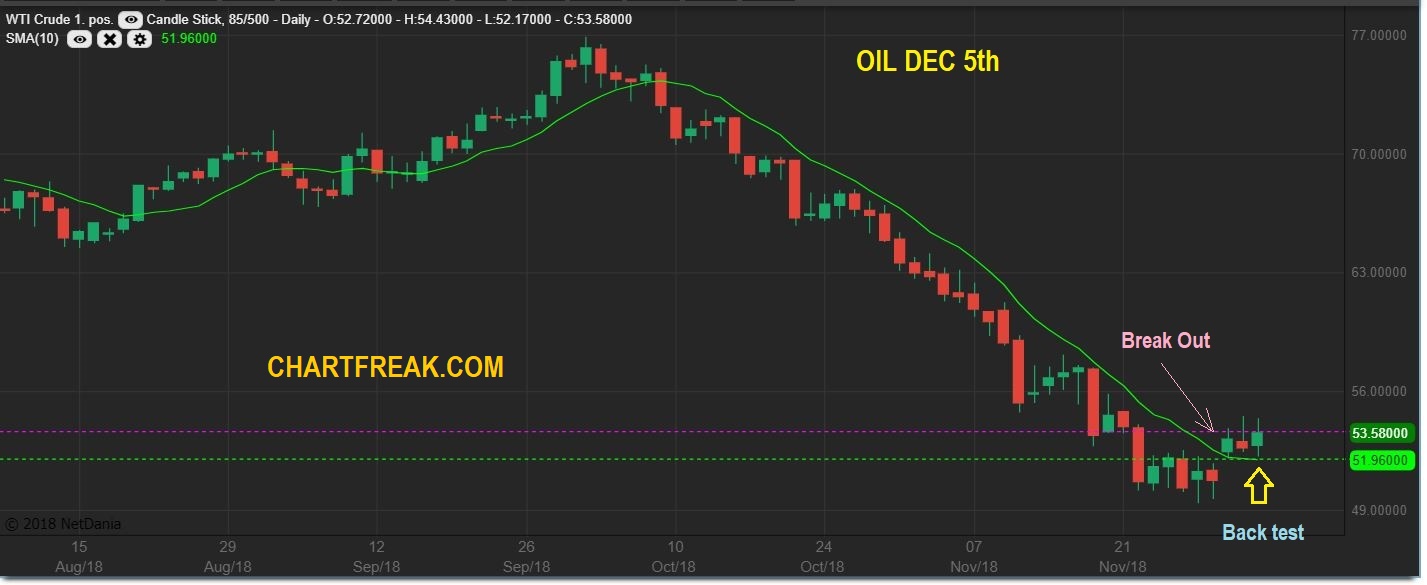
THIS WAS WHAT WE WAITED FOR. IT OFFERS A SAFER ENTRY, WHERE WE CAN PLACE A STOP AND AVOID GUESSING
,
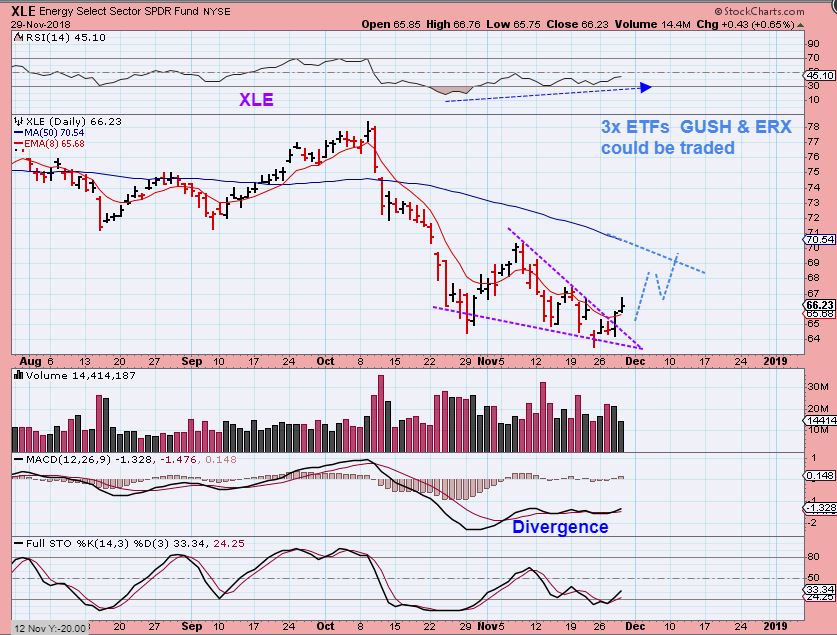
I also was monitoring the XLE with Oils sell off – YOU MAY RECALL THAT IT RESISTED OILS SELLING TOWARD THE END.
.
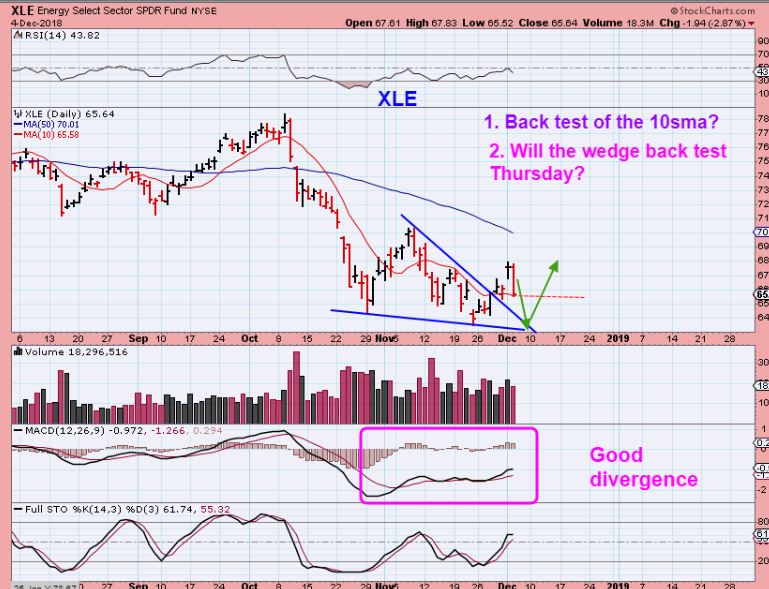
XLE NOV 29 – We saw a falling wedge and I would expect at least a run to back test the 50 sma, but possibly more if this is a yearly cycle low in Oil.
XLE POPPED on Dec 3rd , but …
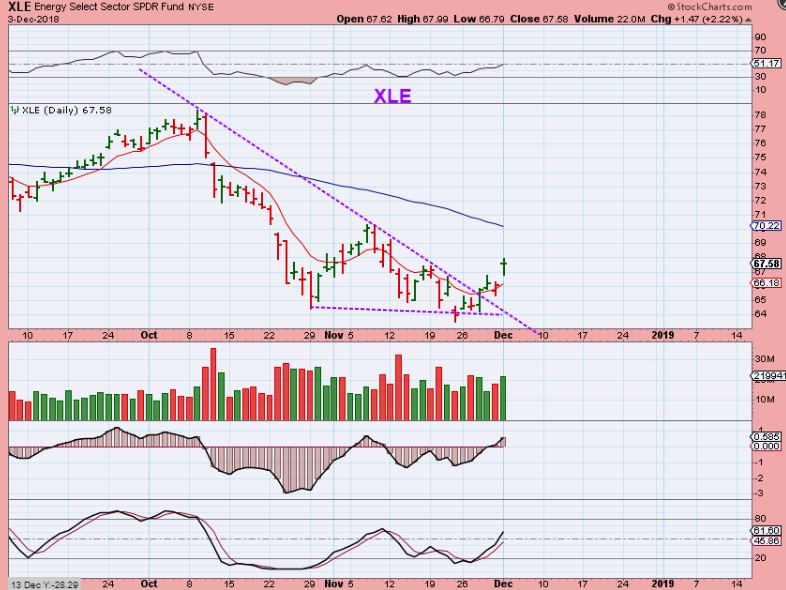
XLE #1 – It dropped with the Tuesday Market sell off. So far, we have a Gap Fill & Back test of the 10 sma. Will it turn Higher from here as shown Thursday? Or…
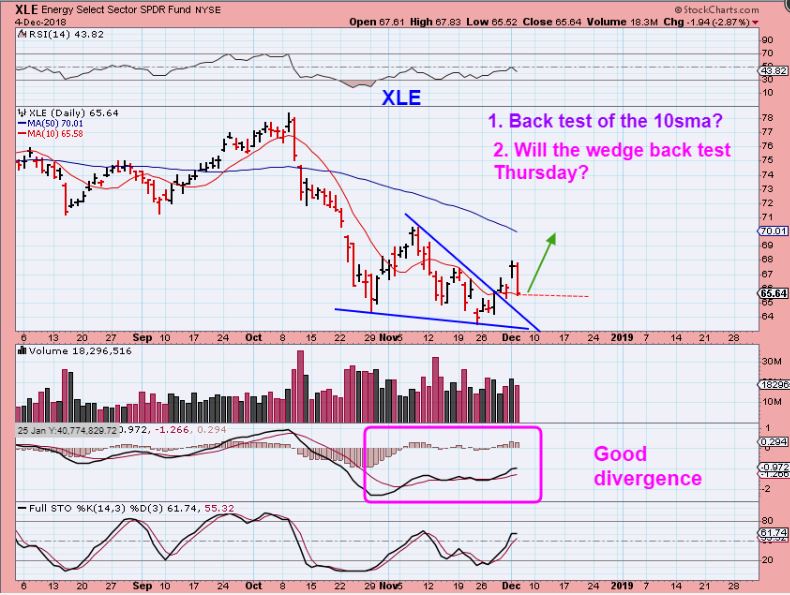
XLE #2 – It could Back test the wedge & then hopefully continue higher. A drop & reversal as shown would really offer a lower risk entry. A REVERSAL would be a buy, but not a break down that closes under recent lows.
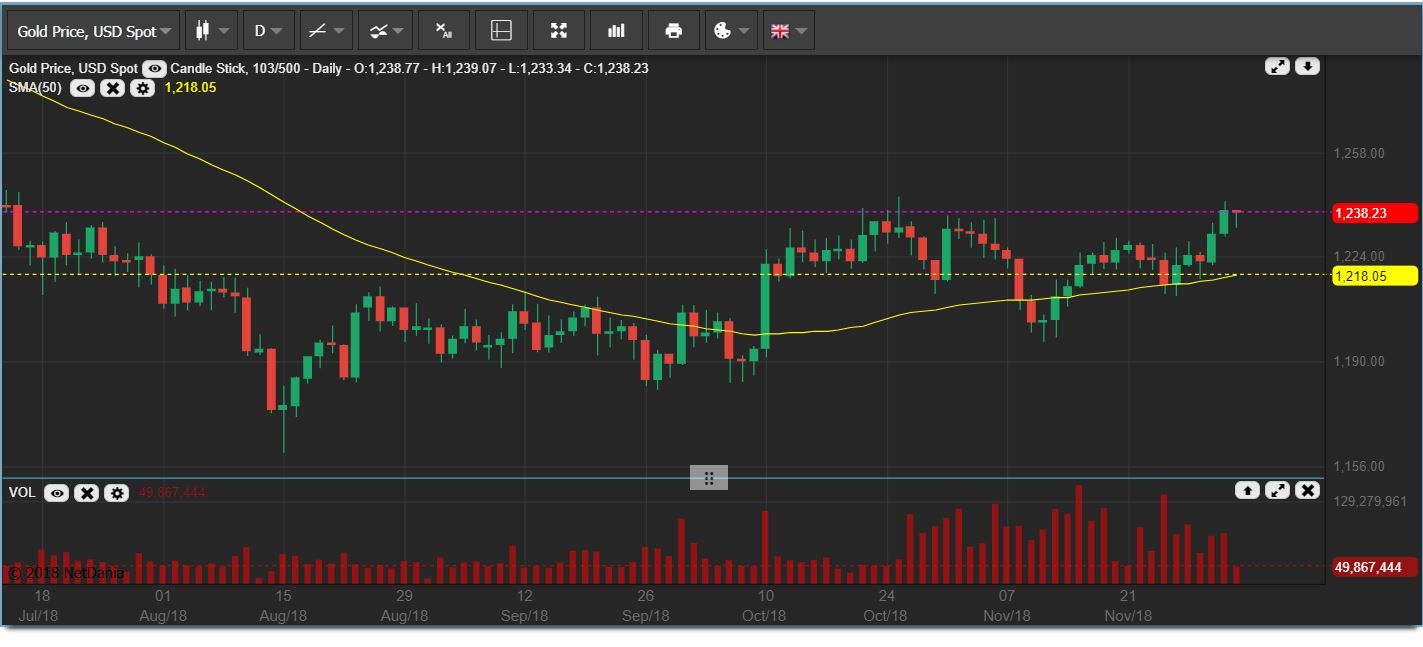
GOLD DEC 4 – Gold breaking above this peak would be new 3 month highs . Gold looks bullish, but Miners are lagging and that usually calls for a pull back. You can re-read the weekend report and Mondays report for more on Gold, Silver, and Miners, but for now as of Wednesday…
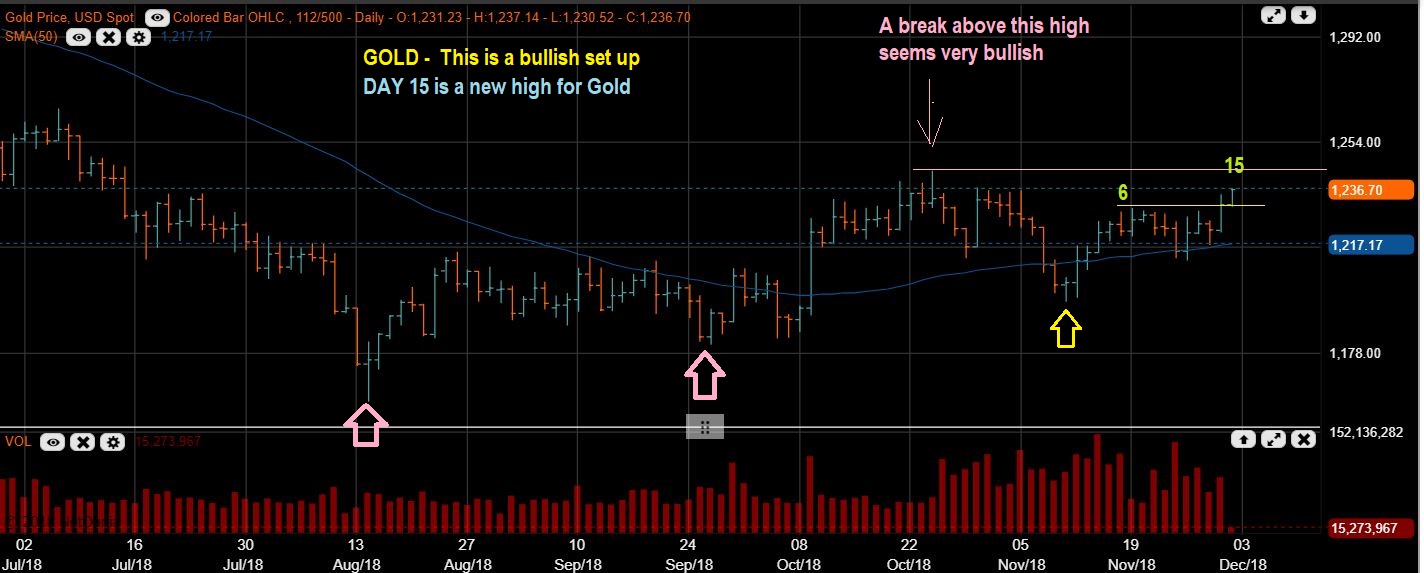
GOLD Dec 5th – Gold still did not break that ‘peak’. If it does, that really does seem Bullish for Gold, but Silver & the Miners are lagging. Not usually a good set up longer term, but I will discuss this further in the weekend report.
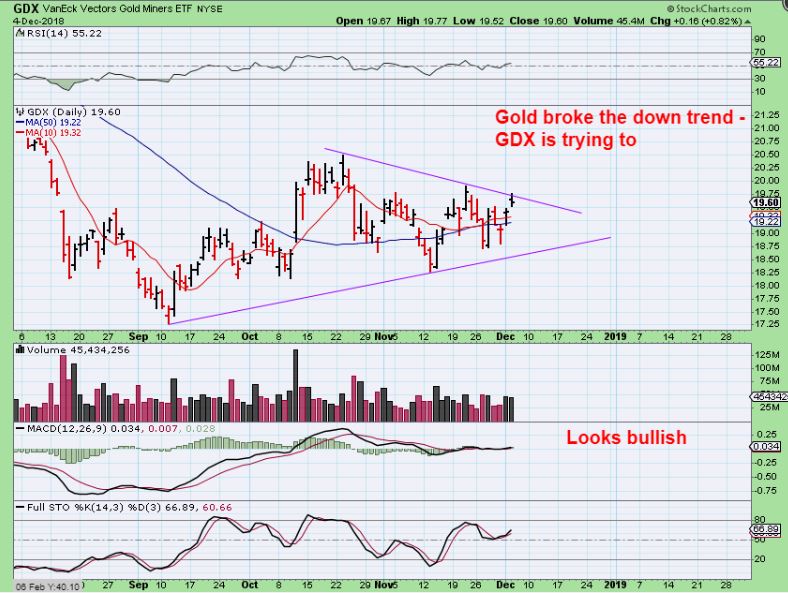
GDX – Miners are lagging Gold. The chart looks bullish currently, but They have work to do! As mentioned in my last report…
This is difficult choppy trade that keeps changing from Bullish to Bearish looking. I wrote this Monday…
.
GDX – It drops below the 50 sma and looks like a bearish break down, then Pops above the 50 sma and looks bullish, then that pattern repeats. This has been whipsaw, but we can look for & hope that a change takes place. MINERS NEED TO CATCH UP TO GOLDS BULLISHNESS and stop Popping & Dropping. GDX is on day 13 and the Peak is day 6. If this doesn’t push higher soon, it is in danger of a double bottom drop ( or worse).

We’ll just have to wait and see how Thursday treats the various sector of the market. After a few nice bullish looking Pops within the past several days, Tuesday was a slam down that made the Powell Fed Meeting POP and the G20 Pop seem nonexistent. As mentioned repeatedly in recent reports : These are choppy markets, so if you are trading, it is best to keep position size small until things settle down, and always use & honor your stops.
Lets see what Thursday brings our way!
.
~ALEX
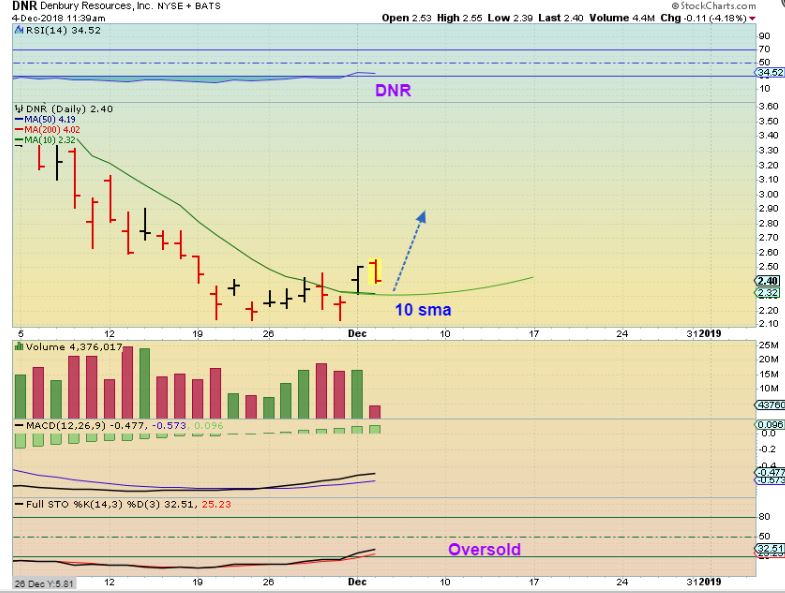
I mentioned that I bought DNR and NOG as energy trades last week. They popped 10%, but on Tuesday it was given back. I am still invested, but 2 charts show my feelings about the trades. If Oil rises, I think that these Oil & Energy stocks should continue higher. This could be a normal back test, however…
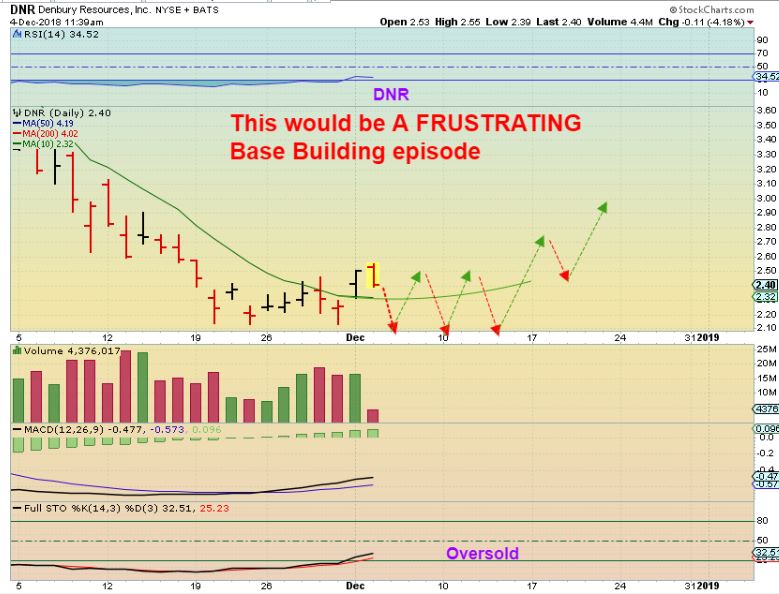
However… I did mention that at times these set ups do not just ‘V-Bottom’ & run higher, but they can ‘base out’ 🙁 That may look like this, and it would just be more choppiness and frustration, so if this just starts basing up & down with choppiness? I will sell the next pop and Move on to better trades.
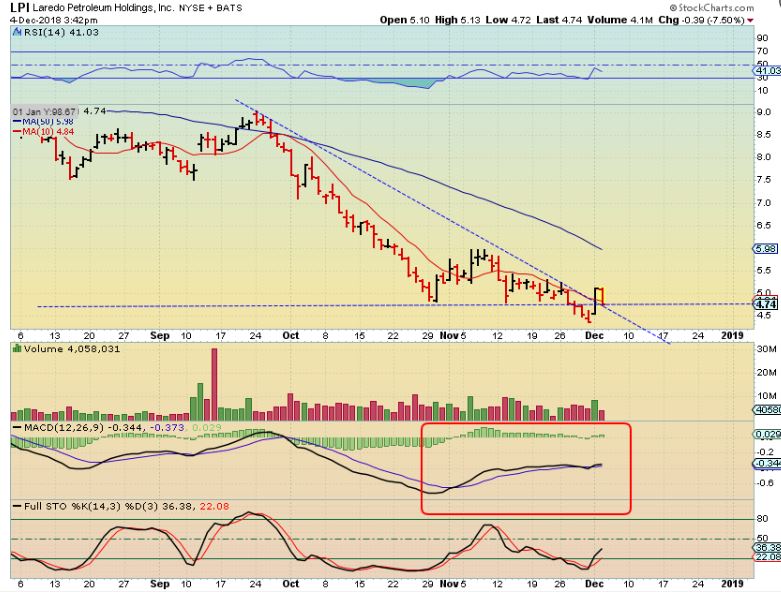
LPI popped 17% Monday and I mentioned that I would like to buy a pull back. Well, it dropped and back tested the trend line Tuesday, but I didn’t buy. Why? Because it dropped during the market slam down and I don’t know if I can trust it yet. Will it sell off if the markets do? Will it rise if Oil does? So now I want to look for a reversal and see if it can resist the selling. Bullish signs include the first 17% pop, the MACD has bullish divergence, and it is still quite oversold. WE NEED A REVERSAL HIGHER.
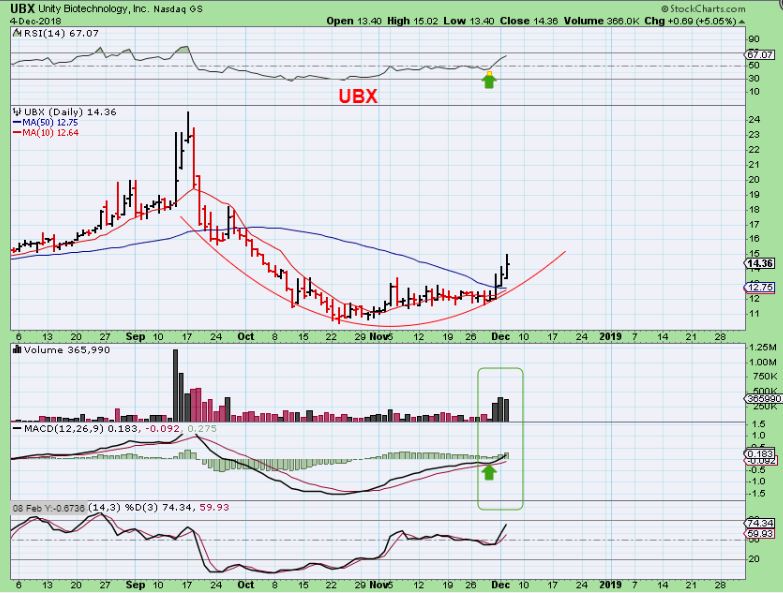
Trades that didn’t fall apart Tuesday would be the Biotech / Pharma Stocks mentioned.
.
For example:
I said that I bought UBX near the 50sma, and it continued higher.
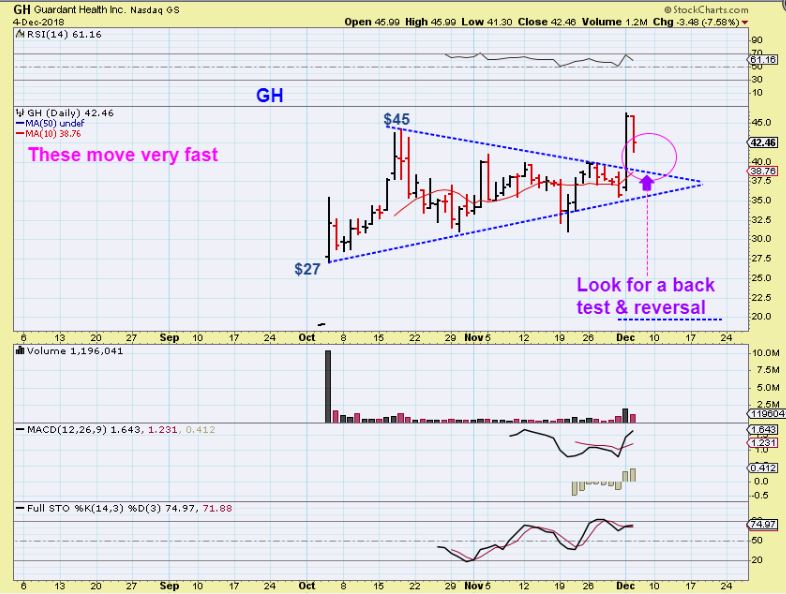
GH – You may recall that I missed catching this one. I was watching it as it broke out and ran from $40 to $46 Monday alone. Well it did pull back and it still looks acceptable, but I’d like to see a back test & reversal next. The only problem now is that it may consolidate sideways for a bit too, if the buyers take a break. I did have about a $50 target for the next run though.
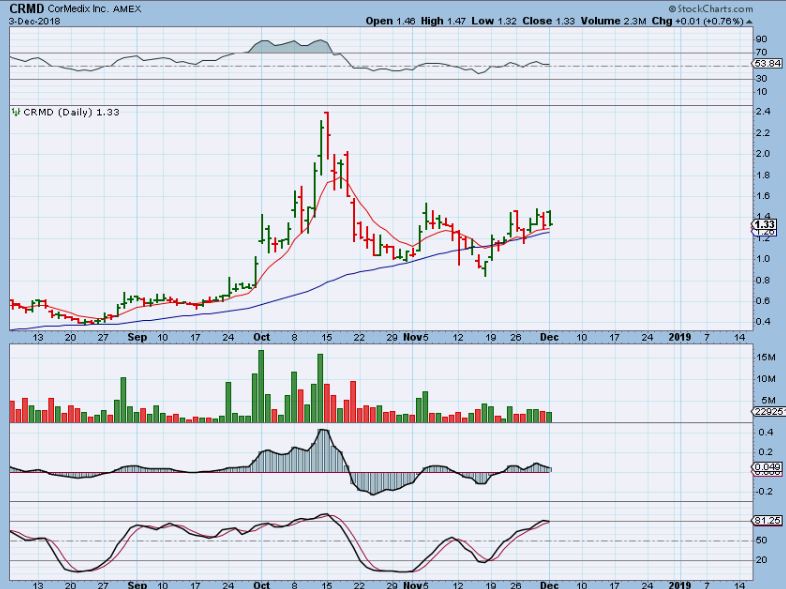
CRMD – This gapped open and dropped Tuesday, but with the Market Crash, it still held above the 50 sma. It remains a good set up above the 50sma so far.
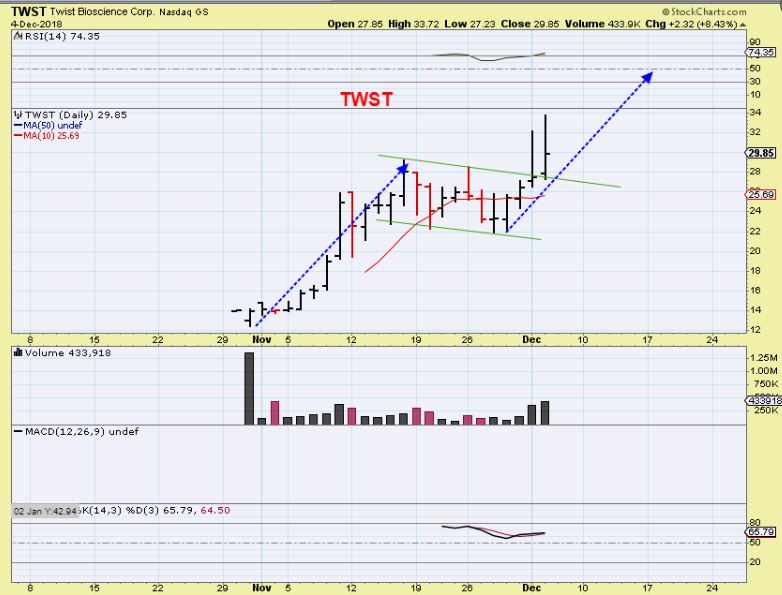
TWST – Continued Higher and I think it still has further to run if the 2nd leg higher is equal to the first leg.