Wednesday November 28th
Note: I am going to discuss a couple of Trade Ideas through out the report, HOWEVER, know that lately the trade set ups are choppy and some really good set ups have failed to follow through. That means that these are not for everyone. The choppiness has been frustrating to trade & will continue to be that way until the markets calm down a bit. CASH is a safer position, or Use tighter stops and smaller position size for protection.
.
So the markets remain choppy short term, and they are very difficult to trade under those conditions until they set up properly. They may offer a few shorter quick trades here and there for those so inclined, and they also may be setting up for a ‘shorting’ opportunity down the road…
.
SPX– Day 18 seems too short to be a dcl, so this looks to be day 20, ready to bounce with MACD divergence. This can be traded SHORT TERM for a fast scalp with a tight stop. It may only do as drawn here, similar to the early Nov run, before dipping to a lower low.
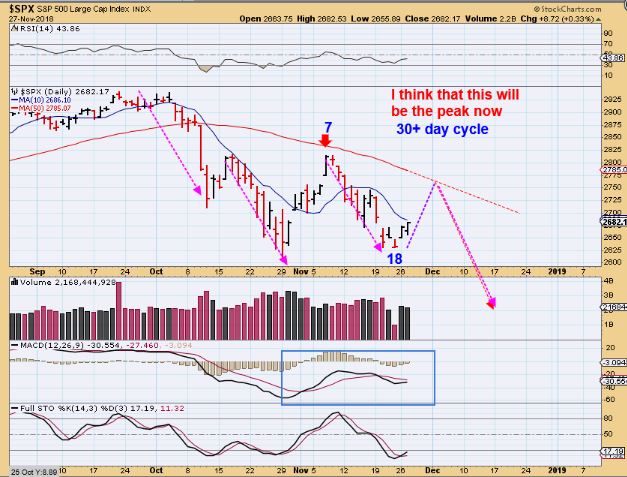
In the next weekend report, I am going to show more of why I feel that the General Markets have topped. As they drop over time ( 2019) , I think that the precious metals sector could benefit. The bounce here and timing for an ICL means that it will continue topping for a bit in the first couple of daily cycles, and Miners will continue bottoming for a while longer into the next ICL.
.
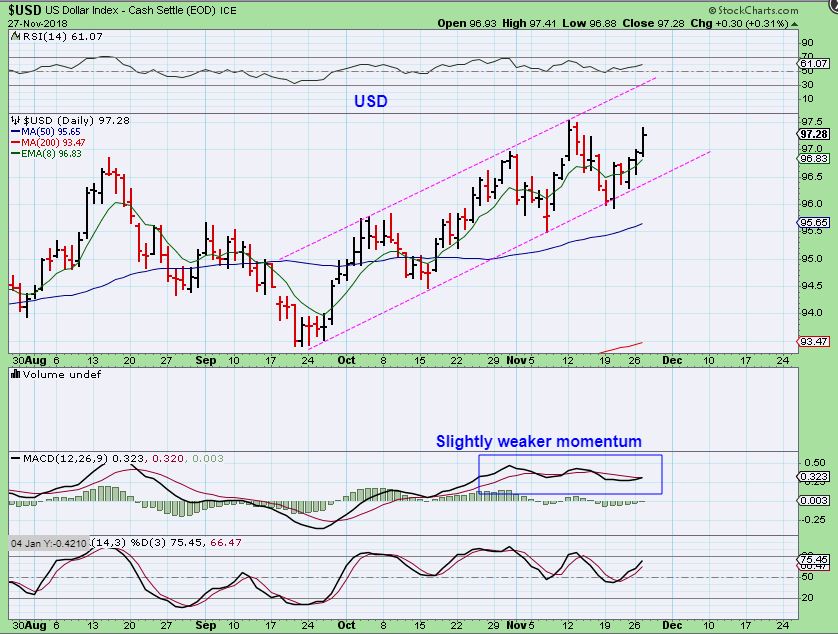
USD – The USD continued its climb higher and this time Gold broke down.
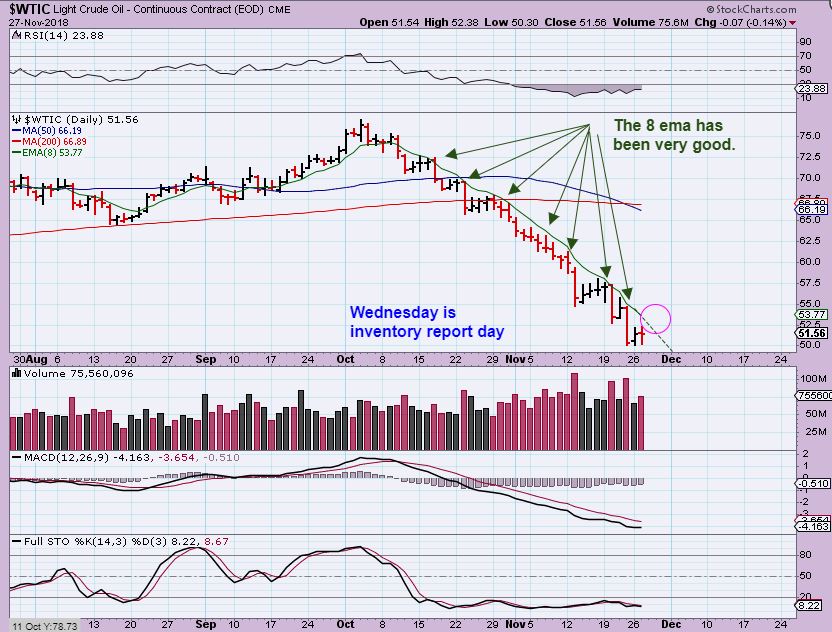
WTIC – Look how the 8 ema has capped Oil perfectly. A break above the 8 ema could be considered a low risk entry with a stop under recent lows, but Oil has been weak and struggling…is this the trade for you or not ? I do expect a run to the moving averages, but the risk is a choppy sideways base for weeks.
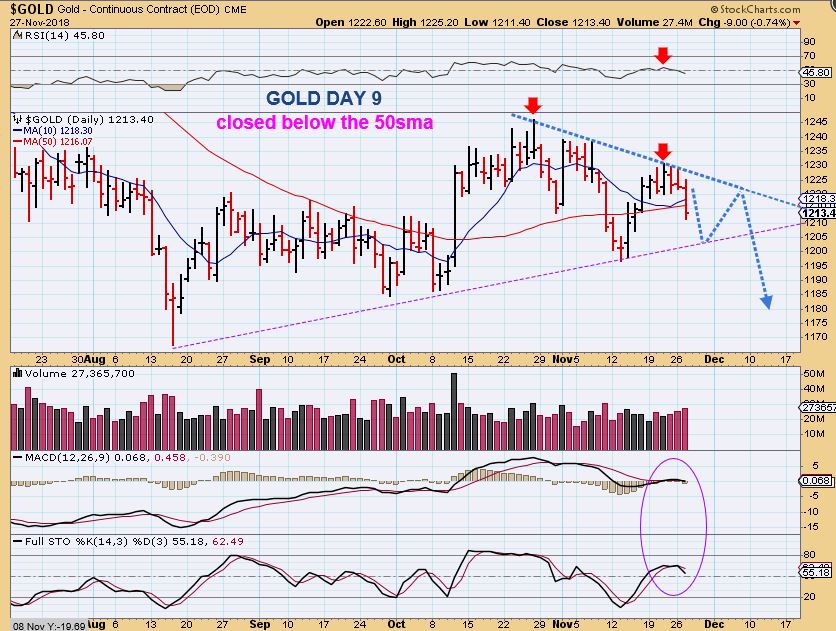
GOLD – Gold broke below the 50 sma AND CLOSED there. Honestly, look at Gold, has anything changed? Not really, because this has been a sideways choppy move for the last 3 months, and it violated the 50 sma 2 weeks ago too. HOWEVER, this is usually a dire warning in the 3rd daily cycle- So this should be considered bad, and in danger of selling off. It can’t just be ignored, though it can bounce…What about the Miners?
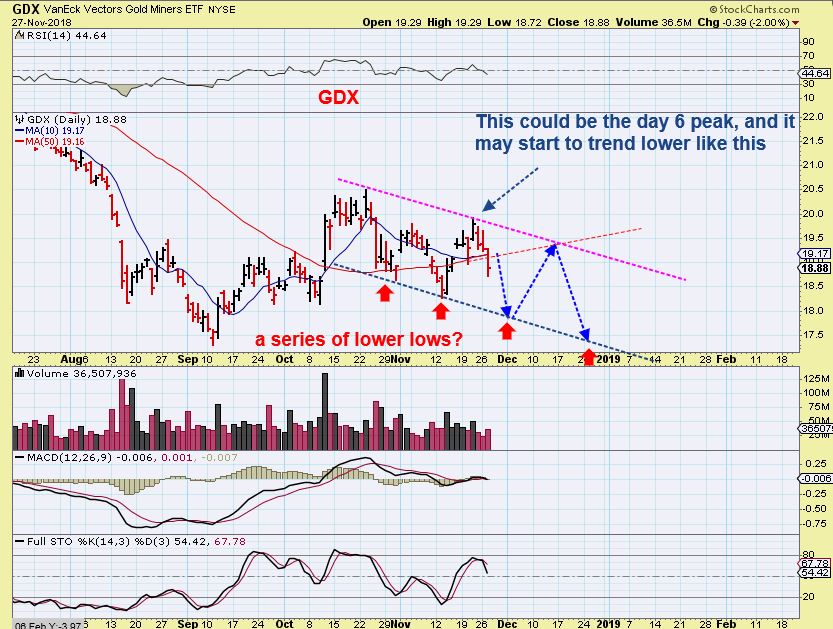
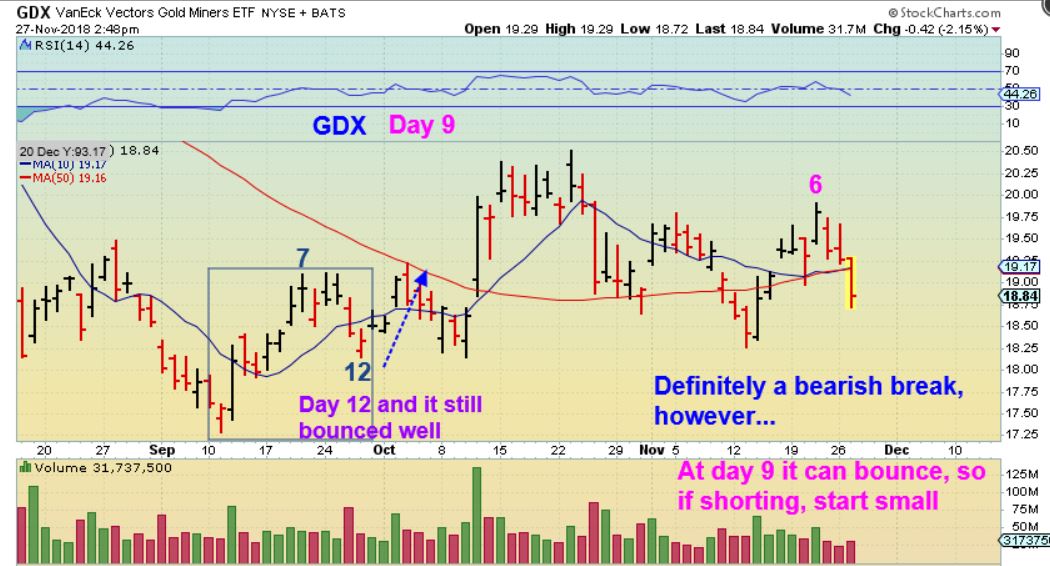
GDX #1 – The 50 sma had curled upward and price was above it. Now we see GDX closing well below our nice 50 sma set up, and I have to view this as bearish longer term. Can it bounce? Yes, of course, but I have to view this as bearish. This would be that choppy complex base similar to 2015 that I have discussed. See this chart and let me explain…
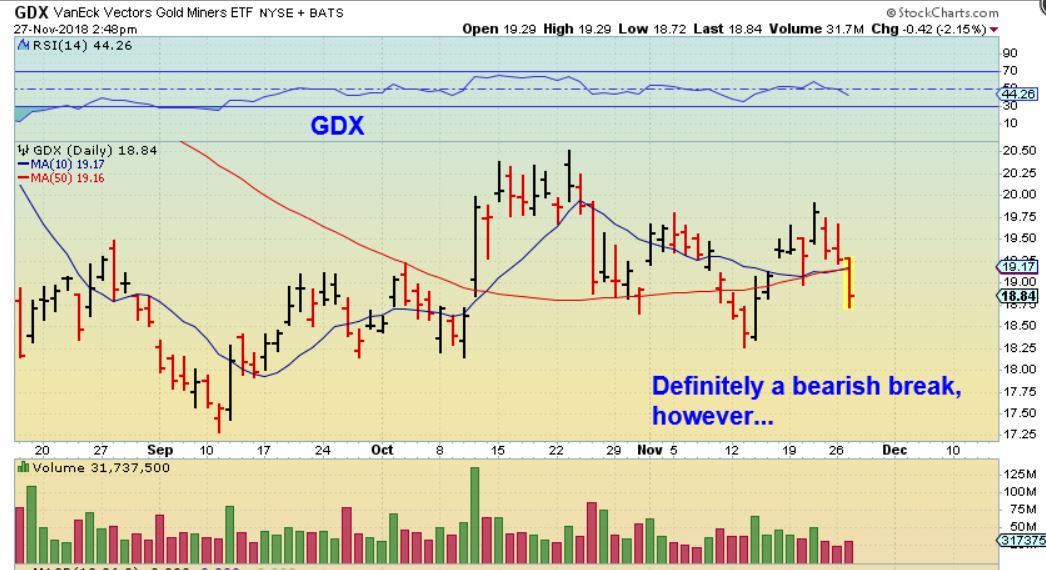
GDX #2 – This is the Bearish break below the 50sma…
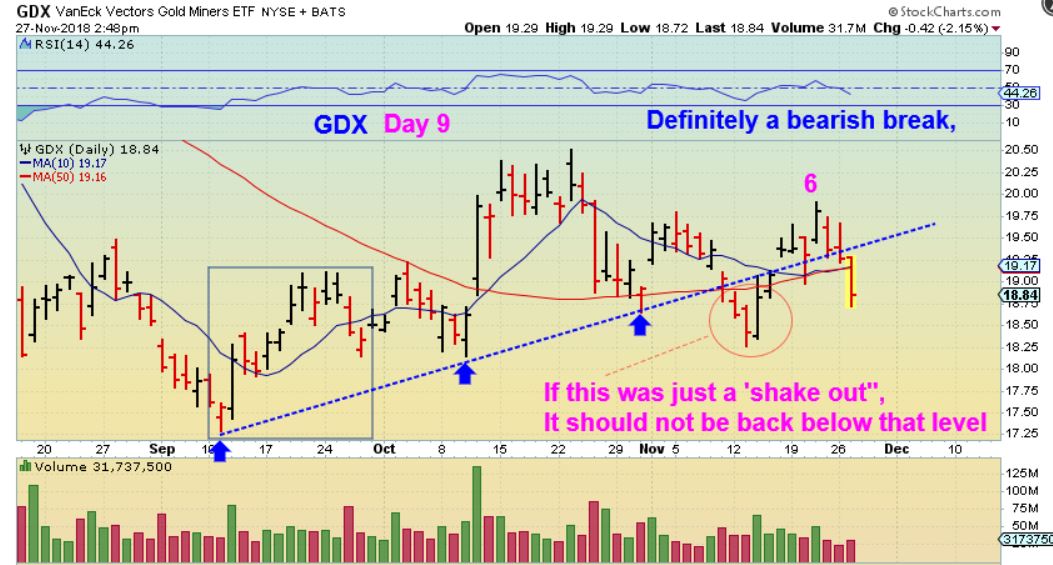
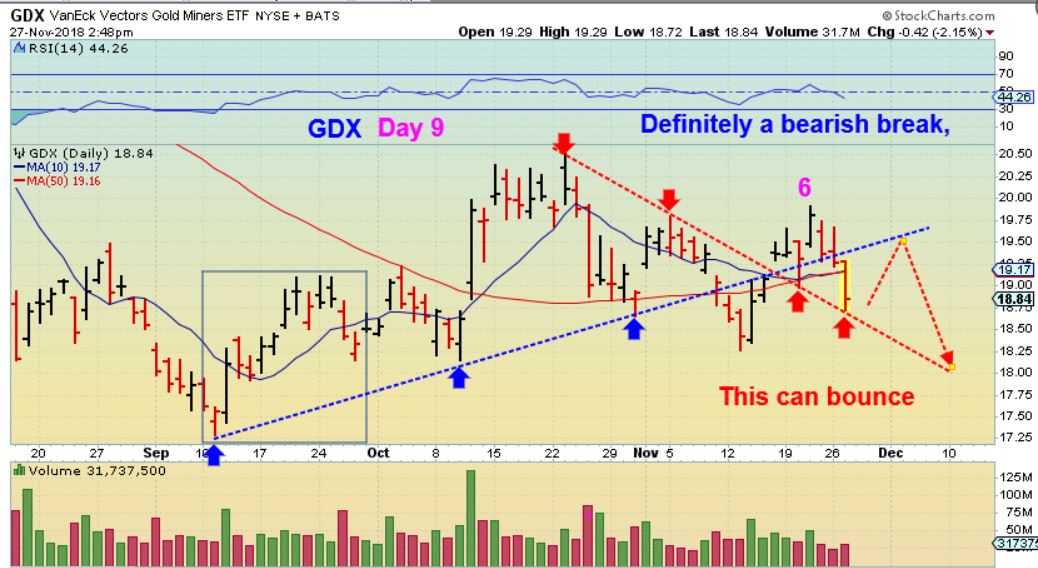
GDX #3 – It did break the 50sma 2 weeks ago too, and I said that that could have been a ‘shake out’ after it recovered. The problem is that ‘Shake outs’ usually do not break down a 2nd time. I would say that the bullish uptrend line & 50sma are being violated too often.
GDX #4 – In the first daily cycle, we had a day 12 drop (blue box), & bounced, then it even had another day 19,20, & 21 drop before it recovered, but that was earlier in this intermediate cycle. This day 6 peak may become the peak of this daily cycle, and this daily cycle will be Left Translated. Note: It is not possible to tell if this will bounce or not, so it is difficult to short this early in a daily cycle.
GDX #5 – Notice that GDX did land on that trend line that I drew after last weeks intra-day drop, So even if it bounces off of this trend line, I think the upside is limited, and this may even be short-able with JDST or DUST at the upper resistance.
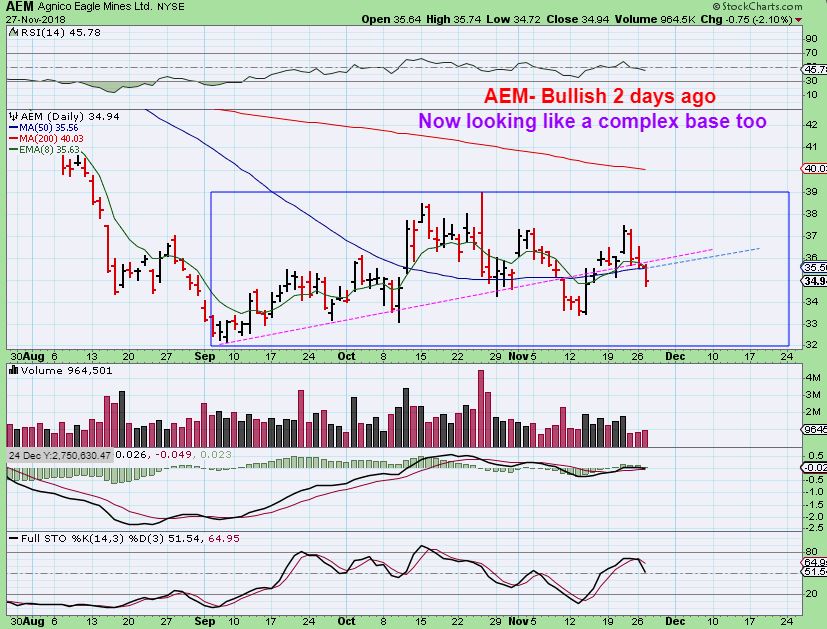
AEM– Some of the ‘Leaders’ may hold up better heading into the next ICL (lows), so I will keep an eye on many things going forward, but other Miners have broken to new lows already. Those leaders, like AEM, also broke to the downside & raise the caution flags.
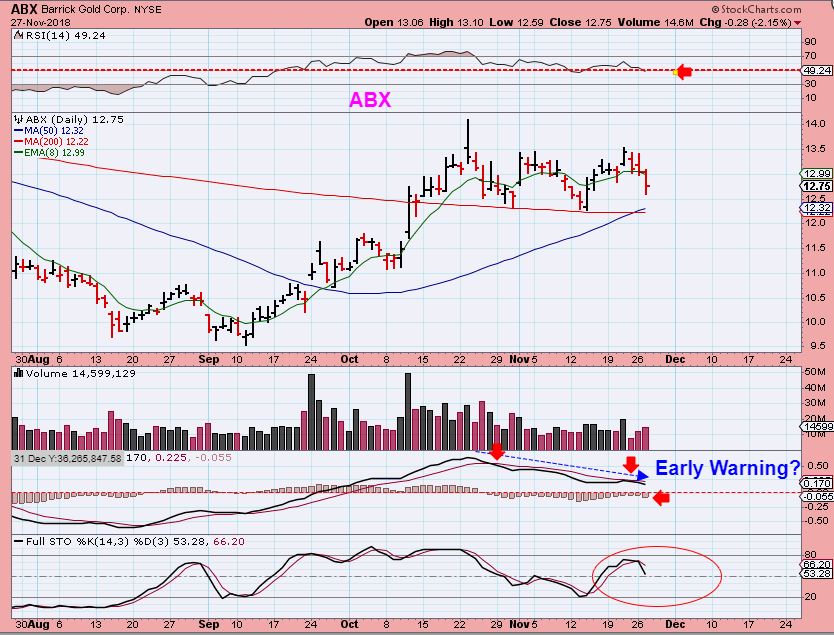
ABX – This is one of the best looking Miners, it even had a bullish cross over higher of the 50sma & 200sma, but it shows signs of possible weakness now too. It may NOT break the lows at the next ICL, so I will continue to look for the stronger Miners going forward, but again, we are seeing early warning signs of this sector dipping down into an ICL, and possibly forming a complex base like 2015.
.
So I am going to discuss DUST briefly below for the future trades and also 2 other trades. I am still very bullish long term big picture in the precious metals, and I think that the General Markets may be heading to a recession as Miners make a bull run, but it seems that the markets will top for a bit longer and Miners will bottom & base out for a bit longer. Some Miners may continue to lead the way and even remain above recent lows, but others are finding new lows. THAT is a mixed picture. The next ICL may be THE Longer term bottom. I just can’t ignore the break & close below the 50sma for a 2nd time here, so now I am less bullish for the near future. I will continue to cover these markets as we go forward, and we will alert to all of the possibilities, especially the future trade set ups when things calm down.
.
~ALEX
.
Follow up
.
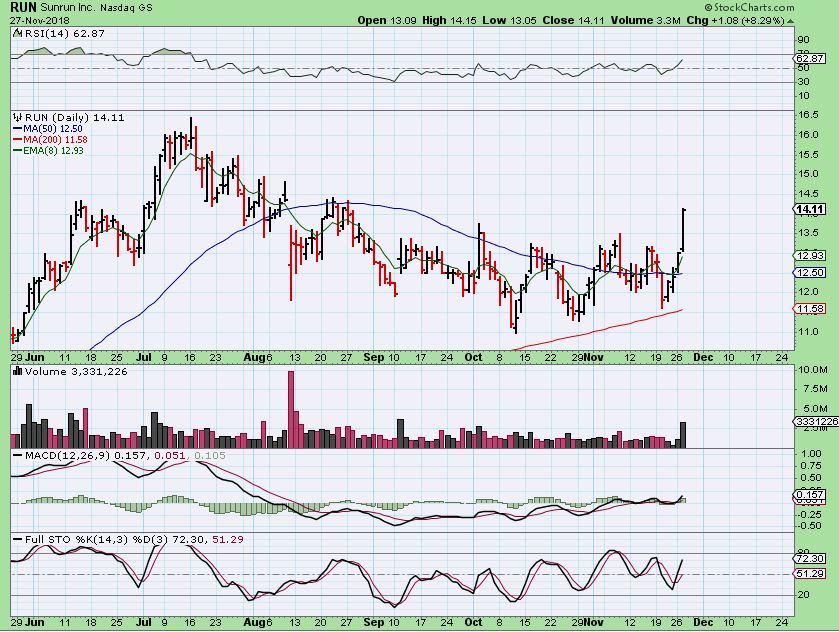
RUN – Yesterdays Buy, solars were running strong ( See VSLR, SPWR, etc). break out can run to July highs or better. Look at the run in early 2018, $5 to $16.
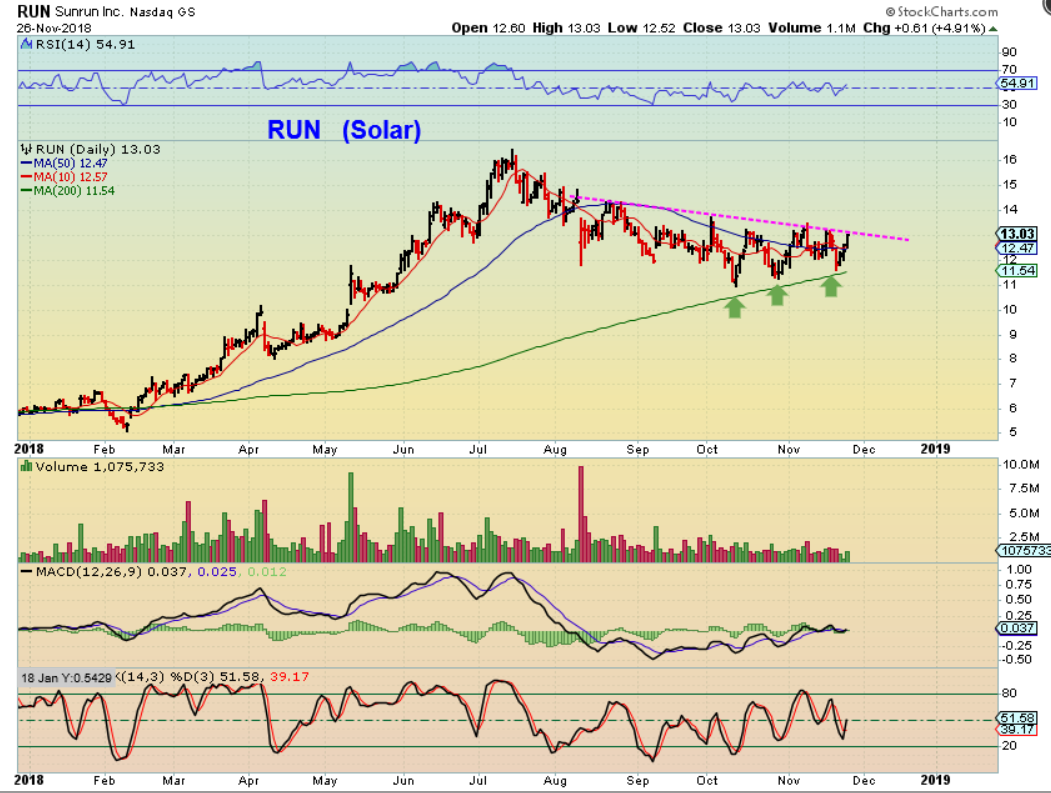
RUN – I posted this in the comments after the first hour of trading, it broke out & was a buy.
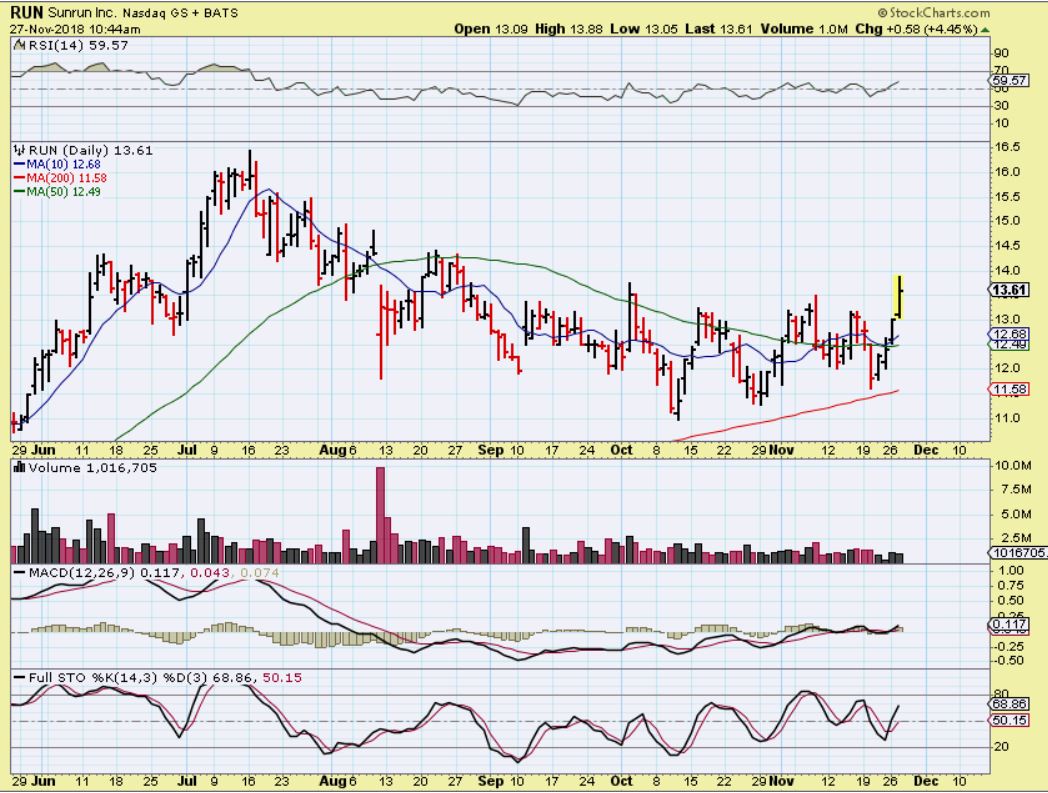
RUN – It closed up over $1 higher, and I expect it to run to the July highs. If it bull flags or dips for a few days, you may get a place to add to position.
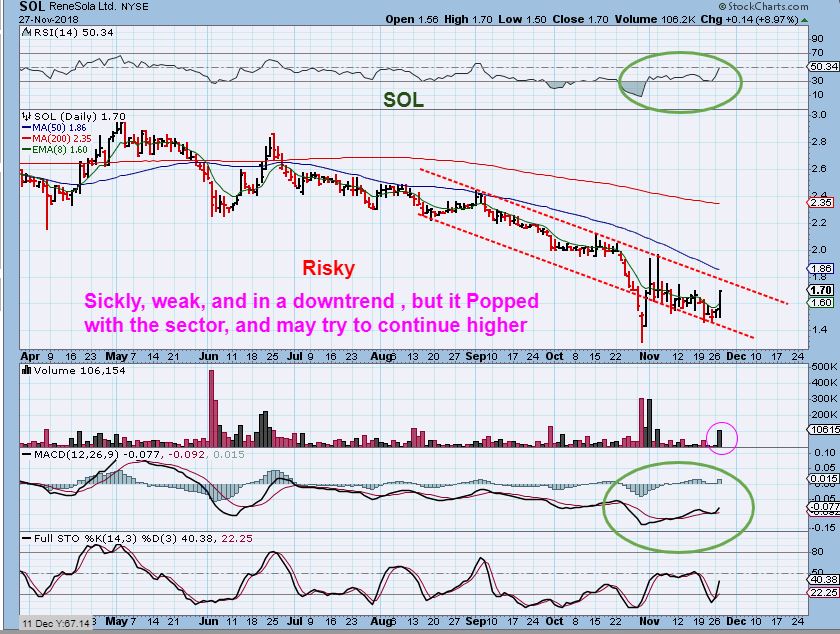
SOL – This has been very weak, but it did POP in a sector that has been running well, so I jumped in to see if it can get above the 50sma. It may remain weak and I will cut it loose if it does.
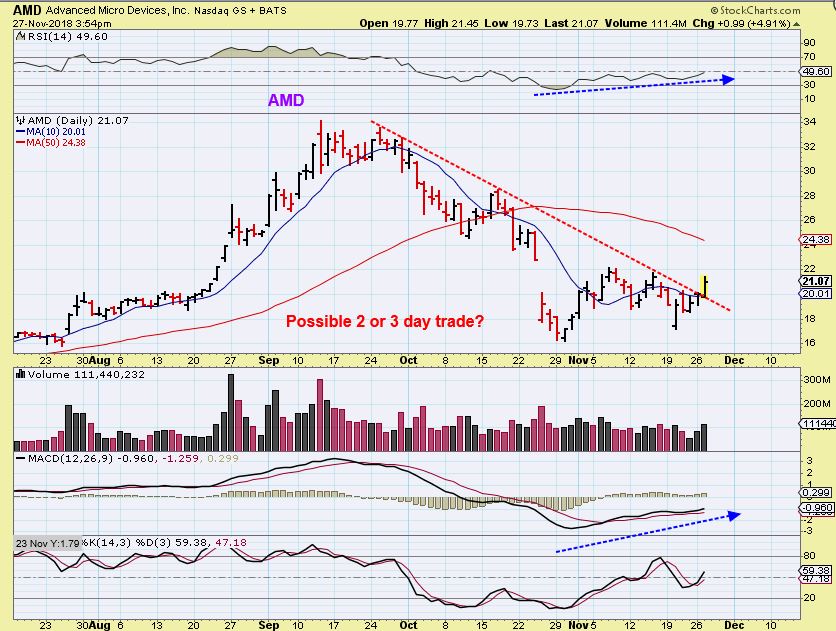
AMD – Even though this popped from $16 to $22 in the past 2 weeks, notice how it has been choppy and honestly not easy to ‘buy & hold’. It did break the down trend yesterday though, and I almost bought it. If the markets are going to bounce further, and I think they are, I also think that AMD looks good to break higher here from this mini base.
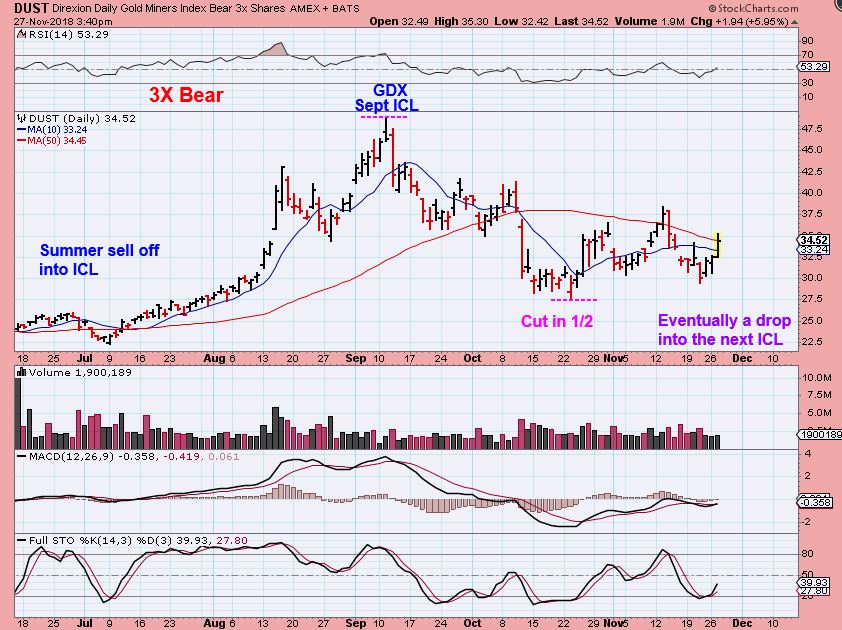
WHAT ABOUT DUST? It may be a bot early to buy & Hold DUST, but this does look like a bullish chart.
.
DUST #1 – LOOK AT THIS CHART: Some have said, “We should have shorted Miners’. That is not true, it has been just as choppy & difficult. To be honest, going short Miners has not worked for months. Sideways moves means that Longs & Shorts are frustrated, but when the cycle is due for a DCL or ICL, then it can trend and may be a good trade.
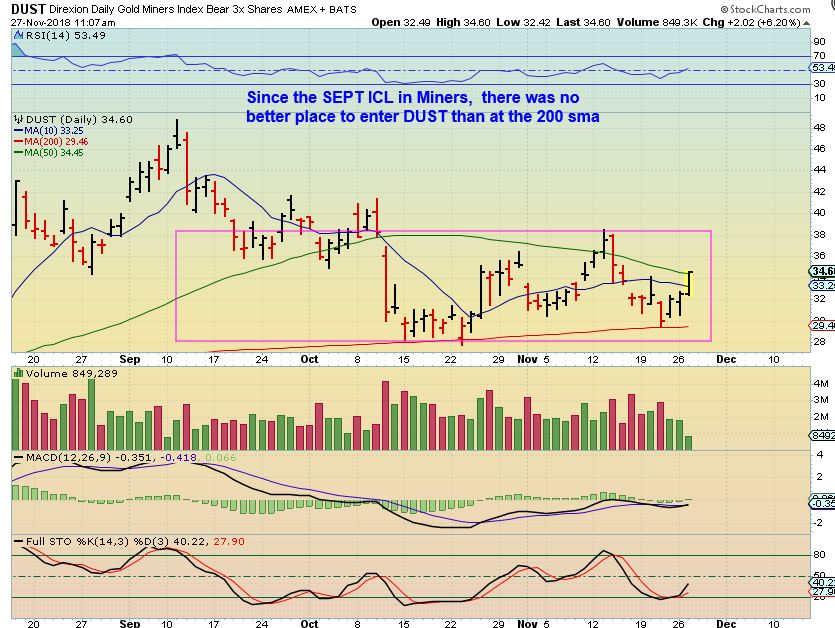
DUST #2 – We had a big summer sell off in Miners, into the ICL. When the drop into that ICL came for Miners into GDX September lows, DUST ran very well. Notice that since September, DUST Actually got cut in half 1 month after that September ICL for miners, so it is tough to just ‘short’ Miners and hang on. Price may now move higher out of this base, when Miners are ready to drop.