Friday November 16th
Just a reminder : Today is the last trading day of the week, and next week will be a holiday shortened trading week in the U.S., so let’s see where the markets stand and enjoy our Friday of trading!
,
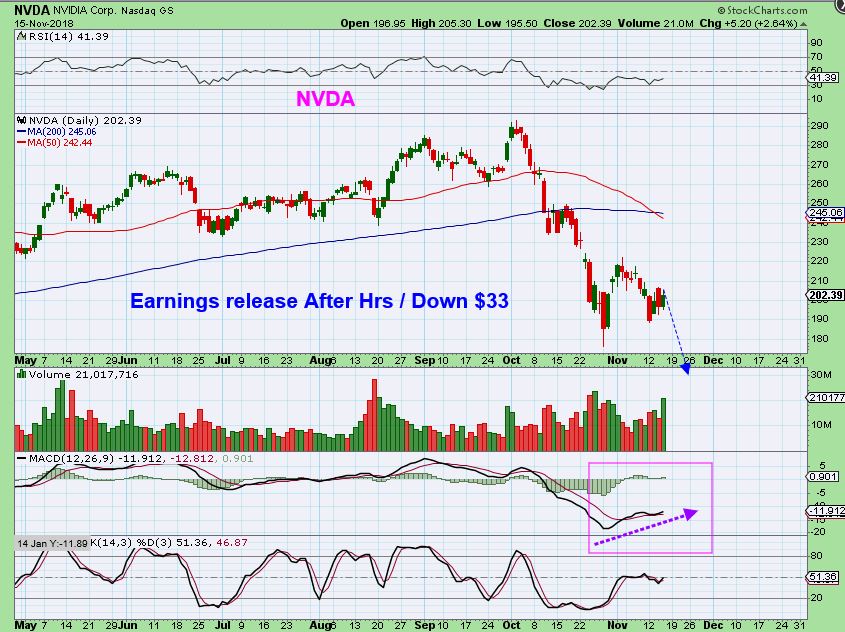
Note: we’ll see how ‘earnings’ affect the markets going forward, but NVDA released earnings after the bell, and got crushed, down over $33 or 16%. We will discuss that with the NASDAQ too.
.
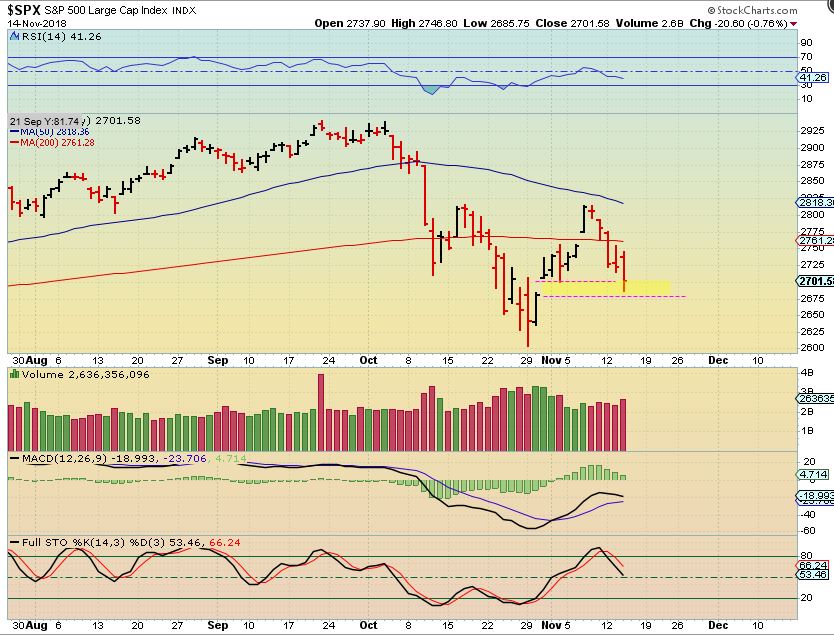
SPX – Wednesday we had a gap fill and a bounce into the close. We need a bigger sign of strength than that, so we’d see if Thursdays trading could show some strength…
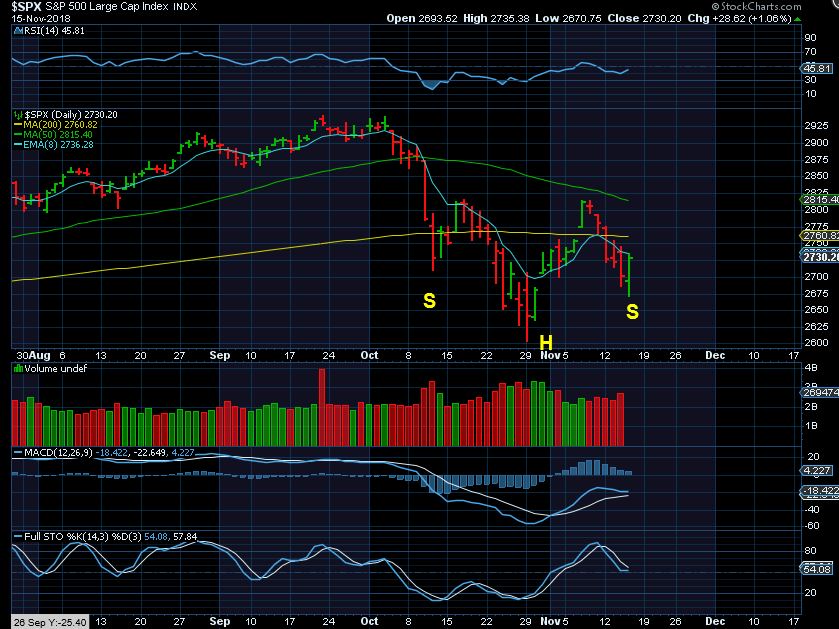
SPX – Markets sold off to a new low on Thursday morning, and then put in a nice reversal. It overtook more than 1/2 of the prior days candle, so you could add to positions on a day like that, with a tight stop at the lows. Our inverse H&S remains in tact, let’s see if this can power higher.
This is another LONG report, I hope I’m not burning you guys and gals out? 🙂 We have a holiday week ahead, so I’ll rest up then…
.
QQQ – A Strong reversal here too, after being at new lows that morning.
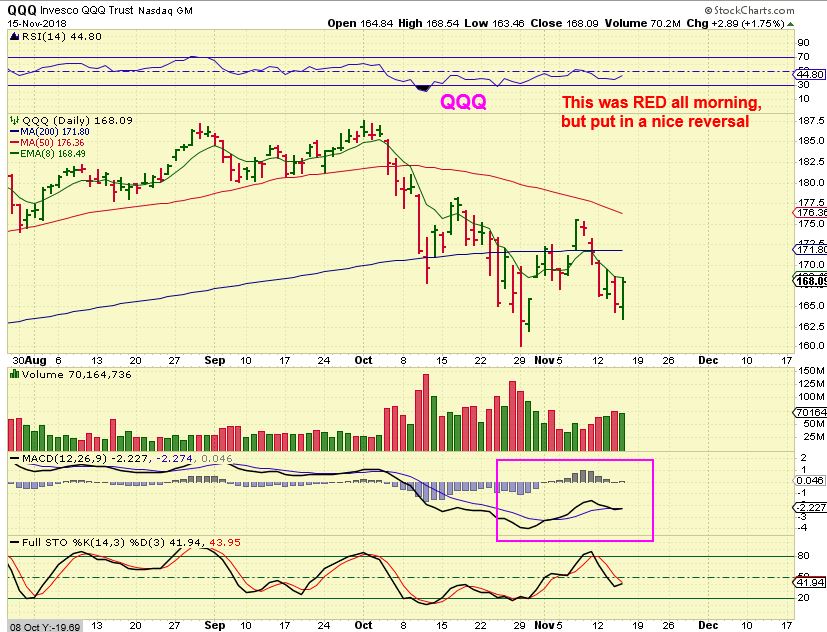
FRIENDLY REMINDER: WATCH EARNINGS! So look at the chart of NVDA. Also a double bottom with MACD divergence, but they released earnings and are down $33 in pre-market. SO WATCH EARNINGS ON TECH, MJ STOCKS, MINERS, ETC. 🙂 We’ll see if this ‘spooks’ the Nasdaq Friday.
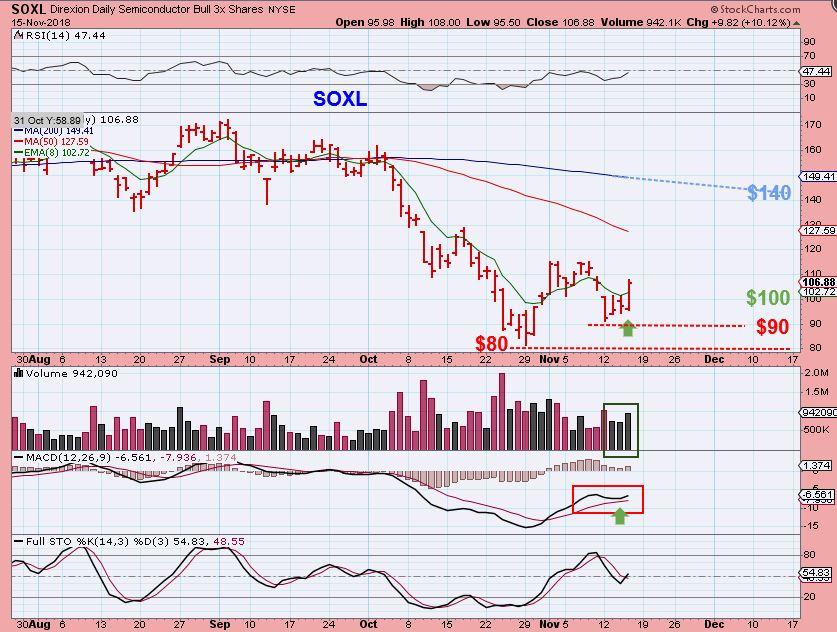
SOXL – When the markets move higher, often SEMICONDUCTORS move quickly, so I wanted to look at the Semi’s. This has already moved $80 to $115 off of the lows, and on this pull back & reversal, I actually think that it could rather quickly run to the $140 area, if things get going. It is a 3x ETF.
I have stated that I think that the General Markets could top and drop or go sideways in 2019, but they could still do a nice bounce into the end of the year for the first 2 daily cycles if the ICL is in place. So with that thought in mind-
.
Let’s look at some tech & semiconductor stocks too.
.
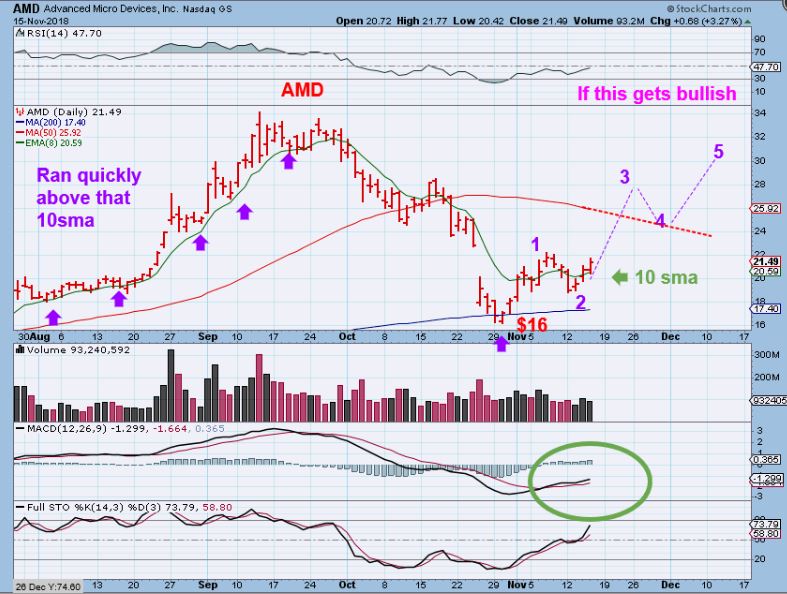
AMD – AMD ran quickly in August & September, and if the market remain healthy into the end of the year, we could see this. If things stay weak, the moving averages may stall things as they move higher. This would be a ‘double top’ into the year end before a drop.
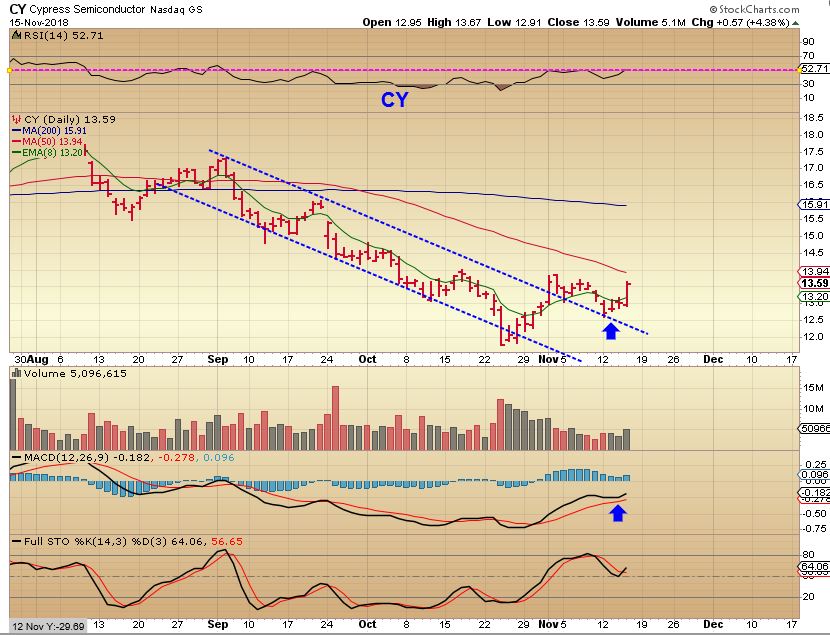
CY – This also has a break out & back test. This also has a possible 1 & 2 of a 1-2-3-4-5 type move.
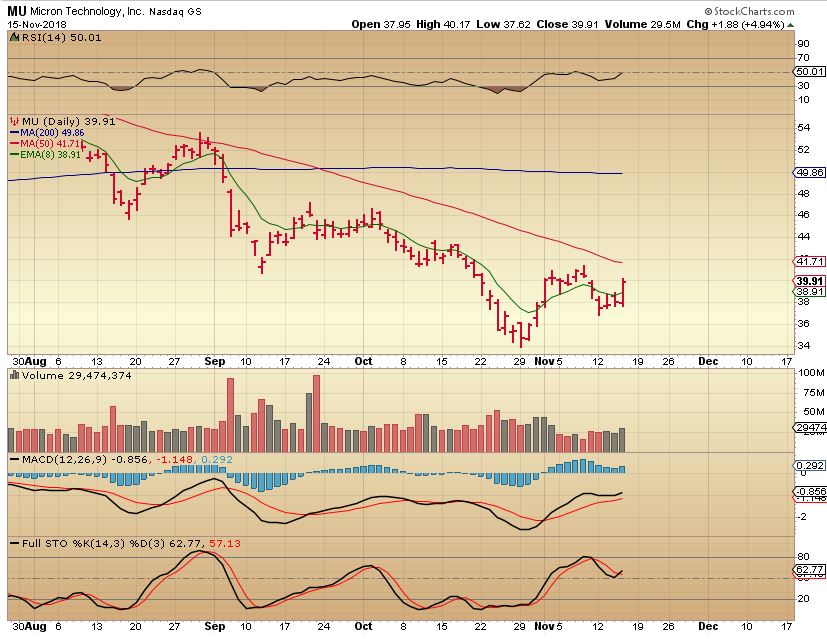
MU – Similar set up here too, we’ll see if it can break resistance. This was once a very strong stock. Do you remember when the analysts were saying it will go to $100? Now look at the angle on that 50 sma as it dropped to $34. It could bounce to back test the 200 sma.
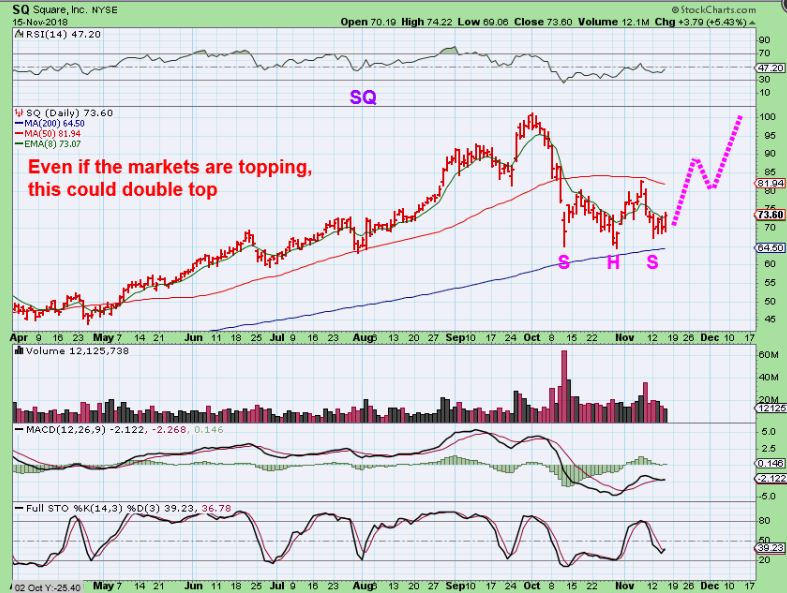
And look for some of the recent high performers too, like SQ, SAIL, etc. They may run strong again, and form a double top or false break out to new highs before things roll over ( if they roll over).
.
SQ – So even if they do double top, this would be a great run, right? You can enter with a stop under the 200 sma now, for example, and if it breaks out above the 50 sma, raise the stop under the 50 sma after it gets above that.
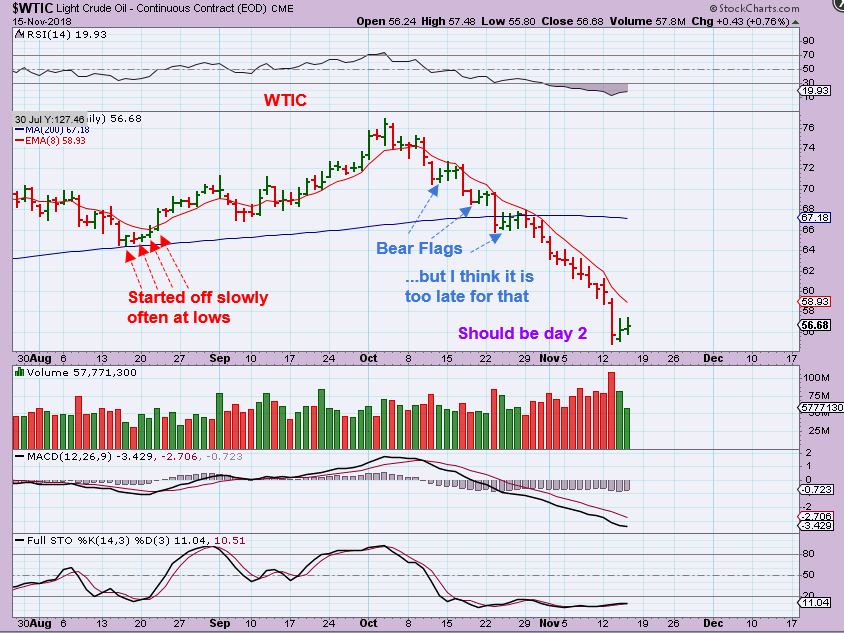
WTIC – Past reports discussed the Cycle count. I looked back at OIL, and often it puts in small days at the lows, so I added to my Long position, thinking that this time it will not be a bear flag. See the chart. If we get to the 8 ema, I will sell a portion.
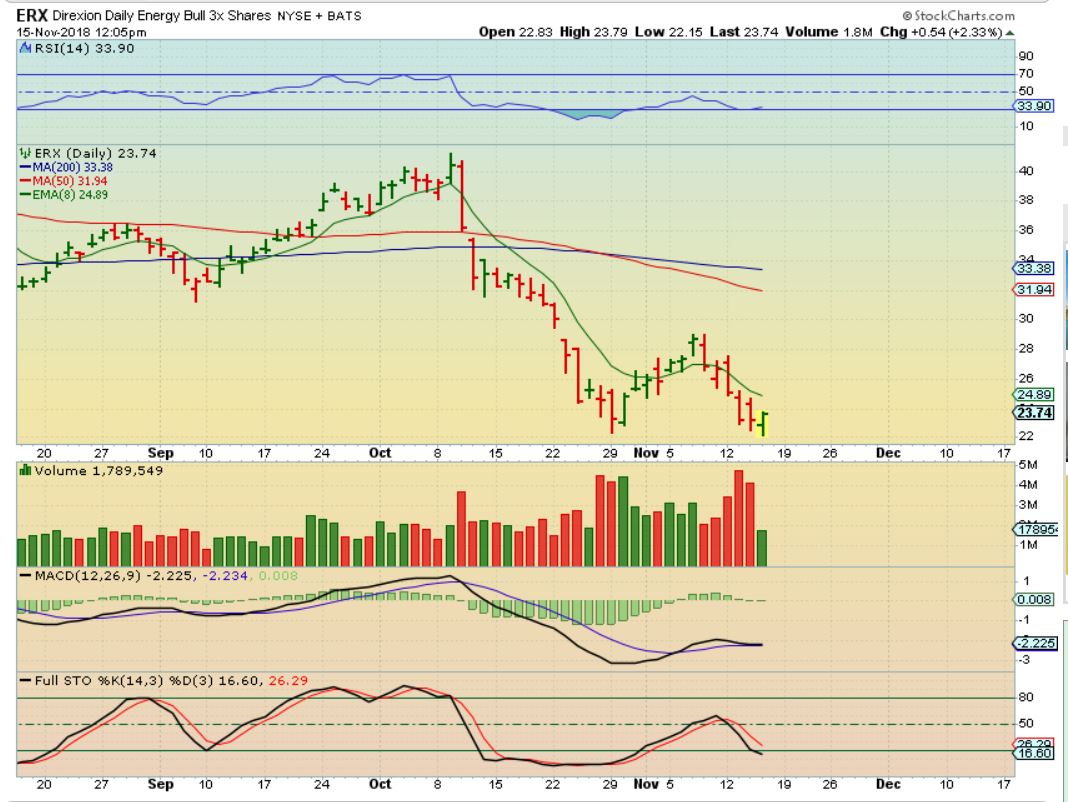
ERX – Like the XLE, we see a double bottom & reversal with MACD & RSI divergence. This is a buy with a stop ( F.Y.I – This is a 3x etf – that is a bit riskier). A nice run $22 to $32 would be great.
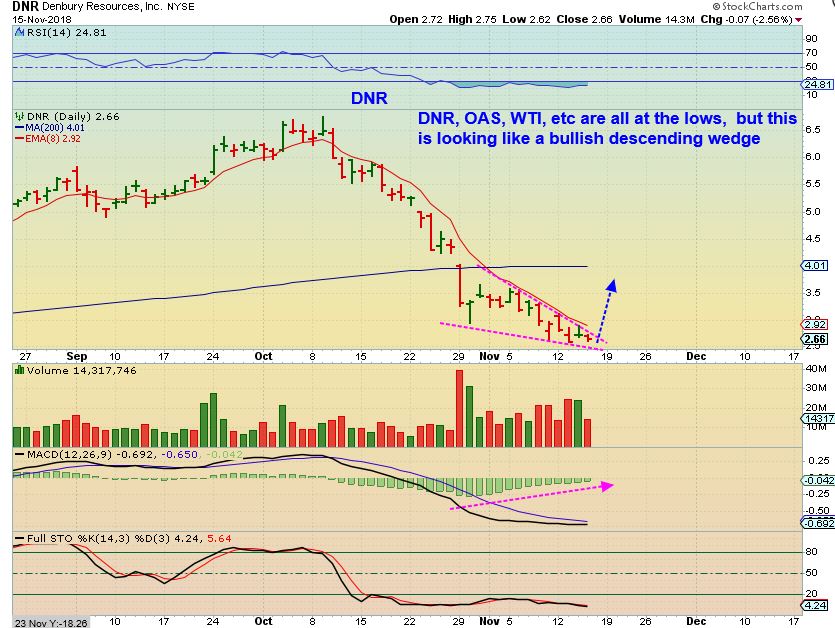
Oils sell off was steep and relentless, 12 days in a row, so you would imagine that many Energy stocks are a little beaten up too. If Oils lows are in, these should be setting up bullishly soon too, so I will look for some trade set ups. Right now many are right at the lows and need time to show some strength. Read the DNR chart.
.
DNR & others set up this way could be ‘watched’ for a break out.
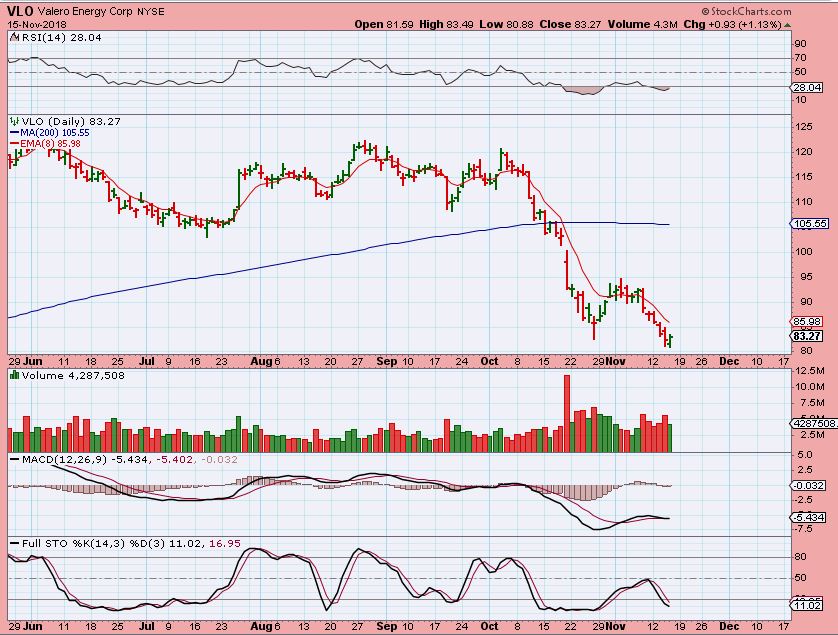
VLO ( and others set up like this) could be forming a double bottom low right now in my opinion, with the divergence and reversal.
.
LET’s REMAIN CAUTIOUS WITH THE CURRENT MIXED PICTURE: Yesterday I had a very Long update with some adjusted thinking based on the way things were shaking out and shaping up. So I will just get right into the sector and you can review that report if necessary, but let me say that this is a Mixed picture.
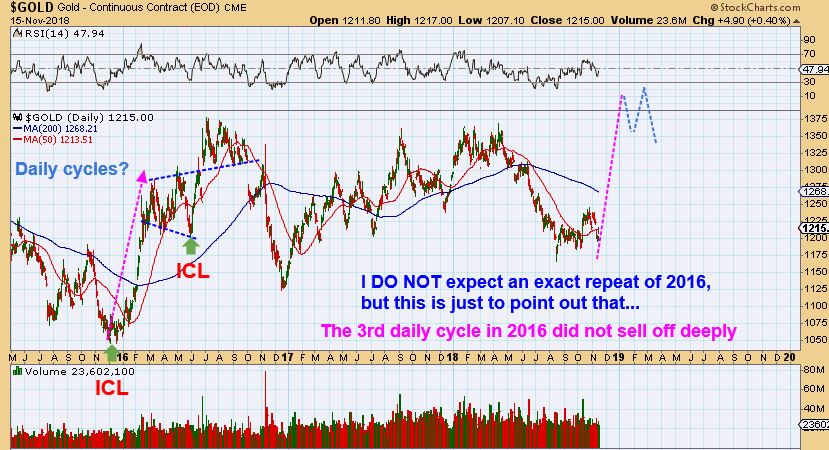
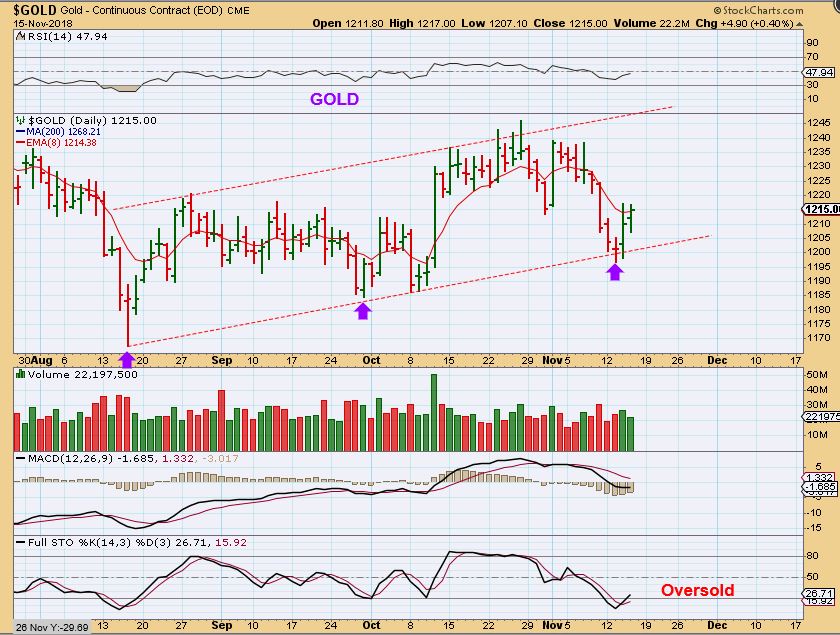
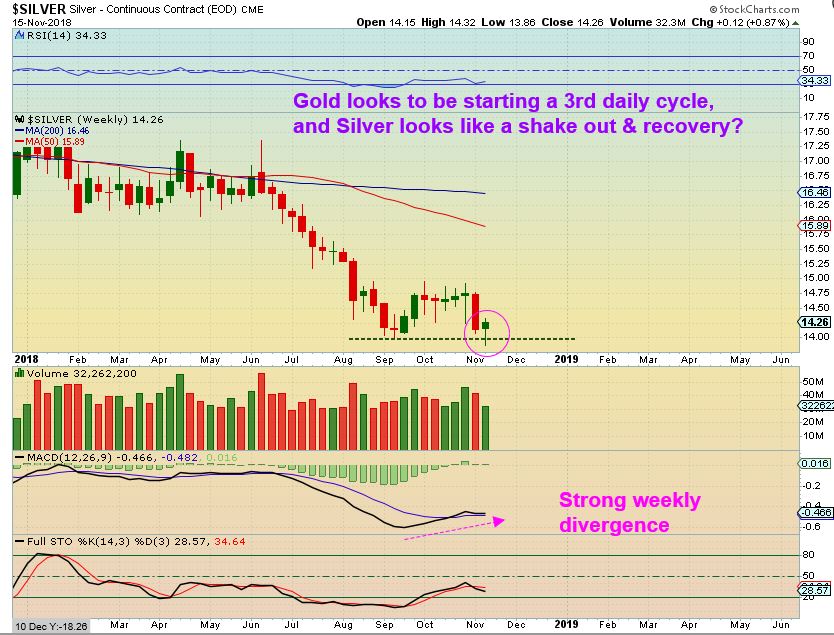
** Remember that Gold should be on a 3rd daily cycle, and if that was going to be left translated & roll over, it ‘could’ do that on day 5 , or day 8, or day 12. Looking at GOLD in 2016, Gold ran from Dec 2015 and did not sell off deeply, it just got Very Choppy at the highs until May. This left many behind, so anything can happen. That IS NOT normal, but also currently Silver did a shakeout & recovery with some Miners at lows, some at the highs- That is not normal either. It made me wonder if Gold will be right translated & power higher? Some Miners broke the lows, some are at the highs, and most look to be set up nicely now. That said: I am invested, yet cautious. We can always sell a pop & lock in gains, but for me? I am trying to hang on. Let’s discuss the charts…
.
Gold 2016 put in a base & ramped up. Notice that The 3rd & 4th daily cycles were choppy.
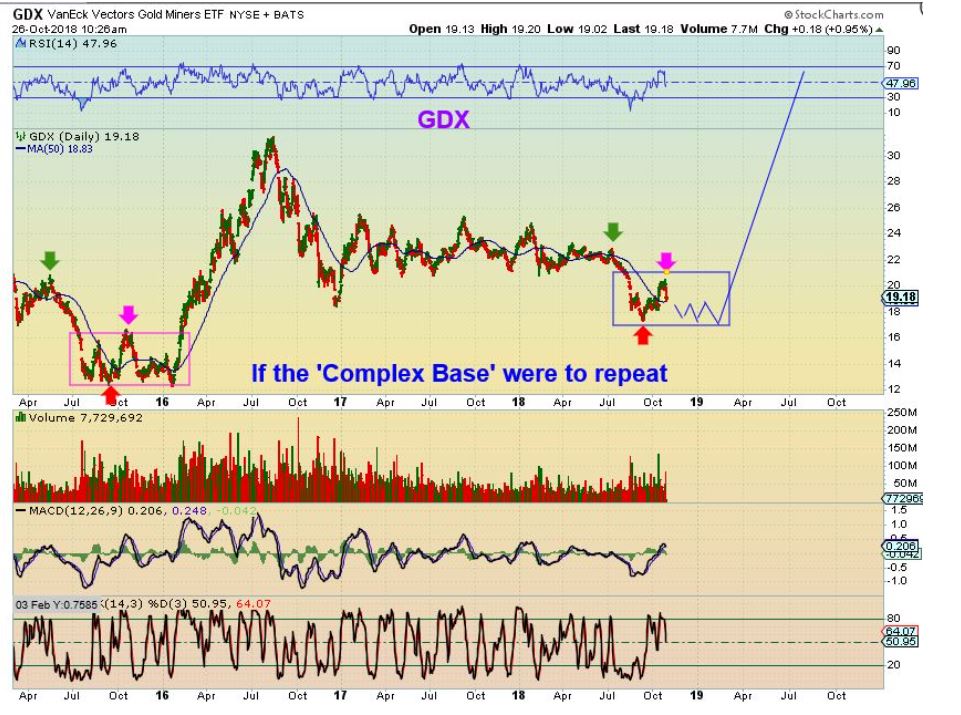
GDX _ So Golds Choppy 3rd & 4th daily cycle allowed Miners to just power higher after a shake out in January. I (we Chartfreaks) rode that whole ramp up higher, while many were confused and left behind. 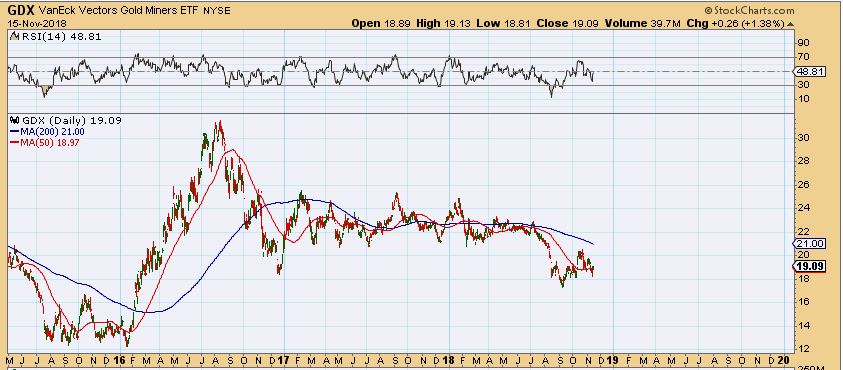
– THAT WAS NOT NORMAL, so I do not expect a repeat, but conditions are similar now. A shake out in Silver & some Miners, while strength in Gold remained. I am riding the 3rd daily cycle in Gold, hoping that Many of these good set ups in Miners can power ahead ( and some have, as seen in yesterdays report). Remain alert to earnings release dates, protect yourself with Stops, and Stay Frosty! 🙂
.
GOLD – This should be day 2 and it is oversold. Gold could easily run back to the top in a week or so. The first 5-8 days will be important.
SILVER WEEKLY – This just doesn’t make sense to me- read the chart.
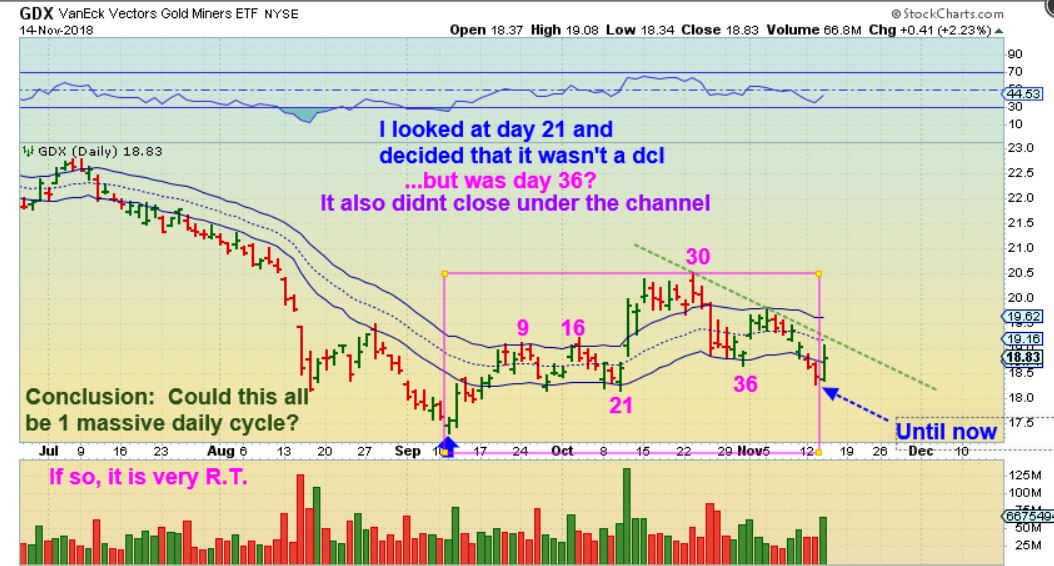
GDX – From yesterdays report. Rather hard to believe that this could all be 1 daily cycle, and maybe it isn’t? We didn’t close below the channel for 40+ days, so we’ll see how the next move higher plays out ( Strong or weak).
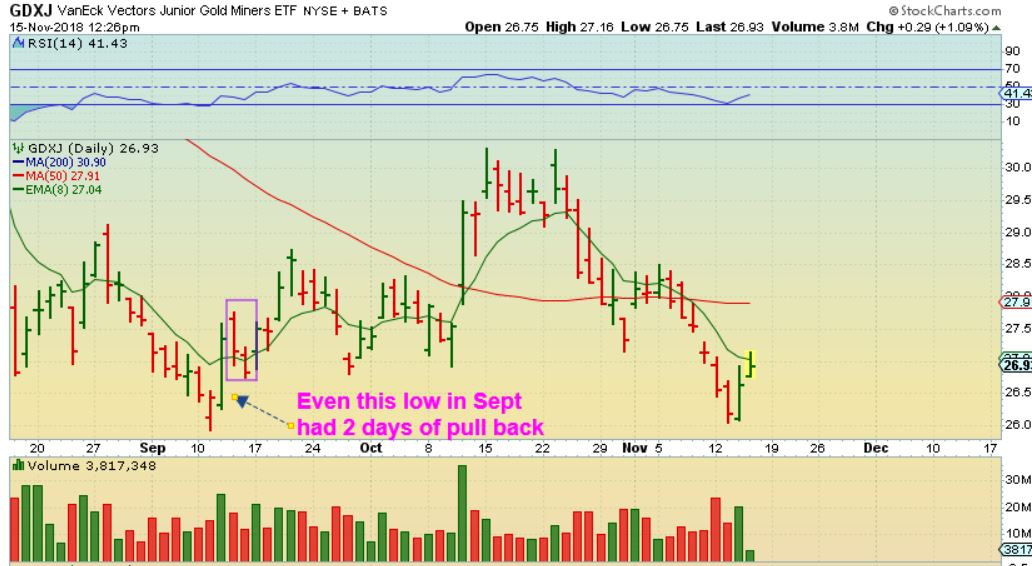
GDXJ– I just wanted to point out the move out of the lows is not always straight up for days. See the purple square. This is not a straight up move, so I try to buy near support, use a stop under that support, and allow the move to do its thing 1 way or the other.
GDX – And this is the Big Picture idea from October mentioning that we could imitate 2015 consolidation and just chop sideways. Within this current choppy move, some Miners stayed strong. Maybe that will continue…
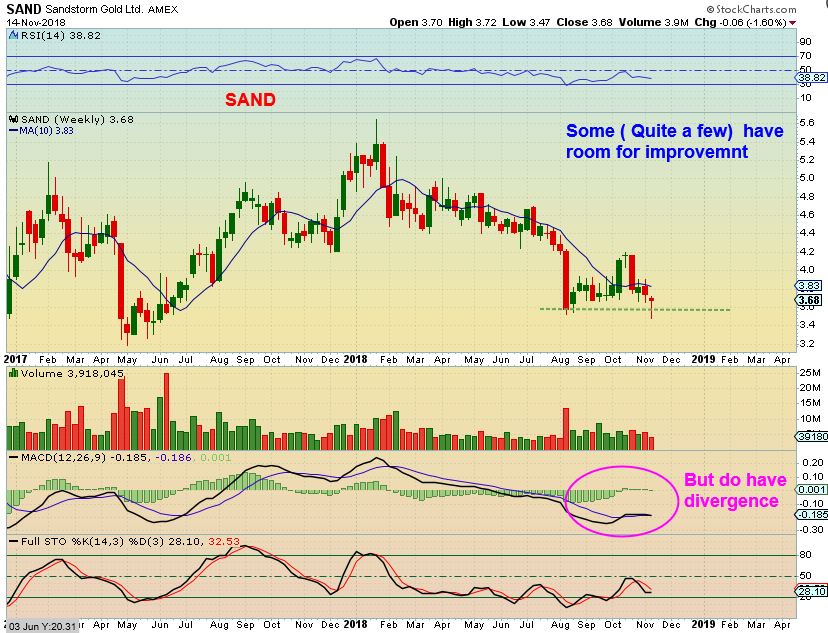
SAND – Yesterday I pointed out this weekly shake out. I mentioned with these that a little more upside this week would make for a nice weekly candle. Did SAND continue higher?
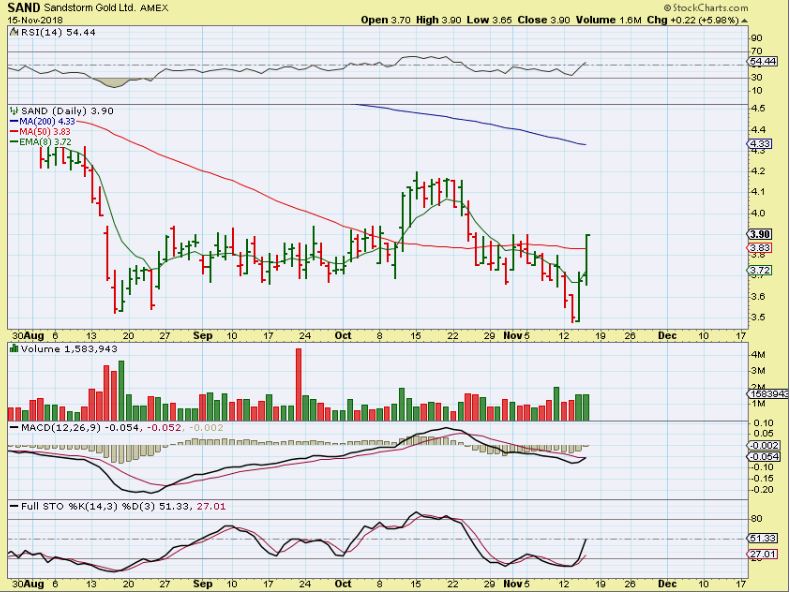
SAND – Nice follow through above the 50 sma, and the MACD looks ready to cross. Now that weekly candle should look very good ( depending on Fridays close).
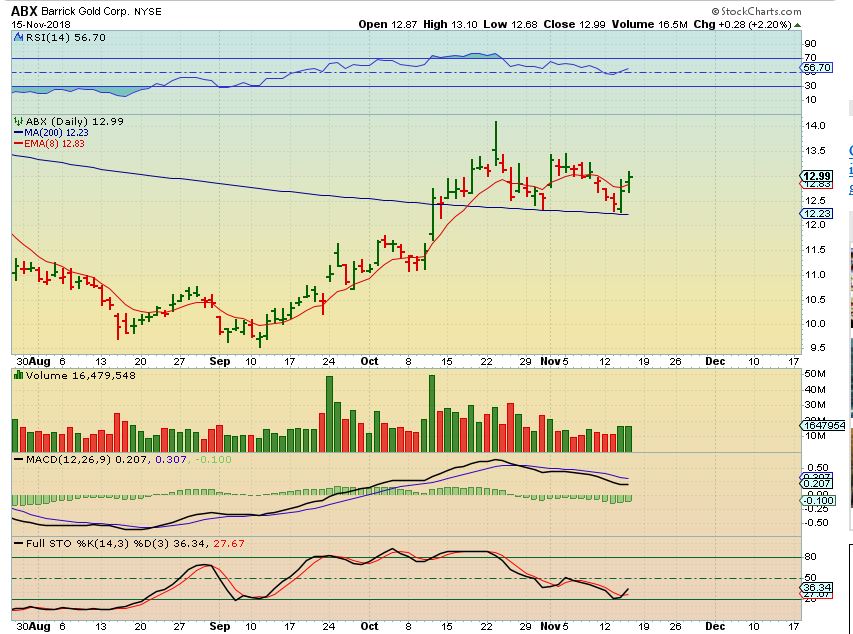
ABX – This is still a buy and it closed above the 8 ema. If ABX breaks higher, it could have a good affect on GDX.
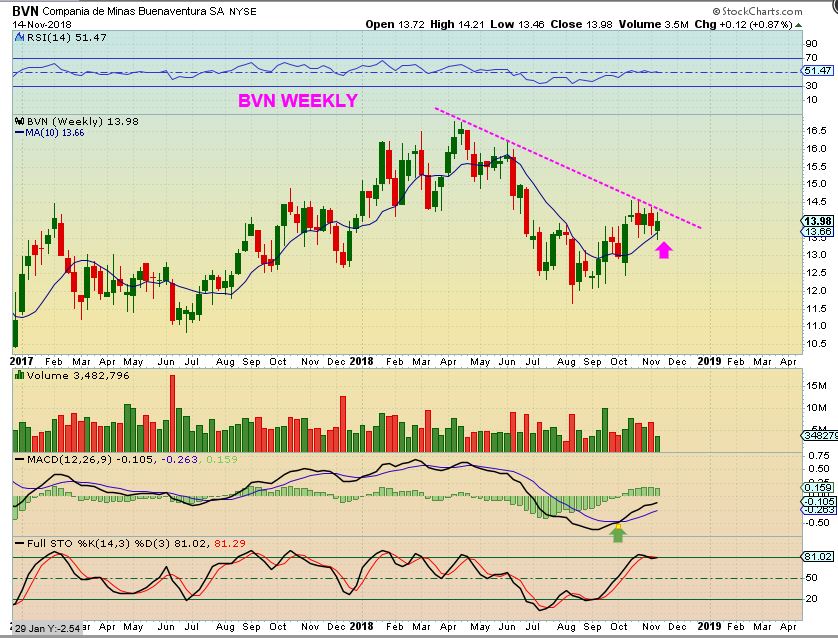
BVN – I mentioned that BVN could break out from a multi month down trend if it could push a little higher. I think that a close above $14.50 would be good.
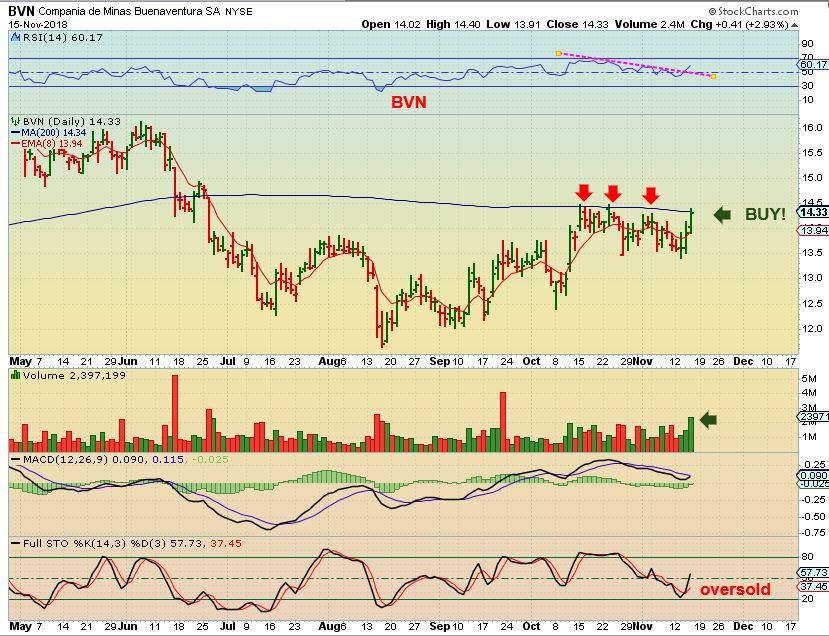
BVN – It DID push higher and now is pushing on the 200 sma with increased volume. This is a bullish set up that did not really sell off with the recent selling, and it is still oversold. I REALLY LIKE THIS SET UP.
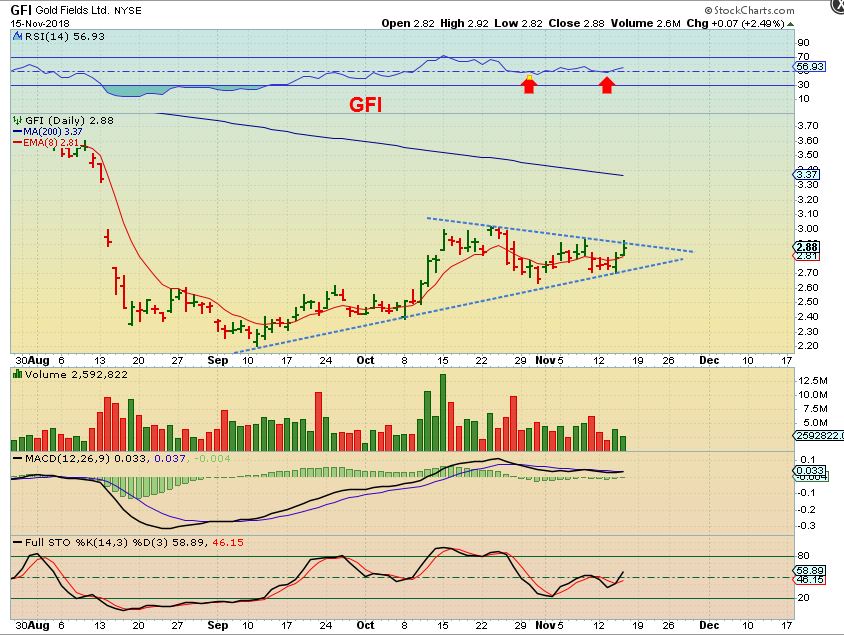
GFI – Another bullish set up. It didn’t really close below the rsi 50% during recent selling.
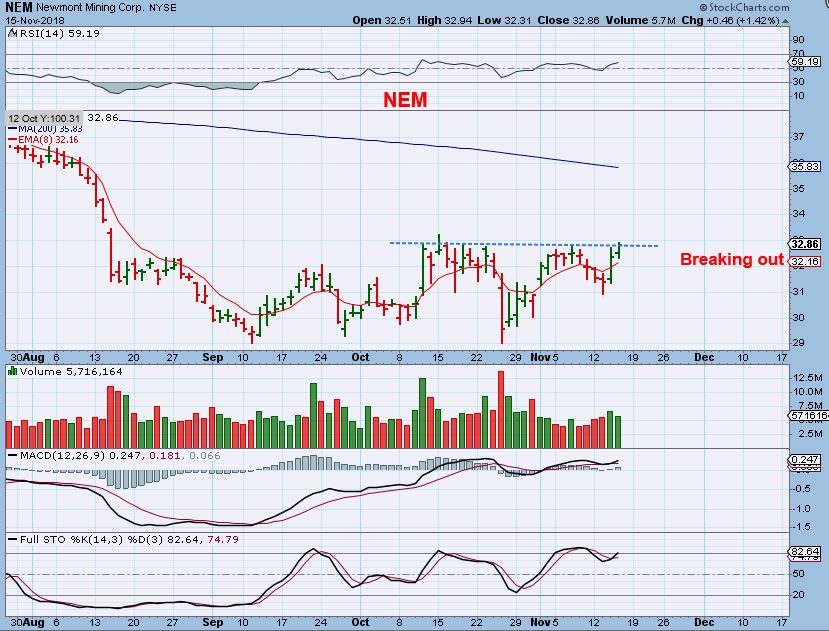
NEM – Another Miner that will affect GDX if it breaks out here. This can run to the 50sma.
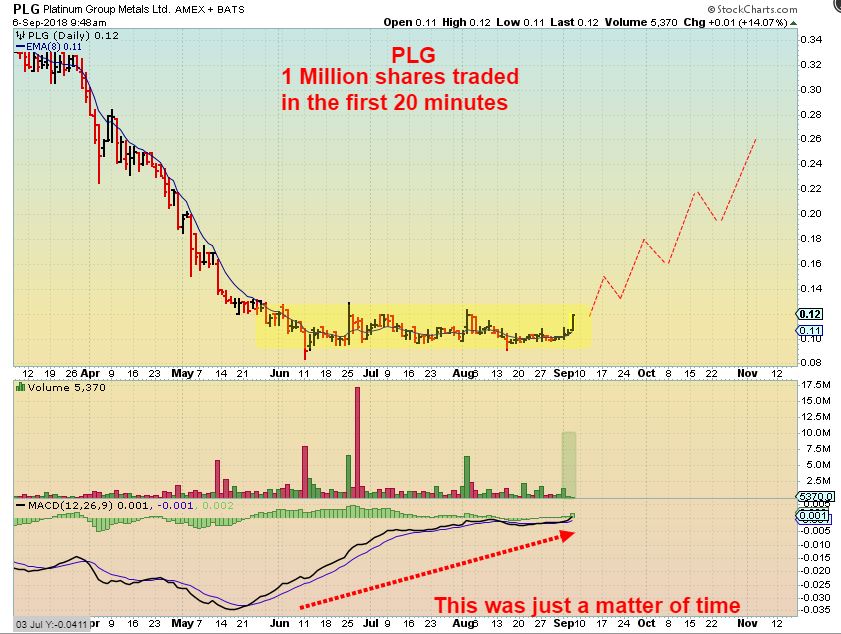
PLG from September – I bought PLG at 10 cents in this base and have been saying that I wanted to hold PLG for the long run, but I still use a stop. It actually ran to 20 cents since I posted this, and I sold some on the way up, but bought it ll back on a dip. Then, it pulled back & I got stopped out. (Next chart)
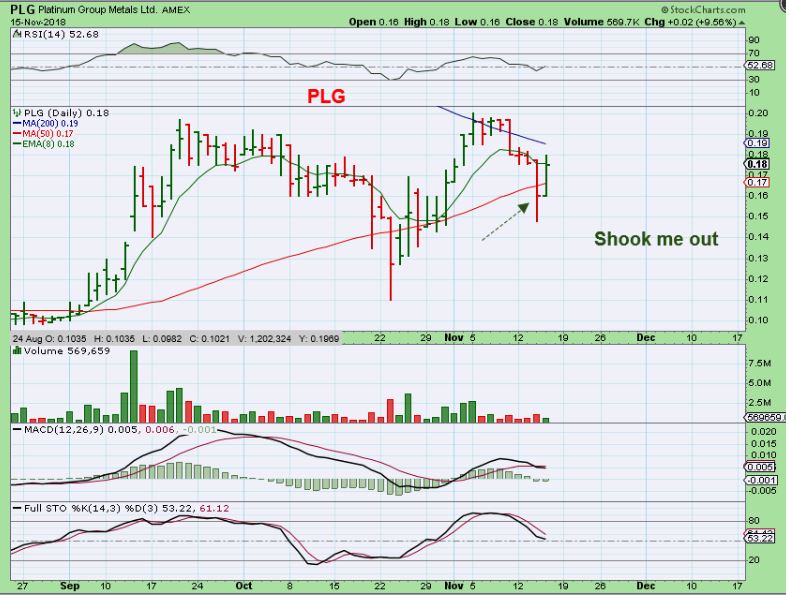
PLG – I got stopped out below the 50 sma in October, but I bought back in immediately. It then ran to 20 cents again, but resistance at the 200 sma stalled it. Now on Wednesday it dropped below the 50 sma again, so I just got stopped out of PLG. 🙁 I do still like that long term chart, so I will try to find a way back in. The choppiness in the markets is frustrating, but there is nothing you can do about it at times.
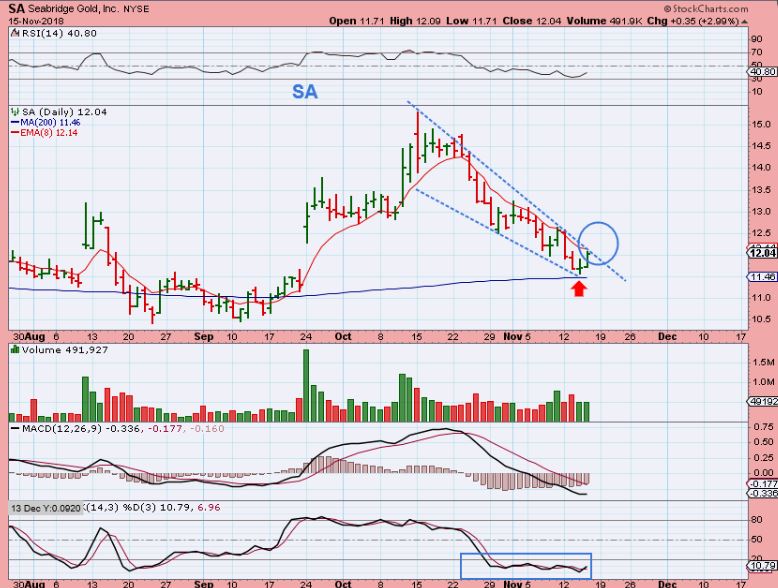
SA – SA tagged the 200 sma & filled a large gap, and looks ready to break out. I will probably buy this here or as it breaks out, with a stop below the 200. .
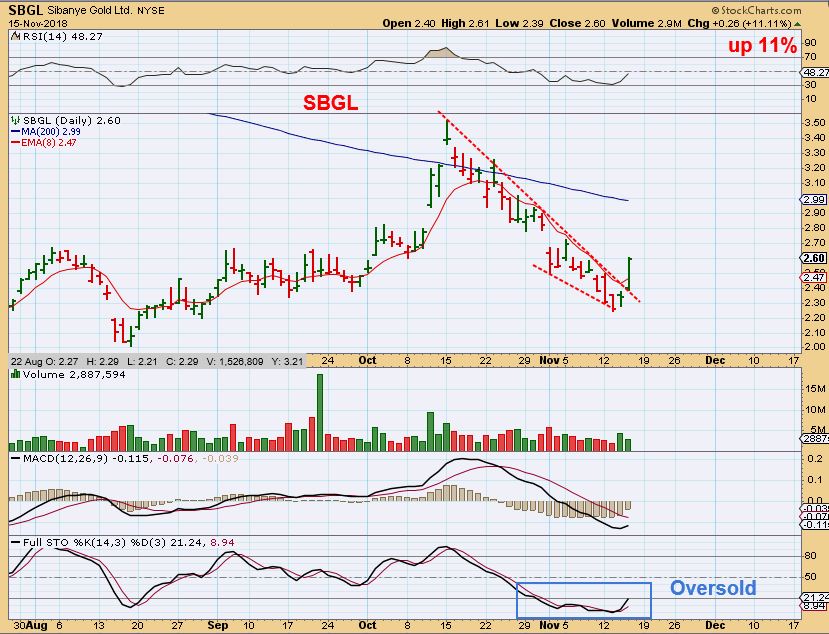
SBGL – SBGL Popped Thursday from a descending wedge.
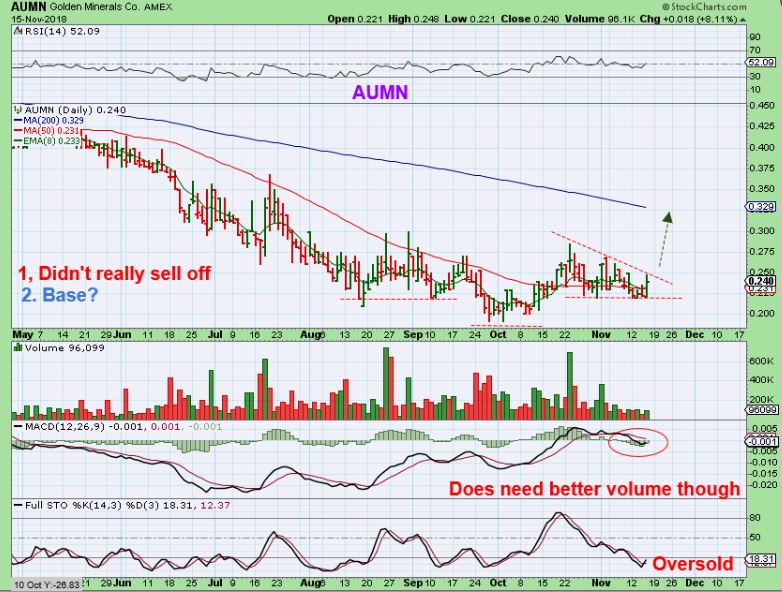
AUMN – I bought AUMN, simply because earnings were already released last week, it is oversold, it was pinched in a wedge, and I often buy this junior if I think it may pop. This Miner has a personality as a strong runner if it can get going. Well, after hrs they announced that they bought a project in Mexico, and that can cause a sell off if investors feel they spent too much money. It could POP because the project had positive test results too. I’ll have to wait & see.
.
Watch position size, be reasonable and know your self when it comes to risk. Stay Frosty my friends, Enjoy your Friday trading, and enjoy your weekend!
.
~ALEX
.
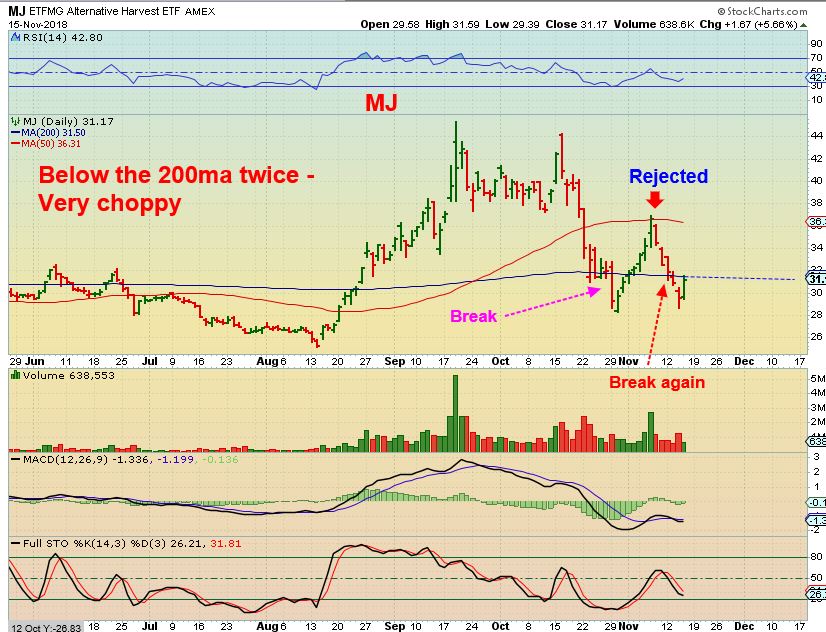
Sidenote: For the MJ Sector. Many of these stocks have been losing & regaining their 200 sma as a shake out & recovery. Then they lost them again…
CRON – This MJ stock ( & CGC) did a shake out at the end of October & then recovered the 200 sma. It ran to the 50 sma & was rejected and dropped back to the 200 sma. This is acting correctly, so I am keeping an eye on it. 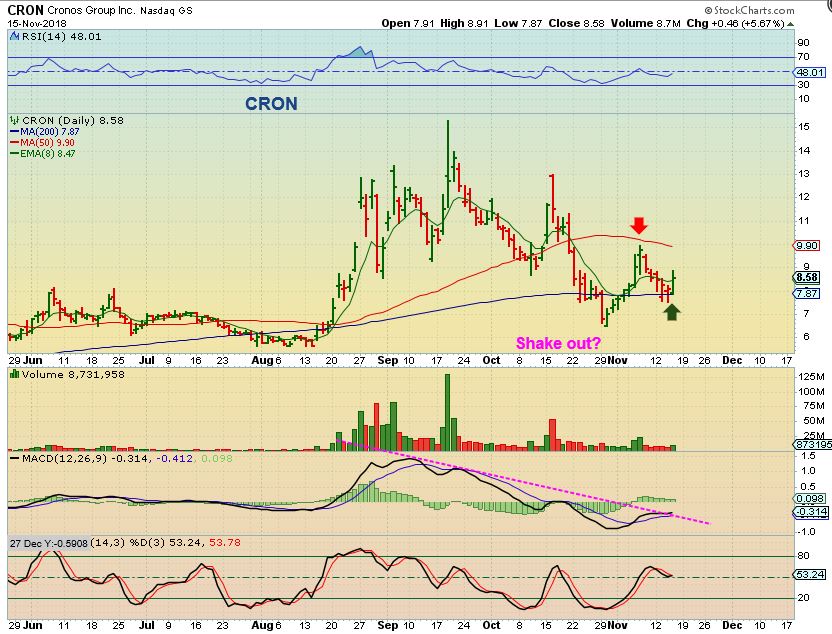
Others stocks in this sector, like MJ ETF, APHA, ACB, etc all actually dropped back below the 200 sma for the 2nd time, and this made them look weak. Thursday price reversed higher. I am going to watch this sector too, possibly just for a quick trade. It will be interesting to see if they can recover the 200 again . THIS SECTOR IS VERY CHOPPY & ALL OVER THE PLACE, SO IF I TOOK A TRADE, IT WOULD BE JUST TO BUY & SELL A POP. It may try to run back to the 50sma.
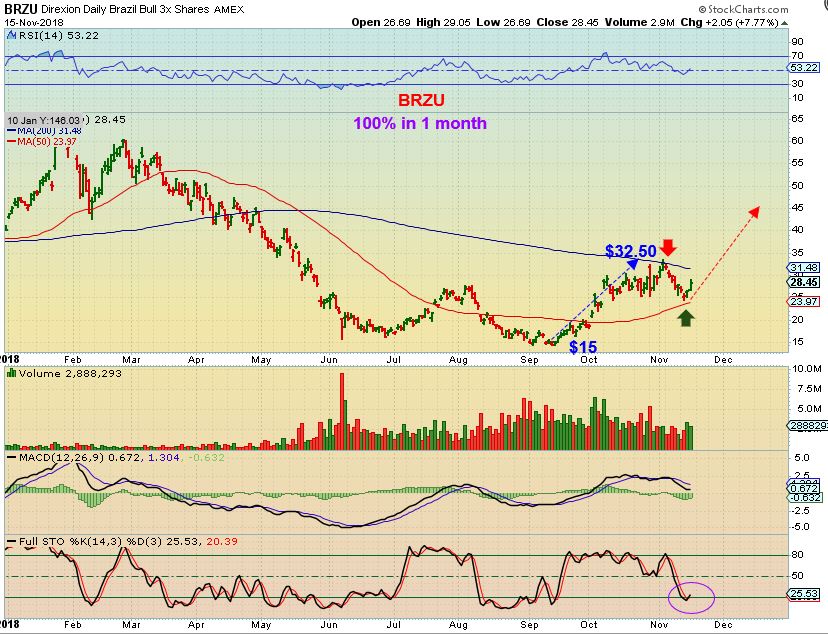
BRZU 3x ETF – I actually posted this when BRZU Gapped open above the 50sma on October 2 as it ran from $15 to $20. It Gapped strongly, so I mentioned buying the gap fill at support. I did NOT take this trade, however,
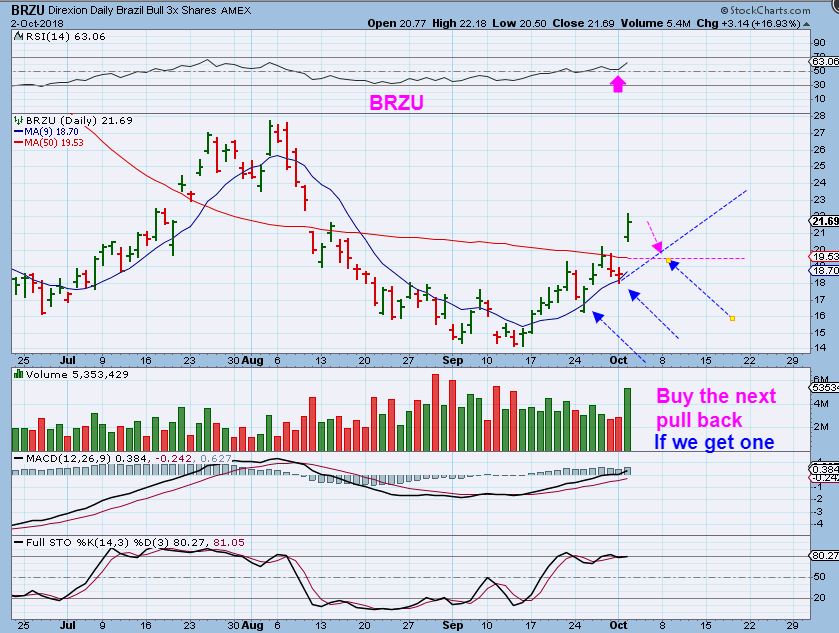
BRZU – Well, it never filled that gap, it just powered higher to that 200 sma. BRZU gained 100% in that 1 month September to October, and has pulled back to the 50sma. It reached oversold and it looks ready to go again. This looks like a very good trade set up.