November 14th – Saving Grace?
Let’s take a look at the Markets, and I will discuss the Theme Picture later in the report. Consider the last part of this report as important, and please read it carefully.
.
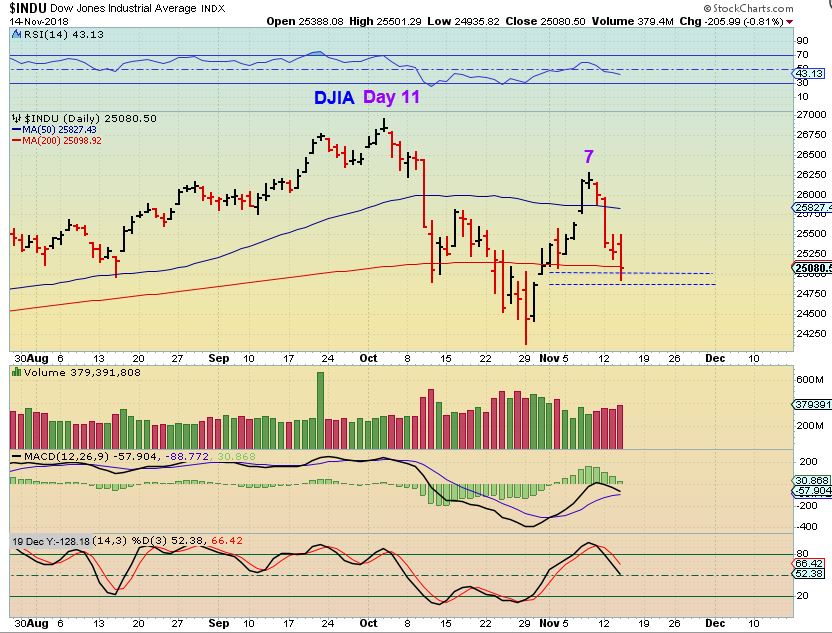
DJIA – We have a gap fill. Now let’s see if these markets can get moving to the upside. I have discussed my thoughts on the General Markets in recent reports.
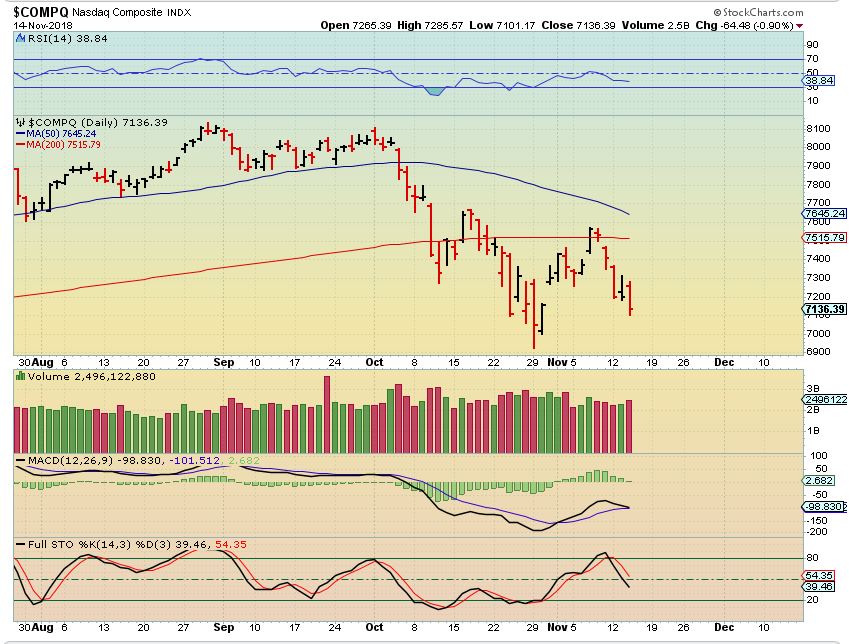
NASDAQ – The NASDAQ moved slightly below the gap and closed there, & it was a higher volume drop. The Nasdaq needs a sign of strength soon, this looks weak.
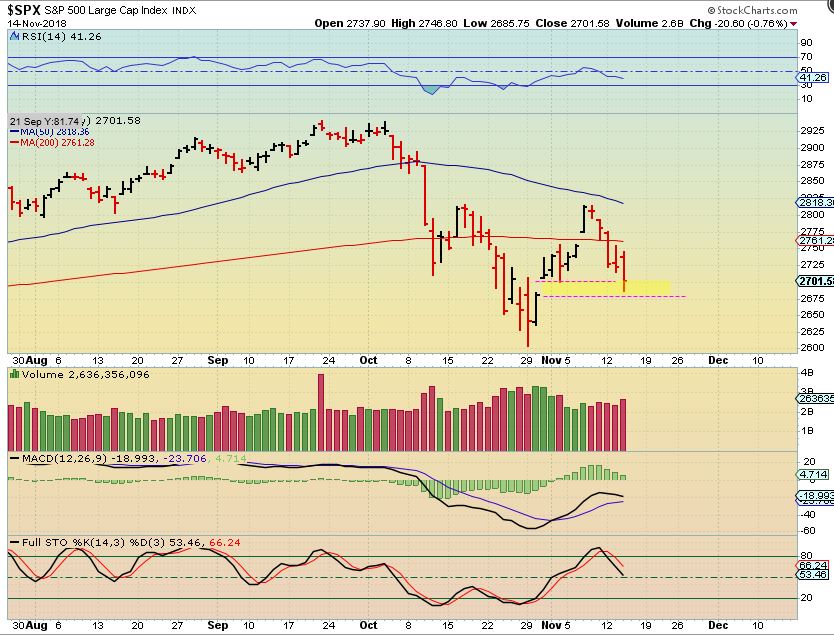
SPX – Gap fill & bounce.
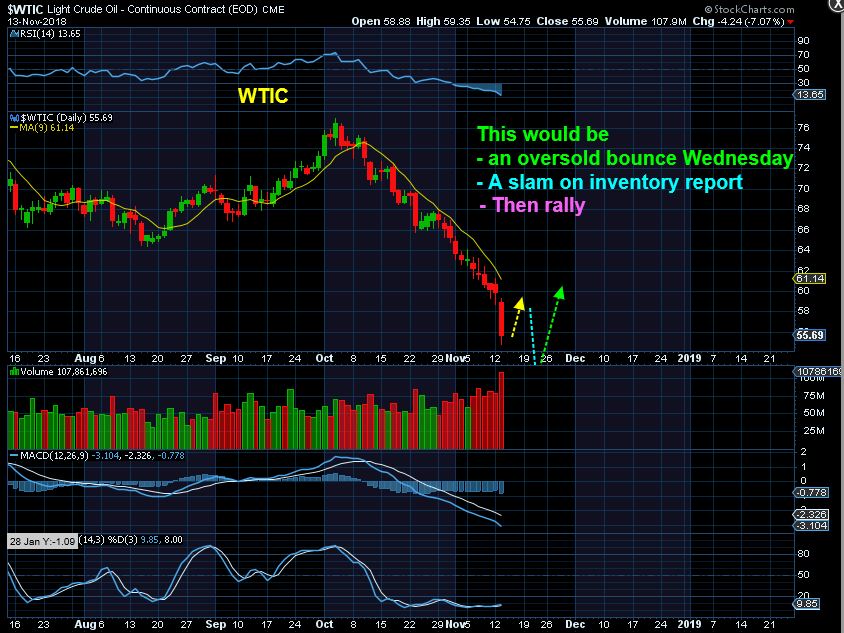
WTIC – After 12 straight days of selling, Oil took a rest. We are due for a DCL, and the inventory report is released Thursday.
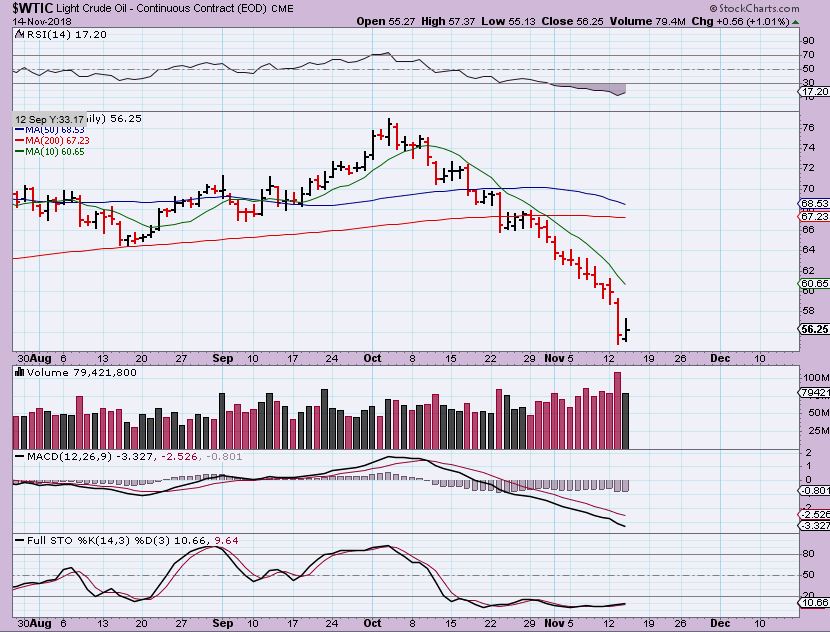
This was one of my ideas from yesterday. Possibly a bounce Wednesday and then a final low after an inventory report release. I will look for this or an immediate upside response, since we are due for a dcl.
Oil – Also from yesterdays report, support ..
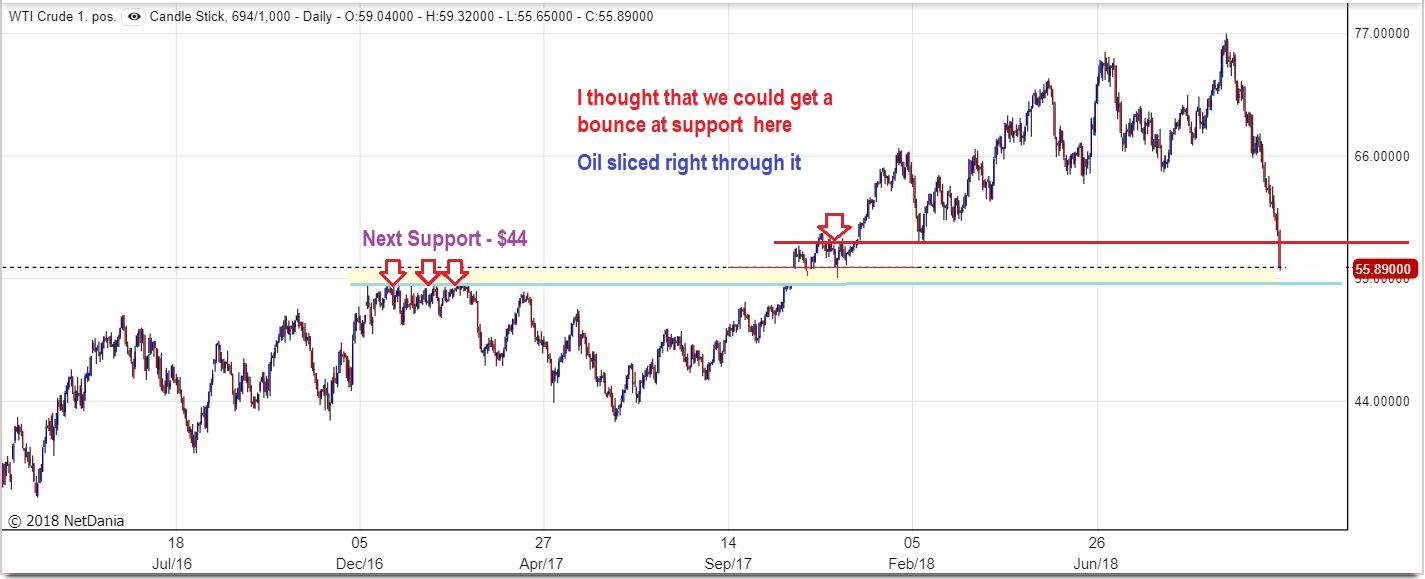
.
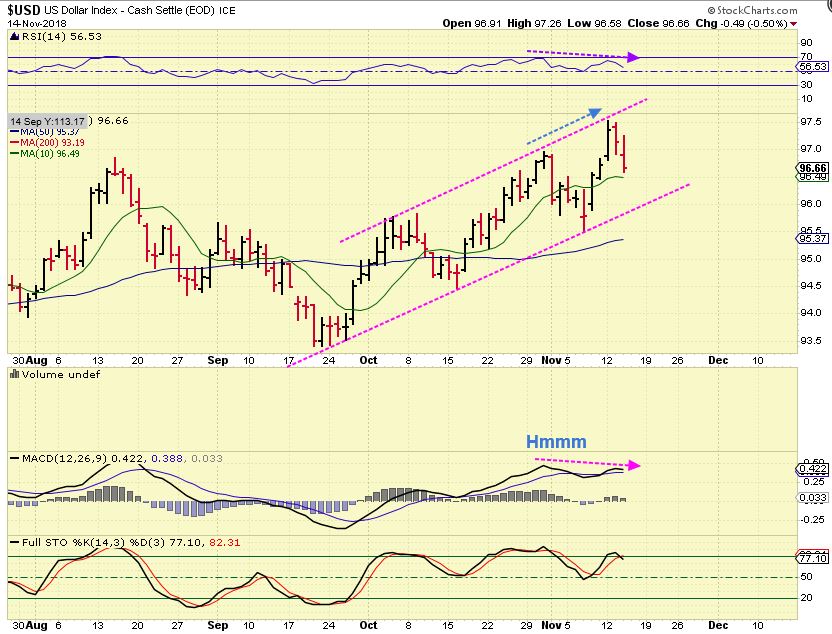
USD – If the USD keeps dropping, GOLD would likely benefit. I think we have just put in a dcl in Gold & Miners, as you will see.
.
Wednesdays Observations: As this section plays out, we have had very Mixed signals. I will discuss this. There is an important adjustment in my thinking, due to events that occurred within recent choppiness. Please read this section carefully.
.
Mixed Signals: Thoughts from my weekend report were that I discussed the signs of the recent weakness developing last week, and several Miners broke the Sept lows as this week played out. Even Silver broke the recent lows, and GDXJ was close. What puzzled me was that the COT levels for Smart Money are still at ICL levels, still very Bullish. Also ‘Sentiment’ has been trashed – almost No one wants to own Miners, except for those that feel we are still nearing a Bull run. There are other Mixed Signals that I have not mentioned. As time moves forward this lack of clarity should begin to clear up. I have still been looking for clues. Let’s discuss Precious Metals.
.
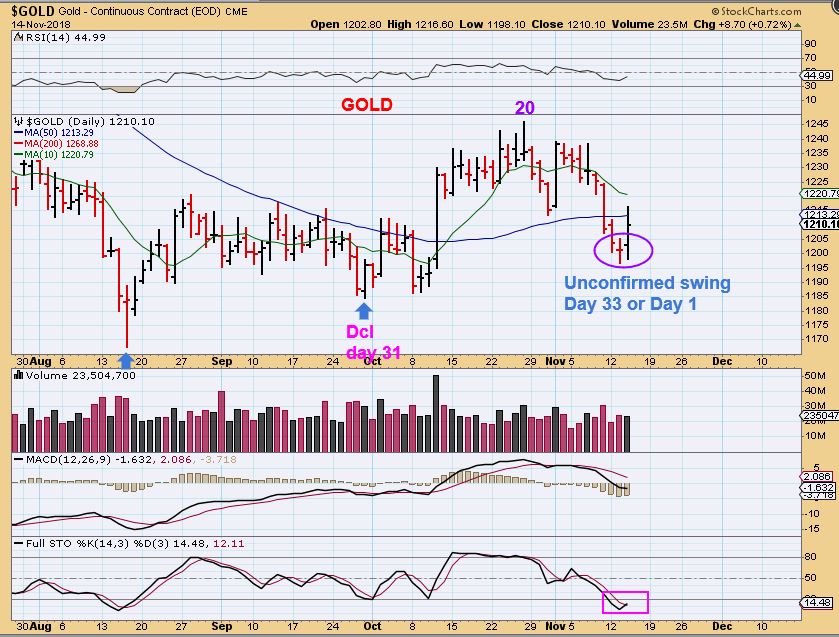
GOLD – This is a swing low, and a move above the 50sma would really be bullish, starting the 3rd daily cycle. The chart of GOLD remains bullish looking to me. This may be a normal ‘shake out’ at the 50sma, we see it all the time.
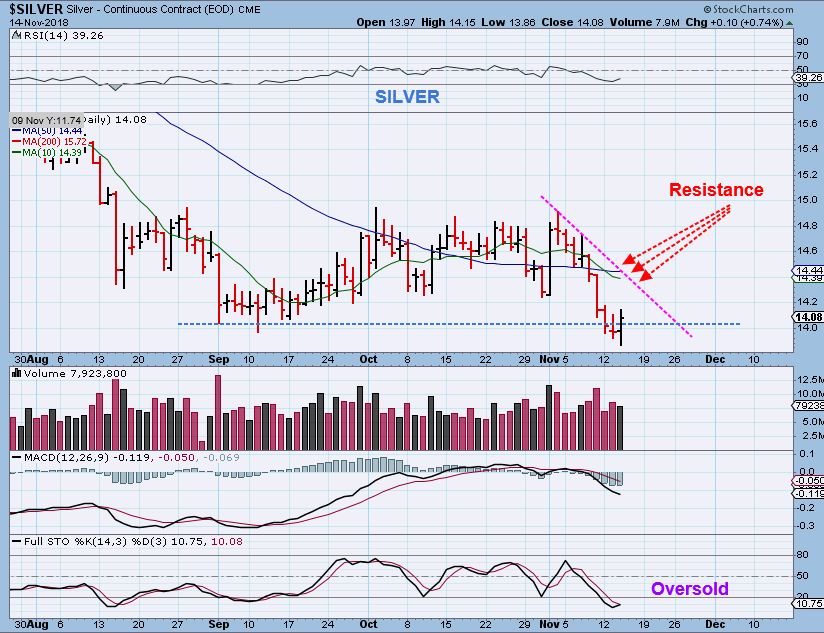
SILVER – Guess what. This is a ‘shake out’ if it holds. This is the kind of action that makes people want to give up and ‘never buy this weak mess again’. I think that a push above that resistance could actually be very bullish, and I will explain why as we go on through Miners.
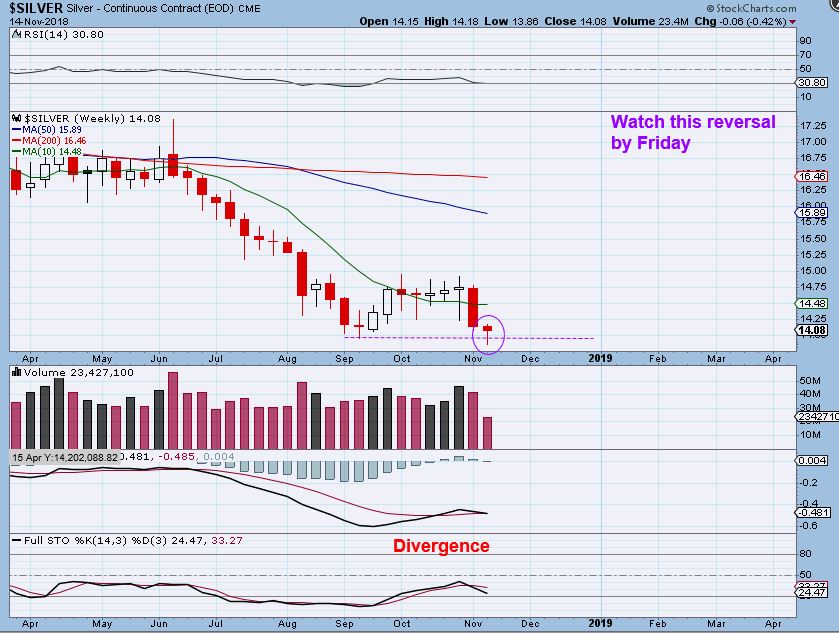
SILVER – If this hold by Friday, we have a ‘weekly shake out’ too. Now look at the weekly MACD.
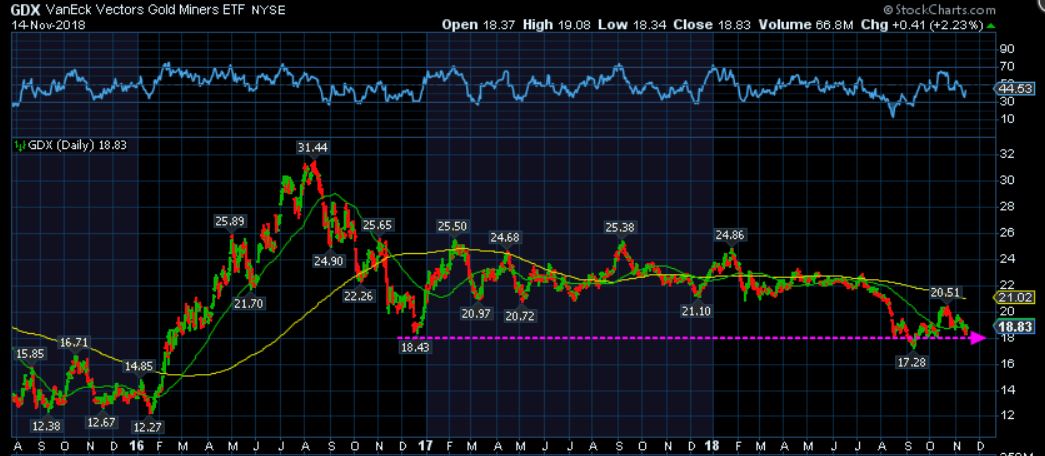
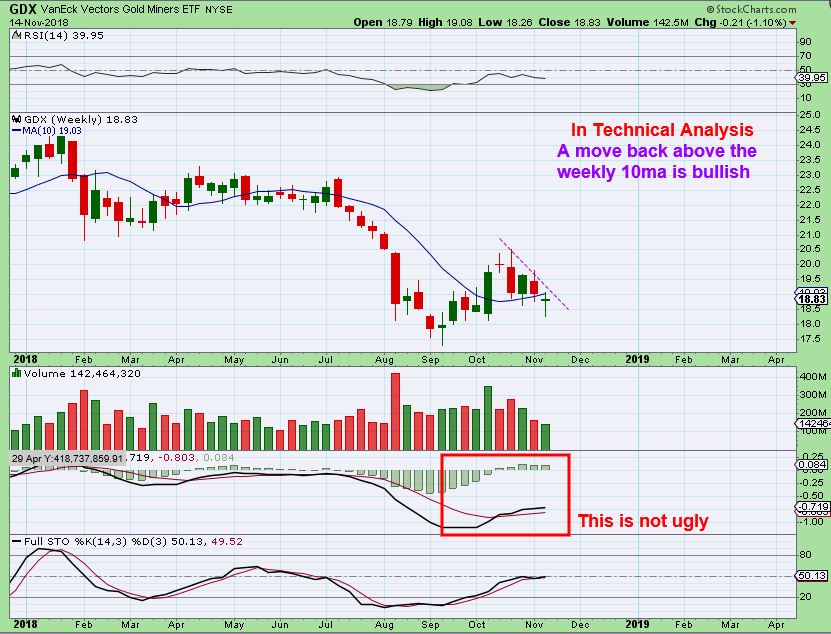
GDX WEEKLY – GDX Weekly is already almost above the 10 ma. We have a reversal as of Wednesday. look at that MACD too, so this looks rather bullish. In technical analysis, a close above the 10 weekly MA is Bullish, and we still have Thursday & Friday to move higher.
.
** I have mentioned several times that the Cycle counts for GDX / Miners are very obscure. Very unclear. This will show you 1 reason why, and though what I am about to point out may seem IMPOSSIBLE, I have to keep an open mind to what I am seeing under the current conditions and let it prove itself …
.
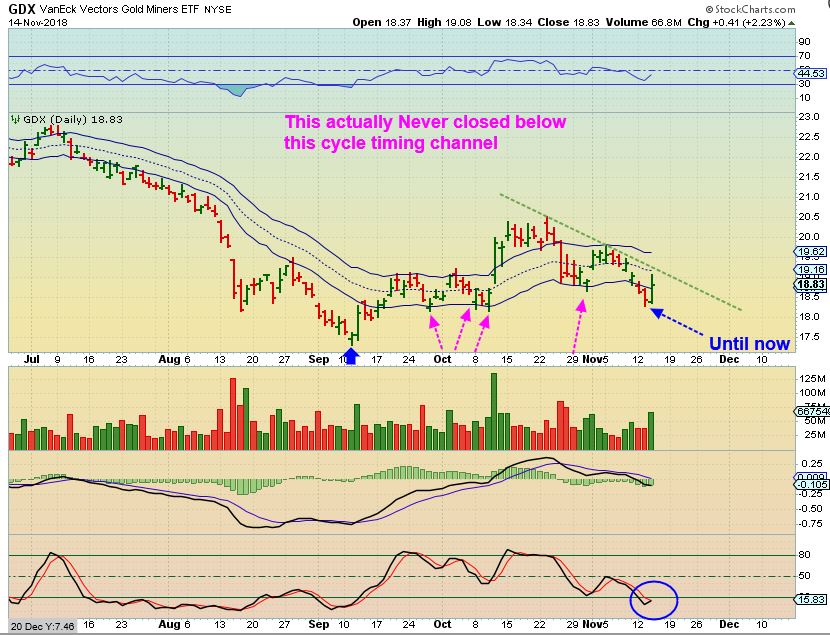
GDX #1 – A dcl usually happens when price closes under this channel ( ‘The DOC’ developed this channel, and I use it often privately). Price NEVER closed below it over the past 40+ days, and that is why when Price dropped on day 21, I didn’t really think that that could be a dcl. I then continued to count on, please look carefully at this chart …
GDX #2 – Is this really possible? I think that anything is becoming possible in this sector under current conditions. Read this chart and notice todays high volume reversal. I have to be open to anything that fits the charts language, and this is saying that we now have a dcl after day 40? Please read the chart, this looks like a R.T. Daily cycle consolidation.
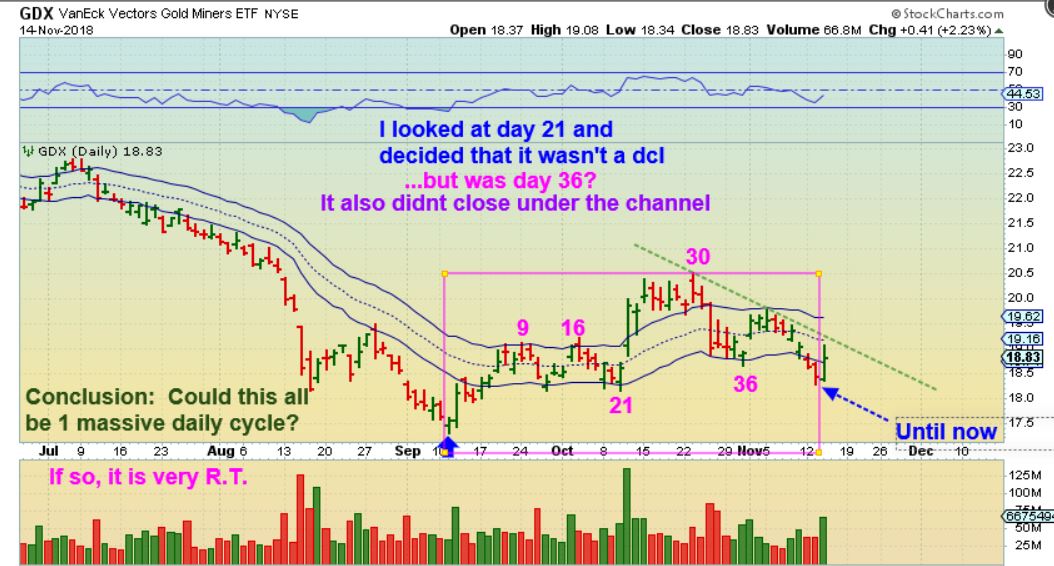
If THAT is all one 40+day Daily Cycle, it is very right Translated, it is a solid Base, and it could break to new highs, and then we go to one step further…
.
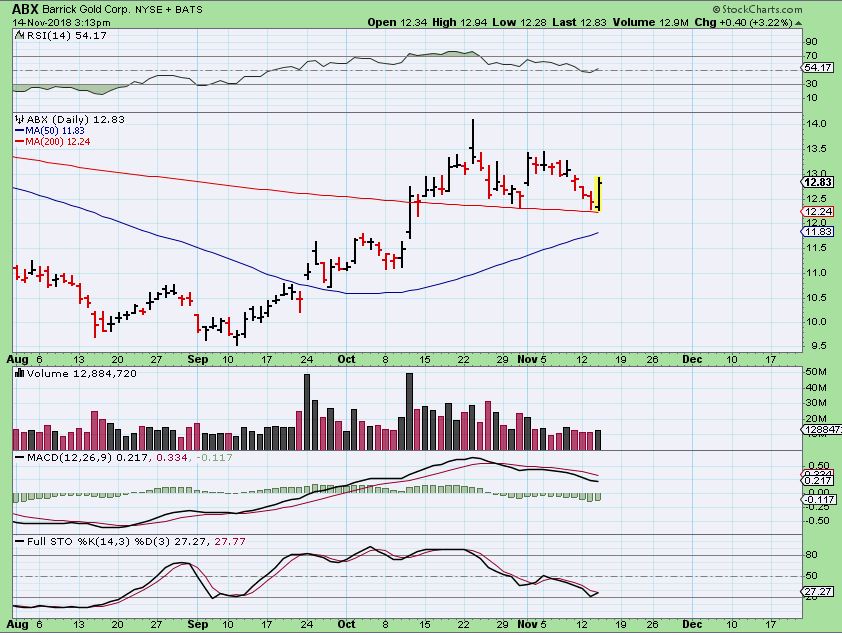
ABX – Some Miners do NOT look healthy, but as I ran through my charts Wednesday Morning, I started to notice that quite a few remained VERY BULLISH. Not fairly bullish, but VERY bullish, even after the recent sell off. THESE MUST BE UNDER ACCUMULATION. Look at ABX, bouncing off of a back test of the 200sma. It only went sideways during recent weakness. The 50sma is curling upward, with a golden cross coming up? This chart is nothing but bullish above that 200sma. You could BUY this with a stop at the 200sma. Low risk for now and it is still about 40% off of the Sept lows. THAT IS BULLISH .

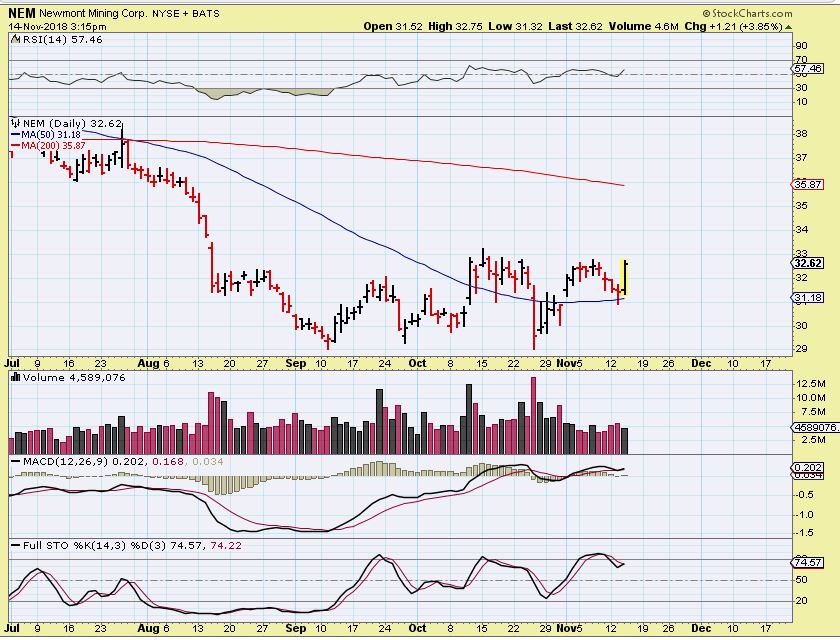
NEM – NEM also back tested the 50sma and put in a strong bounce. LOOK AT THAT MACD! NEM built a slightly upward base, and the MACD is climbing. This is a low risk buy too, even though it spiked down in late October. That looked to be a shake out.
.
SO ABX & NEM ARE BULLISH CHARTS. NOT ALL ARE, AND GDXJ BROKE THE SEPT LOWS, BUT LET’S TAKE A LOOK AT SOME MORE MINERS AND SEE WHAT WE CAN FIND.
.
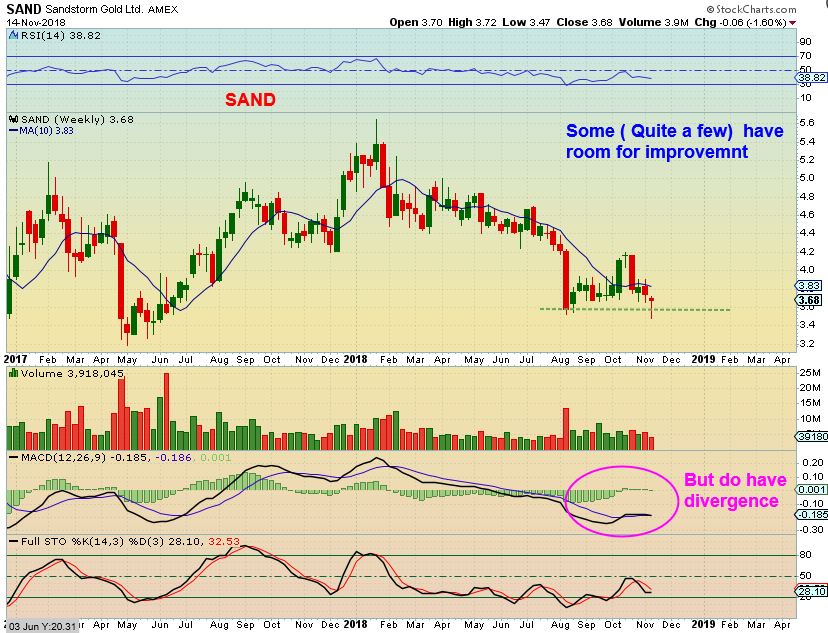
SAND WEEKLY – As I Said, Some Miners (like SAND) sold off and do not look pretty here, since it broke the sept lows. That said, the internals are showing divergence and these can repair over time. This looks like the break below the Sept lows was a ‘shake out’ if it closes here or better.
ABX DAILY – So as mentioned, ABX is Bullish right here, but what does the weekly chart look like? …
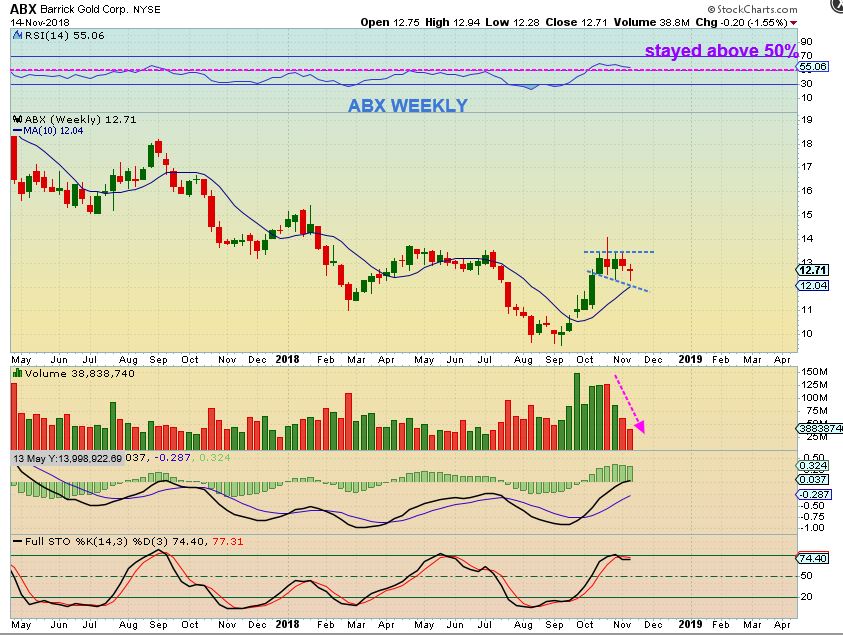
ABX WEEKLY – The weekly chart shows a strong sideways consolidation over the past few weeks. Look at the weekly RSI.
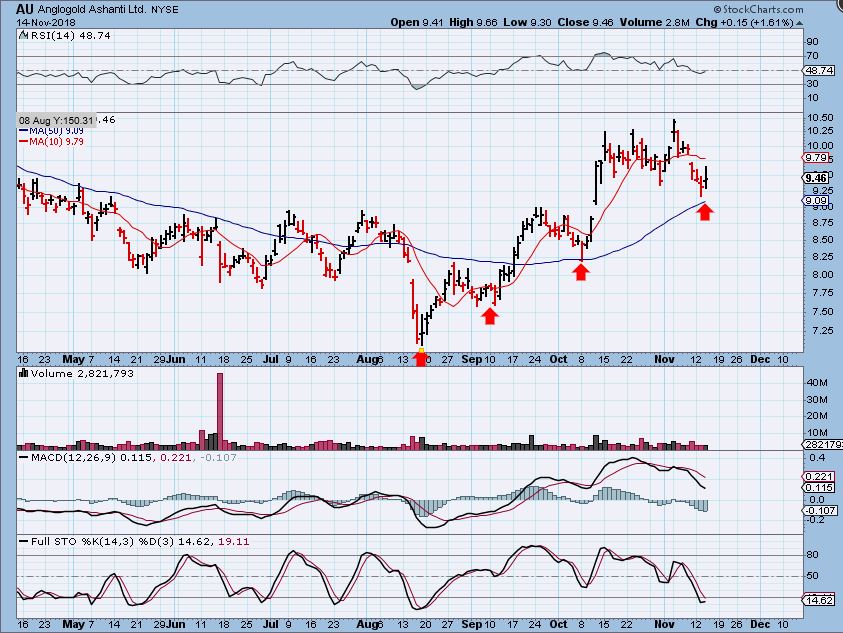
AU – AU has been a stairway higher and I mentioned it in our recent ‘Review’ report as a reason that things seemed rather ‘Mixed’. It is STILL at the highs. This is also a Buy right here, low risk with a stop under that 50sma. Guess what- AU ran 50% off of the lows! Bullish.
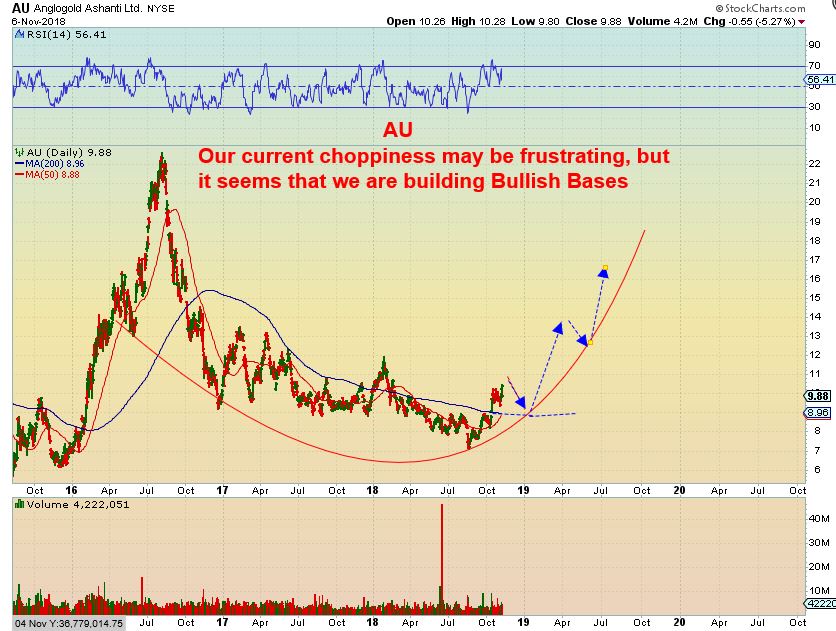
AU WEEKLY- I pointed this out in the weekend report for the bigger picture
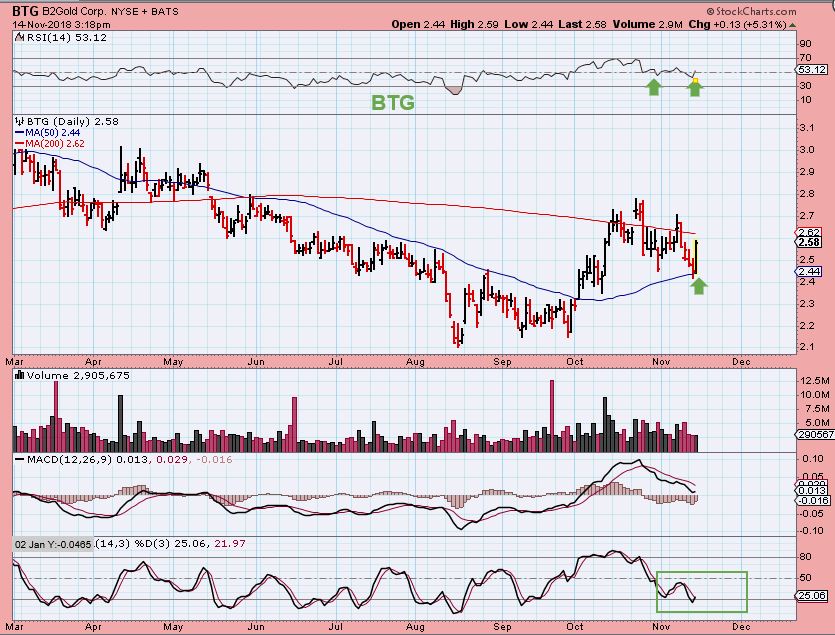
BTG – Here is a Junior that bounced right off of the 50sma and with just a little more encouragement, it will break above the 200sma. If GOLD just had a DCL, and if Miners have a dcl, this should break out & could run.
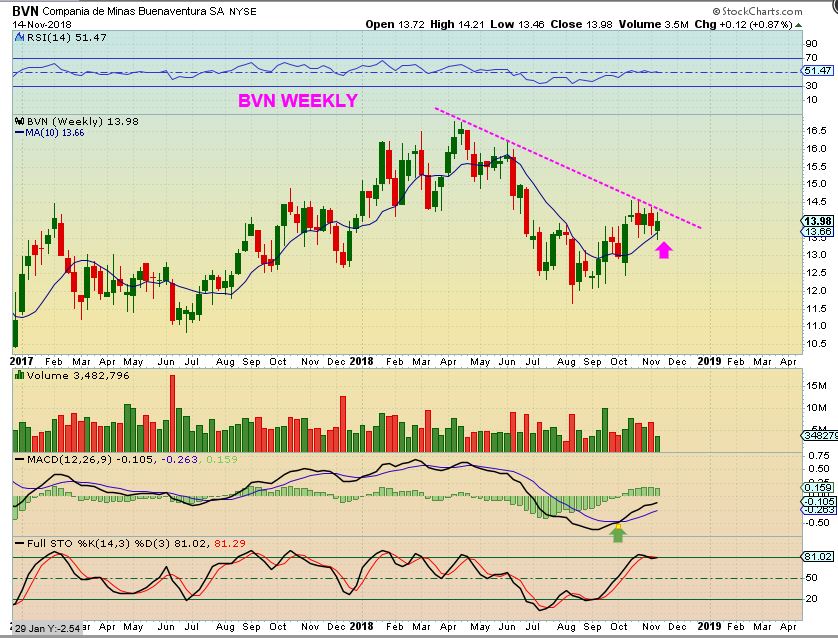
BVN WEEKLY – Notice that BVN ran from roughly $11.50 to $14.50 Sept through November and is Still $14. Just a little push higher will break the Big Picture down trend. And..
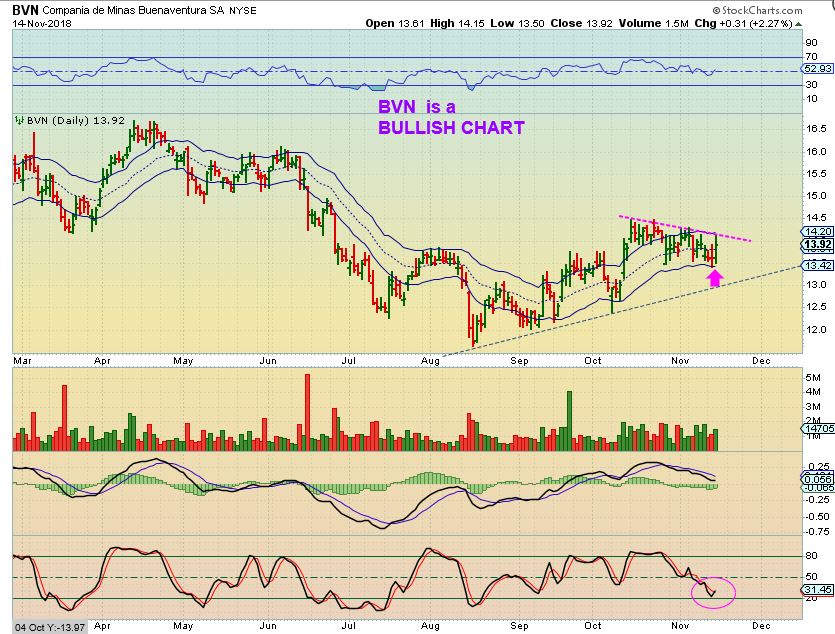
BVN DAILY – Now look at BVN Daily. This did NOT sell off with the recent selling, it went sideways. Buying it here or waiting for a break out should not be risky with a stop.
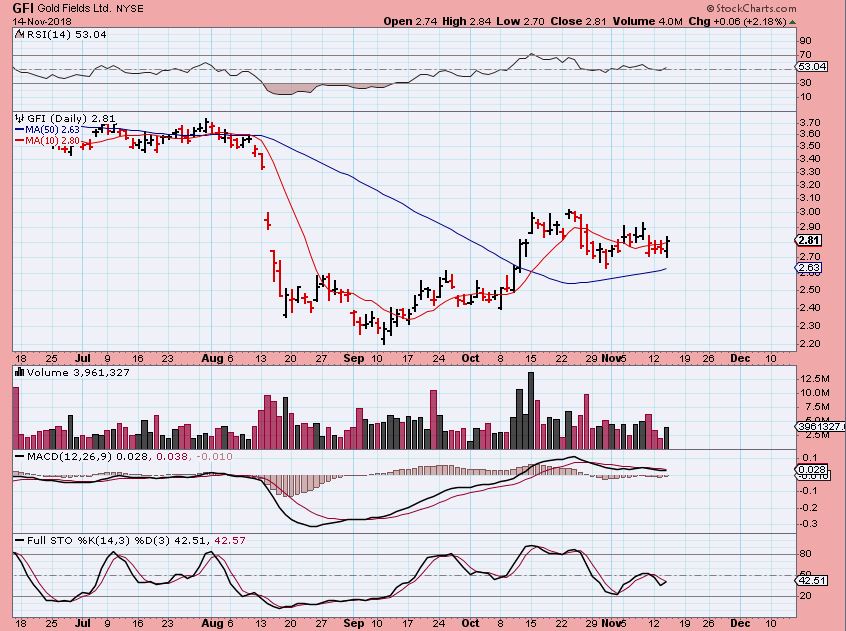
GFI – Take a look. GFI is a another junior didn’t even break the October 31 lows. Look at the RSI, riding along the 50%. This is a Bullish Junior set up, and it never even fell down to the 50sma. I would just check and be aware of when earnings might be.
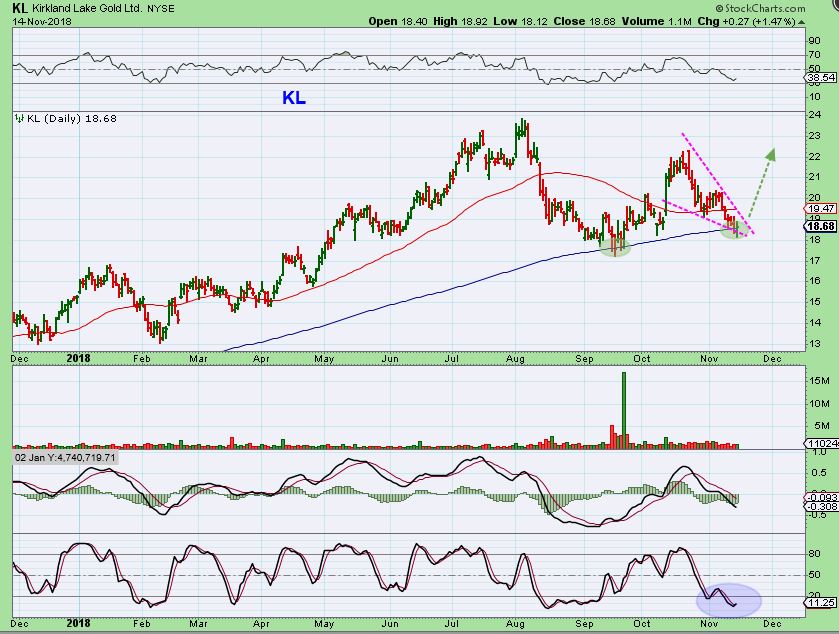
KL – KL slightly broke the 200sma as it did in September and now looks ready to move higher. Bullish above the 200sma.
.
What can we conclude from this?
.
I mentioned that I was seeing weakness in various Miners, and I was. After a few earnings reports, some Miners broke down quickly. That is the truth. Look at charts of CDE, SAND, AG, in fact many Silver stocks, and they broke to new lows. Silver & some Miners then broke down and broke the September lows, GDXJ tagged the lows. Seeing that weakness develop , I said that I was selling my leverage so that I could watch things play out. Well, after that break down, we had a quick recovery in many Yesterday. Look at this, this is what I was seeing…
.
Do you know what this is a picture of ? A weekly shake out & recovery. so far it is not ‘a break down & Sell off’, it is a shake out & recovery. That is important. Why? …
.
This Theme shot is a picture of many Miners being rescued from their fall off of the cliff. A ‘Shake out’ is when a stock falls below support, but Buyers come along & rescue it. Once they are pulled back above support to safety, they often stay away from that cliff. Yesterday, Buyers came along at GOLDS DCL, and rescued many of the sickly Miners that stumbled over the edge. And now it looks like a DCL took place in GOLD, SILVER, GDX & GDXJ too.
Yes, SILVER & GDXJ were both pulled from the grips of gravity too. It becomes a low risk entry, simply because you can buy & use a tight stop below those lows. This is frustrating buying near the lows when a shake out occurs, but for me as a trader doing this for 20 years, it is not uncommon.
What about the fact that Many of the weaker Silver stocks are at their very lows? Well, on a weekly chart, they too have reversals. Will Silver stocks rip higher & eventually begin to take the lead? Only time will tell, and they will need a break above that 10 weekly ma to show a sign of strength, so the picture is still mixed. The weakness that I mentioned in the weekend report was very real, but all things considered, we may be at a turning point…
We’ll have to wait and see, but I will say this, this has been an extremely mixed picture, and it may be designed to throw Bulls off track. Think about this when it comes to a Mixed Picture:
1. We have Miners like ABX, AU, GFI, etc that did not sell off and are remaining very bullish
2. We also have some Miners down at the very lows, below Septembers lows
3. GDX held up ok, and so did Gold
4. Silver and GDXJ broke or tagged the September lows, causing all to focus on weakness and bearish thoughts, and all of this with…
5. All of this took place while the COT was still Very Bullish ( I mentioned that as confusing), Smart Money is Bullish, and Sentiment is still very low, and not many dare to , or even want to , buy Miners.
.
All things considered side by side, It just didn’t seem to make sense, but I think that the more I examine things, that haze is starting to clear up now. It is Mixed, that is clear, but the weaker ones are currently being rescued from the cliff that they fell over. There are still questions though. What about Gold? Isn’t it just starting a 3rd daily cycle, one that could ‘Peak’ early & roll over? It is, but a 3rd daily cycle doesn’t always peak & roll over early, that may happen on a 4th and 5th. Remember Dec 2015 was Golds ICL, and it ran strong for Months in 2016. We still need to wait and see, and due to weakness this may become a SELL THE POP event for those taking a trade, but as this plays out, I see
1. Strong stocks stayed strong,
2. Silver, GDXJ, and Weaker stocks fell over & got rescued.
3. The COT is still ICL type Bullish.
Those above mentioned Miners remained quite bullish with GDXJ at Sept Lows. That obviously makes it still a bit of a Mixed picture, but it seems to be getting clearer.
.
CONCLUSION : Most of you work all day, and you do not have time to look as deeply into things. From that perspective, things could look very scary and uncertain in this choppy sector. Who would trade or want to enter this Unsafe and shaky sector at a glance? Well, I have studied this sector for hours on end recently, and I do so daily & at night. That is what I am here for, to try to figure this out and make sense of a massive set up that just doesn’t make sense. No Doubt about it, it has been a very Mixed Picture in precious Metals, sending mixed signals of GDXJ bearishness, weakness, and yet seeing strength in some of the other Miners. I just report what I see, what the charts are telling me. And Gold looked fine and Smart Money positioning also still agrees with that. As time moved forward, more & more things begin to develop and by continuing to observe things and trying to make sense of this mixed picture, it should be possible to figure this puzzle out. All things added together just did not seem to make sense last weekend, but I think that the way I am seeing things now does make more sense. Yesterday I posted that I jumped back into leverage as Silver & JNUG was pulled back over the ledge. I also grabbed NUGT, because the Bigger Miners like ABX, NEM, and GG look ready to move higher.
.
Can it stay a bit choppy? It could remain choppy until the next ICL, but entering near a low reversal at the time of a dcl does offer less risk of being stopped out with losses. You could even sell the first pop and then watch from the sidelines.
.
I mentioned in my last report that we can simply watch the bounce and decide whether we see ‘strength’ or ‘weakness’, and that is what I am doing. I am doing that with a position though. I posted these 2 charts. 1. A choppy sideways base or 2. Another leg down where JDST might be a good trade.
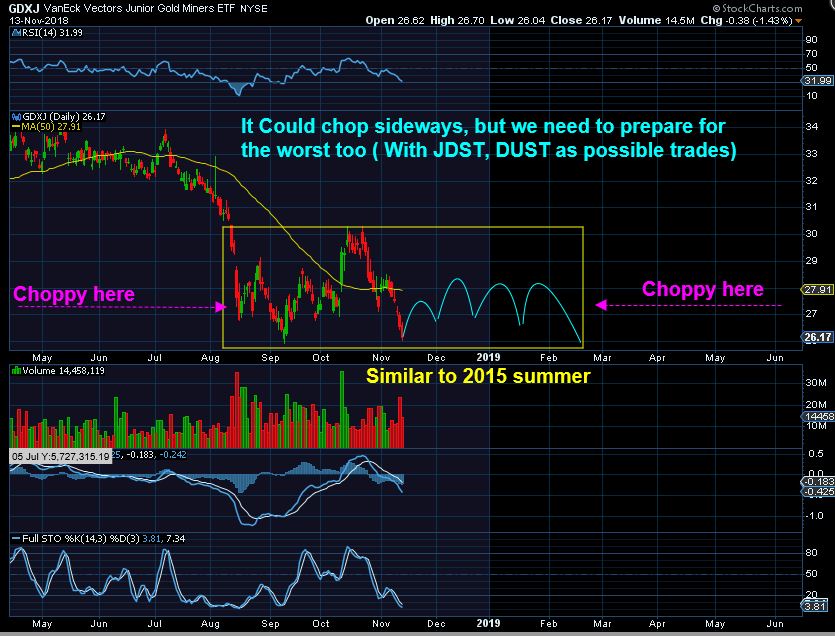
Now that I have considered all things like The Smart Money & the COT, SENTIMENT, ABX, AU, KL, BVN, BTG, GFI, etc , etc , and Shake out & recoveries, the first idea has to return to those ideas. A ‘shake them out & leave them behind’ now enters into the picture, and this other chart that was in the report is still a valid possibility. THIS would be a shake out of Dec 2017, recovery, hopefully a rally.
Let’s see what Thursday and Friday can throw out way! Do not miss the last part of this report, it discusses one last important point about what a ‘shake out’ has been known to do. 🙂
.
~ALEX
.
Look what I found…
,
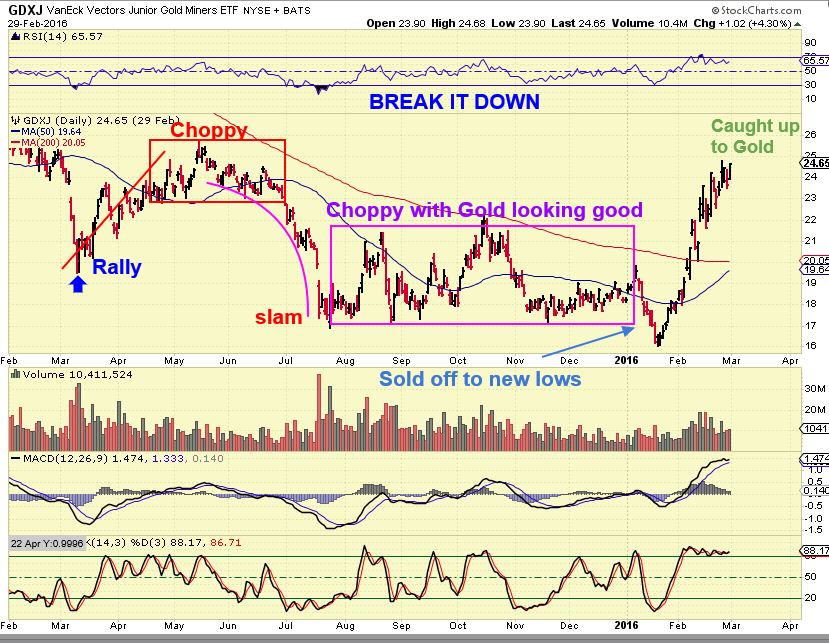
GDXJ 2016 – That January 2016 rally was actually born from a ‘Shake out & Recovery’ too, and it happened over 1 month after the Gold ICL It gets people to go short in the ‘weakness’ and then they have to cover on a recovery. You may have hears Someone recently say to me in the comments that there wasn’t more than 1 or 2 weak miners in the 2016 rally time period. This chart says that there had to have been in the Mid Jan shake out, right when the rally started. After a shake out & recovery, if Buyers step in, you get the strong rally. I decided to dissect this chart, so notice this ..
1. I see a rally higher, 2. a choppy top, 3. a Steep drop, 4. A choppy Base with a shake out & a massive rally.
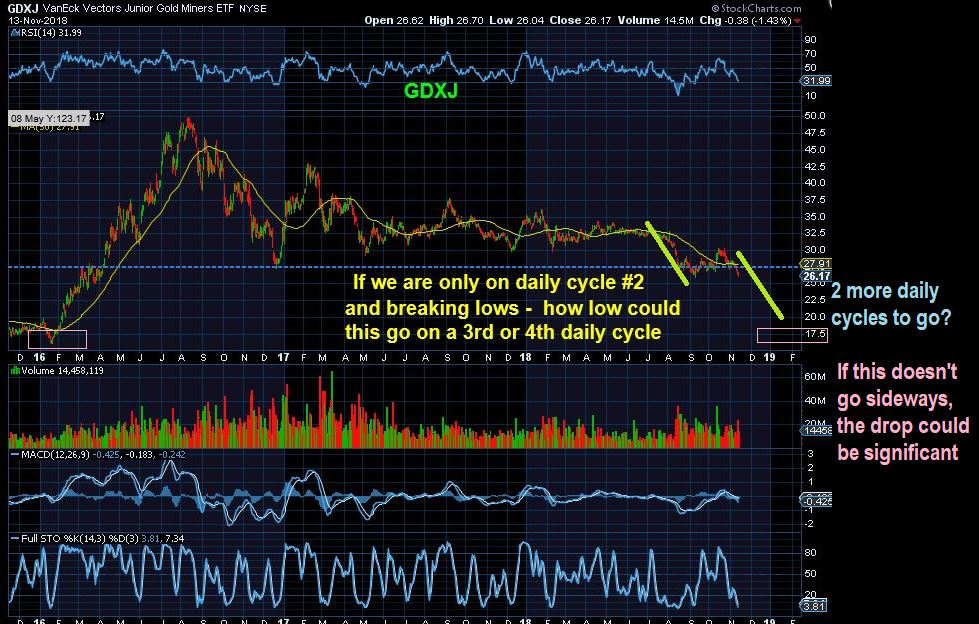
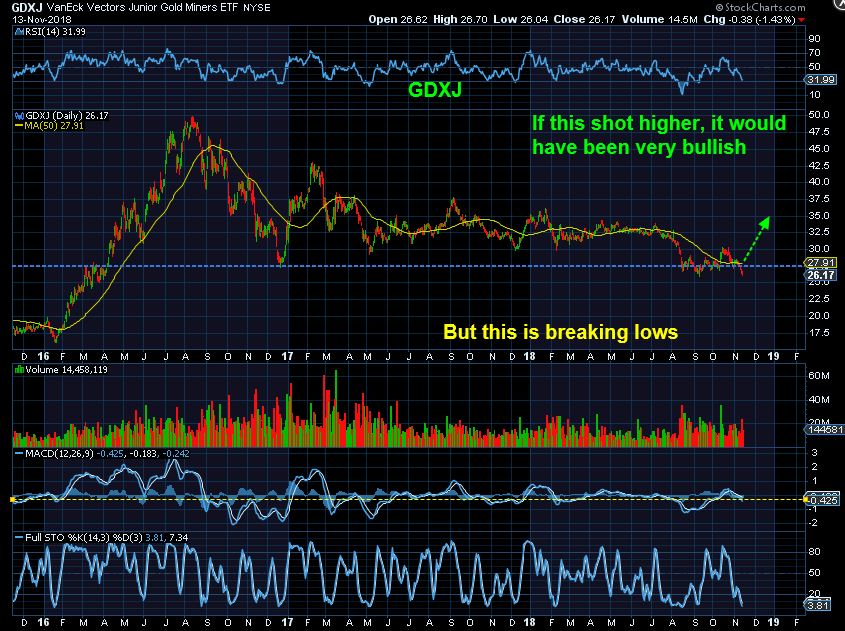
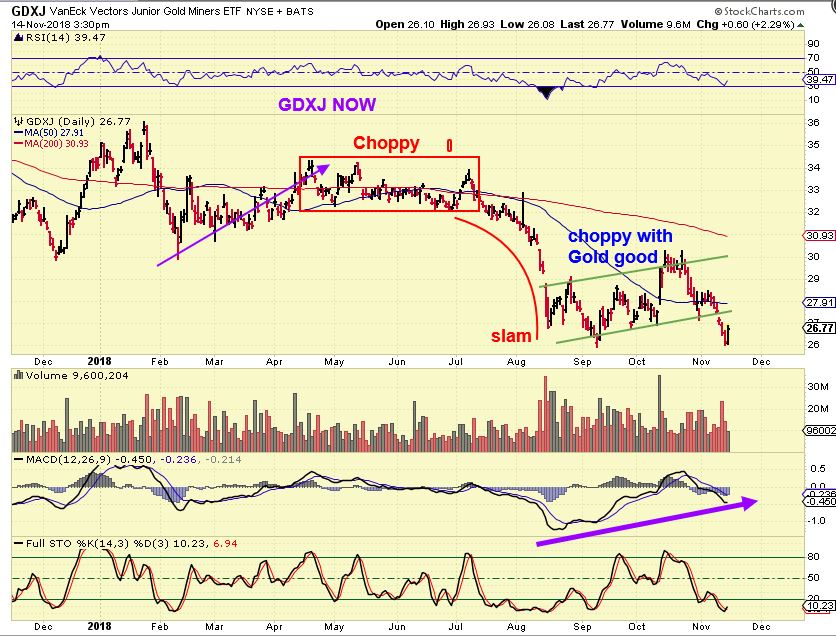
GDXJ -Right now in 2018 I see… a rally higher, a choppy top, a Steep drop, A choppy Base with ‘a shake out and possible start of a recovery. Will that be followed by a rally? Scroll up to the 2016 chart and back to this one….broken down this way, These are not very different, are they? It is what I will now label as a ‘ CHOPPY BASE, SHAKE OUT ‘ Trick.
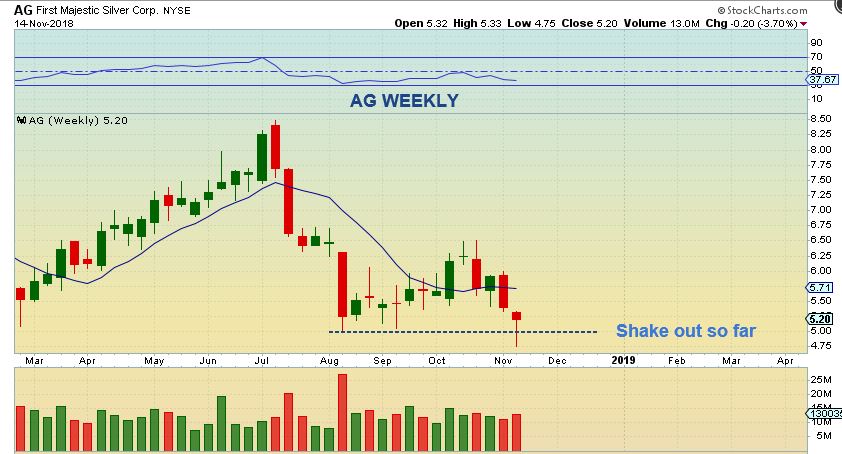
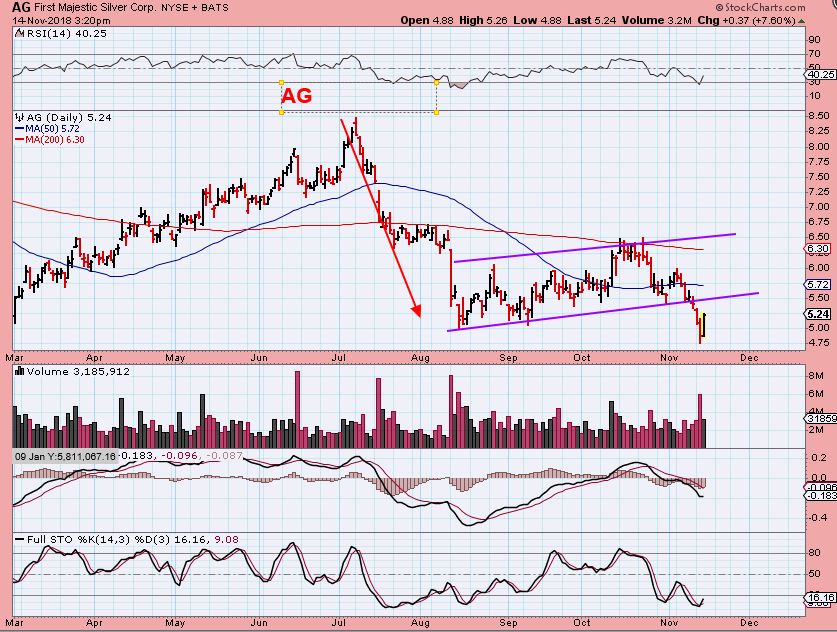
AG – hey look, a run higher, a steep drop, a choppy base and a shake out… We just need a recovery. Everyone wanted AG when it was above $7, but I bet that it is hard to find anyone that wants to buy it now, and it was $4.75 Tuesday.
GDX – Even GDX did the shake out in 2016. GDX was stronger in this recent sell down. This GDX chart looks similar to AG above too.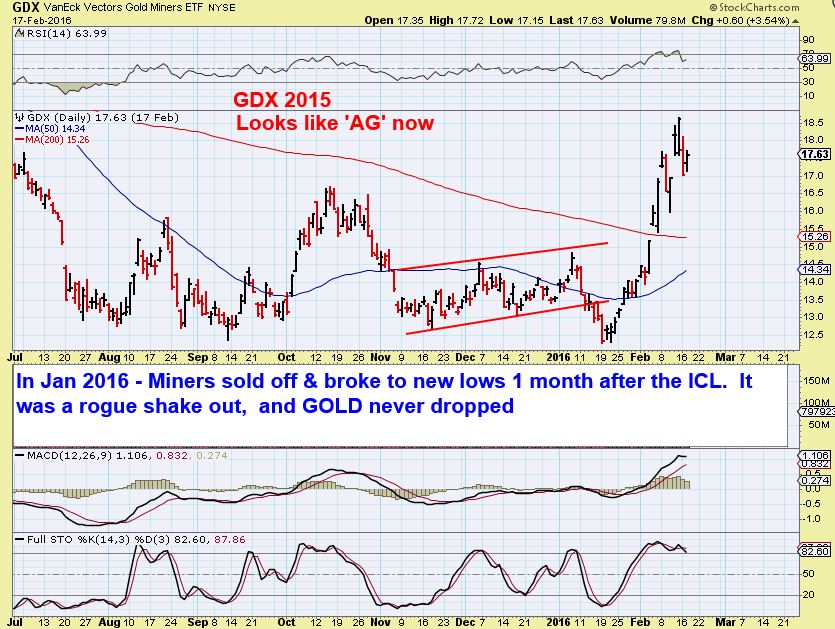
Conclusion to the shake out: I am not guaranteeing that we now get the exact same rally out of the shake out lows as we saw in 2016. GDX, HUI, XAU, and GDXJ Themselves did not break the recent lows, but several Miners have. GDX, GDXJ broke the Dec 2016 Lows. I doubt that we can rally the same way 2016 did, because at that time it was a special set of circumstances that in my eyes are different from the current set up. I am also not saying that the choppiness is over, this ‘base’ could still be a complex base that forms until the next ICL, but what I am saying is that the picture is getting much clearer. The Bullish resolve looks to be in tact. Yes, we could rally strongly from here, and this could be only the second daily cycle for GDX. A move above the 50sma is bullish in Technical Analysis. I have taken a position to watch this ‘bounce’ unfold, and I will go from there.
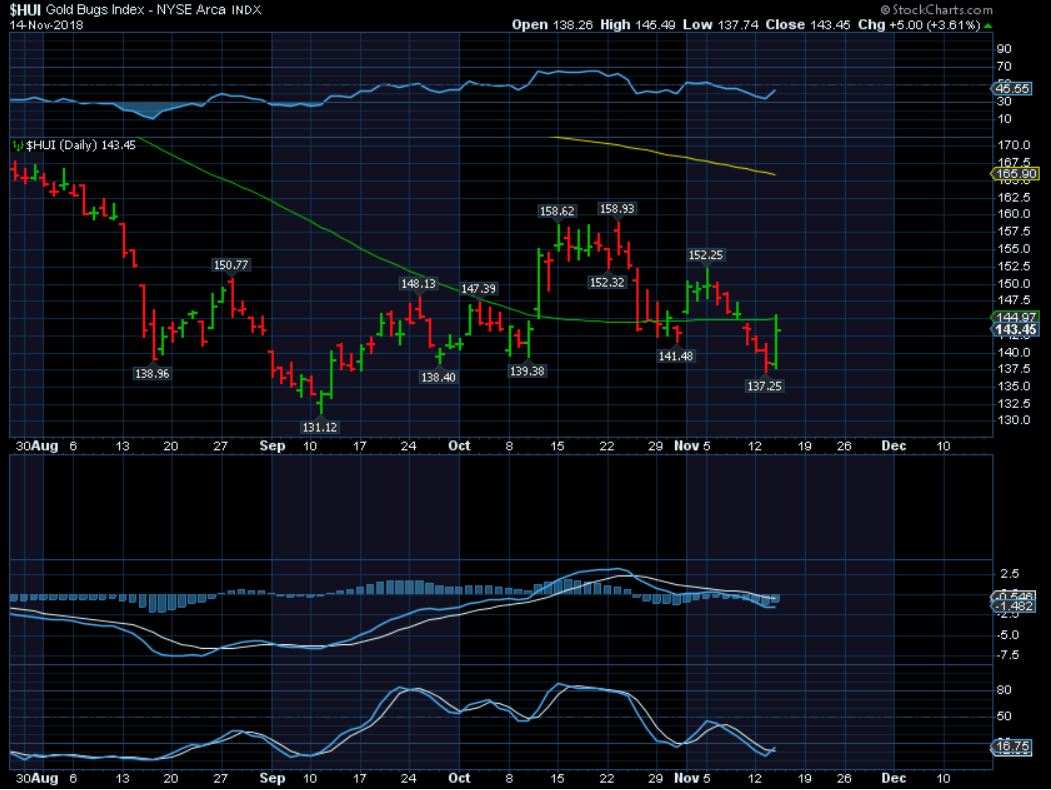
GDX, GDXJ, HUI, XAU – Weakness or shake out. Time will tell.