
Wednesday – Oil Did What?
It certainly looks as though Oil has entered the capitulation phase of a sell off into an ICL, and a low is very near. I want to discuss that as a future buy opportunity in this report, but first we’ll do a market review. Just to reiterate: In just about every sector, Trading remains very choppy. That can be a bit frustrating or even a bit damaging if position size isn’t kept small, stops aren’t honored, etc. The sidelines are not a bad place to be until the dust settles a bit.
.
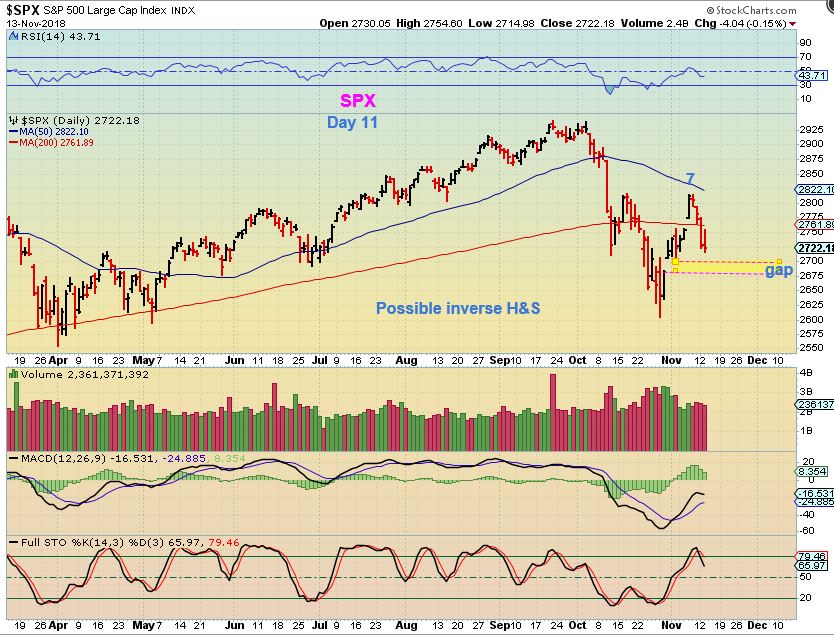
SPX – Rejected at the 50 sma on a bounce, so far this peaked on day 7. We now have a possible inverse H&S, but the open gap below could draw price in for a gap fill.
Copy/Paste from Yesterday where I discussed the a-b-c drop here as possibly complete- and that would be an ICL, and it was a buy with a stop below that low. That stop could have been raised after the rally started. I wrote yesterday:
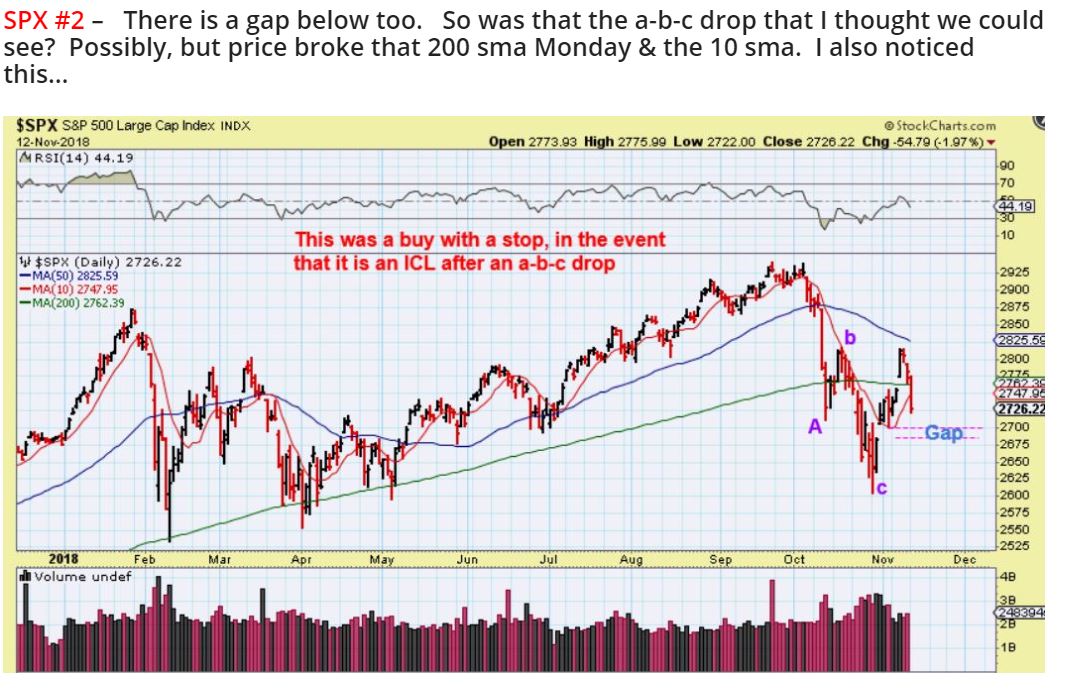
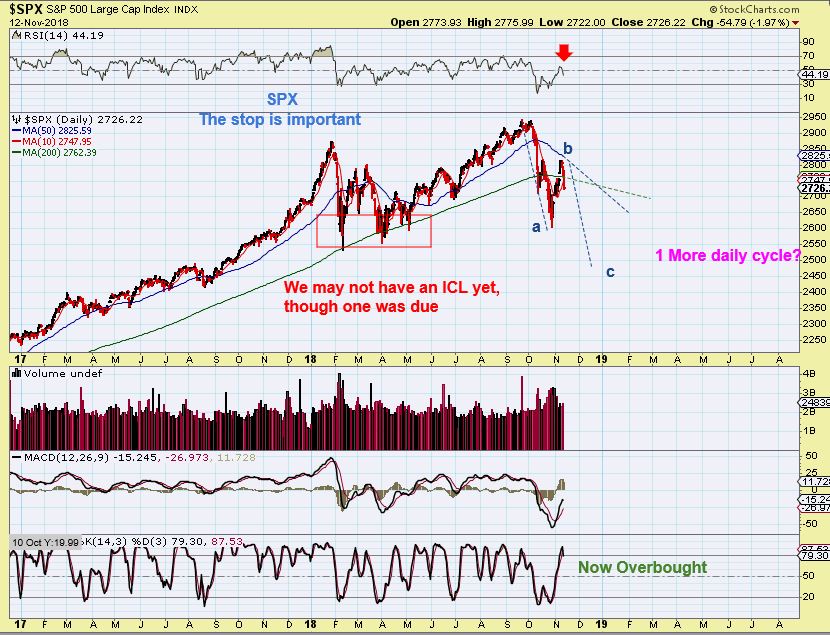
And I went on to point out that there is a chance that the selling hasn’t completed and a bigger picture chart would have this daily cycle eventually roll over to new lows, with ‘c’ ( The ICL ) below. So using ( or raising) stops in important. And again, I keep pointing out January through May- That was just choppy after the sell off.
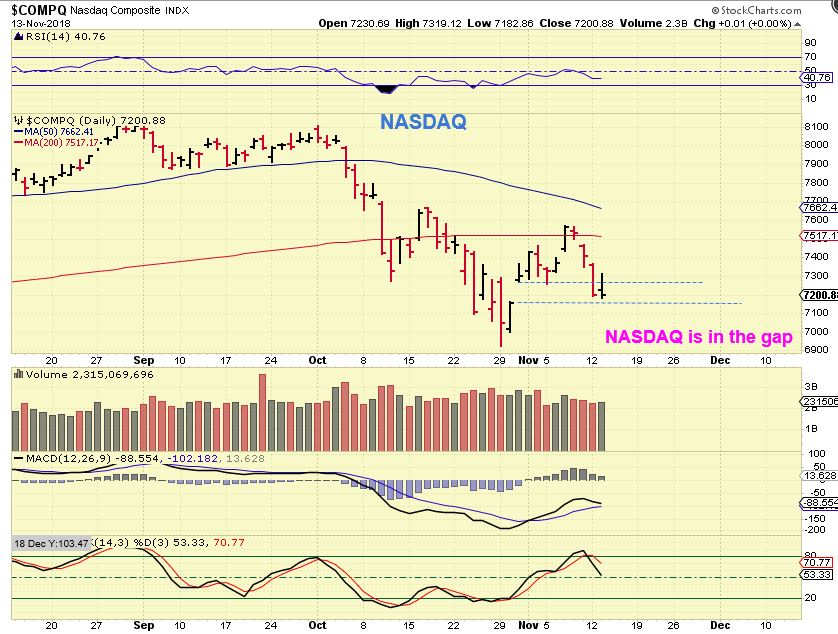
NASDAQ – The NASDAQ is in the gap. If this remains weak, choppy, and under the 50 & 200sma, the selling may resume during this daily cycle and break new lows. That deeper a-b-c could be next. It is tough to tell at this point, but we are DUE FOR AN ICL to be in place now.
IWM WEEKLY – Even if this is an ICL, over time and a few daily cycles, the intermediate cycle can eventually roll over too, after a back test. We’ll look for signs of ‘strength’ or ‘weakness’.
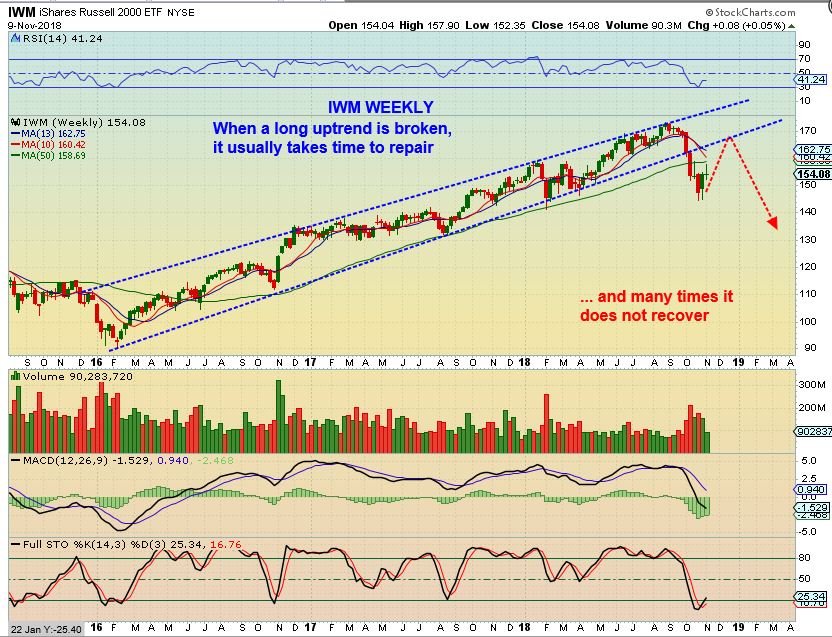
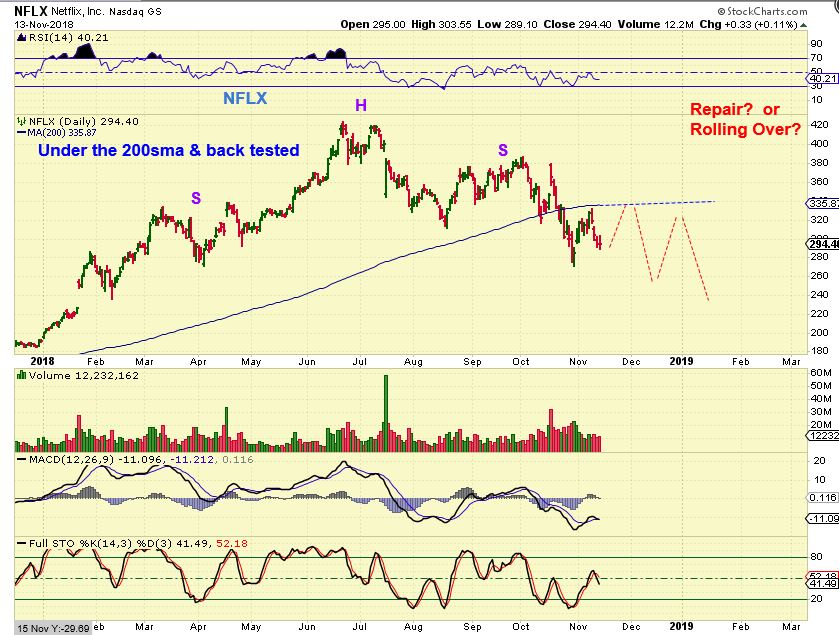
I look at so many chart ( And will continue to do so for our benefit) and just see Damage trying to repair itself, and that often takes time IF it IS going to repair. Look at GOOG, AMZN, FB, even AAPL. Other smaller leaders were SQ, TWTR, SAIL, AQ, MU, CY, etc. These charts are not the beautifully bullish charts that they were, and this can lead to a lot of choppy repair work or failure. I will look for continued weakness or signs of strength going forward, but this has been choppy, as expected. No V-Bottom for the General Markets.
.
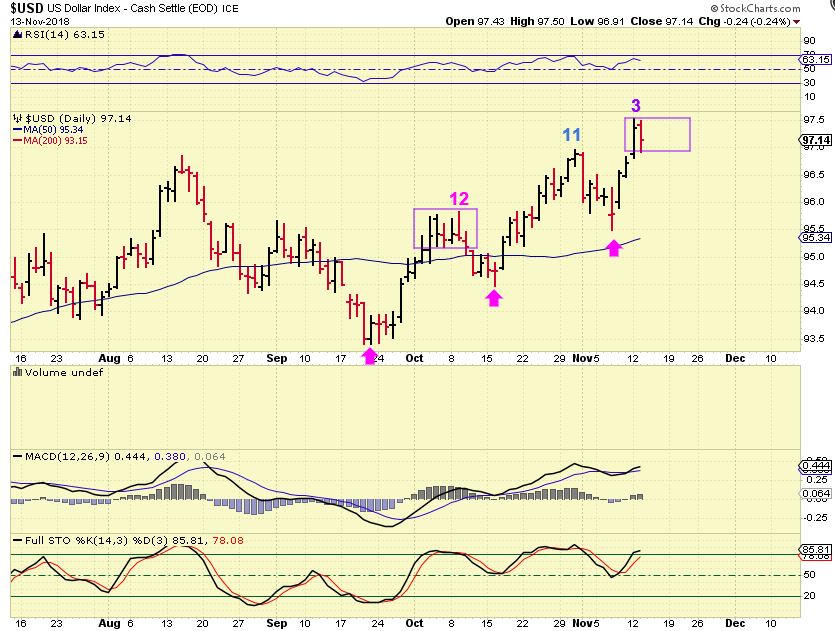
USD – This is only day 3, but a 3rd daily cycle can become the top, so this could slowly begin to peak.
5 CHARTS FOR OIL – OIL ENTERED ‘FREE-FALL”, and a low should be close.
.
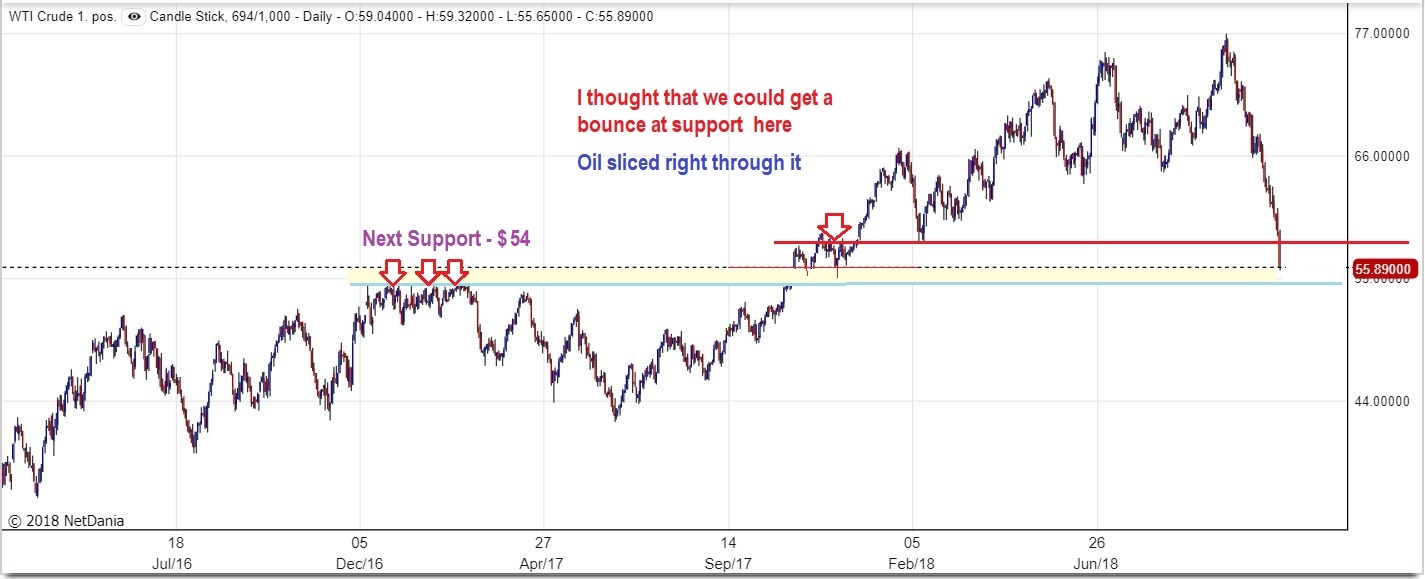
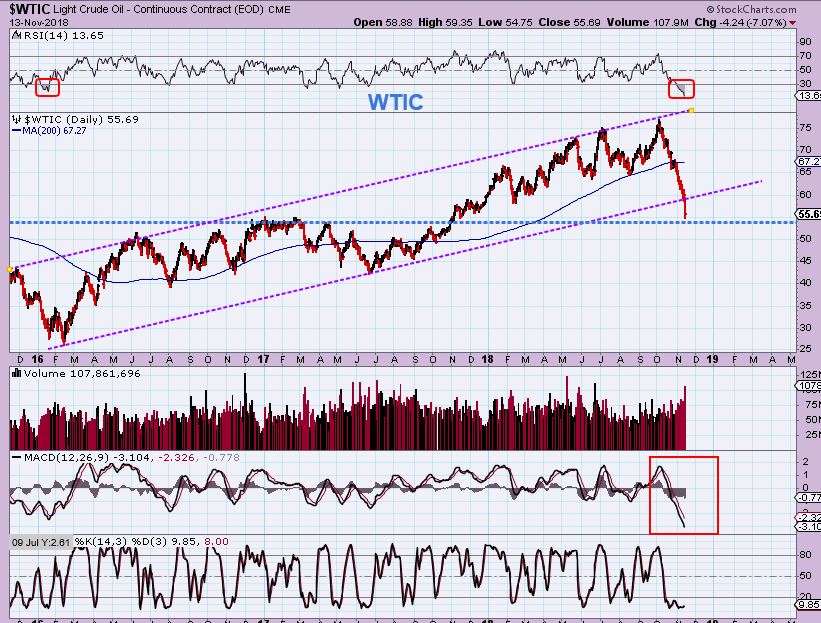
WTIC – I expected that small support area to give Oil a bounce as support, because we were on day 60, but it sliced right through it. We are over 60 days deep and this was the 12th straight day of selling. The next solid support should be $54ish. We are just about there.
WTIC – This chart shows how oversold it is approaching that support ( but they can extend, we need a reversal).
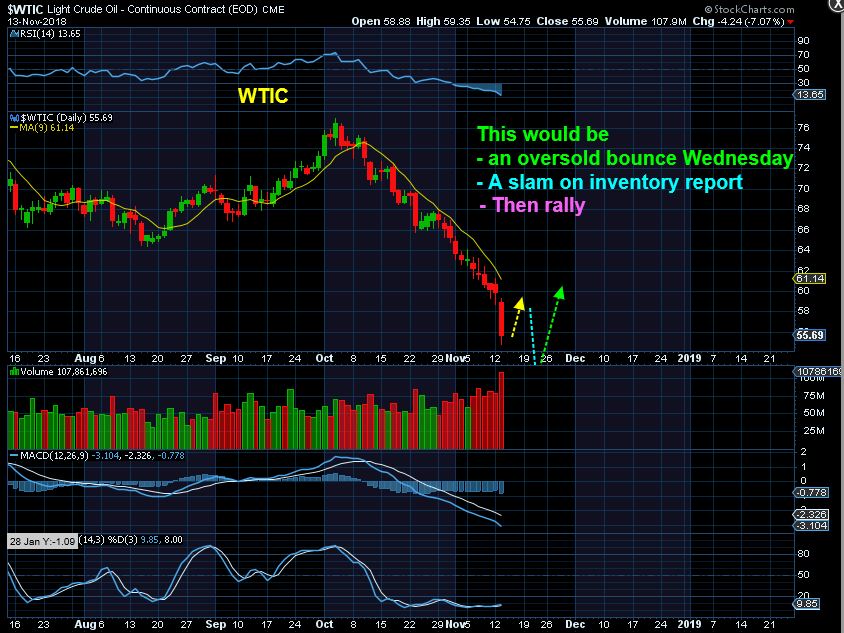
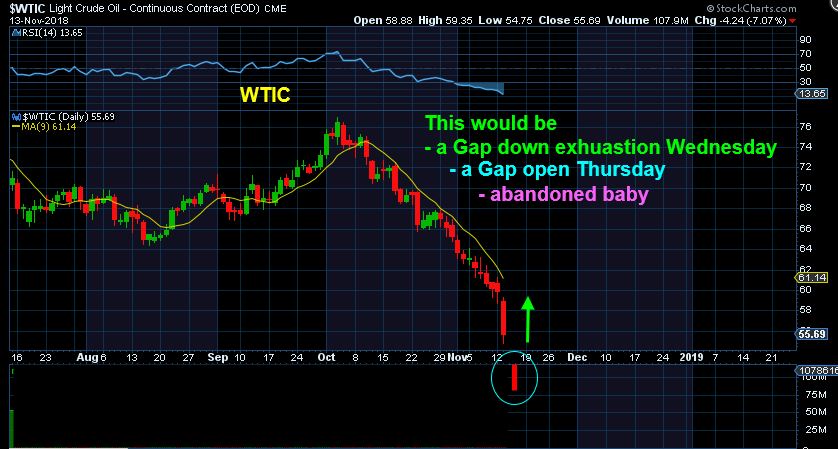
** I thought that we could see an Oil reversal at the oil inventory report. I was informed in the comments section ( thanks ‘LittleTimeLeft’) that due to the Monday Holiday in the U.S. – The Oil inventory report has moved to Thursday. I looked it up, and that is correct. So will we reverse before that report? It is hard to say, so below are 2 ideas of what we could see as Oil seeks out a low around that report over the next 2 days…
.
WTIC – We could ‘bounce’ Wednesday, and then do a final slam ‘shake out’ Thursday at the inventory report, and then rally higher.
WTIC – We could gap down Wednesday ( and even Wednesday & Thursday) and then take off higher. Oil is stretched though, so when a reversal low forms, I think it will eventually V-Bottom.
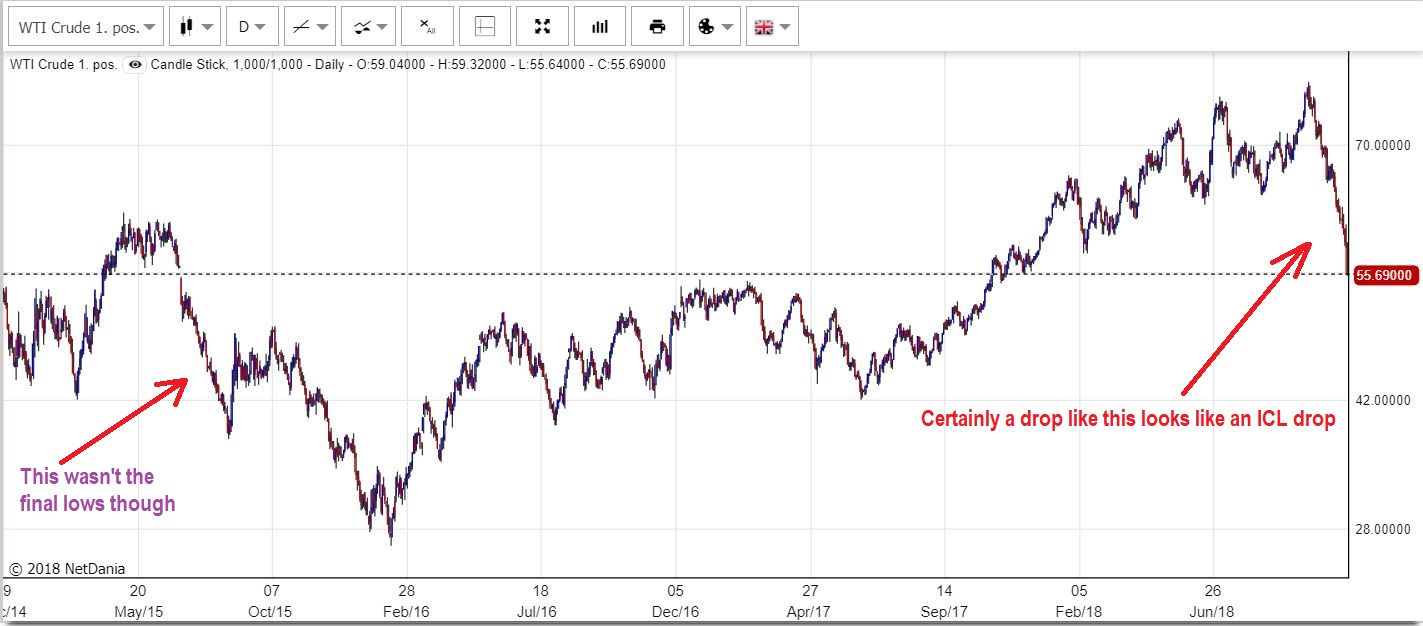
So we are looking at what I expected to be an ICL, and this has been a raging sell off, so it fits the description, but I looked back and saw something that was pretty interesting. This caught my eye…
.
WTIC – After this monster sell off in 2015, the sharp V-Bottom rally was immediate,but then it slowly stalled, went sideways , and eventually rolled over into another sell off, bringing price much lower ( Bear market). THIS WOULD BE DEFLATIONARY. Not good for Commodities, so is Oil going higher after this ICL or will it stall? If it stalls, I’d like to remember this chart.
I bought DWT (Short Oil) in October around $5 & sold if for a $1 gain. It has since doubled. I sold that way too early, so If we get another drop like 2015, I will recommend DWT buy & hold for a month.
.
PRECIOUS METALS
.
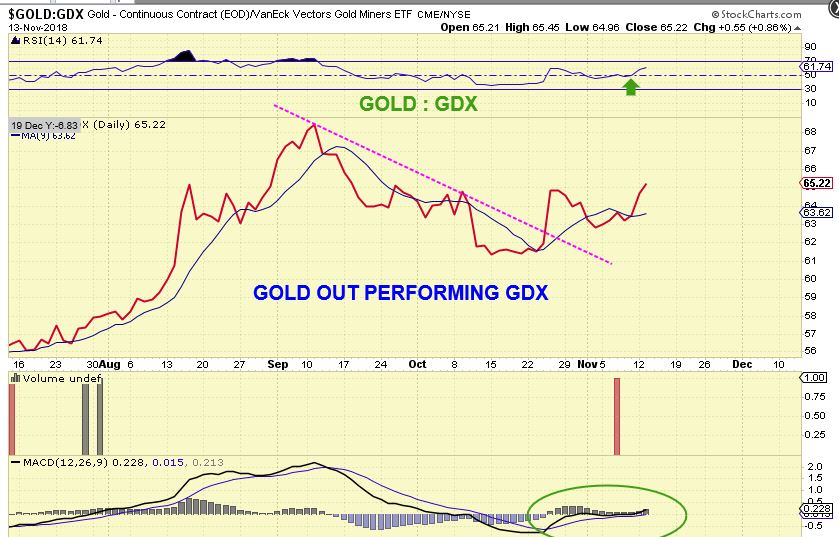
Once again, GOLD is outperforming MINERS. Not a Bullish Scenario.
.
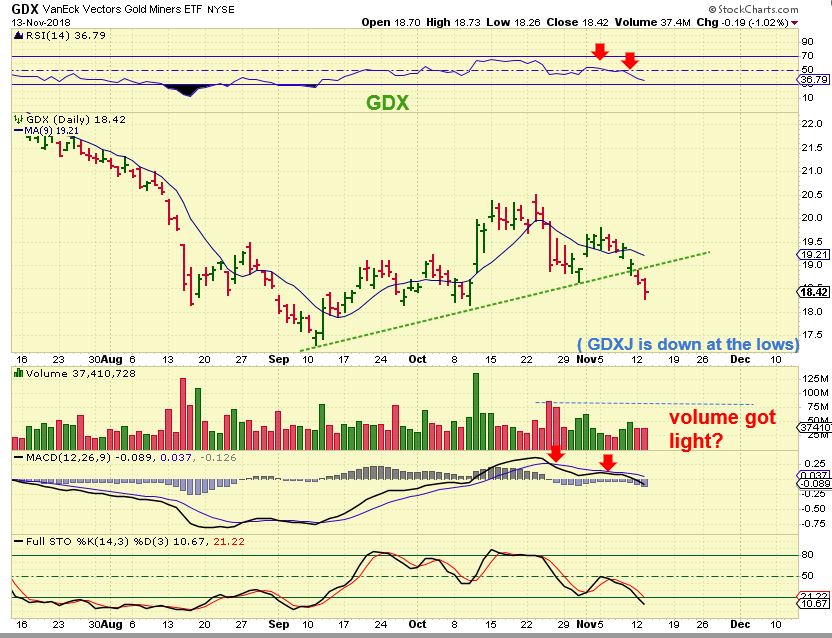
GOLD : GDX – Gold out performing.
GOLD – Gold has closed under the 50 sma, Miners look worse. Gold is coming due for a DCL and should bounce soon, but as a 3rd daily cycle with Miners breaking down, I’d now expect a weaker bounce. 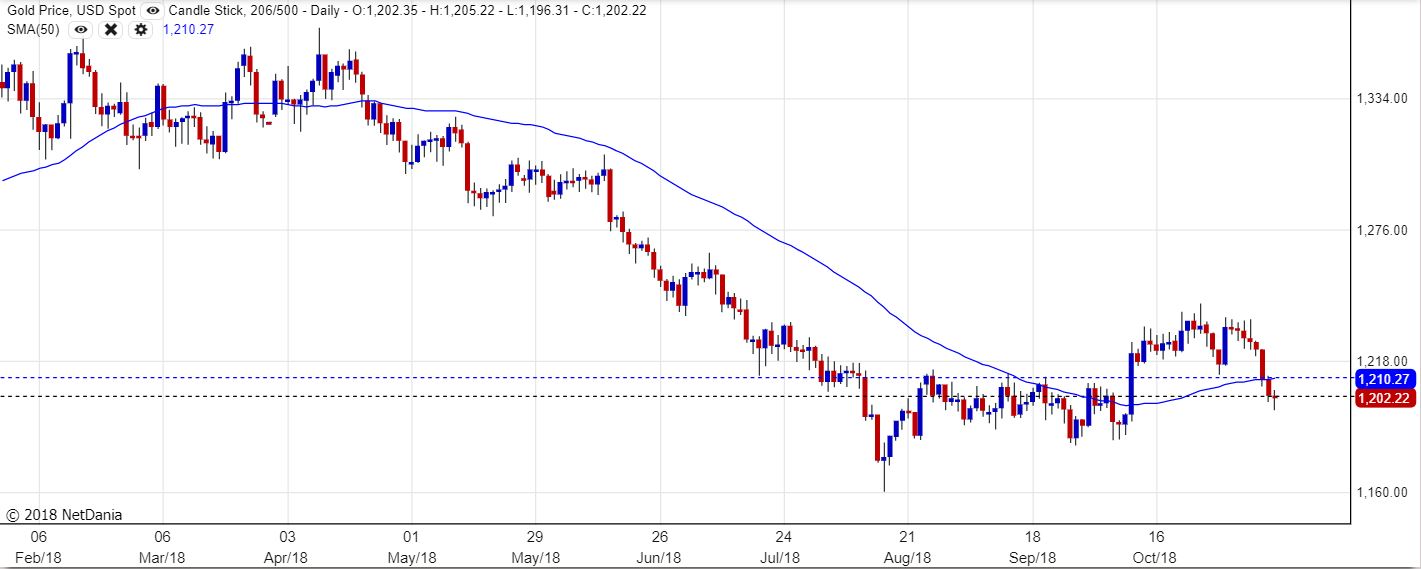
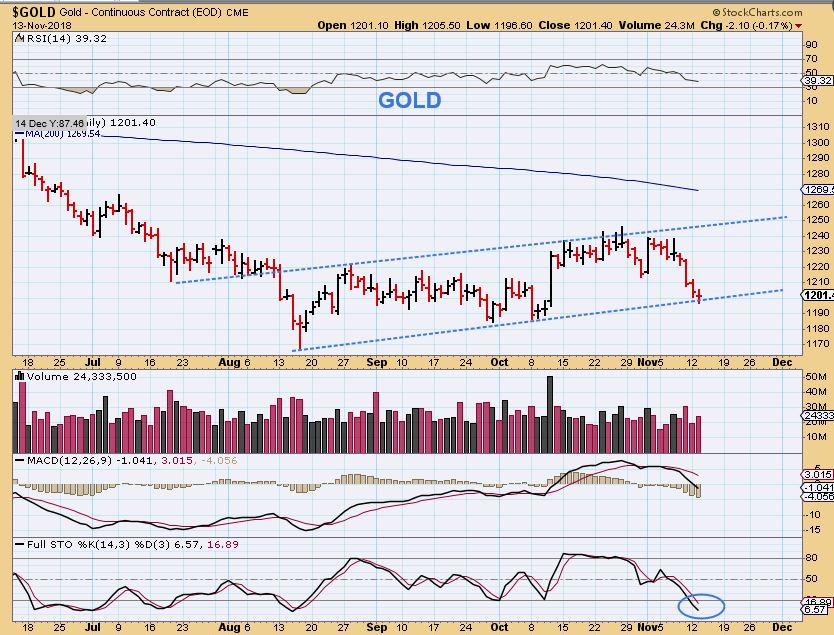
GOLD – It remains in this channel and again, even the Gold chart looks healthier than Miners at this point. After just a couple of additional days of selling, GDXJ is actually now back at the ICL .
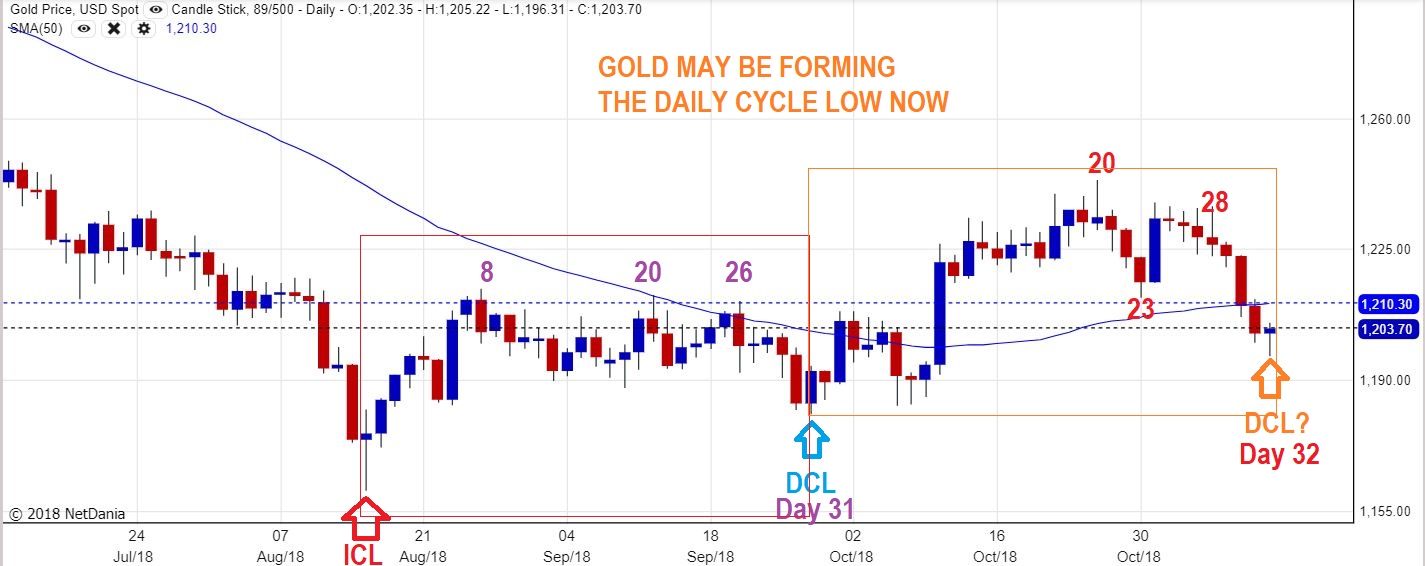
GOLD CYCLE COUNT – The first daily cycle was 31 days long. This one is 32 days so far, and we do see a reversal candle. A dcl could form here, but we wont know until we get a swing low. I do not expect this 3rd daily cycle to power higher & rally now, because the Miners are looking weaker day by day.
.
MINERS:
.
GDX – After the weekend report, GDX has been selling off, breaking the uptrend. The Cycle count for Miners is very well hidden and undefined.
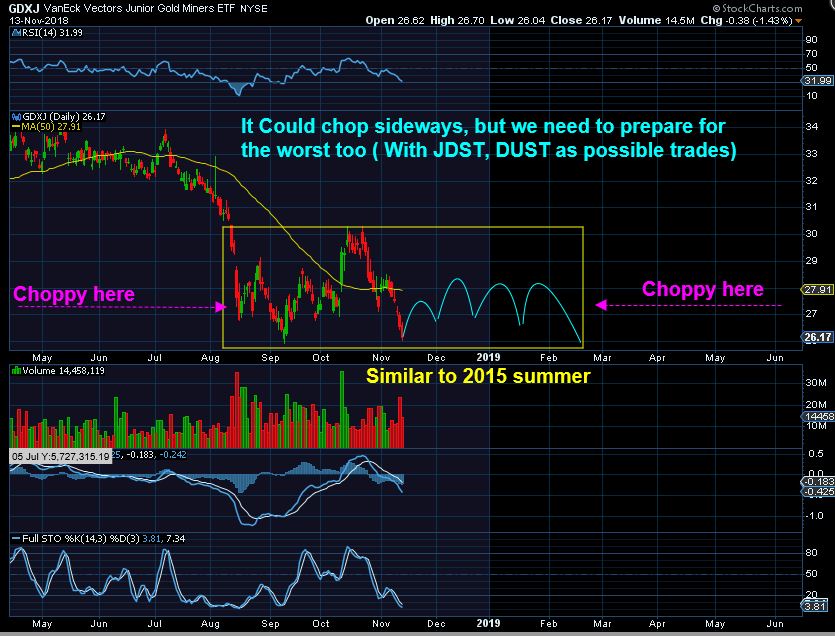
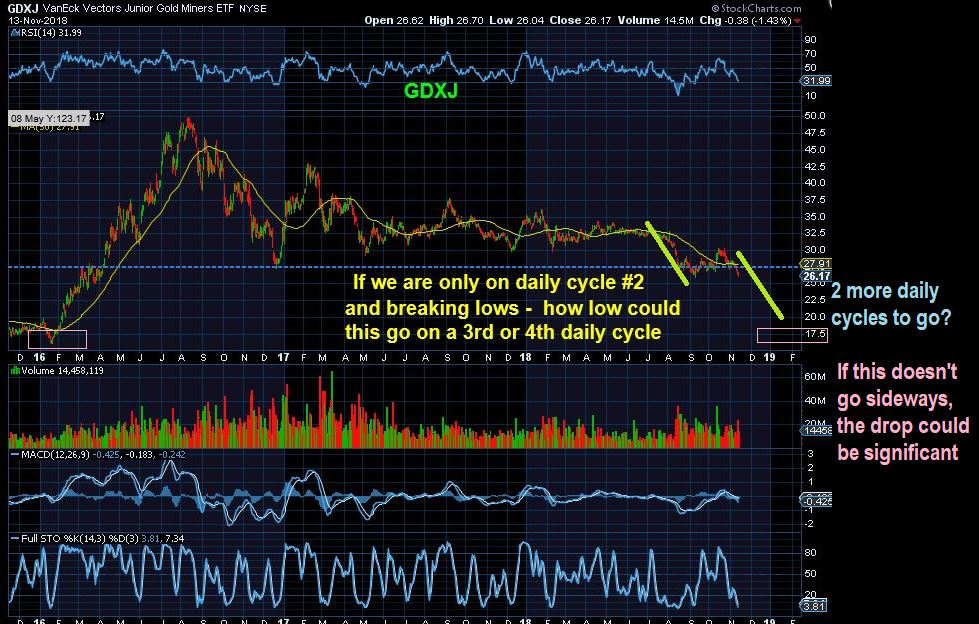
GDXJ – GDXJ is already back at the lows? This can chop sideways , similar to that complex base in 2015, or it can really drop after the next daily cycle peaks. This may be a perfect candidate for JDST, after the next bounce. I was looking at the Big Picture and it has changed drastically with GDXJ at the lows on the 2nd daily cycle. Lets take a look…
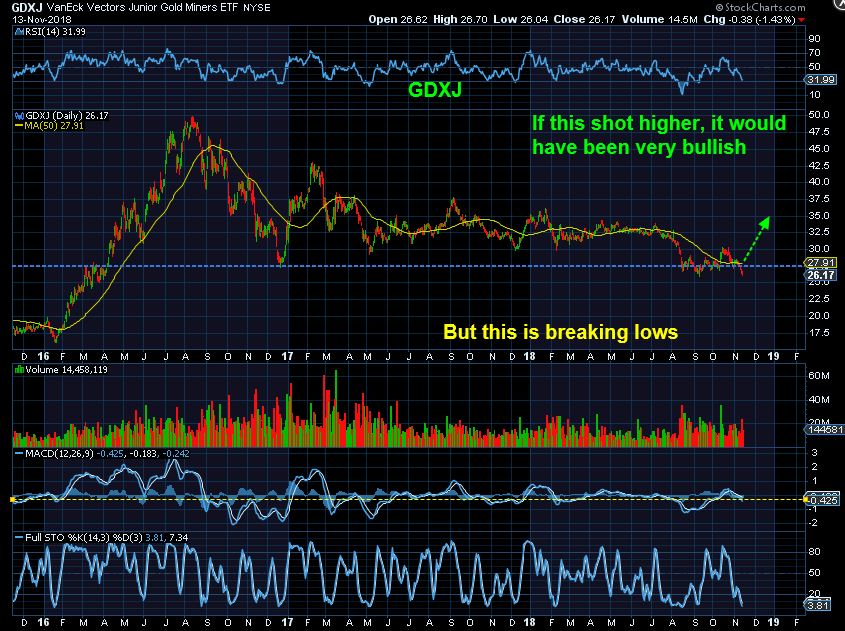
GDXJ – all summer this looked like a great base, shake out, and possible rally like a rocket. Now?…
GDXJ – At the lows in a 2nd daily cycle, this really could sell off and get ugly fast *( ugly unless you bought JDST or DUST after a bounce). I hope that we do get a good bounce for that reason, to possibly short it. Now is not the time to make that decision however, because choppiness has been keeping things without real direction (Except for Oil). I will be watching any bounce closely. Please read the chart.
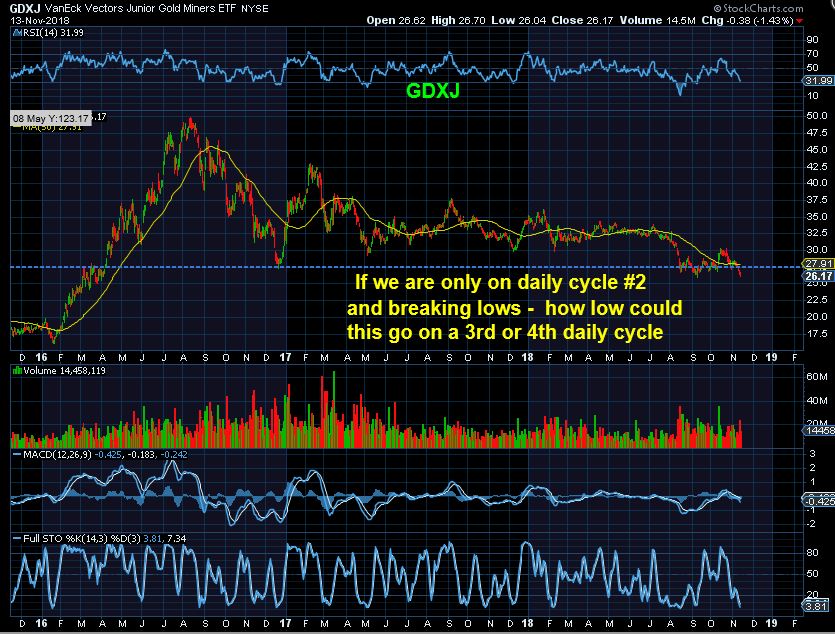
Can I really rule this out? I cannot rule that out, because we did NOT get the strong rally in daily cycle 2. If this doesn’t move higher soon and just chop sideways, it threatens to drop into the next ICL as another deep drop. This would be a JDST trade, but we need more time / evidence of prolonged weakness. Please read the chart.
Conclusion: I see a few nice Bounces here and there, but I do not see a lot of ‘set ups’ that look reliable for a buy & hold yet, or like something that we can get sustained moves out of. Everything from Tech, to Biotech, to Miners has been choppy. Sitting in cash or mostly cash with small trades is a position too, a defensive one until things stabilize. I do think that OIL is going to eventually snap back rally, but the bounce out of the lows may be swift and short lived. The selling for Oil is extreme and at a support level, but these things can extend, so if you want that trade, wait for a safer entry. A swing low with a stop.
The sell off in Oil really escalated and makes me wonder about Golds eventual peak & drop into the next ICL. I would much rather see a long choppy base, and I will discuss Long Choppy Base in the charts below. The chop has been a bit frustrating, and I have given back a lot of gains in Shippers and MJ stocks . I am mostly cash and in this chop I also gave too much of my gains back.
.
Enjoy your Wednesday trading, or sit it out until something concrete shows up.
.
~ALEX
SIDEPOINT: NATGAS has been one long & Choppy base, but it did break out recently. I haven’t posted trades for NATGAS, because it gapped open from my entry point. After gapping higher, it has now rallied in an extremely strong manner and I actually think a parabolic top is actually very near. It is like NATGAS & OIL Are inverse to each other.
,
Below are UNG & UGAZ – A parabolic top is forming, and as a trader I may take a personal trade here , I MIGHT short this soon, but I want to wait for the right time. I do not want to recommend it for all of my readers. THIS IS VERY HIGH RISK IF YOU ENTER AT THE WRONG TIME, but I thought that I would point it out for my high risk traders to put on their list.
DGAZ is a 3x Bear NATGAS ETF now at $4ish, and it has been selling off deeply as UGAZ has ripped higher. I do think that this is a parabolic top area for Natgas, so it will Pop & Drop eventually. To The Charts…
UGAZ is actually up $66 in Premarket!! WOW, this must be a topping area. 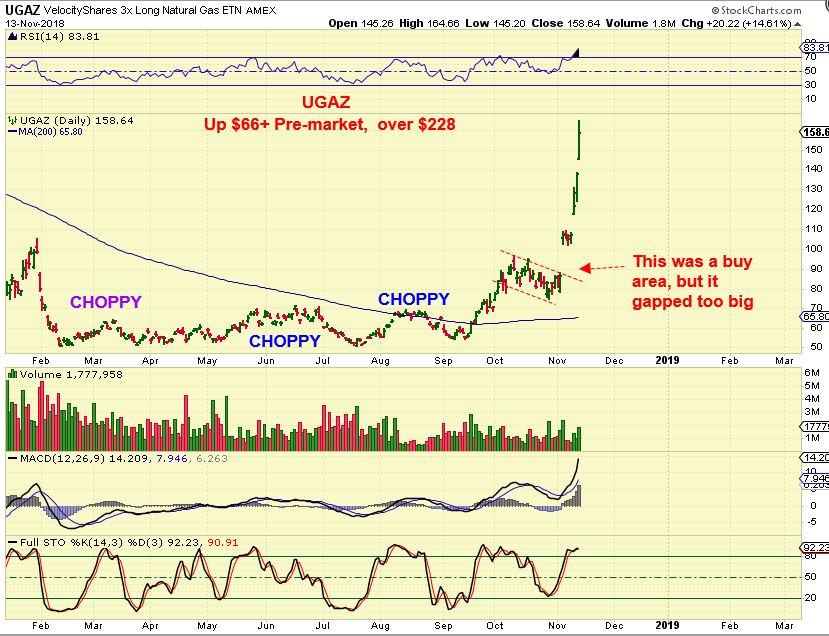
I see UNG UP over $4 in Pre-market!! This has to be a parabolic top. GAP GAP GAP. EXHAUSTION, CRASH is the way these usually play out.
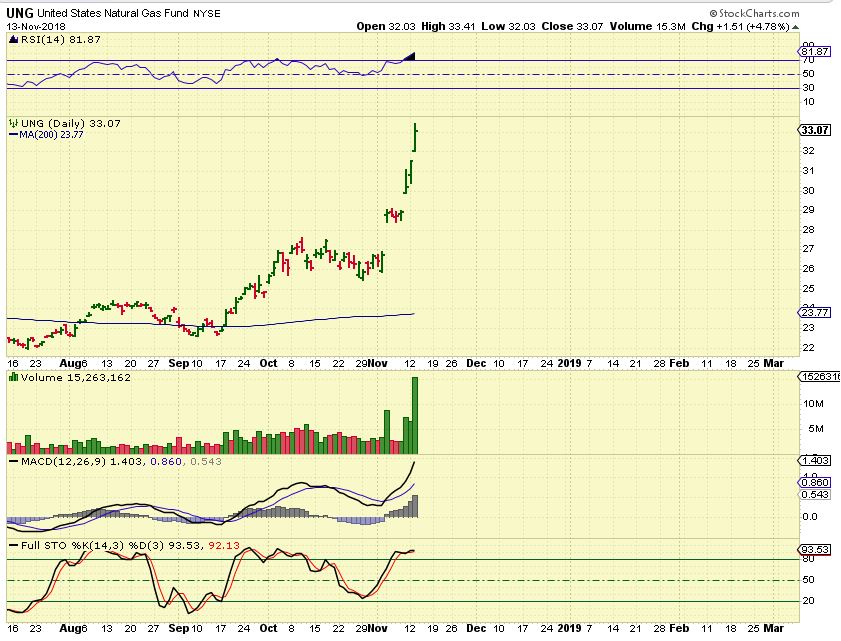
AS A DIFFERENT THOUGHT: As you can see, These choppy bases can be very Bullish. This was a frustrating 2018 for Natgas until September, right? Well, this is what I thought we would get in Miners. It is still possible, if they continue to chop sideways into the next ICL…
Just imagine the Chart above of UGAZ being Miners, choppy & frustrating for a year, and Everyone saying, “I’m done with Miners. They are weak. This is horrible. I wont trade these again!!” – and then you see this in GDXJ as it leaves you behind. I will continue monitoring Miners going forward the way I always do.
It is possible that the choppy & frustrating year for precious metals eventually breaks to the upside, at the right time.

