Let’s Discuss Some Upcoming Changes
Once again, not a lot has changed from the expectations that we have had for a while now, but I do believe that we are now very close to some changes. Let’s discuss that…
SPX – I mentioned that day 52 could be a last engulfing on Monday. This would lead to a reversal. So now we are on Day 53 ( or day 1), we are very due for a swing low. A break over the 10 sma would confirm a swing low and a dcl. I actually believe that the lows are in place. 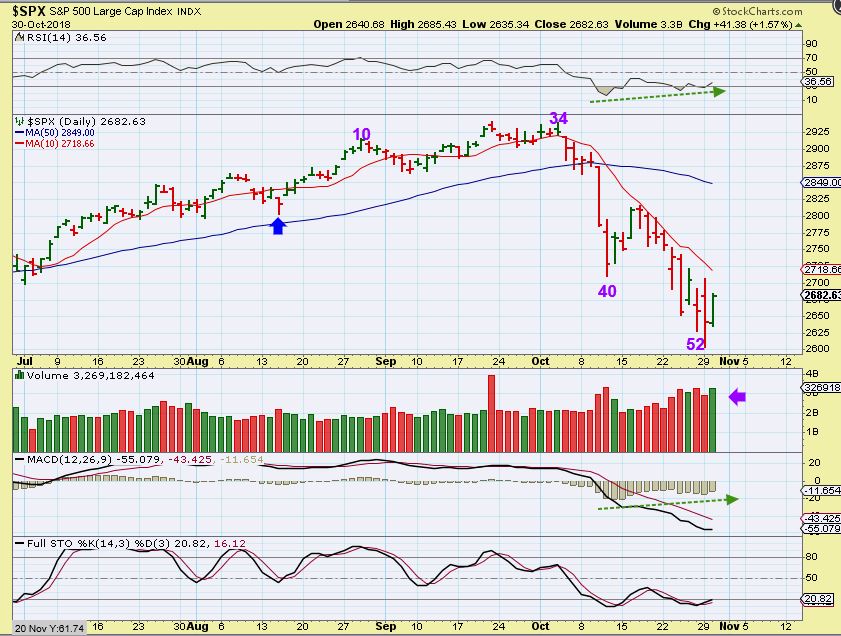
Some may want to trade leveraged ETFs to get some bang out of a move from the lows. That would be UPRO , TNA, TQQQ, SOXL, etc as leveraged trades after a swing low forms, and others may want to look at ‘stocks’ that are looking bullish after the sell off. I looked at SQ since it ran well last time. It has a reversal at the 200 sma, and that looked good. Stocks like TWTR and TSLA have already been running against the wind. I may point out a couple of ‘stock picks’ after lows form.
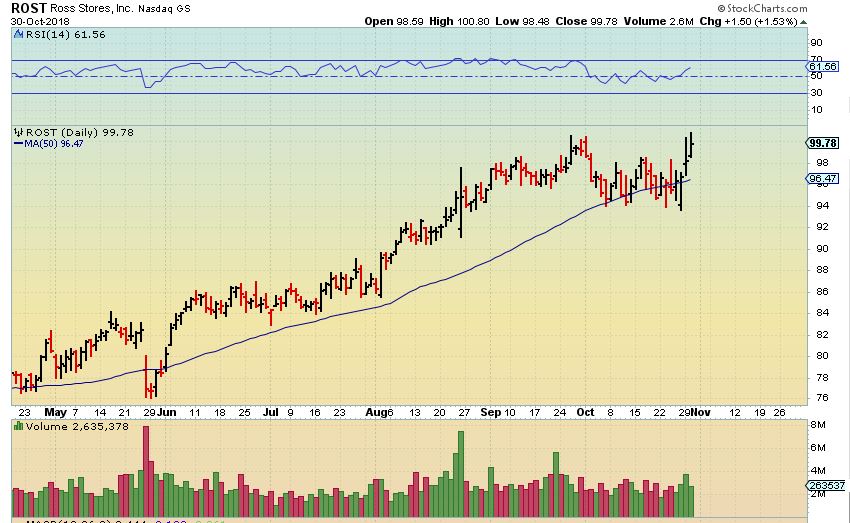
ROST – And ROSS STORES! This is at the highs with a market selling off?? How Bullish is That!! This looks ready to break out, and has to be considered bullish under current markets conditions.
UUP – UUP had 1/2 the volume on Tuesday that it has had recently. The measured move of UUP has been reached, but it can extend. Basically, this has been a strong run, but may be getting tired.

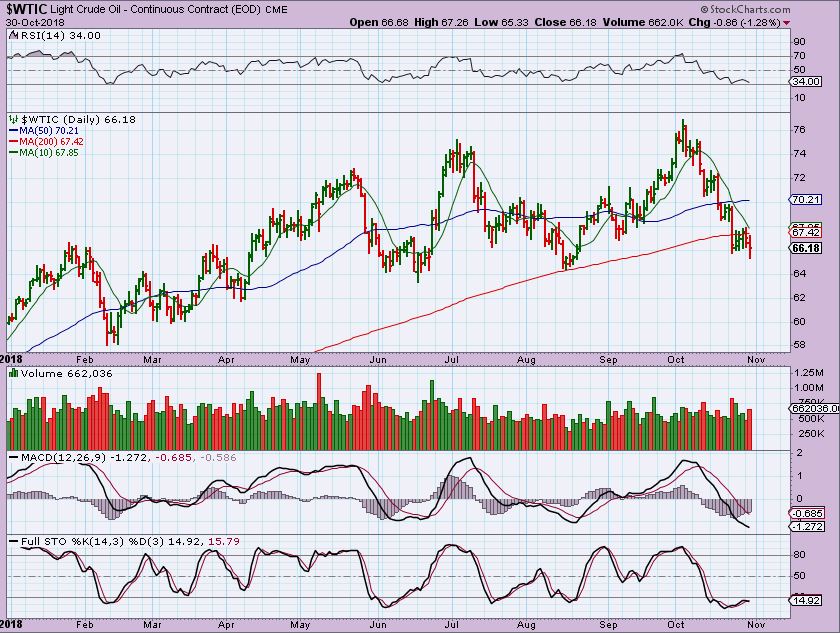
WTIC – Yesterday I pointed out another bear flag on day 51, with price rejected at the 10 sma again.
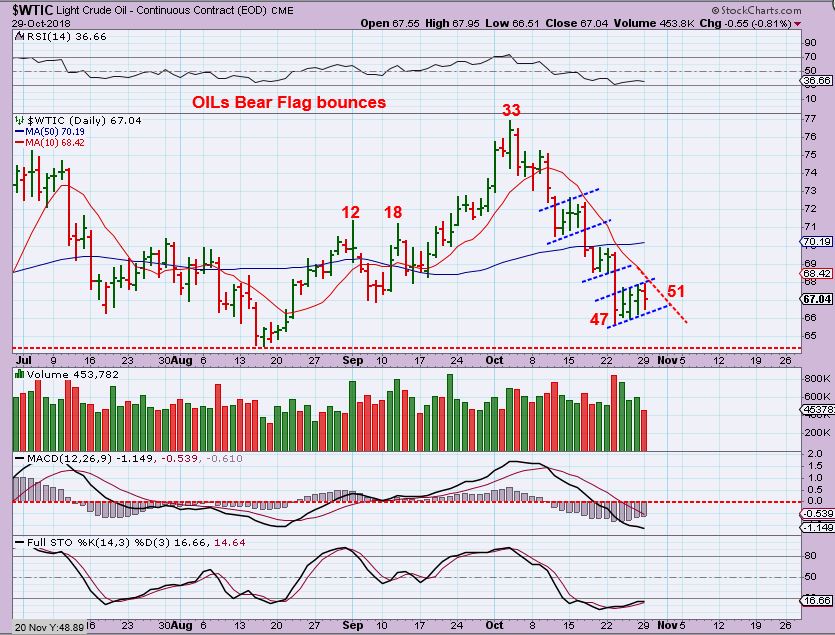
WTIC – Oil broke down Tuesday and is now below the 200sma, but this could be a shake out. We are deep in the timing for a swing low here too. Since Oils daily cycles can run for 50+ days, the next daily cycle could actually run higher for let’s say 20 days or so, and still be Left Translated. That is 4 weeks, so Oil stocks may be trade-able. See the following charts…
IF OIL MOVES HIGHER FOR 20 DAYS, THAT IS 4 WEEKS. SOME ENERGY STOCKS MAY MAKE GOOD TRADES AFTER A SWING LOW FORMS. LETS REVIEW A FEW IDEAS.
.
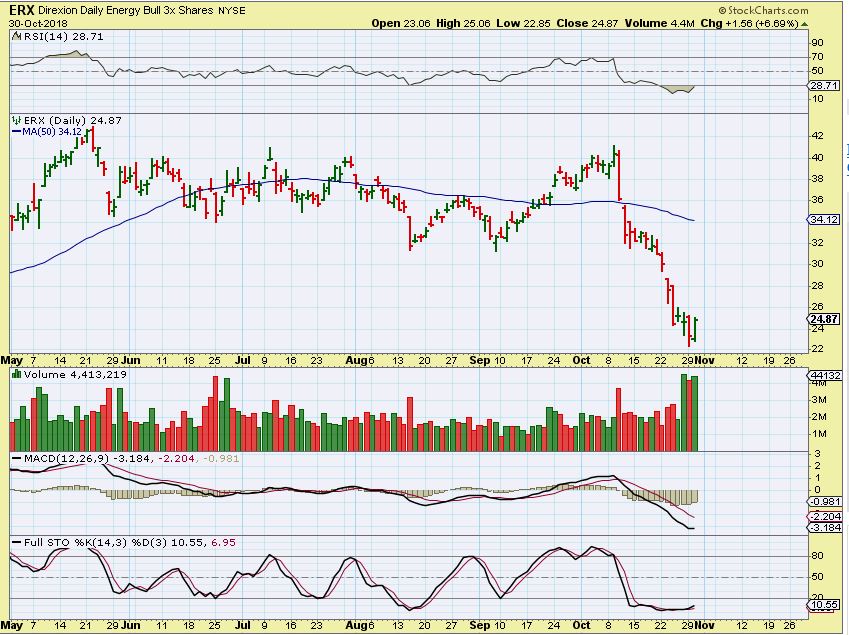
ERX – This is a 3x etf for The Energy Bull. This could be the high volume lows forming. Even a mere run to the 50sma would be $22 to $34, but as a 3x – it could do more than that.
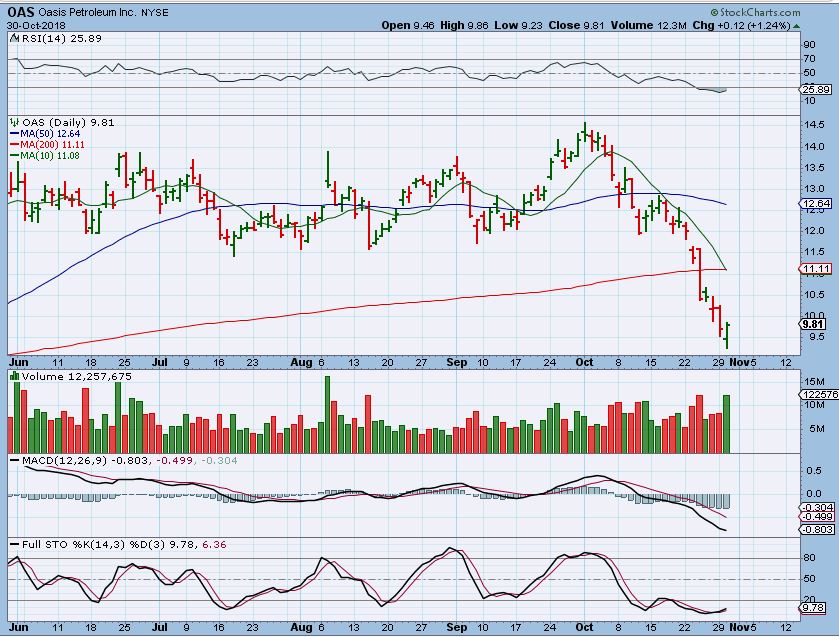
OAS – I was looking at ENERGY Stocks in the morning, and pointed out how drastically they have nose dived. I was looking at OAS, LPI, WPX, etc etc. and I was watching, because we are expecting a reversal in Oil. I would expect these to snap back, even if it is just a bounce. OAS FILLED A GAP TUESDAY, see the chart, AND THEN …

OAS– IN the afternoon, RALPH mentioned the reversal on 2 oil stocks, so I re-visited these. OAS has a strong reversal. I do see some overhead resistance, but it may be able to make it to the 50sma, and that is a big move. Or…
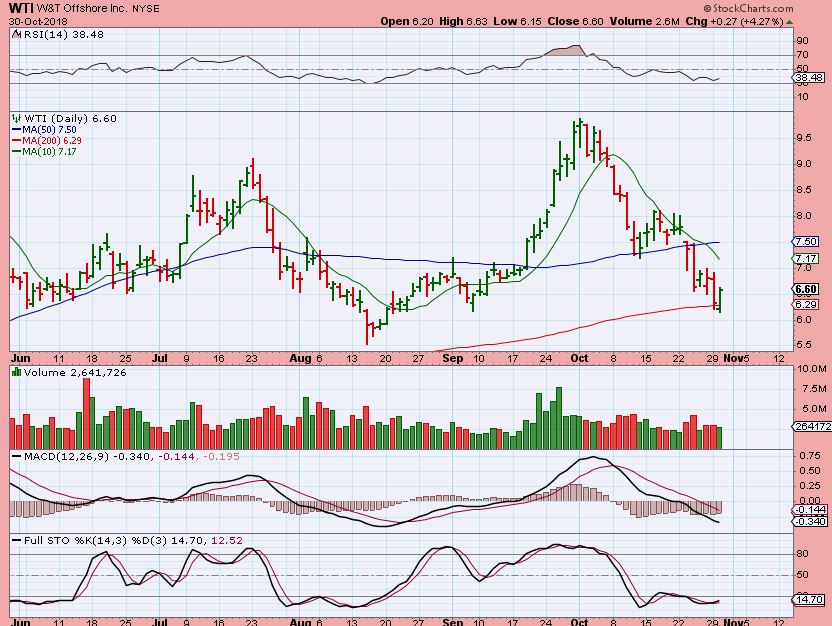
WTI – This is a reversal right at the 200 sma. In August , WTI ran to the 50sma, dipped, and powered through. It could do something similar again.
DNR – Look how badly some of these have sold off. The Gains from April to September were wiped away in 1 month! That is a reversal on DNR, and it is very oversold. Next chart…

DNR –
I have drawn 2 possible paths, and either one has great gains at the 50sma.

LPI – This is a brutal 1 month sell off. A ‘Bounce to the 50sma is also about 50% retrace of the drop, and should be a good trade too.
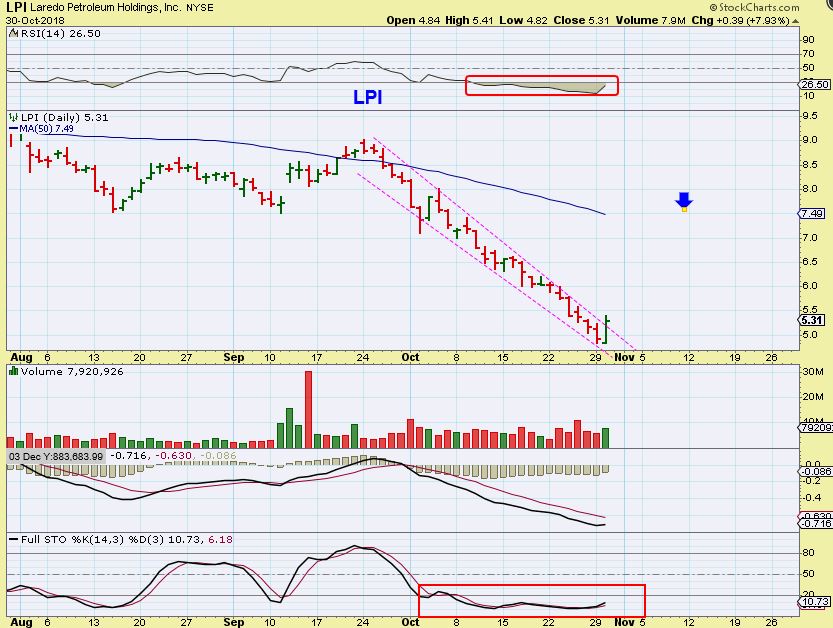
LPI is VERY oversold, but I do want to add a caution: Some moves out of the low do a V-Bottom, others base out or meander…
LPI – Look at the AUG to September move, so it may just bounce around like this, but being that oversold, I think it could just bounce higher.

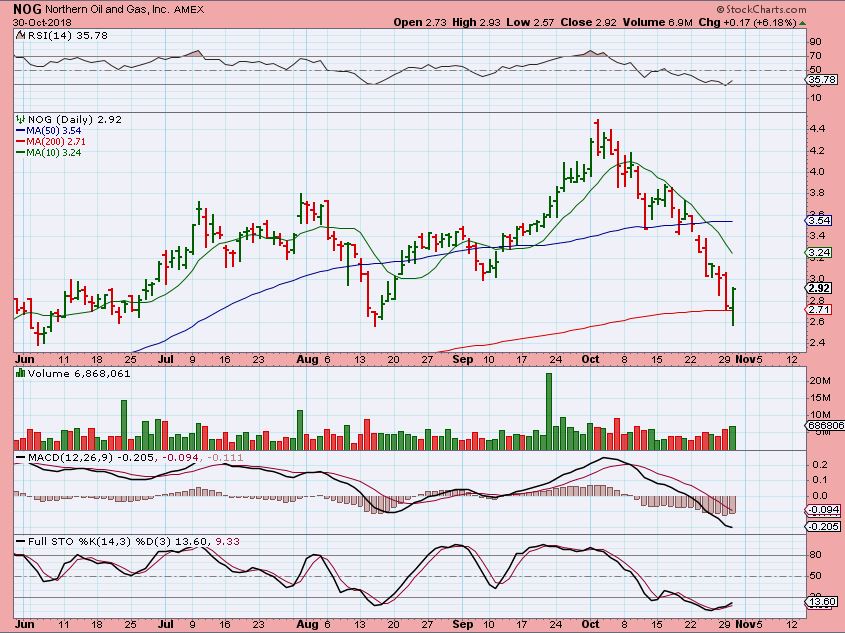
NOG – Another reversal at the 200 sma.
SO THIS IS MY THINKING: We keep seeing OIL drop after the Wednesday inventory report, but on day 53? We must be very close, and these Energy Stock Reversals could be indicating that we might see a change this time. A swing low could form in Oil . NOTE: I AM NOT PERSONALLY TAKING OIL TRADES, I AM IN SHIPPERS & MINERS.
.
THE FIRST 2 CHARTS WILL BE THE BASIC REVIEW
.
At this point, you really only need to know the first 2 charts
.
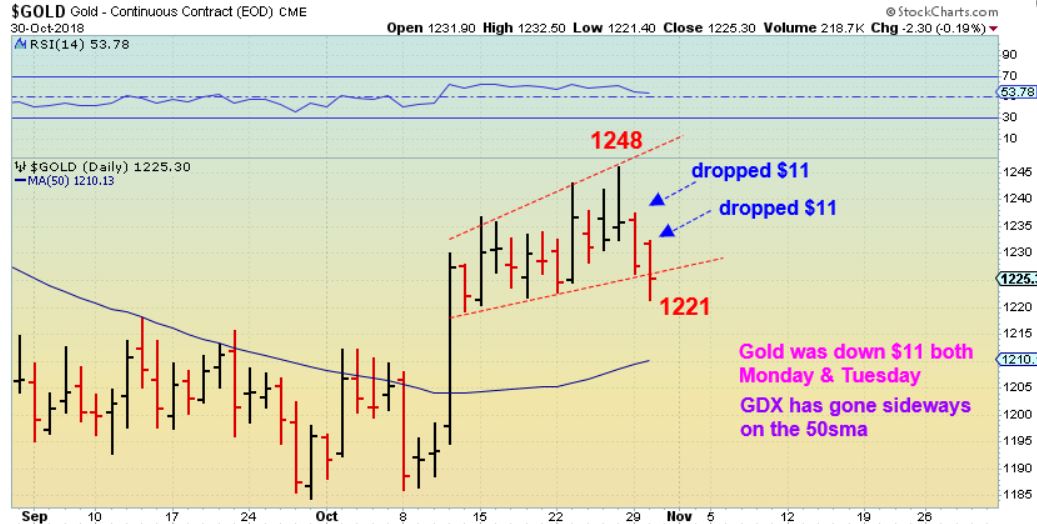
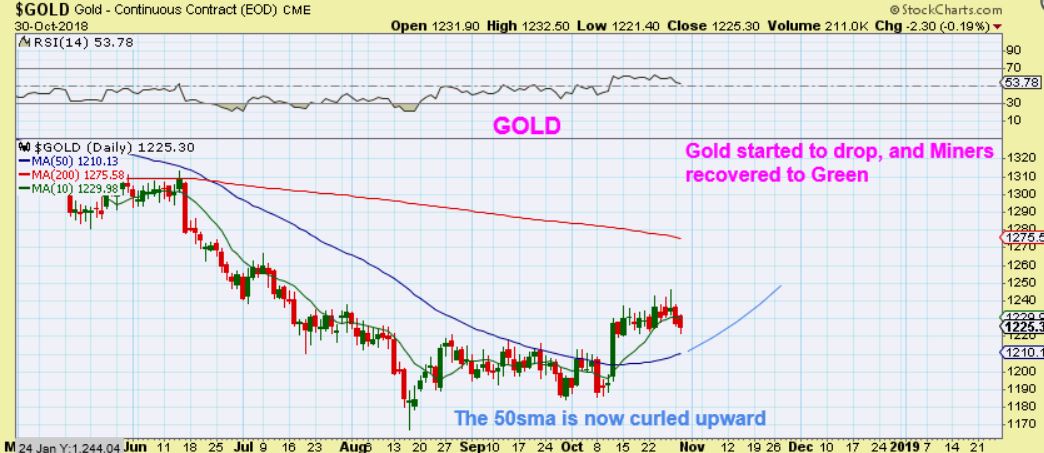
GOLD – Gold dropped $11 from highs to low Monday, and $11 highs to low Tuesday.
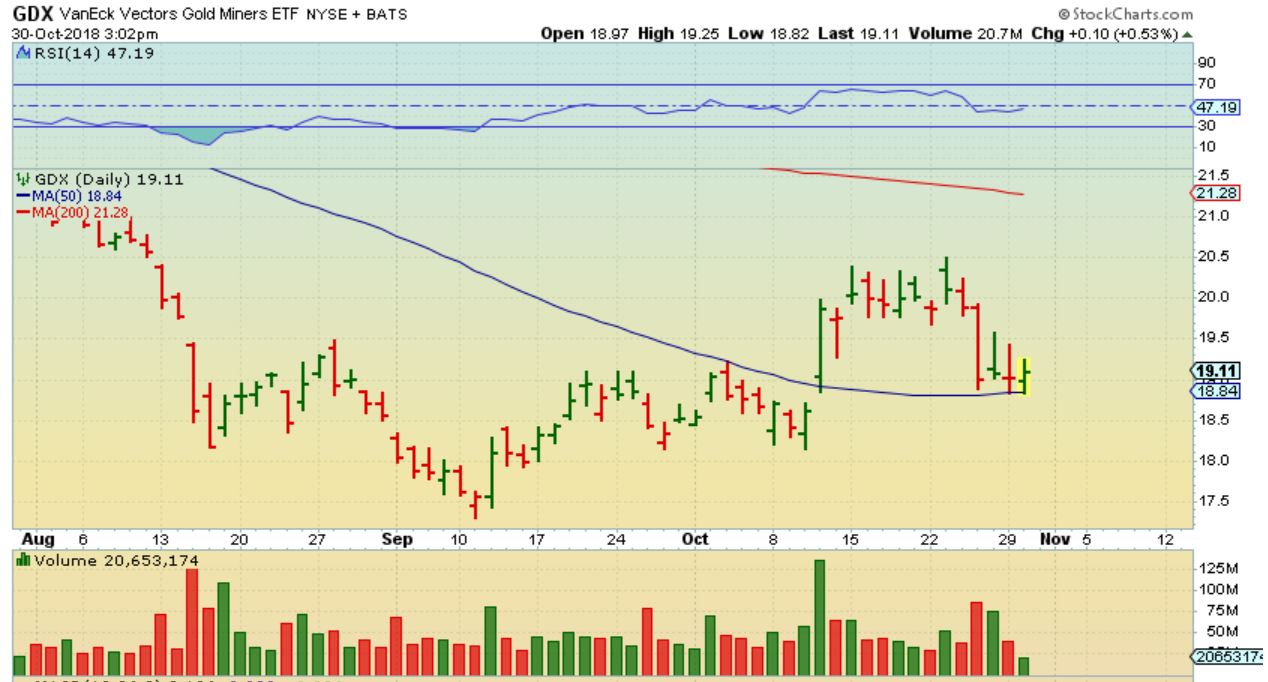
GDX – Miners dipped slightly & recovered, even closing Green Tuesday. Miners are not following Golds drop, they lead the way down to the 50sma.
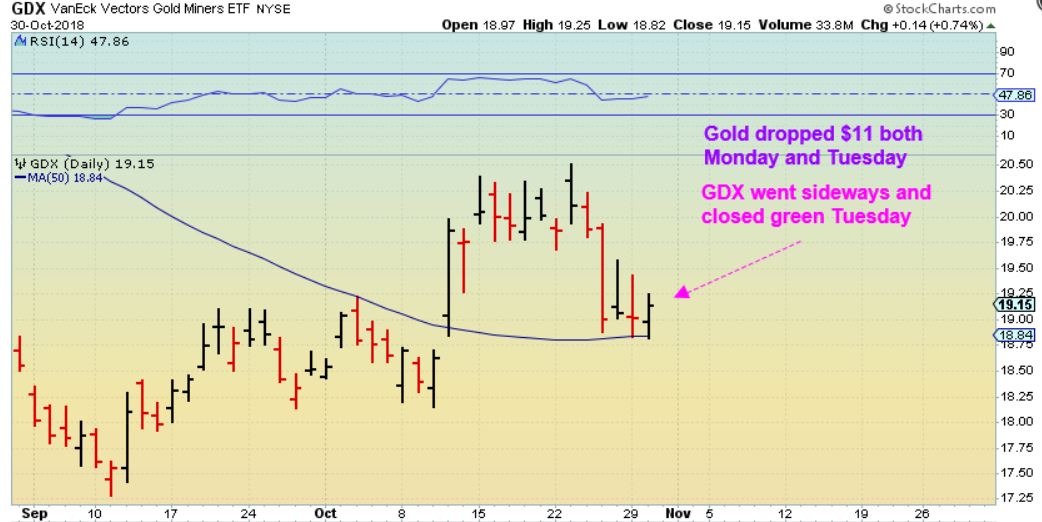
SO IF GOLD IS DOWN WEDNESDAY MORNING, THE MINERS MAY DIP, BUT SO FAR THEY ARE HOLDING UP. Let’s look at the details.
.
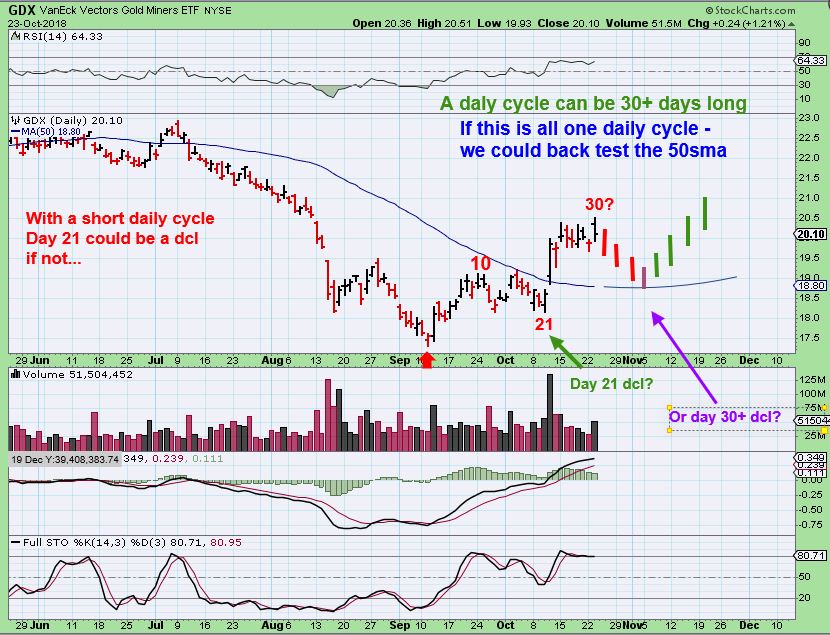
GOLD #1 – Gold is pulling back and recovering a bit each day. I expect a back test of the 50sma, which is now curling higher.
GOLD #2 – Please read the chart. I also wonder if this dip is somewhat of a 1/2 cycle dip now and we drop to a dcl later in late 30+ days count. I say that because…
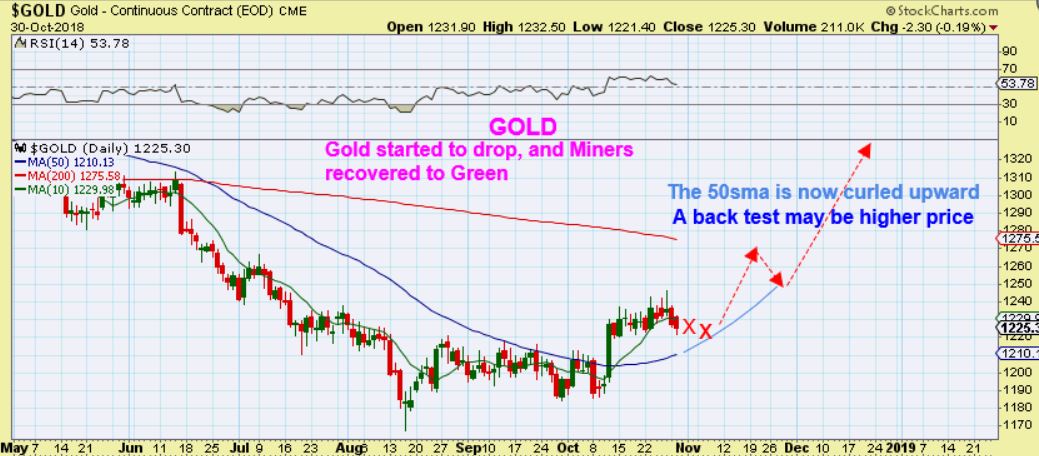
I say that because…
GDX – Gold is selling down and Miners really are holding up nicely. This fit the original thought that I have shared for WEEKS now. A GDX back test of the 50 sma , and the next leg higher.
I mean, We DID talk about this possibility even before any kind of a dip started. I wanted us to be ready for a dip , if we see one, because it might be a bit difficult to accept if I never mentioned it.
I used the Bullish chart of AU to help visualize that a drop to the 50sma can be a bullish back test.

Recently on Oct 23 – The Black Candle showed up , so I tried to help us to see this as a possibility.
AND NOW WE HAVE IT – WE JUST NEED THAT BOUNCE OUT OF HERE PLEASE!! 🙂
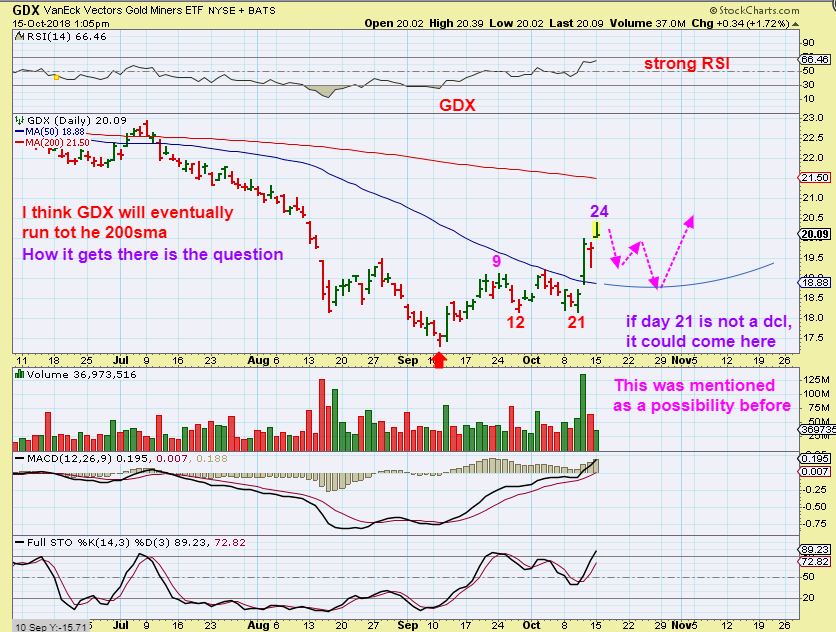
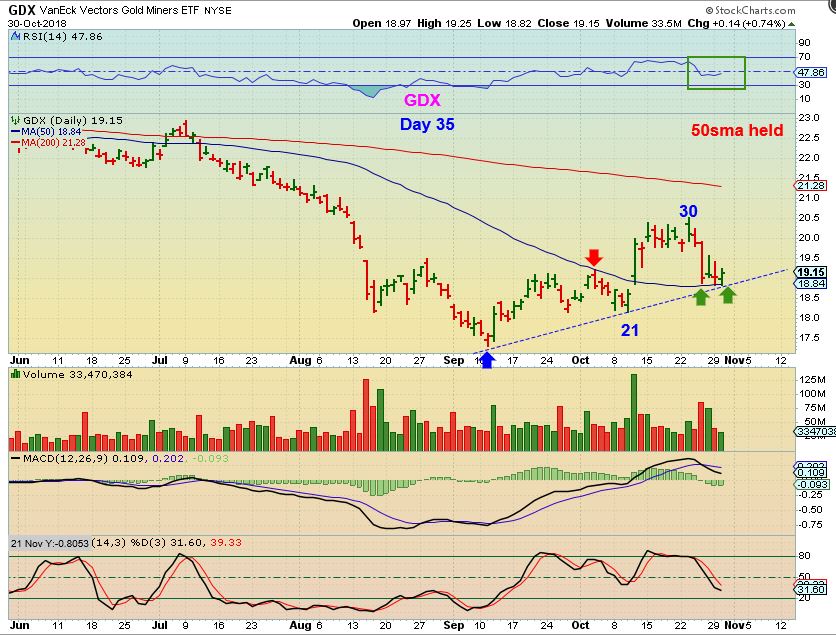
GDX – So this would look like a day 35 DCL possibly. We have a trend line, a 50 sma, and a resisting the selling of Gold.
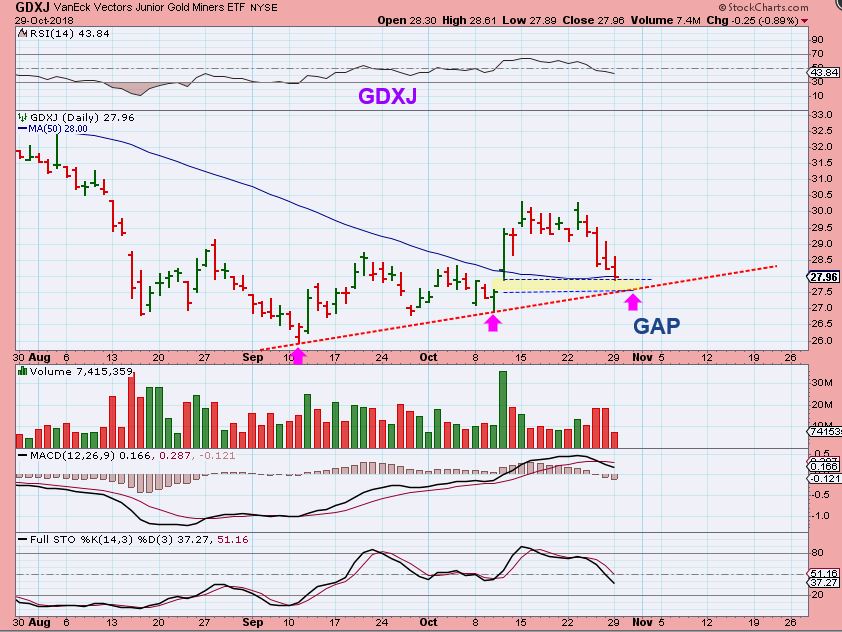
GDXJ – From yesterdays report. Possible GAP FILL & tag of the Trend Line.
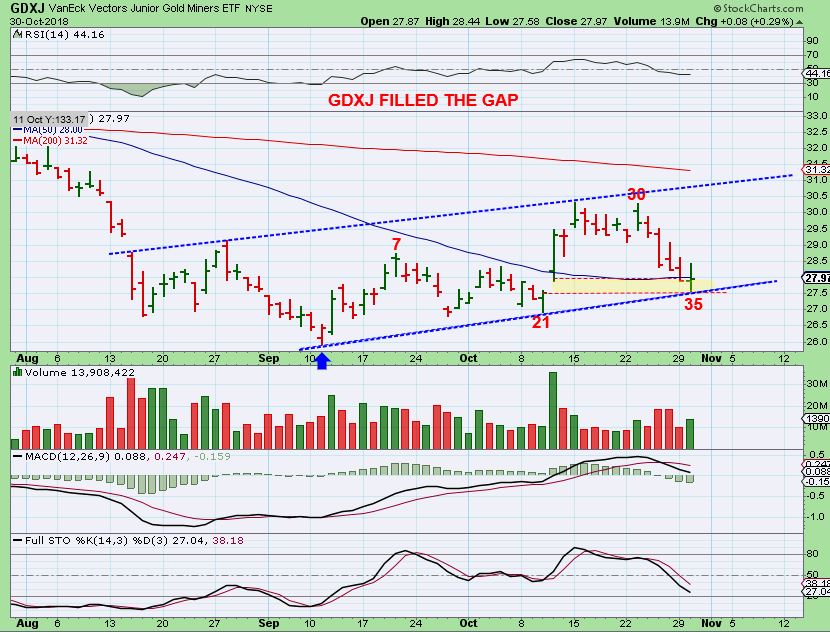
GDXJ – GDXJ actually dropped below the 50 sma, filled the gap, and reversed into the close. So far, this is as expected and it is a bullish chart ( at this point). I hope Wednesday just gives us higher price away from the 50 sma, and we can call that some ‘breathing room’. 🙂
I will admit, Some Miners look bullish, others are at the lows or are breaking down & look sick ( GG, CDE, FSM, etc look weak) and this is a bit concerning. It is something to watch going forward.
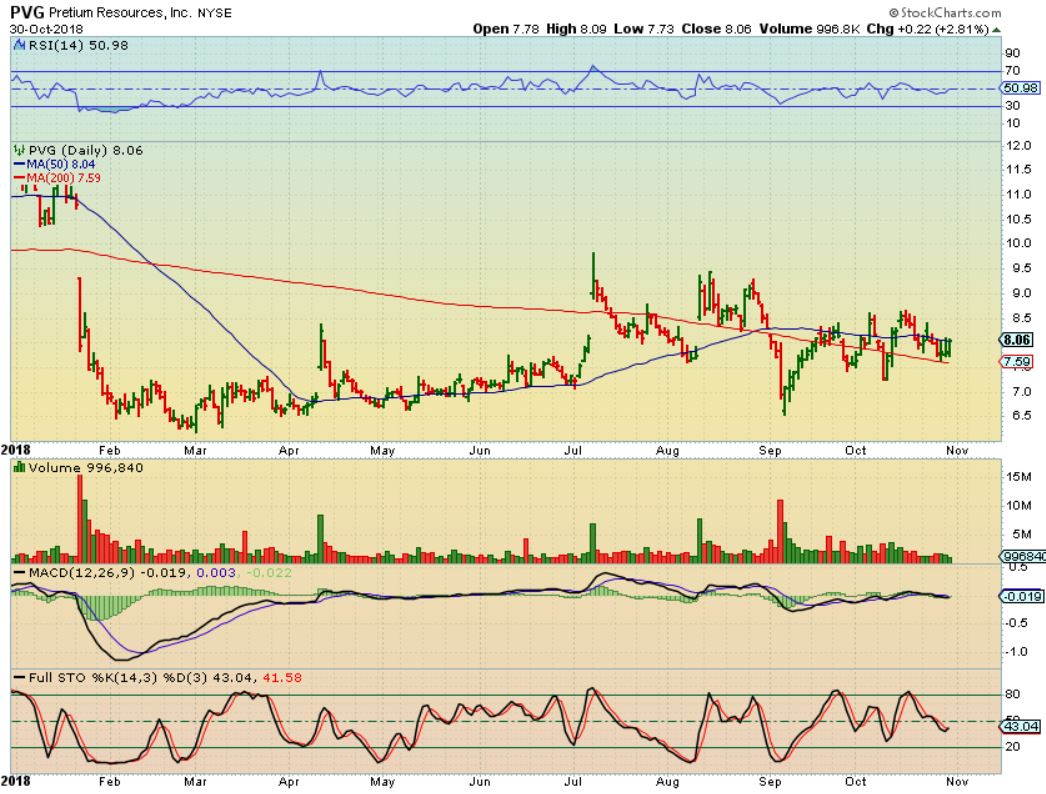
PVG – This is a big base, choppy and sideways for months. It broke higher recently from that V-Shaped spike down, is fighting to stay above the 200 sma, and now is also trying to regain that 50 sma . Once things break & run, this looks like it would run quickly.
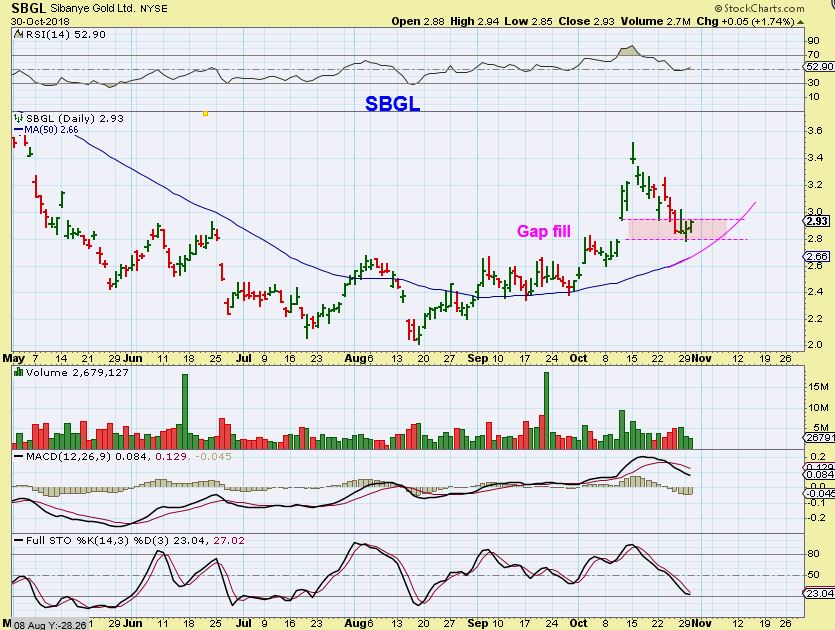
SBGL #1 – SBGL reversed at the gap fill. It may tag the 50 sma later or never. It looks good. I would actually love to see a quick drop…
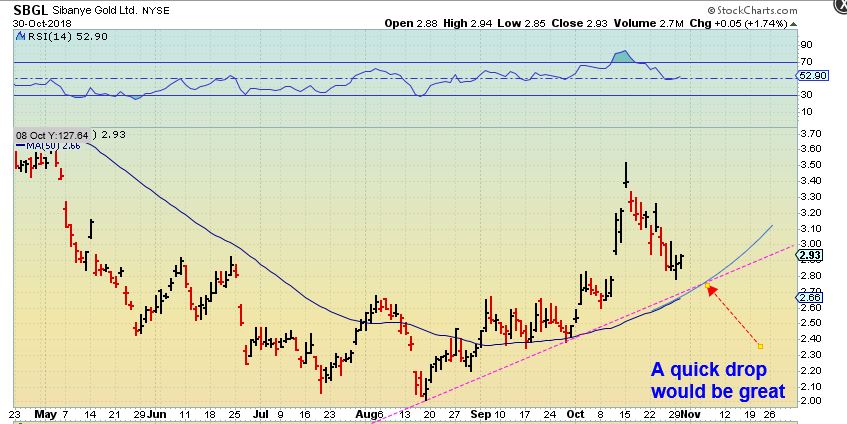
SBGL #2– A quick drop to the 50sma would be perfect actually, because there is also a trend line there.
So ‘changes’ do seem close in the General Market sell off and Oil. Today is the Oil inventory report at 10:30 Eastern, we can watch for that. Miners have held up , even when GOLD was down $10 Tuesday morning. They sold off midday, but recovered into the close. Let’s see what Wednesday brings our way!
.
~ALEX
.
EDIT WEDNESDAY MORNING 6:40 a.m. Eastern:
GOLD DIPPED TO about $1214 overnight and bounced , so…
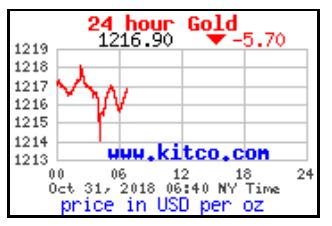
On this chart, $1214 is pretty close to the rising 50 sma, so I drew that drop in. If you think about it, Gold COULD bounce around this area with that 50 sma rising and tag that 50 sma in a couple of days without really dropping much more, and Miners could hold that 50 sma area.

The trades in Shippers are progressing. I don’t want to go through a whole thing number of charts again, Yesterdays report had some charts of Shippers and Miners. I do want to point out something in the shippers sector though.
PXS – I put this in yesterdays report. Notice the POP over the 50sma, and the sideways move, then we got a DOUBLE POP with that 2nd one on Oct 16
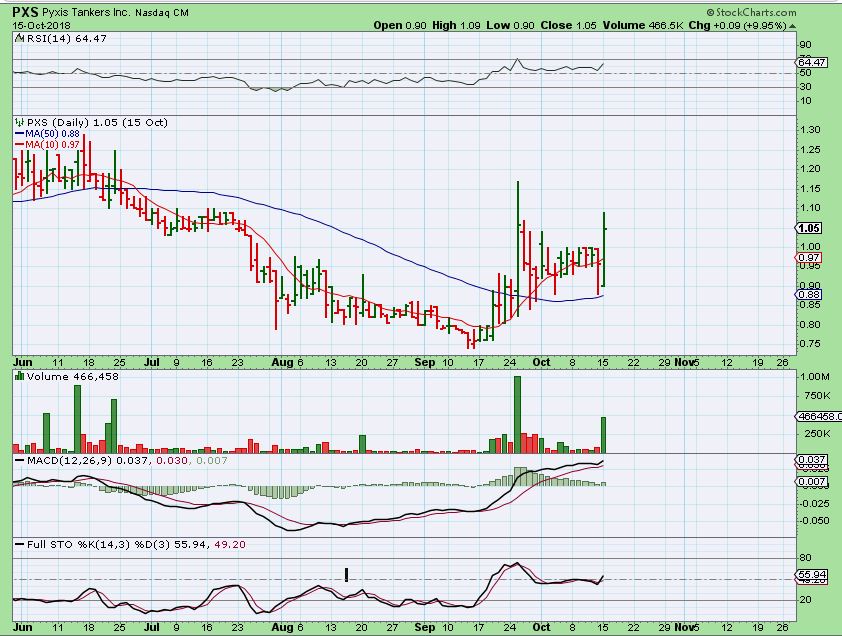
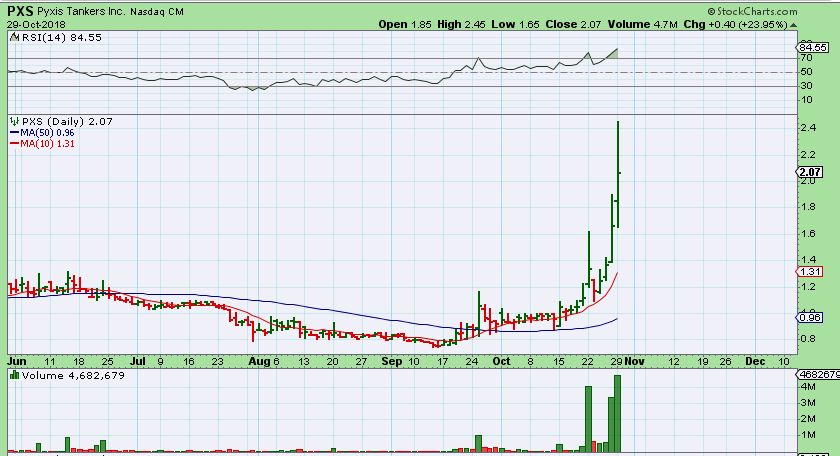
PXS- I then showed how that 2nd Pop on the 50sma was followed by a red day and then a massive run higher. I started looking for set ups above the 50sma or Popping around the 50sma and said that I found DRYS .
.
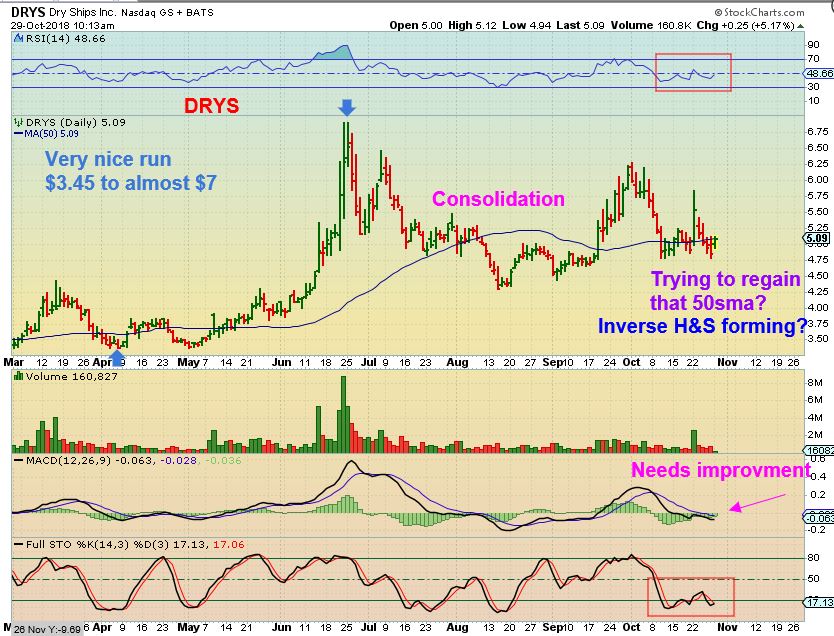
I posted this, DRYS had a POP above the 50sma too. I stated what’s below…
DRYS – I pointed out the long term view of DRYS. It had a strong run last spring and has been consolidating. I am thinking that if this entire sector is acting bullishly, DRYS could push above the 50sma again, and make another run. Watch the 50sma on DRYS
DRYS – This is DRY SHIPS after Tuesday. Doesn’t that Double POP look familiar? See the next chart again…
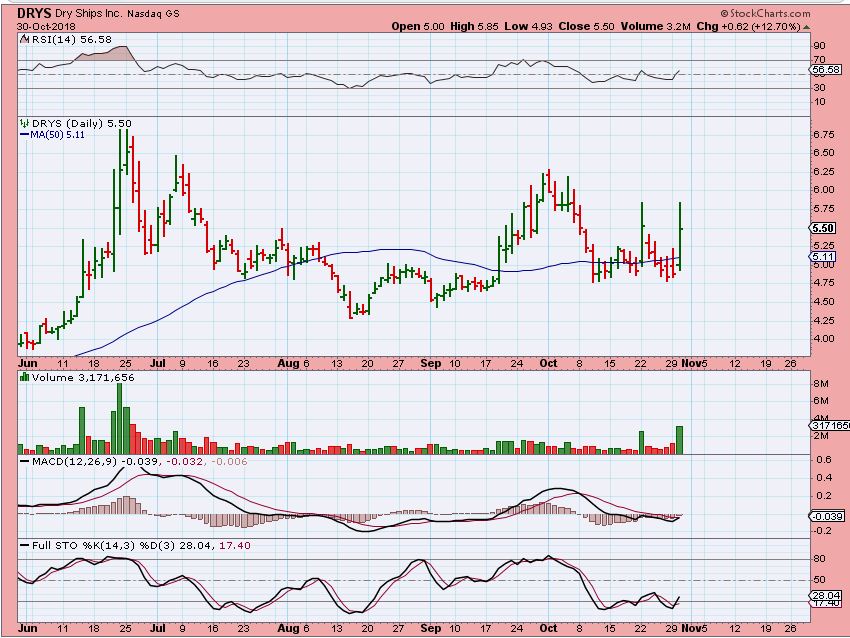
Double pop after… So if you followed me in DRYS, you might just want to give it a few more days, just in case this pattern repeats.

