
Tuesday October 30 Th
With Mondays trading, we really didn’t see any Big Changes to what we discussed in the weekend report, so most of this will just seem like a review. You can refer back to the weekend report for a more detailed explanation if you need those reminders. Remember, holding some CASH is also a favorable position at times, especially when the markets are as choppy and rather directionless as they have been. For some, it is best not to try to over-trade under these conditions.
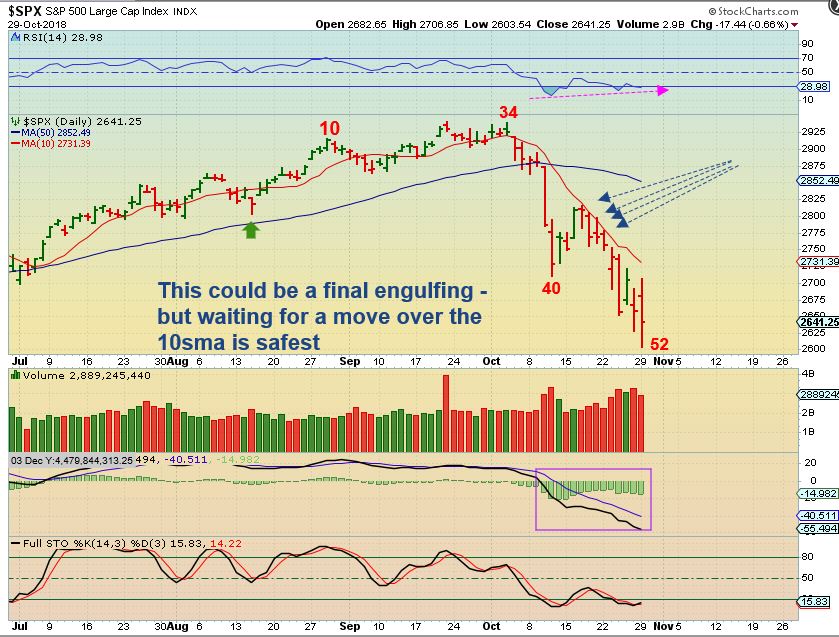
SPX – We are very due for a dcl on day 52. You can see that 10sma acting as a barrier. This looks like a possible last engulfing ( ending a down trend) , but waiting for a confirmed swing low is the safest way to go long, if that is your desire. Future path possibilities were discussed in the weekend report.
I wrote most of this report this morning after gathering charts last night, so to avoid delays, I will not be proof reading it & fix errors until after I release it at 7:50 a.m. Eastern time. I want it out before 8 a.m. Please excuse any typos.
.
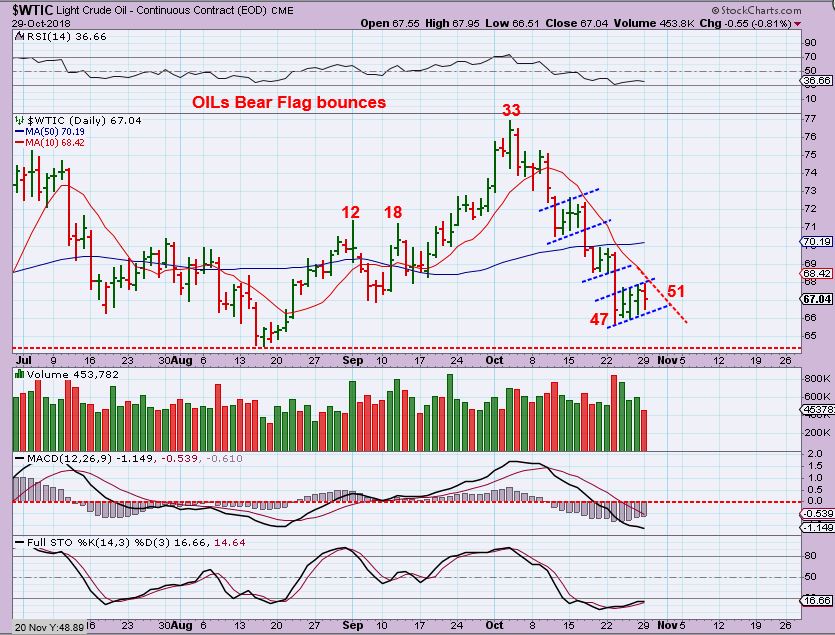
WTIC – Was that a day 47 Low, or is this just another bear flag? It looks like another bear flag. Price was again reversed at the 10sma. So far, Oil breaks down around Wednesdays inventory report, and this is bearish price action so far. I have been saying that OIL Cycle counts often get over 50 + days long. Be patient.
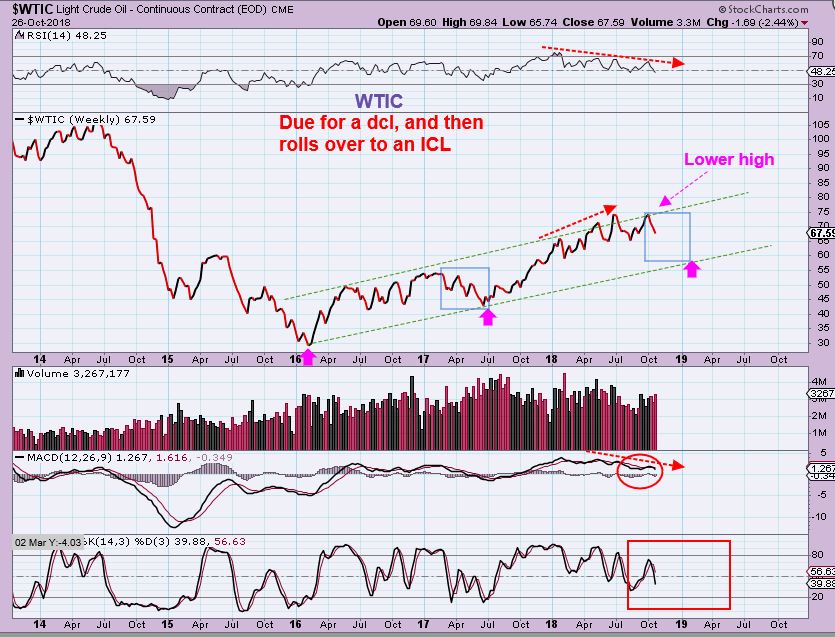
WTIC – I discussed OILs Big Picture in the weekend report with this chart.
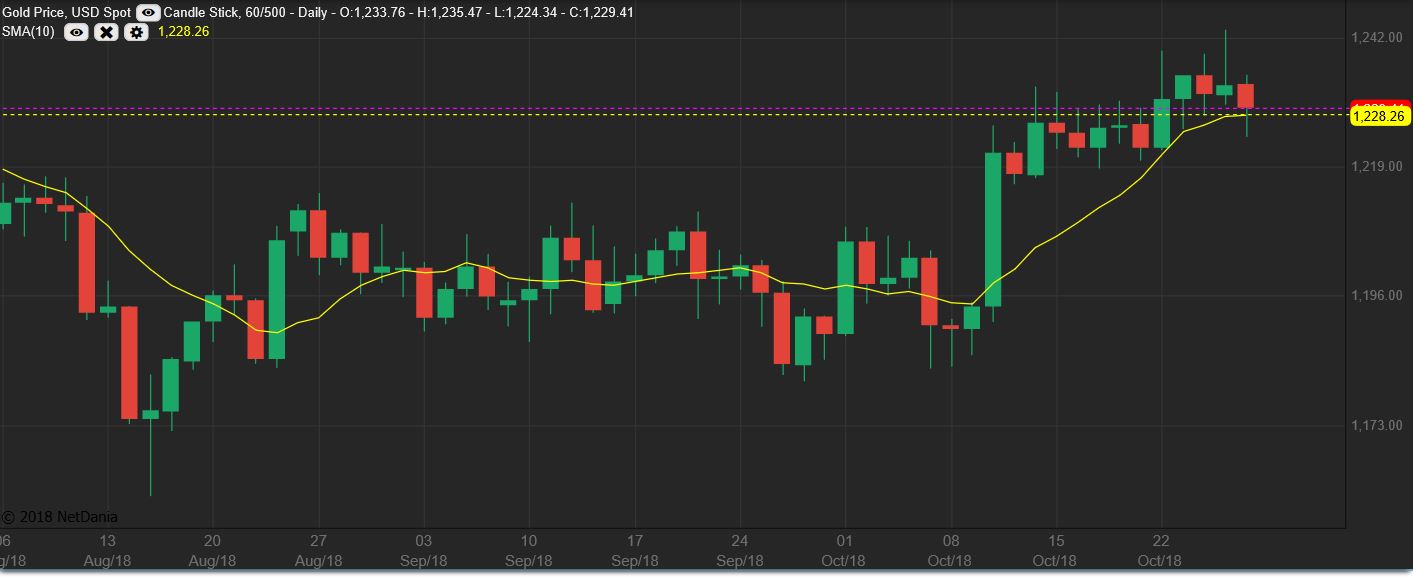
GOLD – Gold actually lost the 10sma , but it regained it. Miners dropped and stayed at their lows. Their cycles seem to be out of sync, as I mentioned in prior reports. This makes the analysis far more difficult, because Gold is due to drop into a dcl, Miners should be due to come out of one.
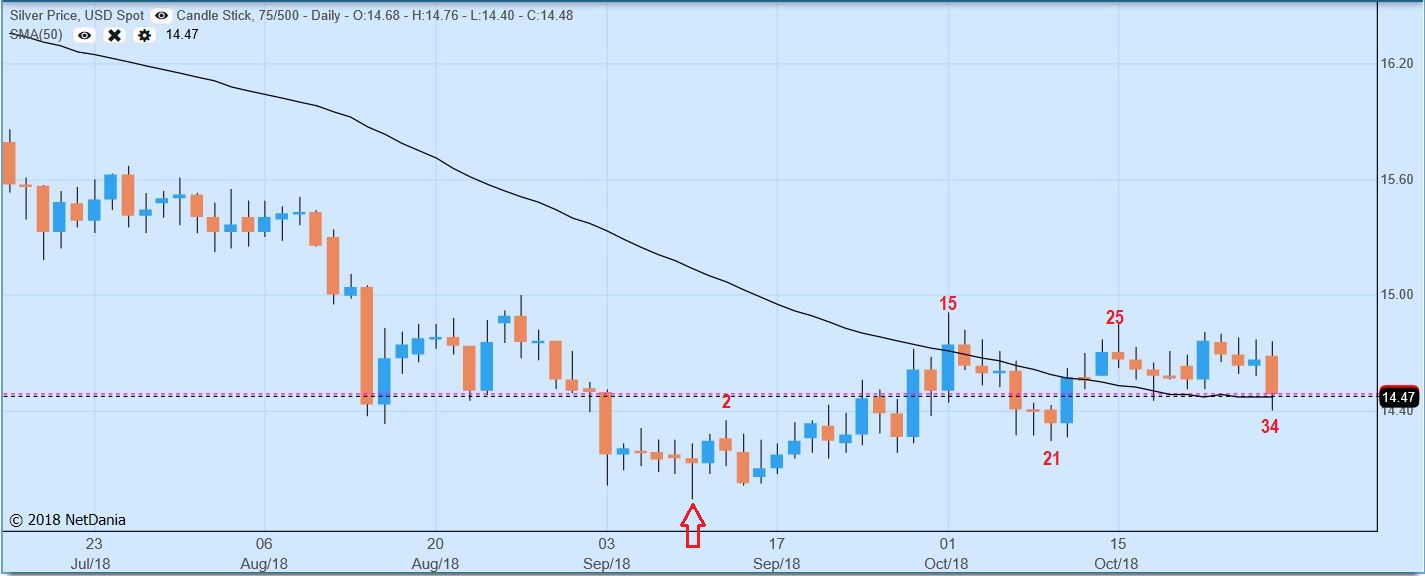
SILVER – Interestingly, SILVER also dropped to the 50sma and recovered, but Silver looks to have bottomed with Miners in September, Gold bottomed in August.
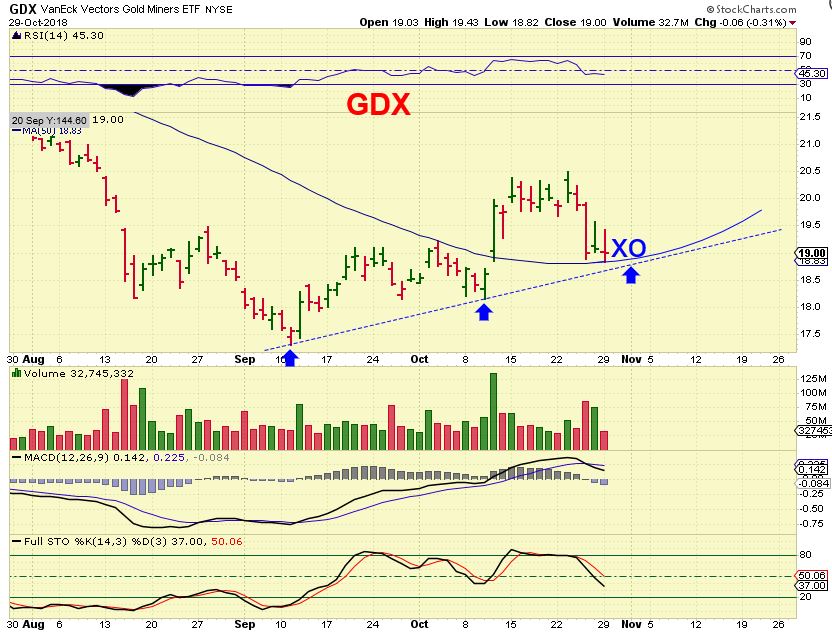
GDX –
CAN MINERS RUN WHILE GOLD DROPS INTO A DCL? That would be impressive, but the idea is rather concerning with Price near the 50sma for Miners. GDX bounced off of the 50sma and could go sideways, but GDXJ actually closed below the 50sma ( There is a gap there on both GDX & GDXJ).
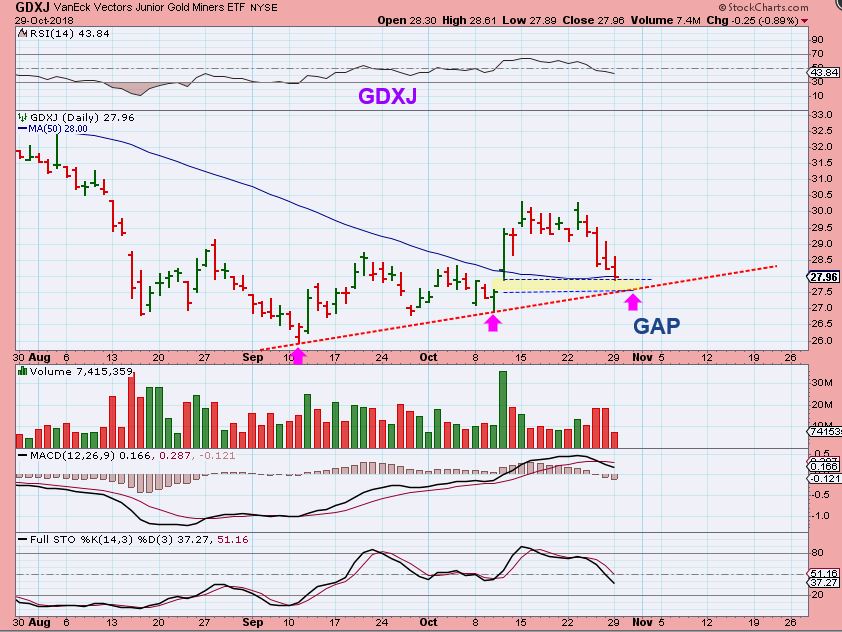
GDXJ – GDXJ is dropping into the Gap. We have a trend line, and they usually are broken on a drop to a dcl. It needs to be said that EVEN IF WE HAVE AN ICL IN SEPTEMBER, price CAN DROP to those lows and become a BASE BUILDING PROCESS. This was discussed in the weekend report, instead of the 50sma acting as support, as hoped for.
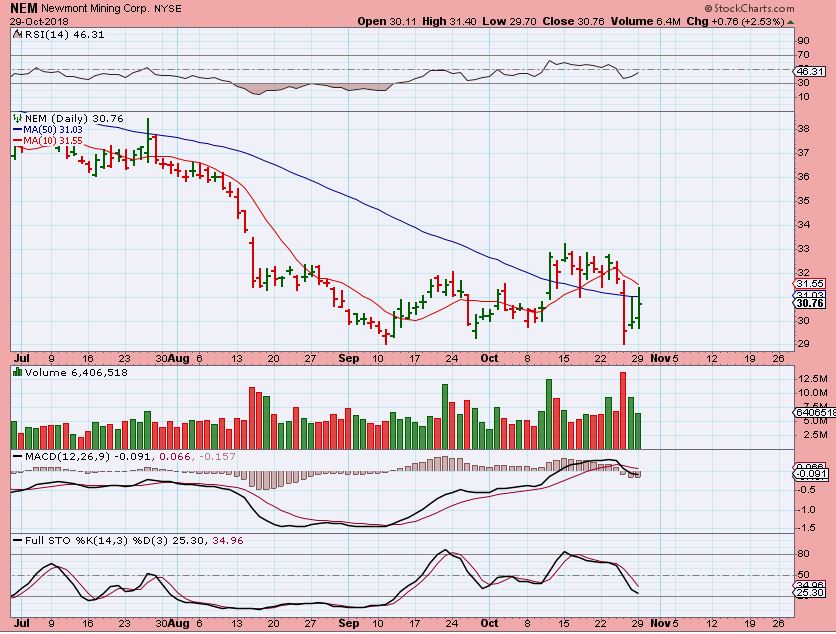
SO I wanted to look at NEM & GG- they both released earnings and had a bad reaction.
.
NEM – NEM almost looked like it would recover the 50sma. THIS looks like that 2015 GDX BASE that I discussed in the weekend report. By going sideways , it could form a base for the next run higher, however…
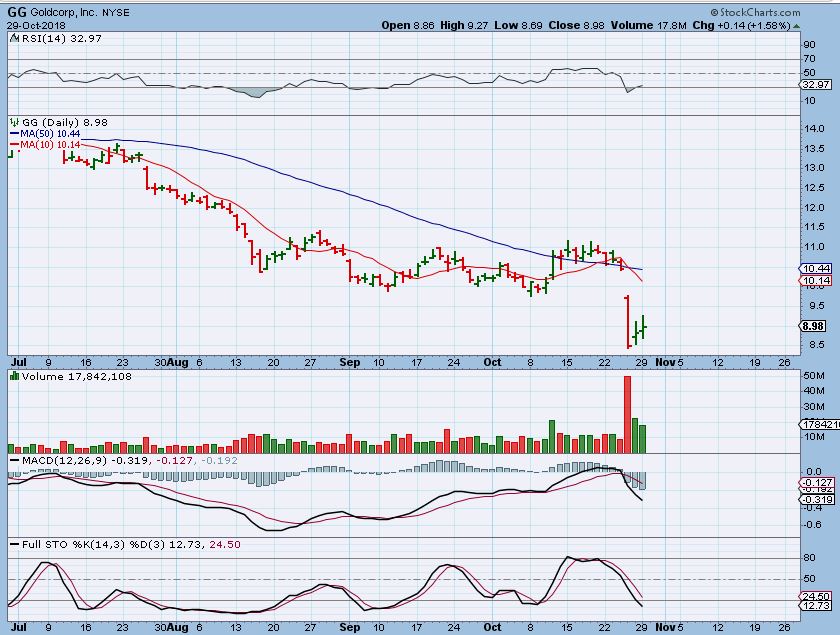
GG – This looks rather UGLY, and thus concerning for GDX.
1. Price on GG could be a bear flag forming.
2. Price on GG could just run up & tag the 10sma, fill the gap, and roll over.
3. Price on GG could just tag the break down as a back test & drop again.
4. Price COULD recover as a major shake out, but that would be slow at this rate.
.
THIS CHART IS STILL POSSIBLE, BUT LET’s DISCUSS WHAT WE DISCUSSED THIS WEEKEND – A POSSIBLE PROLONGED CONSOLIDATION
WHAT IF THE NEXT ICL DUE IN DECEMBER OR JANUARY BREAKS SLIGHTLY LOWER THAN THE CURRENT ICL, SIMILAR TO WHAT WE SAW IN 2016?
.
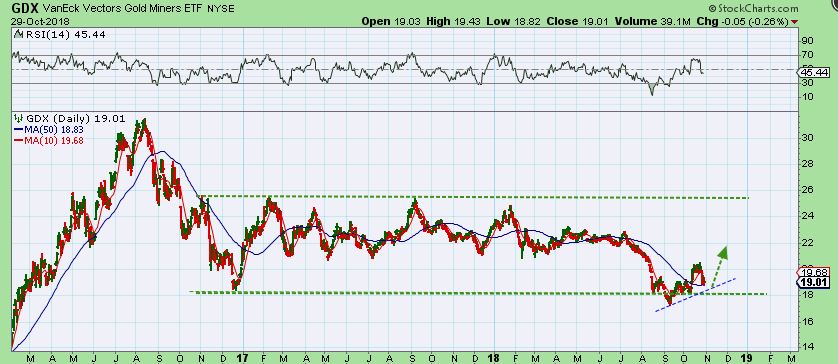
GDX – We need a Break out higher on this Next Daily Cycle . If not, it seems likely that it could be a sideways set of choppy daily cycles leading to this. This would not be a deep drop, but it would be choppy, frustrating, and time consuming. 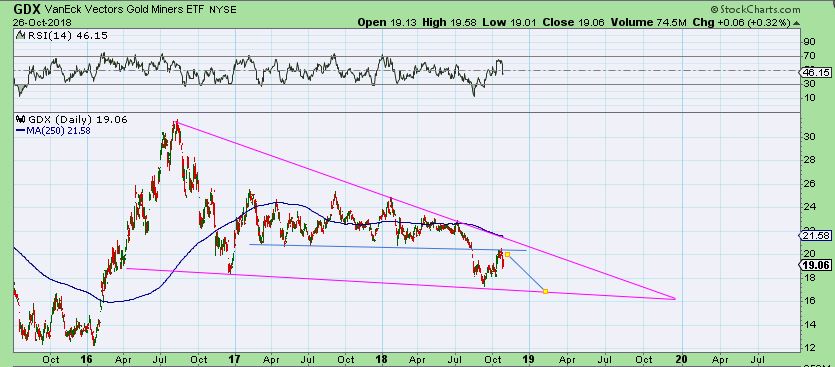
GDXJ – We have been waiting for this most excellent break out & Rally like 2016. LOOK AT 2016- WHAT A RUN. We need to do that on the next daily cycle or this consolidation is still in action. I definitely expected the break out now, Because I saw the General Markets set up to fall this Sept or Oct into an ICL. That said: If you see THIS chart play out, it could be because …
1. The General Markets fell, and now they could back test the 50sma with a bounce or even form a double top
2. As Markets Bounce to the 50sma or to a double top, Miners chop around sideways & eventually…
3. They find their next ICL at this apex – or –
4. We still definitely could see a break out now on this next daily cycle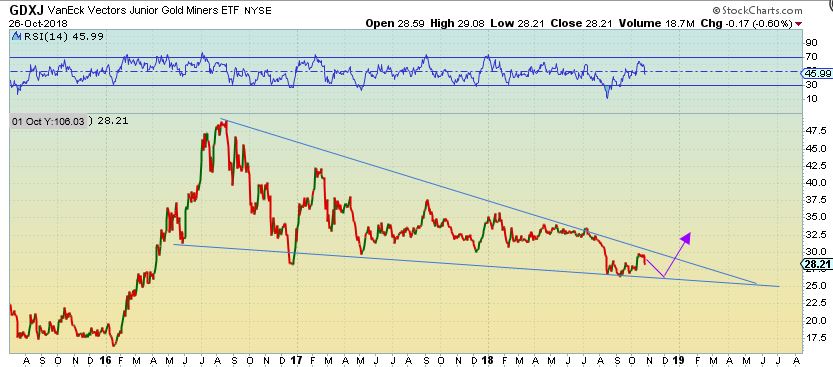
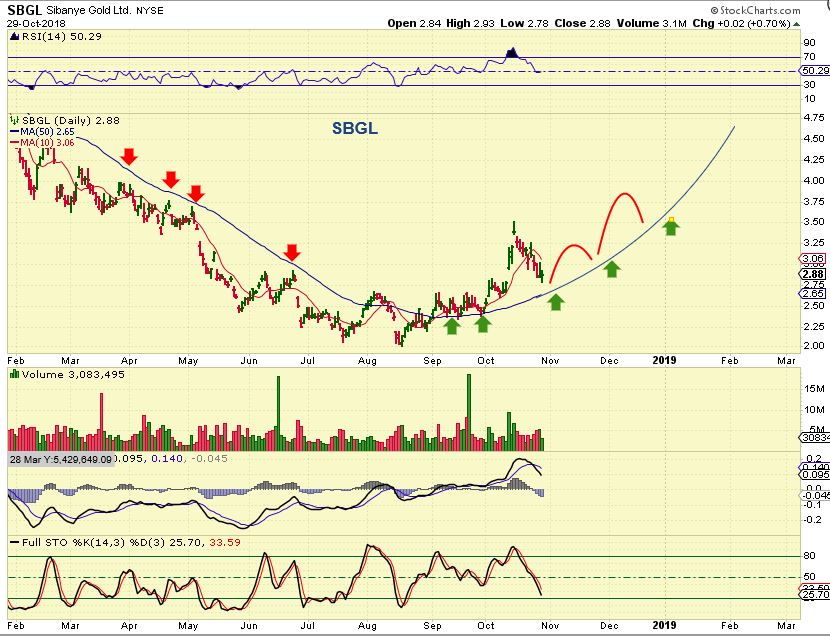
Some stocks that took the lead could remain Bullish and act as leaders either way. Whether GDX GDXJ break out now or not, individual stocks can remain bullish. For example: SBGL could continue a stair step higher above the 50sma. IF GDX / GDXJ break out to new highs on the next daily cycle- This would be one of the ones that has been leading the way. Price at the 50sma seems to be key.
LET ME POINT SOMETHING OUT : IS THIS BREAK UNDER THE 50SMA BEARISH, EVEN IF IT FILLS THE GAP OR BREAKS THAT TREND LINE? No, and we do usually get trend line breaks at DCLs. Let me show you something…
Wouldn’t you say this is what GDX & GDXJ have done? It
1. Bottomed after a deep sell off. 2. Crawled (Base) under the 50sma.
3. Finally broke out above the 50sma. 4. Broke down back below it. 5. This looks worse than GDXJ, so is it Bearish??
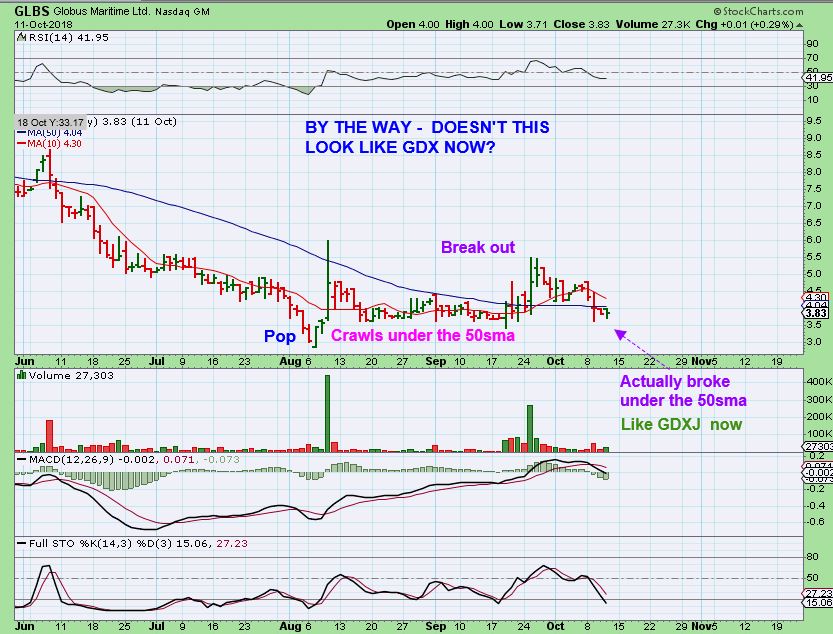
This was the following 5 days, so GDX can do this too.
So I would say that we need to see the Miners break out NOW, on their next Daily cycle, or this consolidation will likely just be prolonged. If GOLD drops, we can see if Miners resist the selling to a degree or not. Do they crash, or slowly sell down? The good thing is that we are seeing Stronger Miners take the lead. They can continue to be the leaders and reveal themselves as the better early performers. In the summer of 2015, some Miners actually Bottomed and never returned to their lows, even thought GDX GDXJ did in Jan of 2016. The move out of the lows of the next Daily Cycle is important.
.
We’ll see what Tuesday brings our way.
~ALEX
.
I just want to mention that sitting in Cash or holding your position in Miners until further clarification is fine. Take a break, let the choppiness clear up , etc – that is often a bit more relaxing rather than to constantly have to watch positions. As a trader, I look for trade set ups (short term) and since the MJ sector began to pull back & consolidate, I mentioned that I sold everything and moved on ( to cash). Now I see another sector that is acting bullishly, bases have formed, and I wanted to take on a few trades. THIS IS ALSO A FAST MOVING SECTOR, so it is only for experienced traders. Again, CASH IN HAND WAITING TO SEE WHAT HAPPENS IN THE PRECIOUS METALS SECTOR IS ADVANTAGEOUS TOO. If Miners break higher & Run, you have funds to pile in.
.
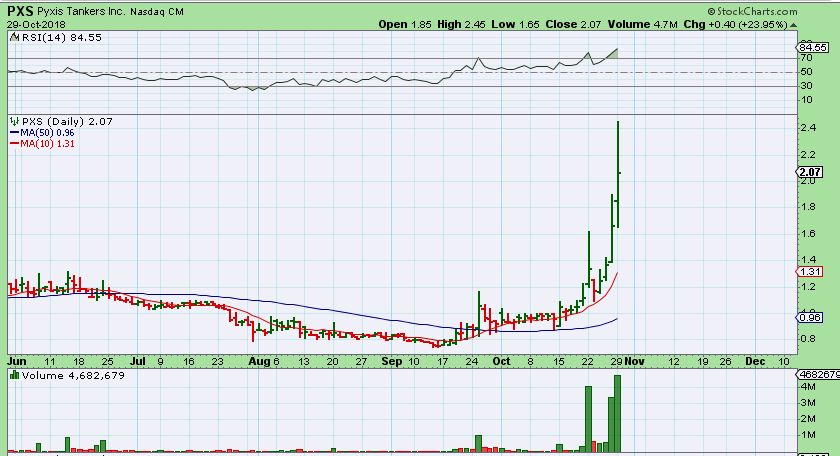
For those that like to trade, however, the SHIPPERS seem to be bullishly popping despite the General Market dropping & chopping. Look at charts of TOPS , PXS, & DCIX.
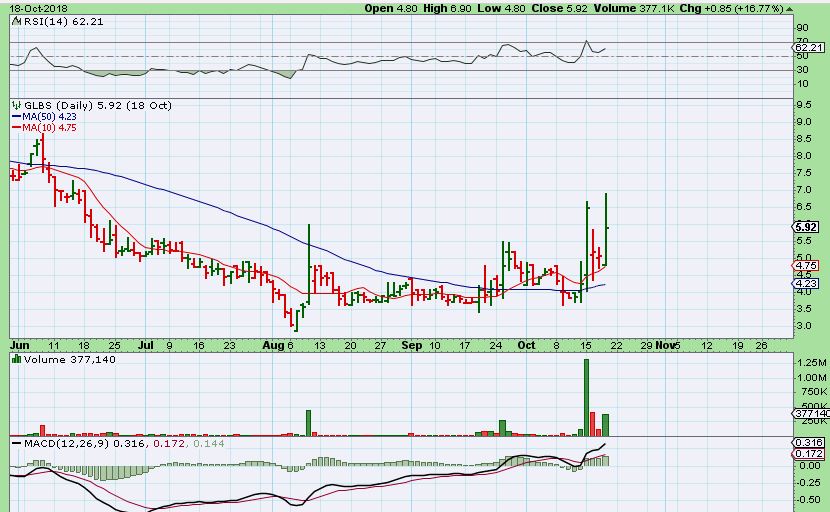
PXS is beautiful. This was the set up as it burst above the 50sma. Then it took a few weeks to consolidate. Another POP happened om Oct 16 and then…
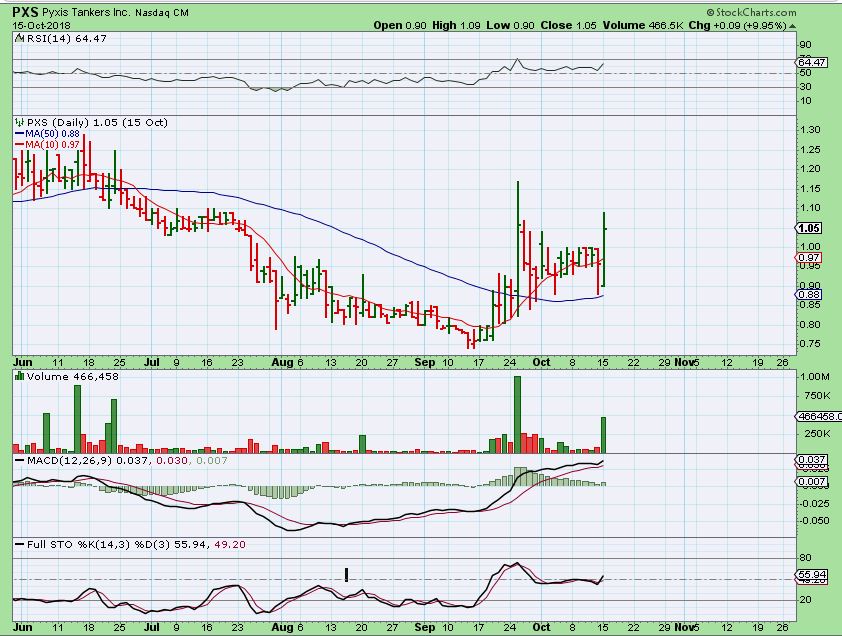
PXS- That Pop was followed by a red day and then a massive run higher. I started looking for set ups above the 50sma or Popping around the 50sma, similar to PXS, DCIX, and TOPS
.
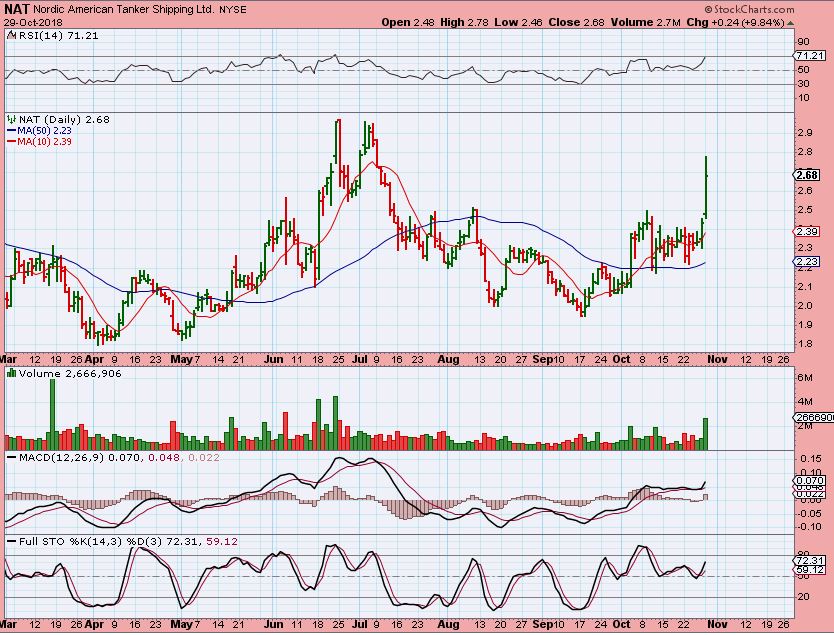
NAT – I mentioned Friday that ‘Shippers’ looked Bullish, so I said that I bought NAT breaking out at the 50sma as a trade.
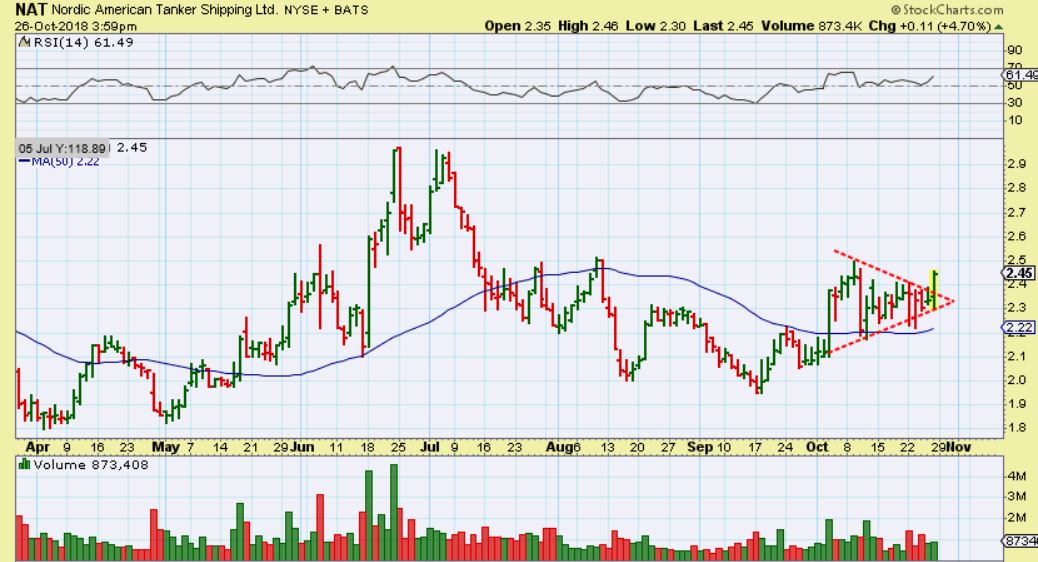
NAT – It was up 12% at one point. Notice the consolidation above the 50sma. The sector has more set ups like this. And…
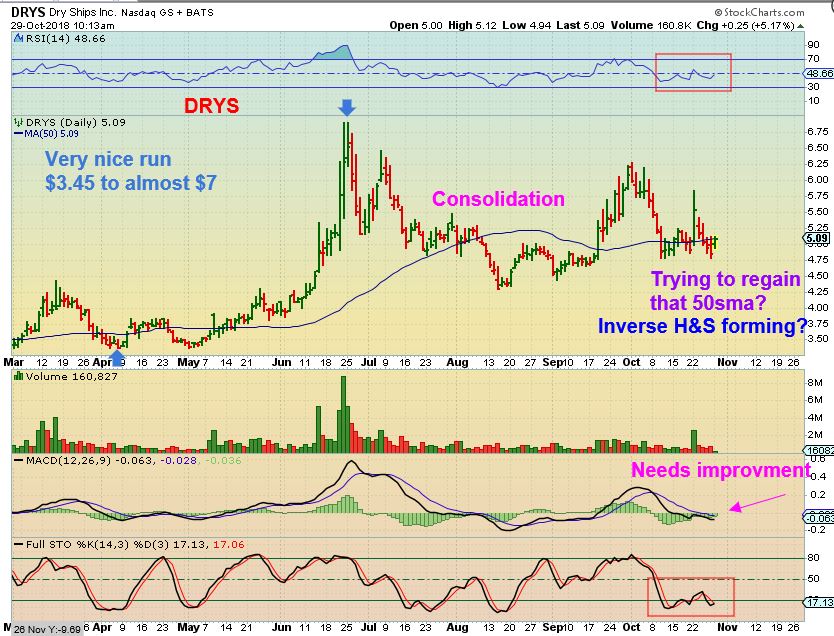
DRYS – I pointed out the long term view of DRYS. It had a strong run last spring and has been consolidating. I am thinking that if this entire sector is acting bullishly, DRYS could push above the 50sma again, and make another run. Watch the 50sma on DRYS
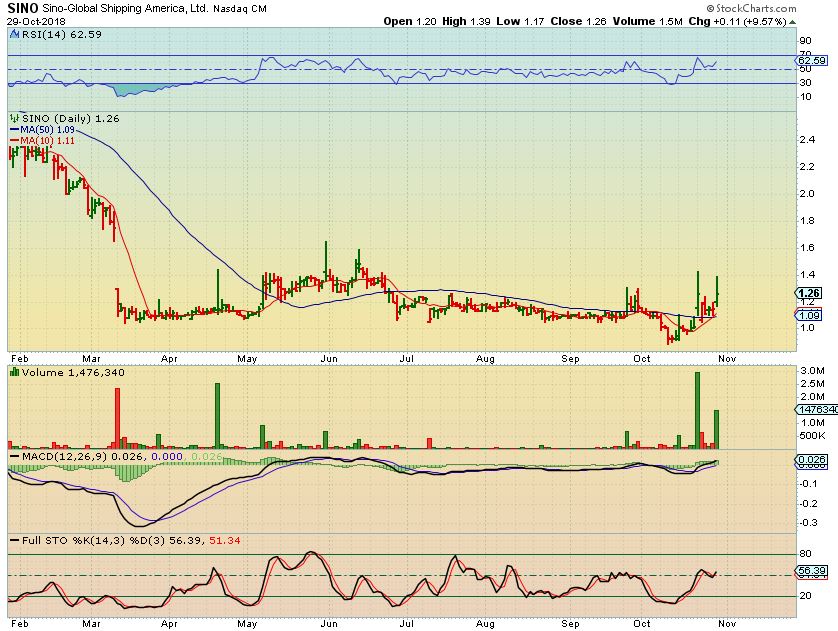
SINO – I posted in the comments that I bought SINO at the open, because Volume was very big within 10 minutes. Well, it also had that POP & Sideways move at the 50sma, similar to PXS. It then pushed higher & was also up 16% at one point. It closed up almost 10%, I am still holding it – hoping for a high volume break out from this long base.
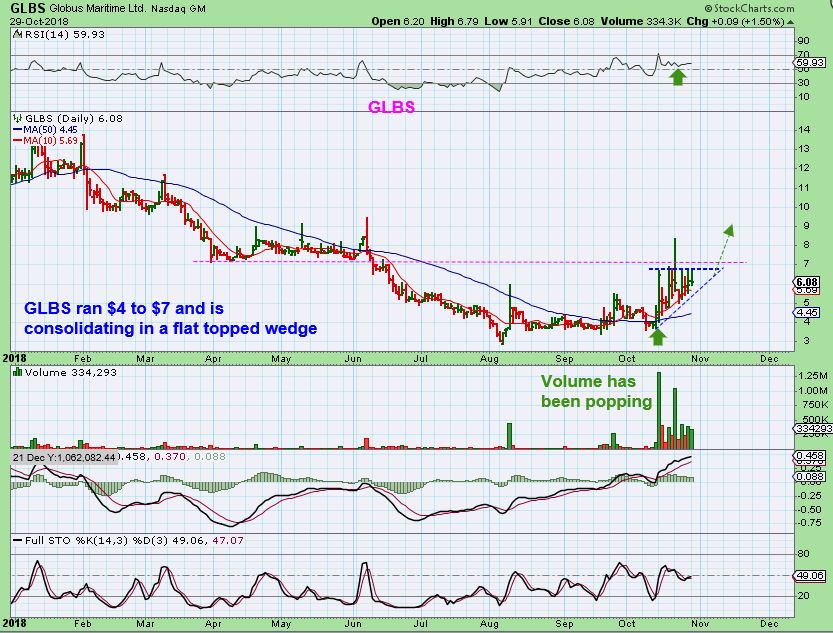
GLBS – This set up looks Bullish in the Shipping sector too. It Popped above the 50sma and has gone sideways. Similar to PXS?
Again, they say CASH IS KING, and that is especially so under choppy sideways conditions like we have experienced. As a trader, I am just dabbling in these Bullish set ups. Trading is a game of probabilities, and these set ups are bullish for now, for those that like to find a trade idea. Others can wait and see if we get GDX setting up like ..
ARE WE SEEING THIS? A DROP IN GDX / GDXJ BELOW THE 50sma?
THAT LEADS TO THIS? Or further consolidation? Time will tell.

