Oct 3rd – What’s That Guy So Happy About?
.
Maybe he is Long Gold too 🙂
.
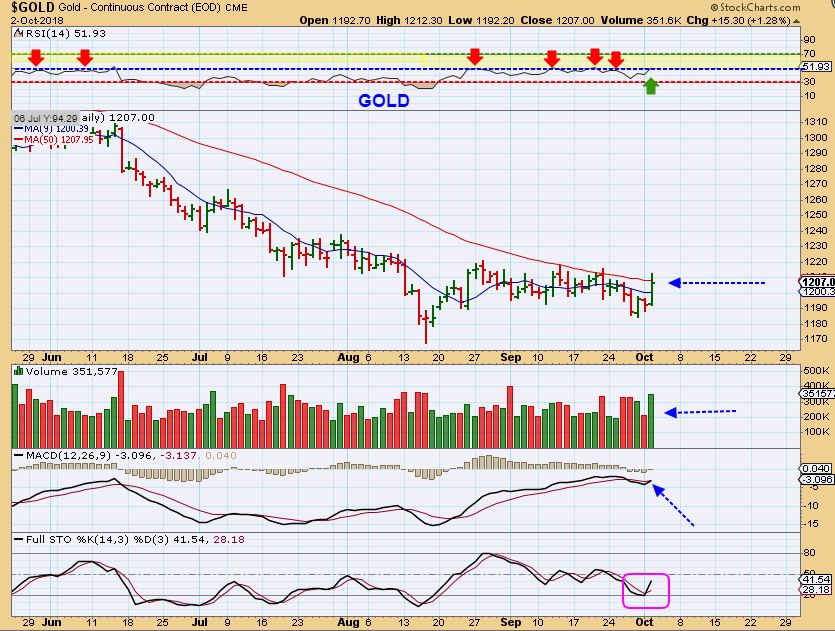
GOLD – This was a nice break higher and this took place with the USD moving higher an also on the infamous ‘ Chinese Golden Week’. It was a nice on day pop and I’d like to see some follow through this week.
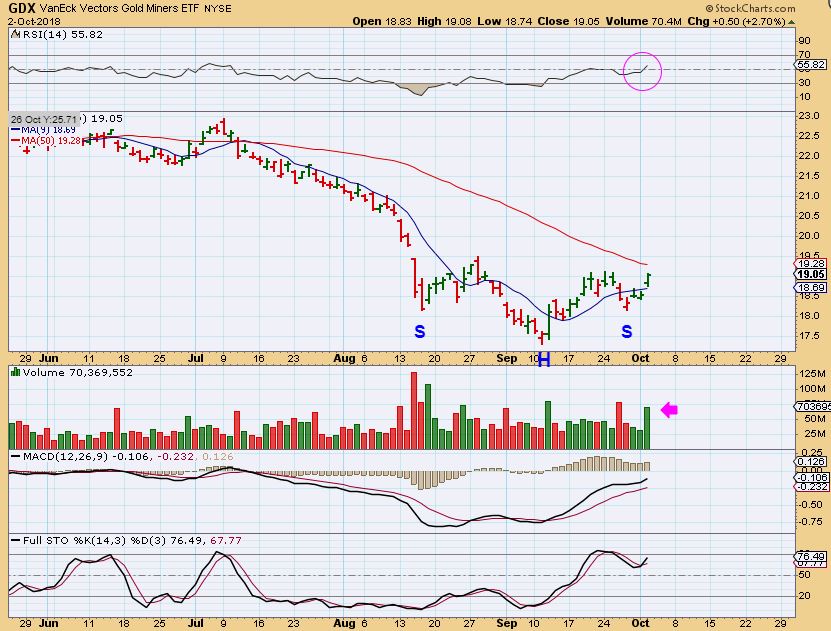
GDX – Our last report already discussed the GDX : GOLD Ratio, and showed that the Miners have been leading Gold. They kept up with Gold on Tuesday with a nice push higher on strong volume. Since this looks like GDX is coming out of a 1/2 cycle low, it should be able to break right through that 50sma and back test it on a dcl. We’ll see.
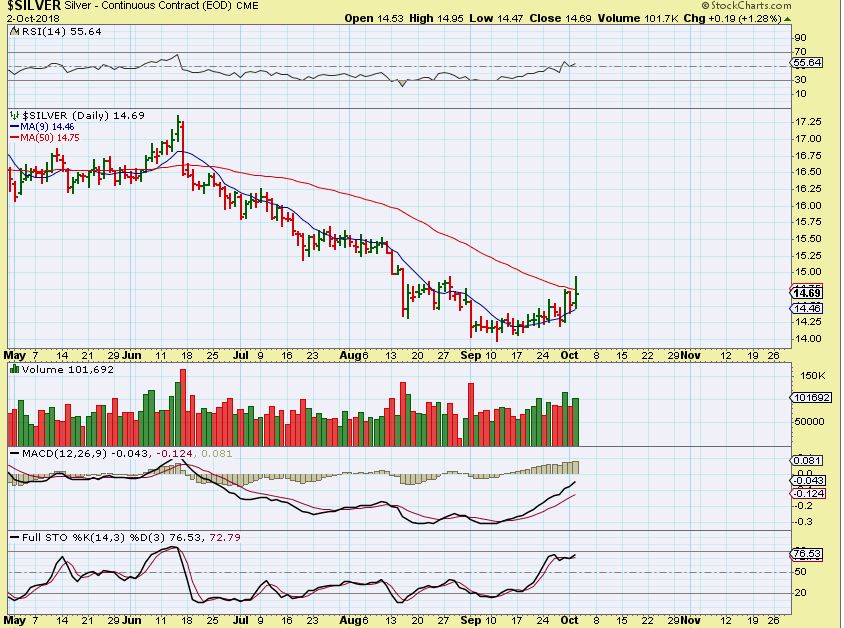
SILVER – Silver Popped last Friday, Monday it took a breather, and Tuesday we got another move higher. That means that the SILVER;GOLD Ratio remains Bullish.
.
This note by sentiment trader was Tweeted out yesterday and was emailed to me as a point of interest ( Thx Cal) and I then also saw it in many other blogs, Twitter , and other places. It is causing a lot of talk about ‘ a top forming’. Many of the repeat posts that I saw are implying that this means “We are at a top’. Is that what this means? Read the tweet…
.
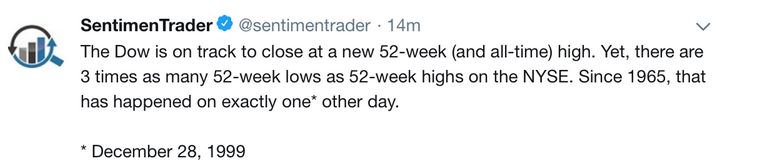
This actually backs what I mentioned the other day in my report. I said that as the markets & some stocks make New Highs, there are many making new lows. I reported this as a phenomenon called the ‘Hindenburg Omen’. It can happen before a crash or strong pull back. So the Tweet stated that …
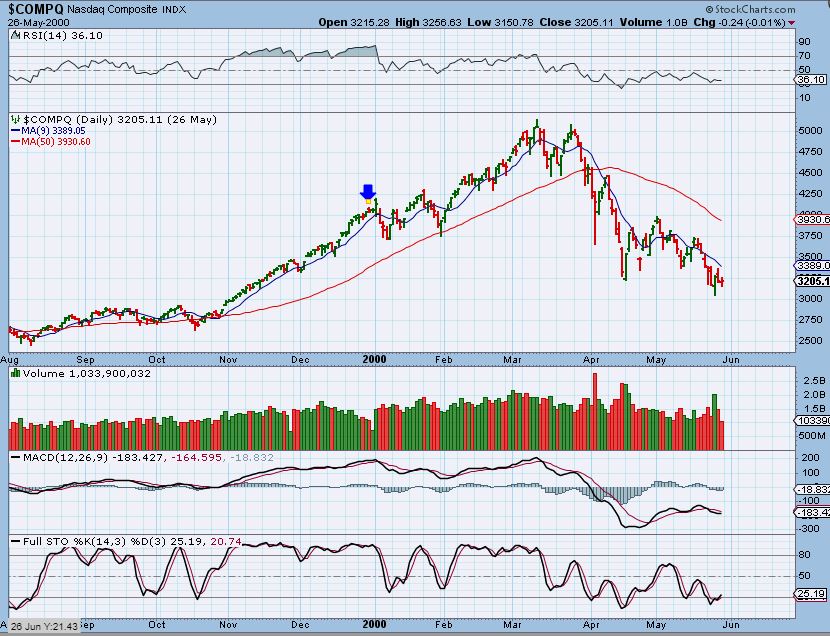
“3 x as many 52 wk lows as 52 wk highs, and this Has not happened any other time except December 28, 1999.” SO WE MUST ASK, what happened after Dec 28, 1999? DOES THIS REALLY MEAN WE ARE AT A TOP? I decided to dig in….
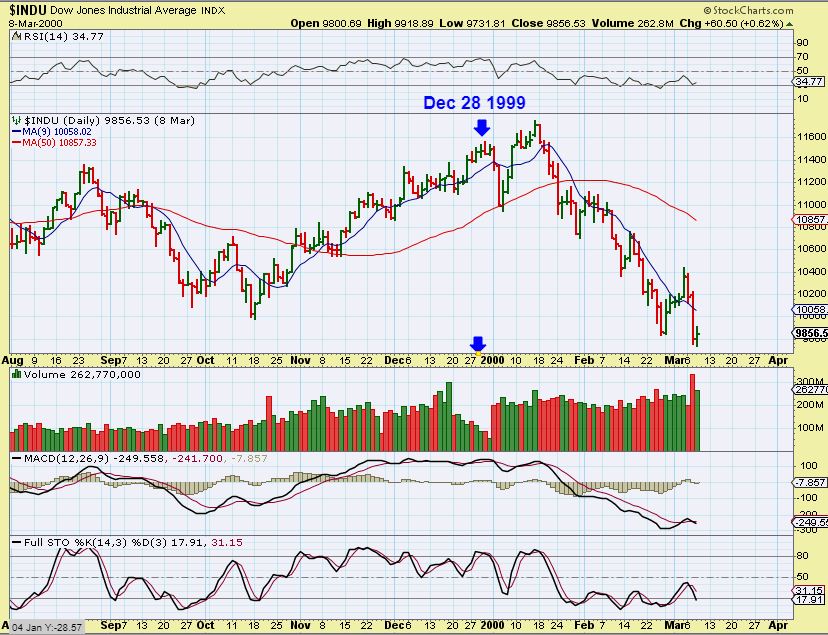
DJIA DEC 28 , 1999– There was a drop, a rally , and then the top 1 month later. What about the SPX?
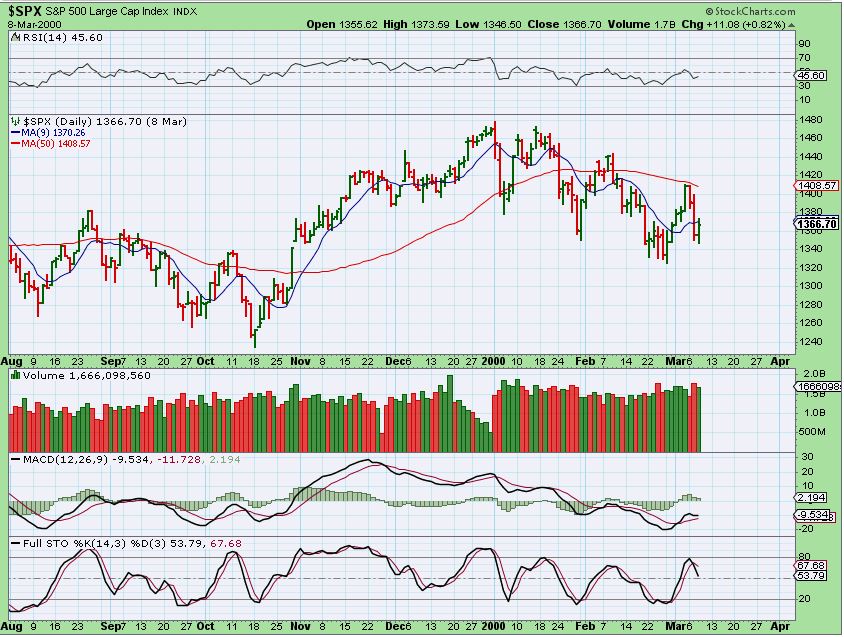
SPX DEC 28 , 1999– After Dec 28 the markets kept going into Jan, but then we saw a mini crash, rally, crash, rally, crash. Very choppy, VERY HARD TO MAKE MONEY. The SPX was making lower lows and lower highs, so yes, it was slowly topping. What about the NASDAQ? ..
NASDAQ DEC 28 , 1999– tech only had a 1 week pull back, but then another pretty good run higher continued into March ( so not an immediate top necessarily, but..
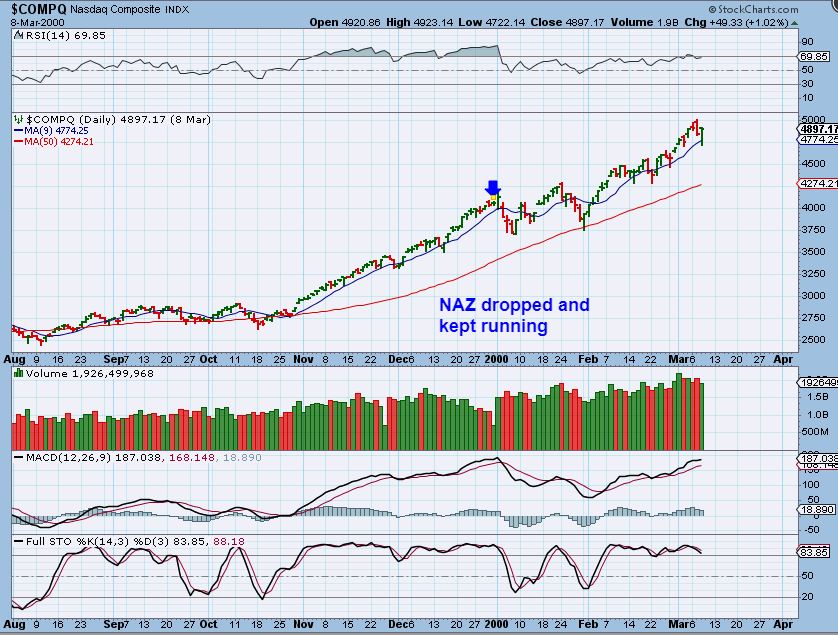
NASDAQ DEC 28 , 1999– We do remember the 2000 top in tech Bubble, so the top did come 3 months later here too.
.
So are the General Market ‘nearing’ some sort of a top, while Precious Metals , commodities, etc will have their chance to run for an extended period of time? I cannot tell for sure at this point, but it is possible. The various sectors do look like they could be setting up that way. Remember what the charts told us from 1999 though, the top did not necessarily come immediately. We saw pull backs and final rallies as the Dow & SPX rolled over. Tech moved higher for a bit longer at that time.
.
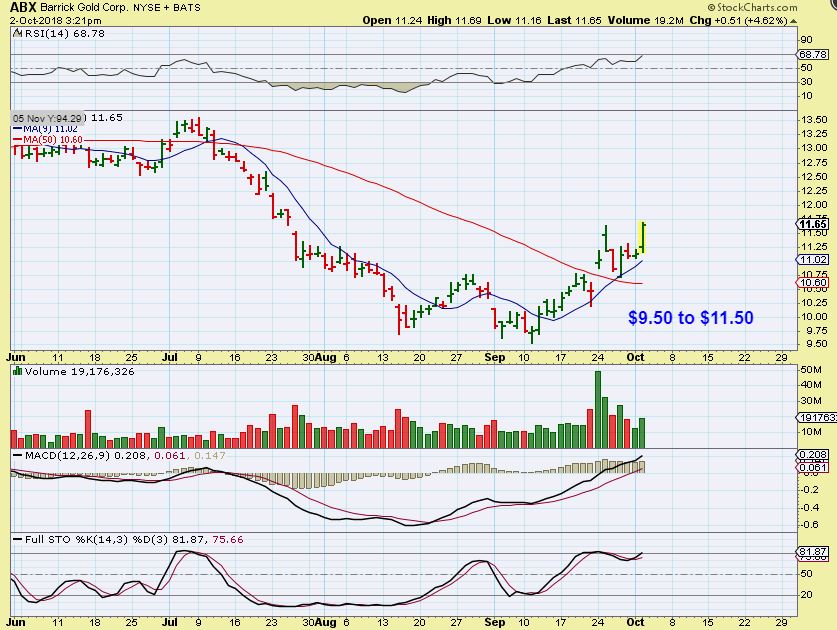
Miners are trying to come out of their lows, so some set ups are forming there, and others that were leading the way higher are now following thorough, like ABX, SBGL, etc. So I will point out a few charts here and a few others at the end of the report.
.
LOOK AT THE DIFFERENT MINERS SET UPS :
.
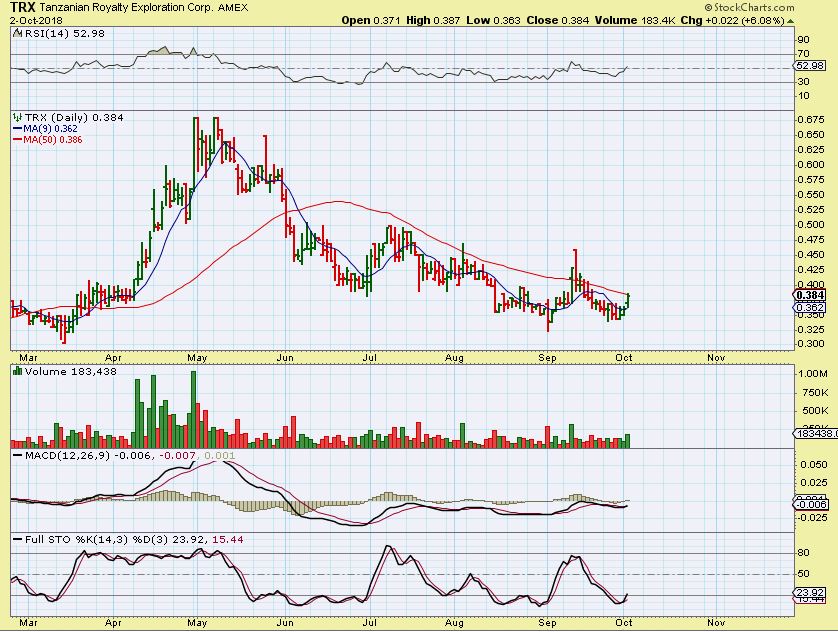
TRX – Many Miners are still near lows, and like TRX, they are now starting to move higher. This is pushing the 50sma, and the 50 has repeatedly stopped it over the past 4 months. Therefore, a break above is BULLISH. Some like AG, HL, EXK, VGZ, are also doing this while…
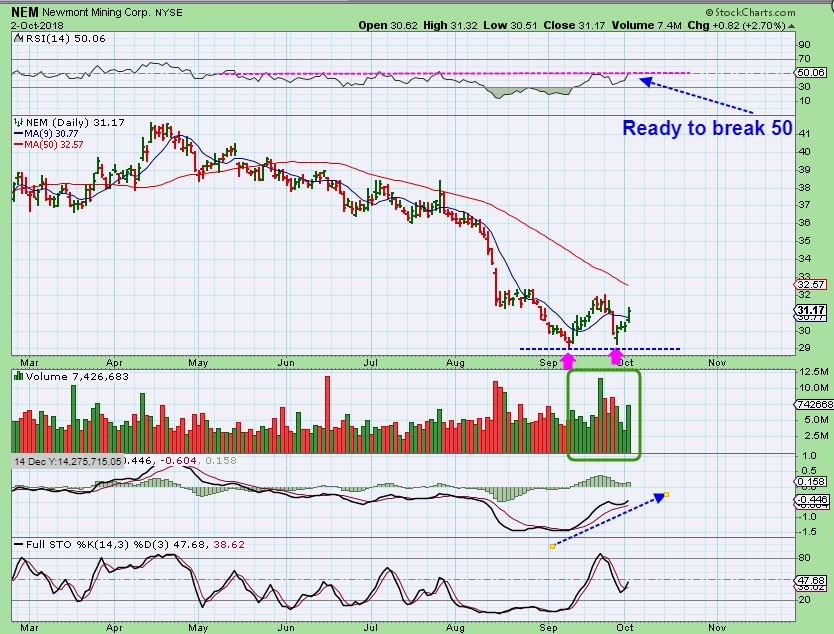
Others like NEM & GG have double bottom lows and look ready to move higher too, with volume surges becoming evident. These can be bought with stops under the ‘double bottom lows’.
.
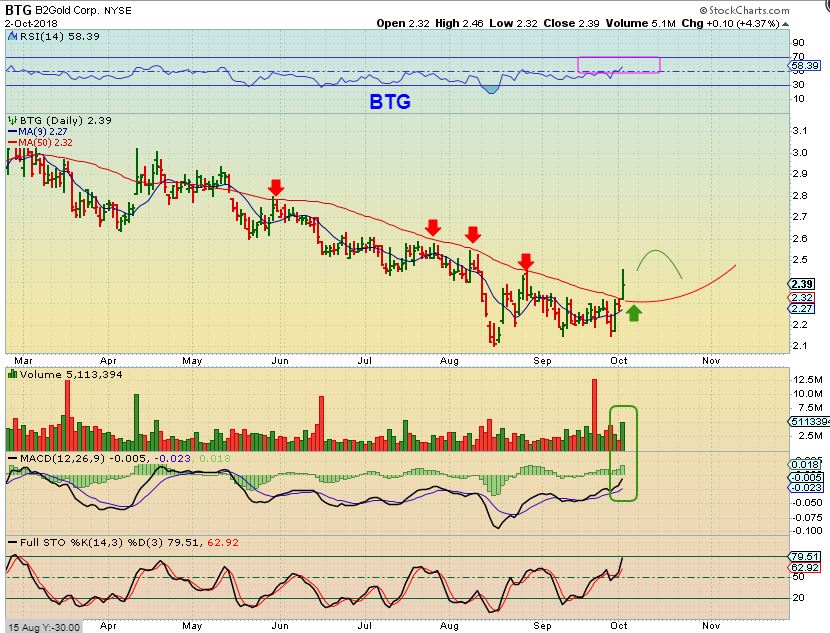
BTG – BTG has broken above the 50sma, and it could be bought here on the break out, or it may back test for a ‘buying opportunity’ also . Notice how that occurred with…
.
ABX – It broke the 50sma and quickly back tested it and continued higher. WE MAY SEE THIS KIND OF BULLISH ACTION IN OTHER MINERS GOING FORWARD.
.
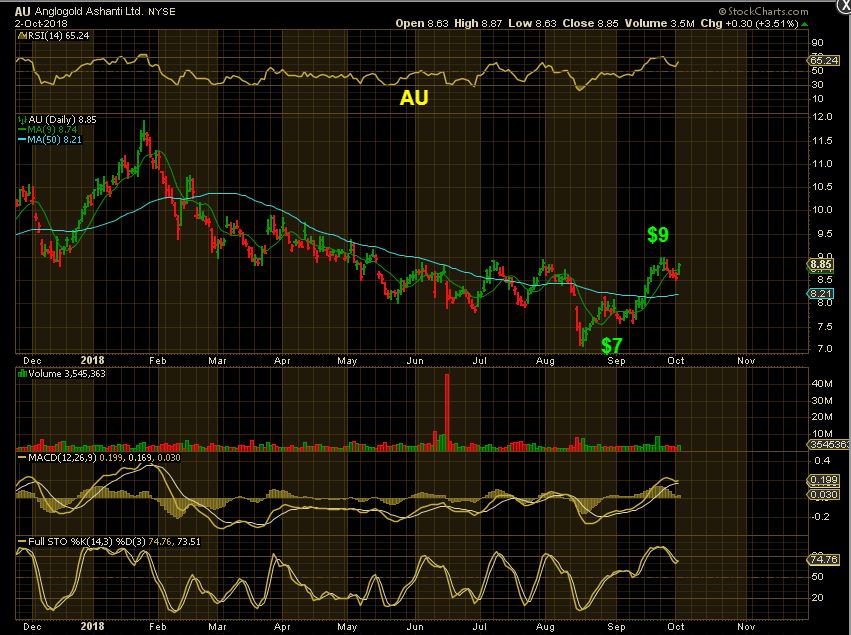
AU _ Another leader that is showing us what we can possibly expect in some of these Miners. It is Encouraging…
1. A run to the 50sma, and then a pause –
2 A break through of that 50sma –
3. A small pause or back test to the 50. AU has moved from $7 to $9 and should continue higher
.
Enjoy your Wednesday trading!
.
~ALEX
.
TRADING FOLLOW UP & NEW IDEAS
.
TRXC – Back in August and September, I was recommending TRXC as a longer term buy & hold. I have now had a couple of people tell me that they are still holding it. It is a bit of a slow steady gainer, so Lets take a look.
Here I recommended it after a shake out near $5. I also said you could add on a break of the down trend line.
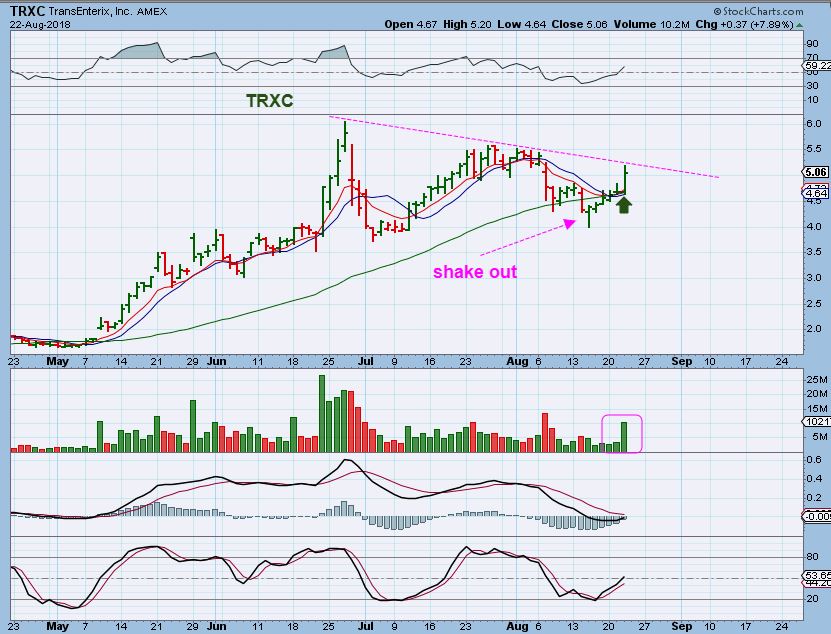
TRXC – I posted the break out buy too
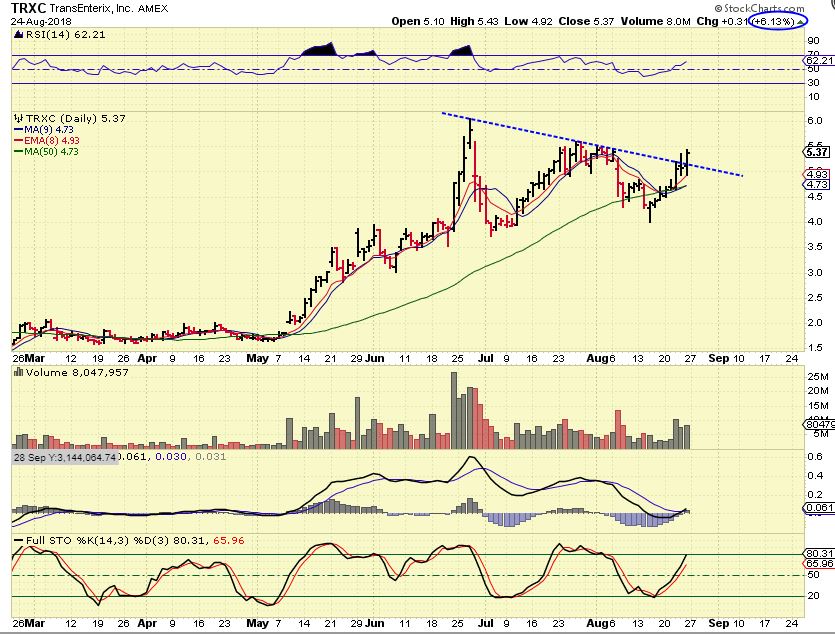
TRXC NOW- It broke from that $5 shake out an ran to $7, and has now back tested the 50 sma. This is another entry if one wanted to buy or increase their position, since we see that it is acting correctly.
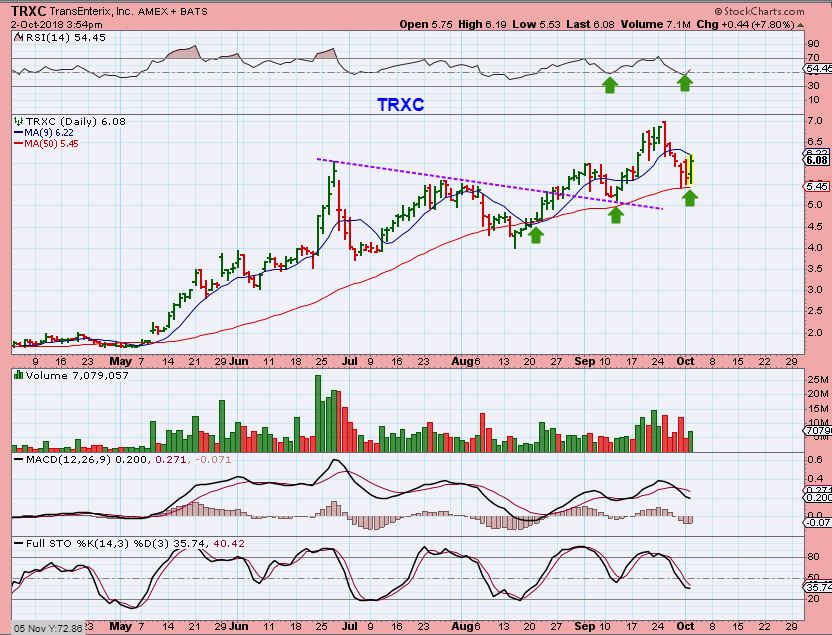
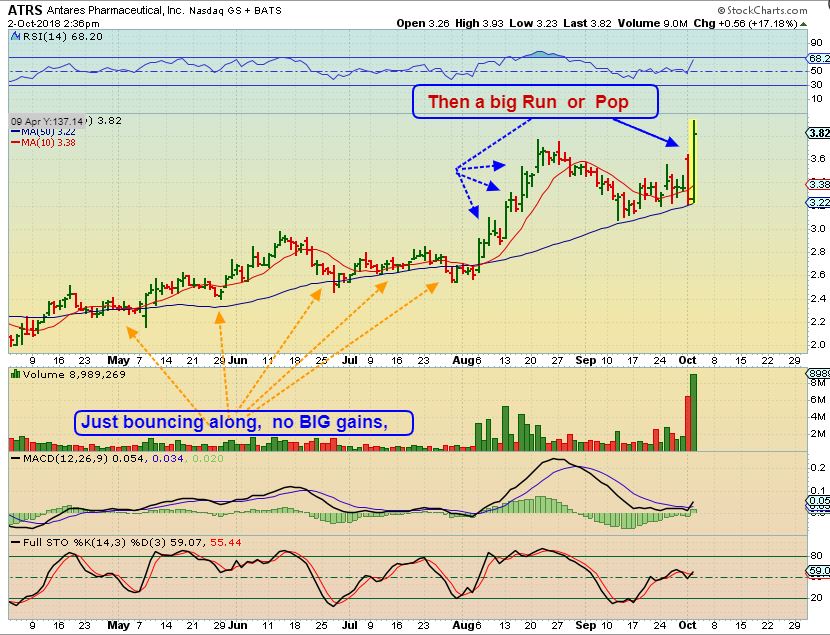
TRXC is basically slowly climbing or bouncing up along the 50sma, so I wanted to point out that often when this steady rise on the 50 occurs, Good news can ( like with ATRS) speed up the climb. By the way, ATRS looks really good here too, after steadily climbing that 50sma, and its under $4. If it pulls back a bit, an entry will be a low risk buy point .
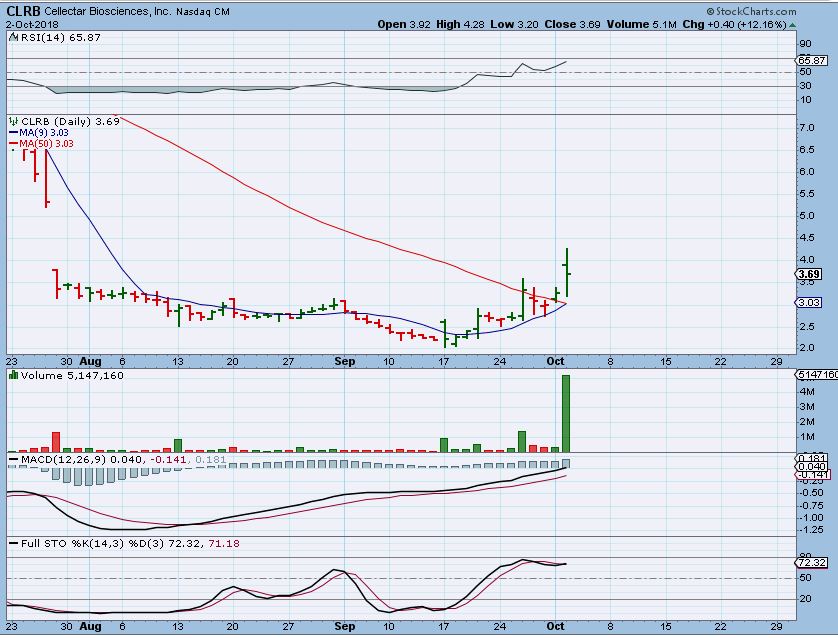
CLRB was ‘Pinched’ between the 10sma and 50sma. – I mentioned that I owned it
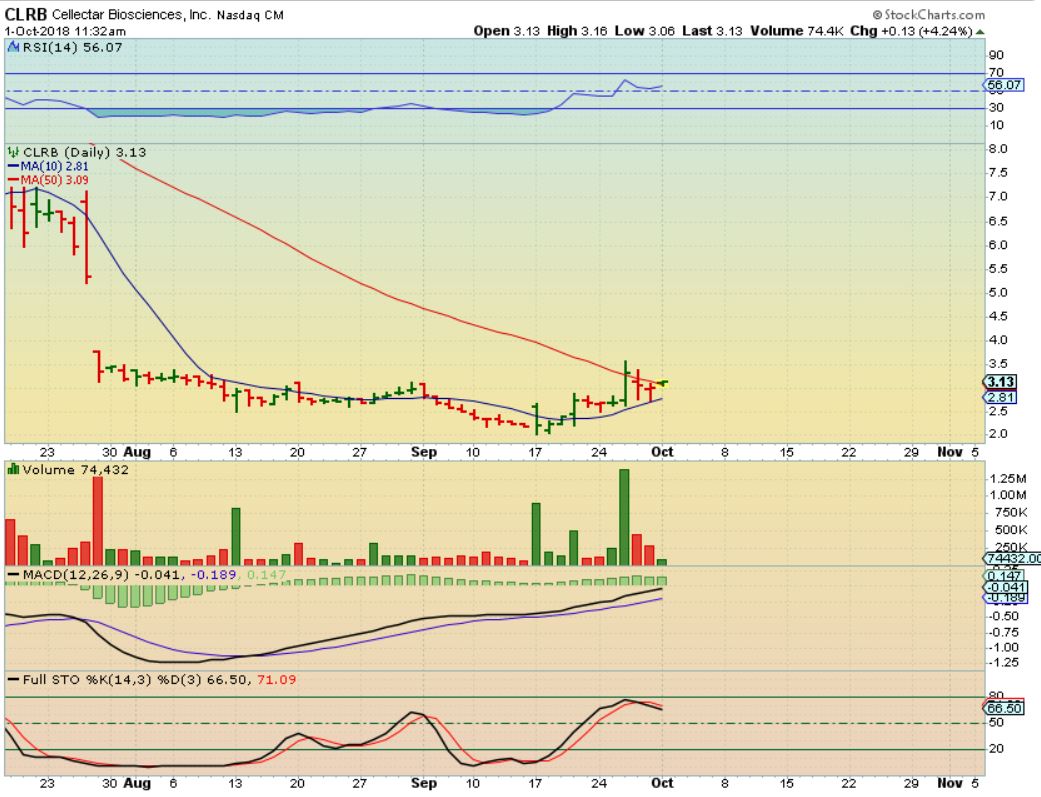
CLRB – It gapped open big with news on Cancer treatment success. It did start to sell off intraday, and I actually sold a small portion on the gap open, and bought back near the gap fill. It ran higher into the close and we’ll see if we can get some follow through rather than a dip back to the 50sma. I’m back to my full position.
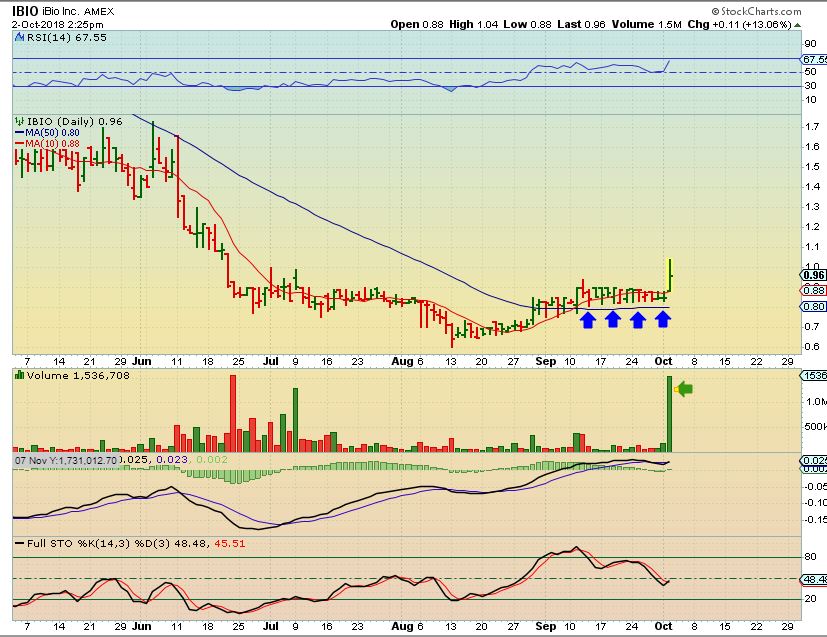
IBIO – This held support at the 50sma very very well. It Popped Tuesday. I feel that this will eventually run higher, and a good stop is under the 50sma.
MNGA – In Yesterdays report I mentioned MNGA at 19 cents with a strong pop, pushing the 50sma area & doing so with strong volume. THAT was a 23% move, and it was the 3rd strong day higher. ( I have found a few stock charts that look like this set up, but may not quite be ready yet. They are Biotech though, MNGA is clean energy)
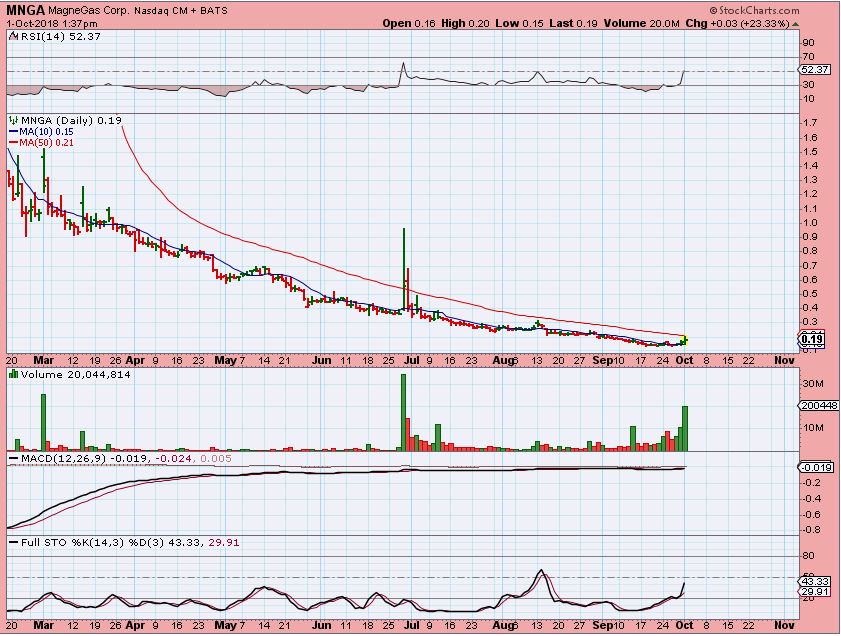
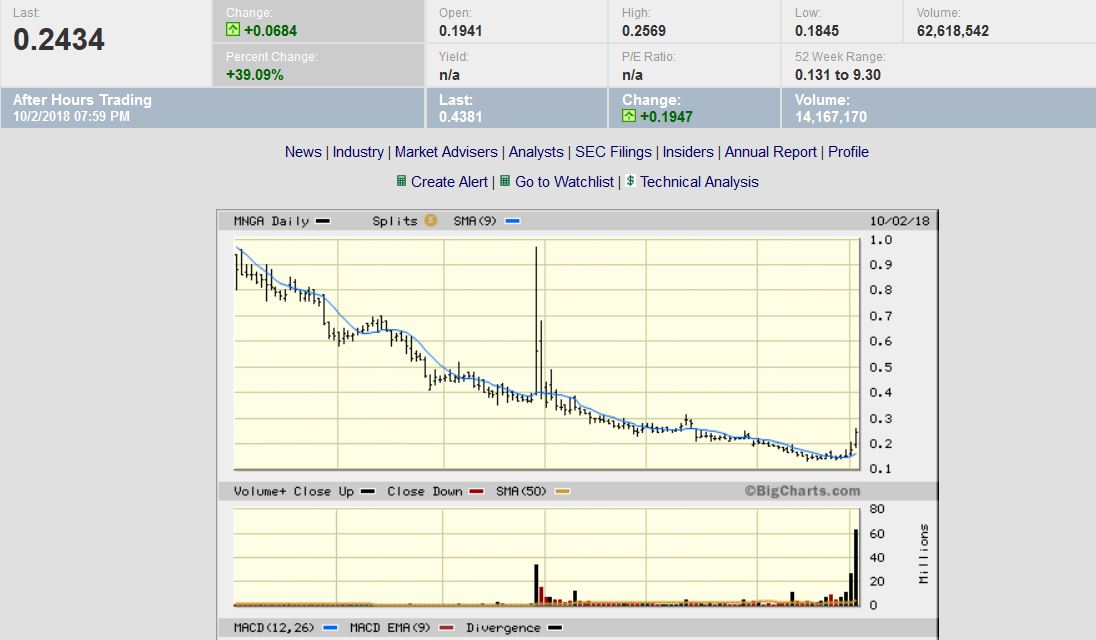
MNGA – Day 4 was even bigger, up another 40% AND….look at the after hrs price in Green . This is up about another 100% in after hrs. Some of these Tight steady bases are explosive.
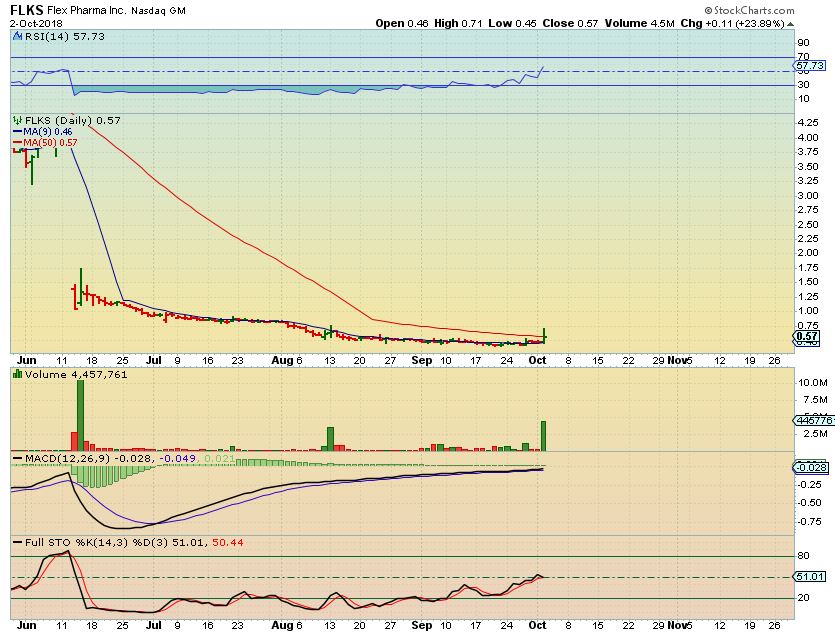
FLKS – This is an idea of one of the Biotech stocks that looks a lot like the chart (base and pop) in MNGA. A long tight base with large POPS. I have several that I am keeping an eye on for improvement. These often POP & RUN. Let’s zoom in a bit…

FLKS – This was a 24% Pop yesterday to the 50sma, and it looks like over time this could move a lot higher. The POP was a LOT higher before pulling back too.
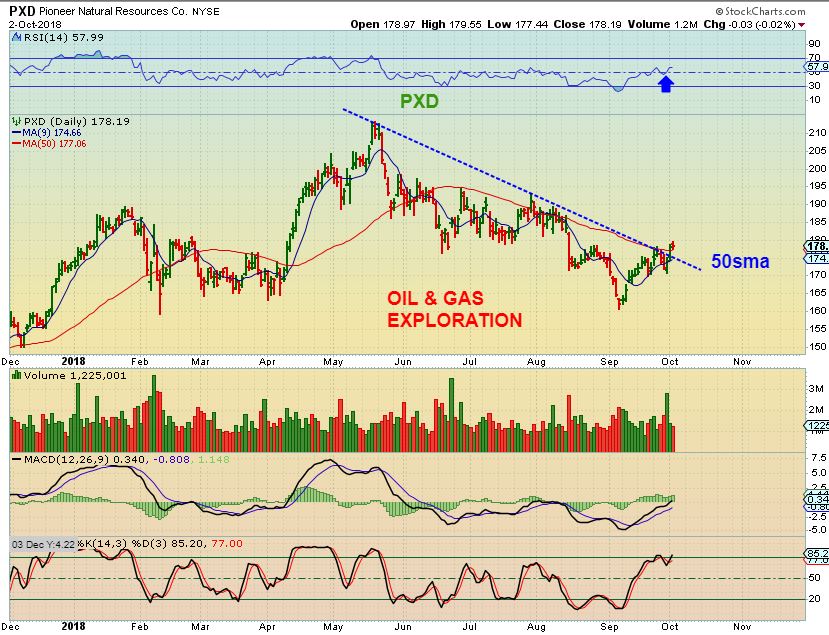
PXD – With both OIL & NATGAS rising, this stock looks ready to move higher as it tries to break above the 50sma ( I have been watching CRK too, it looks the same as PXD). These are buys near support.
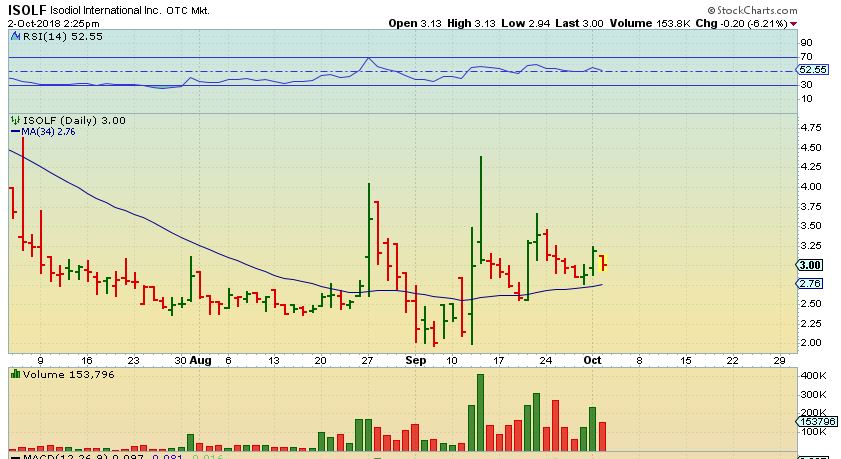
ISOLF – a $3 stock selling down 20 cents can seem ugly, but this chart is totally normal. It Can drop to the 34 sma again. I am still in it, I like this potential , as mentioned in several of the past reports.
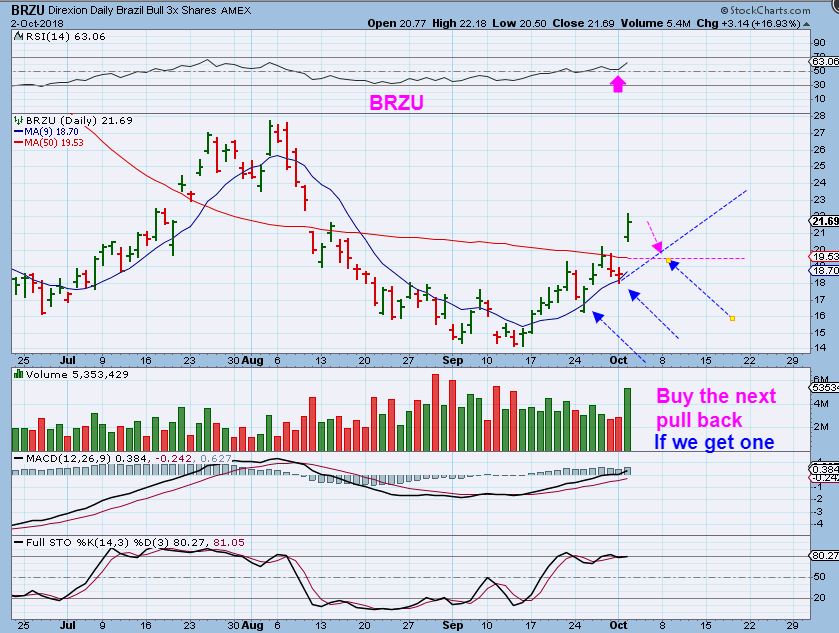
BRZU – Brazil keeps popping, and then drifting back down to the 10sma. You could watch for an entry this way (Watch list). This is a 3x ETF and has moved from $14 to $22 in a short time.It could drop to $20.
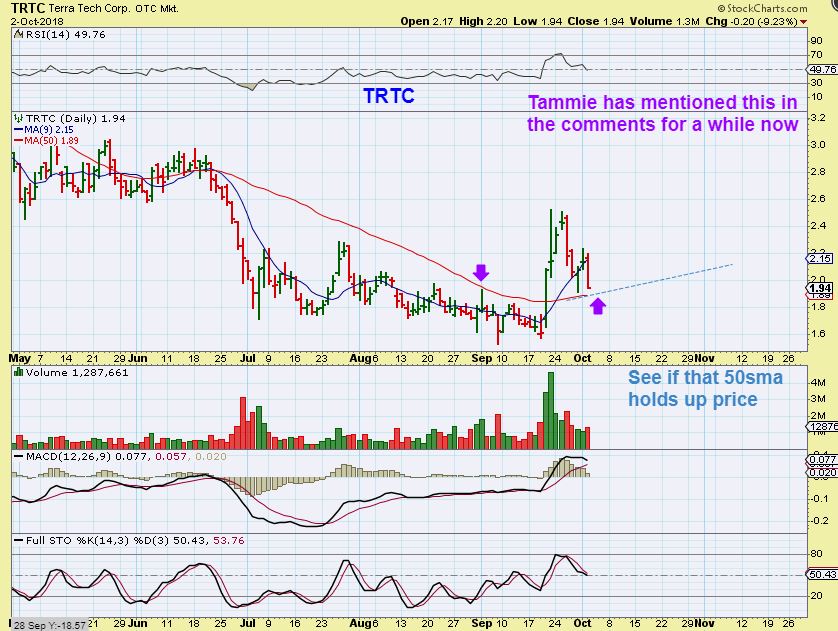
TRTC – MJ STOCK to keep an eye on as it drops back to a possible support area.
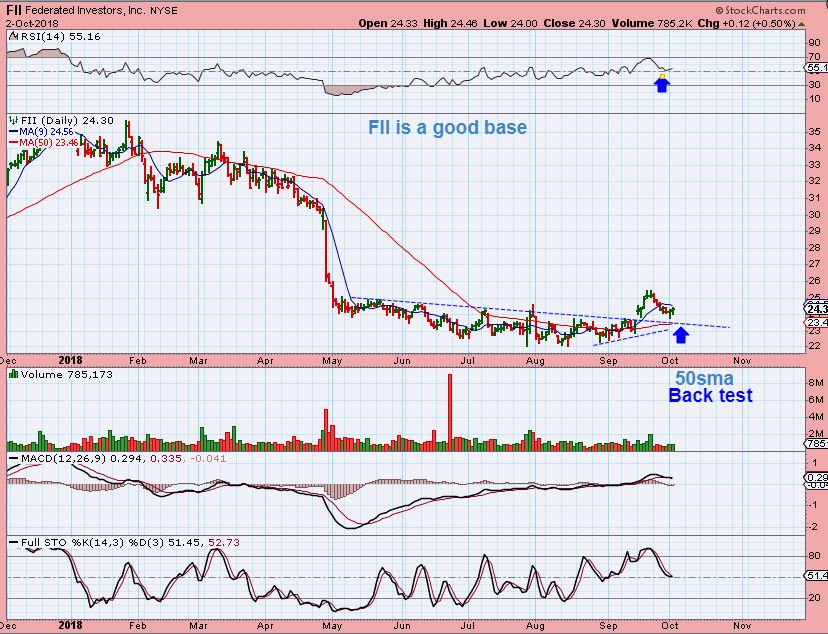
FII – This is a nice break out from a long healthy looking base too, and it is back testing. It becomes low risk if you buy & use a stop. It ran $22 to $25 and has pretty good potential.
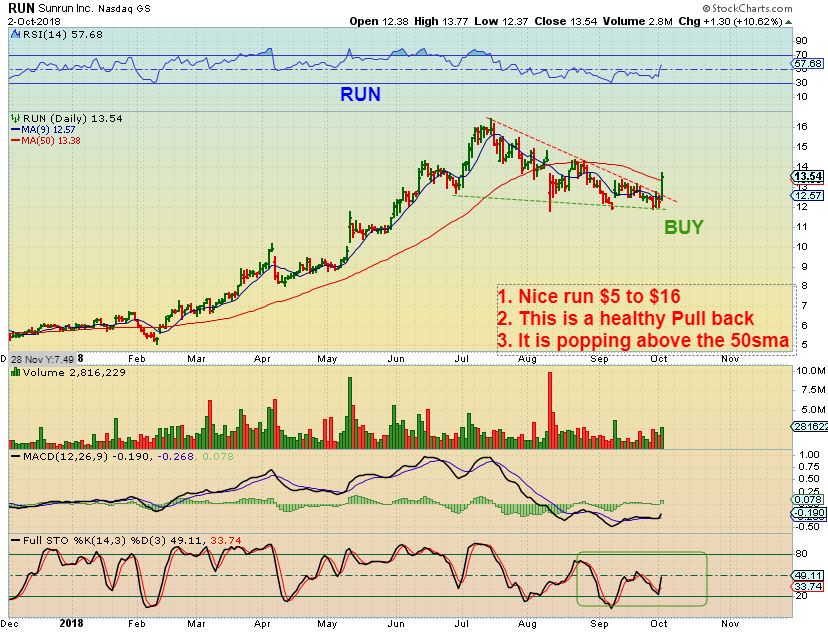
RUN – This is a healthy looking chart and is trying to break out and run again. It had a very nice run in 2018, so that build confidence that it can run again after this consolidation.